Article

Trends in Phenolic Profiles of Achillea millefolium from Different Geographical Gradients

1
Laboratory of Economic Botany, Nature Research Centre, Akademijos Str. 2, 08412 Vilnius, Lithuania
2
Department of Pharmacognosy, Lithuanian University of Health Sciences, Sukileliu Av. 13, 50162 Kaunas, Lithuania
3
Laboratory of Biopharmaceutical Research, Institute of Pharmaceutical Technologies, Lithuanian University of Health Sciences, Sukileliu Av. 13, 50162 Kaunas, Lithuania
4
Vocational High School of Bafra, Ondokuz Mayis University, Samsun 55200, Turkey
5
Department of Field Crops, Faculty of Agriculture and Natural Sciences, Recep Tayyip Erdoğan University, Rize 53100, Turkey
6
Department of Biology, Faculty of Arts and Sciences, Gaziantep University, Gaziantep 27310, Turkey
7
Department of Analytical and Toxicological Chemistry, Lithuanian University of Health Sciences, Sukileliu Av. 13, 50162 Kaunas, Lithuania
*
Author to whom correspondence should be addressed.
Plants 2023, 12(4), 746; https://doi.org/10.3390/plants12040746
Submission received: 19 January 2023 / Revised: 3 February 2023 / Accepted: 5 February 2023 / Published: 7 February 2023
(This article belongs to the Special Issue Natural Resources of Berry and Medicinal Plants Volume II)

Abstract

:
The traditional widely used raw material of Achillea millefolium is currently mainly derived from wild populations, leading to diversification and uncertainty in its quality. The aim of the study was to determine the accumulation differences of phenolic compounds between geographically distant populations of Achillea millefolium from northern and southern gradients. Plant material was collected from Gaziantep and Nevşehir provinces in Turkey and from wild populations in Lithuania. A complex of nine hydroxycinnamic acids and eleven flavonoids was identified and quantified in the methanolic extracts of inflorescences, leaves, and stems using the HPLC-PDA method. Caffeoylquinic acids predominated in leaves, while inflorescences tended to prevail in flavonoids. The PCA score plot model represented the quantitative distribution pattern of phenolic compounds along a geographical gradient of populations. The content of phenolic compounds in plant materials from northern latitudes was more than twice that of plants from southern latitudes. A significant correlation of individual phenolic compounds with latitude/longitude corresponded to their differences between two countries. Differences in accumulation of caffeoylquinic acids and flavonoids revealed several intraspecific groups within A. millefolium. Our findings suggest that spatial geographical data on the distribution of phenolic compounds in A. millefolium populations could be used as a tool to find potential collection sites for high-quality raw materials.

1. Introduction

Achillea millefolium L. s.l., commonly known as yarrow or milfoil, is a heterogeneous group of closely related taxa of perennial herbs widely distributed throughout the temperate and boreal zones of the Northern Hemisphere [1,2]. Achillea millefolium is common in central and northern Europe and sparsely found in southern Europe [3]. In this regard, Turkey is the largest area of Achillea species, with 69 species identified that have adapted to a wide variety of habitats from desert and mountains to coastal regions [4]. In the identification of individual yarrow species, it is important for both collectors and processors to be aware of the potential quality of the raw material. Moreover, chemical profiling of specialized metabolites in plants is the basis for further chemophenetic studies. Yarrow is one of the oldest medicinal plants and has been used in folk medicine for thousands of years; its pollen was found in a 65,000-year-old of Homo neanderthalensis tomb in the Shanidar cave in Iraq [5]. Yarrow raw material (Millefolii herba) is included in the European Pharmacopoeia and described by the European Medicines Agency as a traditional drug [6]. The therapeutic indications of A. millefolium have been well documented in numerous clinical studies. Achillea millefolium extracts have strong anti-inflammatory, anti-arthritic [7], antifungal [8], antispasmodic [9], antibacterial [10], hypotensive, cardiovascular, bronchodilator [11], and analgesic [12] effects. A wide variety of specialized metabolites of A. millefolium are considered to be responsible for the curative properties and therapeutic applications of plant extracts [13,14]. Pharmacological efficiency in yarrow is mostly attributed to phenolic compounds and essential oils, the most important of which are caffeoylquinic acids, flavonoids, and sesquiterpene lactones, which contribute to the main multifunctional biological activity [15,16,17]. Different polyphenolics have been identified, including hydroxycinnamic and hydroxybenzoic acids [18,19,20,21,22,23], along with different flavonoids [19,21,22,23,24].
Achillea millefolium raw material is mainly derived from wild populations, which leads to the diversity and uncertainty of raw material specification requirements. The variety of plant material quality is considered to be a consequence of environmental effects, reflecting the synthesis of specialized metabolites and plant adaptation to local conditions [25]. However, it is difficult to identify one or a few environmental factors that regulate the synthesis of chemical compounds in plants. In this regard, geographical gradients represent a broad range of environments, especially along latitudes from north to south. Over altitude and latitudinal–longitudinal gradients, multiple environmental factors, including total solar and UV-B radiation, temperature, precipitation, nitrogen availability, aridity indices, soil fertility and acidity, exposure, and even land-use history, varied substantially [26]. Consequently, geographical gradients can be treated as factors generating environmental effects and are expected to influence specialized metabolism in plants. The intraspecific diversity of phenolic compounds accumulation in individual species along their geographical gradients is poorly known. In this context, we hypothesized that geographical gradients have a significant influence on the accumulation of phenolic compounds in wild populations of A. millefolium and can be used as a tool to identify high-quality raw material harvesting sites. The study aimed to establish the accumulation trends of phenolic compounds between geographically distant populations of A. millefolium in Turkey and Lithuania and to evaluate their differences in plant organs. To the best of our knowledge, there are no available data on differences in the accumulation of phenolic compounds in plant organs of A. millefolium depending on the geographical gradient of the population site. The presented study has the potential for planning the targeted use of plant materials and managing the overexploitation of plant resources.

2. Results

2.1. Phenolic Profiles of Inflorescences, Leaves, and Stems in Turkish and Lithuanian Populations

A total of nine phenolic acids and eleven flavonoids complexes were identified and quantified in terms of the phenolic profiles of inflorescences, leaves, and stems of A. millefolium. Significant differences in the accumulation of individual phenolic compounds were found in leaves, inflorescences, and stems from Turkish and Lithuanian populations (Table 1). Chlorogenic acid and 3,5-O-dicaffeoylquinic acid were predominant in all plant organs and populations, with the highest content in leaves, followed by inflorescences and stems. 1,5-O-dicaffeoylquinic acid was one of the main phenolics in leaves, inflorescences, and stems of Lithuanian A. millefolium. Meanwhile, in Turkish populations, 1,5-O-dicaffeoylquinic was detected in small amounts only in leaves and stems, while inflorescences did not accumulate this compound. Another phenolic compound with noteworthy amounts in both leaves and inflorescences from both locations was 3,4-O-dicaffeoylquinic acid. Small amounts of caffeic acid were detected in all plant organs in populations from both countries, while 1,3-O-dicaffeoylquinic acid was found only in leaves and stems of Lithuanian populations. Meanwhile, the content of 4-O-caffeoylquinic acid did not differ between plant organs for all populations, but the leaves of Turkish populations accumulated significantly higher amounts of this compound than in Lithuania.
Meanwhile, inflorescences of A. millefolium accumulated the highest amount of flavonoids, followed by leaves and stems. Among the flavonoids, flavones luteolin, apigenin, and their derivatives dominated in inflorescences. Luteolin-3,7-O-diglucoside was detected only in inflorescences and leaves of Turkish populations and has not been found at all in Lithuanian populations. The identified flavonol complex in A. millefolium was represented by quercetin and its derivatives, namely quercitrin, rutin, isoquercitrin, and methylated flavonol santin. A high level of rutin was detected in leaves, followed by stems and inflorescences. Santin was found in all plant organs, with the highest content in inflorescences. Meanwhile, quercetin and quercitrin were presented in minor amounts and did not expose significant differences between plant organs. The small amount of isoquercitrin differed significantly between plant organs and populations, with the highest amount found in inflorescences of Turkish populations, but not detected in their stems. Small amounts of phenolics were found in the stems of all populations, with more notable levels of chlorogenic acid and rutin in populations from both countries. Overall, the accumulation pattern of caffeoylquinic acids and flavonoids in A. millefolium populations showed significant quantitative differences between plant organs for most individual compounds, except for 4-O-caffeoylquinic acid, quercitrin, and quercetin, whose amounts did not differ significantly.
Comparison of the phenolic profiles of A. millefolium populations between the two countries revealed qualitative differences in the accumulation of 1,3-O-dicaffeoylquinic acid, quercitrin, and luteolin 3,7-O-diglucoside. 1,3-O-dicaffeoylquinic acid and quercitrin were detected only in populations from Lithuania, while luteolin 3,7-O-diglucoside was found in plants from Turkey. All other compounds were found in A. millefolium populations from both countries with significant quantitative differences in all plant organs, except for rutin, the amount of which did not differ significantly between countries for all plant organs (Table 1). Furthermore, amounts of individual phenolic acids highly positively correlated with latitude/longitude, with the exception of 1,3-O-caffeoylquinic and 4-O-caffeoylquinic acids. The correlations between individual flavonoids and latitude/longitude were variable. A positive correlation of apigenin-7-O-glucoside with latitude/longitude was found for all plant organs, while the amounts of isoquercitrin, luteolin-O-3,7-diglucoside, and santin in inflorescences and quercetin in leaves and stems showed a negative correlation with geographical gradients (Table S1).
Furthermore, the Turkish populations originated from Southeastern and Central Anatolia geographical regions. The sites of populations in the Central Region were at a higher latitude and elevation than sites from Southeast Anatolia Region. Significant differences between the two Anatolian regions were found in the levels of 3,5-O-dicaffeoylquinic acid in inflorescences and stems, luteolin and luteolin-7-O-glucoside in inflorescences, santin in leaves, and 3,4-O- and 4,5-O-dicaffeoylquinic acids and luteolin-7-O-glucoside in stems. On the other hand, no significant correlation was found between the total phenolics content and site elevation (Table S2). Nevertheless, the observed differences in compounds’ accumulation between the two regions did not reveal a reasonable dependence along latitude/longitude gradients. In general, the significant correlation of individual phenolic compounds with latitude and longitude corresponded to their significant differences between two countries.

2.2. Total Phenolic Acids and Flavonoids from Two Locations

Differences in the accumulation of phenolic compounds in plant organs between the two geographical areas were more evident when all compounds were grouped into caffeoylquinic acids and flavonoids and presented as total relative values to total phenolics. In this way, leaves were significantly dominated by caffeoylquinic acids, accounting for an average of 79.9 and 88.2% of the total phenolics in the Turkish and Lithuanian populations, respectively, followed by stems (69.0 and 84.4%, respectively) (Table 2). Meanwhile, the values of phenolic acid and flavonoids did not differ significantly in inflorescences of Turkish populations. On the other hand, phenolic acids significantly prevailed in the inflorescences of Lithuanian populations, compared with flavonoids (Table 3). Moreover, the mean ratio of total flavonoids in all plant organs was significantly higher in southern populations than in northern populations, while phenolc acids increased significantly at higher latitudes. Mean values of total phenolic acids differed significantly between countries, while flavonoids showed differences only in leaves. Overall, the Lithuanian populations accumulated a higher total content of identified phenolic compounds in all plant organs, compared with the Turkish populations.

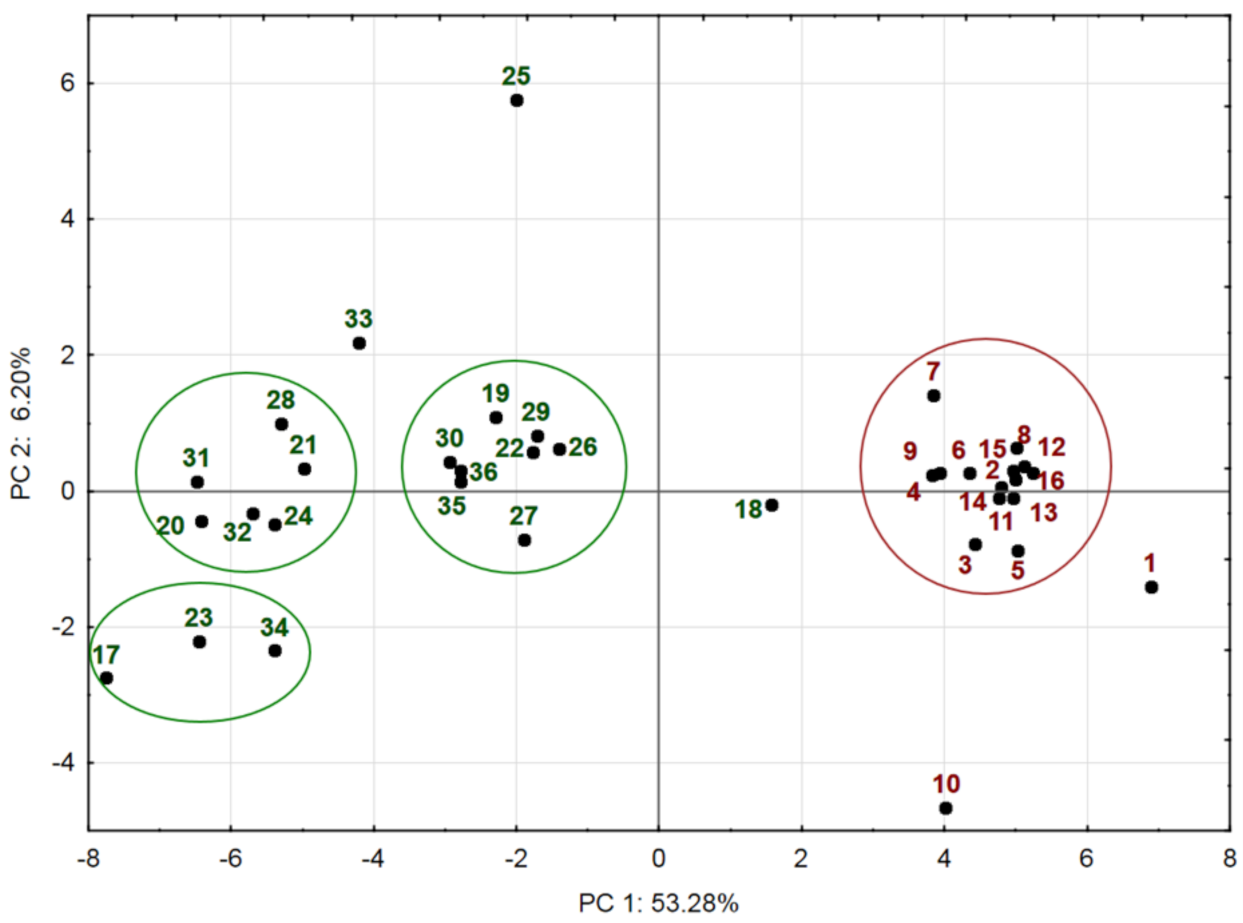
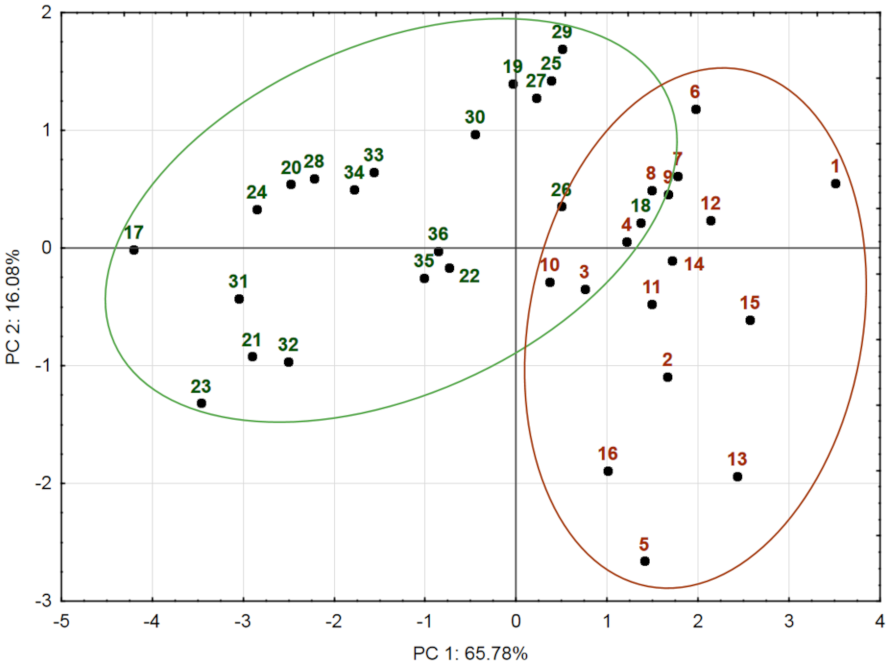
2.3. Chemical Variation of Populations: Principal Component Analysis (PCA)

A two-dimensional PCA1 score plot model explaining 59.50% of the total variance of the dataset was applied to visualize the similarities and differences among the studied populations using selected phenolics as statistically independent variables (Figure 1).
The PCA1 results based on eigenvalues correlation matrix with PC1 and PC2 (21.84 and 2.54, respectively) are presented in Table 4. PC1 explained 53.3% of the total variance of the dataset and showed strong negative correlations with caffeoylquinic and caffeic acids in all plant organs and variable correlations with selected flavonoids (Table 4). PC2 accounted for only 6.2% of the total variance and was positively correlated with caffeic acid in leaves and negatively with luteolin-7-O-glucoside in inflorescences and santin in stems.
PCA1 score plot pattern showed the arrangement of all populations into two groups scattered on opposite sides of the square plots. The group located on the right-hand score plot along the positive PC1, close to the zero point, clustered most of the Turkish populations, which accumulated from the lowest to average amounts of compounds within their range of variations. Variables with high positive loadings on PC1 that had the highest impact on the grouping of the Turkish populations were luteolin-O-3,7-diglucoside, isoquercitrin, and santin in inflorescences and 4-O-caffeoylquinic acid and quercetin in leaves and quercetin in stems. The variables showed a weak correlation with PC2 and, consequently, a weak contribution to the arrangement of populations, except for a high correlation with caffeic acid in leaves and santin in stems. The distant location of populations No. 1 and 10 indicated that the amounts of phenolics in their plant materials differed highly from other Turkish populations. The remote position of population No. 1 can be explained by the lowest amount of caffeoylquinic acids in all plant organs and the highest amount of santin and luteolin in inflorescences. The distant position of population No. 10 was due to the highest amount of luteolin and apigenin glucosides and luteolin-O-7-rutinoside in inflorescences and leaves. However, the PCA model showed no differences in the distribution of populations depending on the elevation of the site, which ranged from 639 to 1287 m.a.s.l.
The group on the left-hand score plot brought all A. millefolium populations from Lithuania, with exception of No. 18. In contrast to the first group previously discussed, the variables with high negative loadings on PC1 had the greatest impact on the distribution of these populations into several clusters. The cluster along the negative PC1 near the zero point combined the populations that accumulated from the lowest to the average amounts of compounds in their range of variation of Lithuanian populations. The arrangement of the second group is associated with high negative loadings of chlorogenic and 3,5-O-dicaffeoylquinic acids and quercitrin in inflorescences and leaves, and of luteolin-7-O-rutinoside in leaves, the amounts of which were the highest in the raw materials of the corresponding populations. The clustering of three populations (No. 17, 23, and 34) coincided with high levels of dicaffeoylquinic acids and luteolin- and apigenin 7-O-glucosides in their inflorescences and leaves. The remote position of population No. 25 is associated with high negative loadings of 4,5-O-dicaffeoylquinic acid in stems and positive caffeic acid in leaves. The position of population No. 18 on the right-hand score plot, next to the cluster of Turkish populations, showed their similarity, which corresponded to the lowest amounts of phenolic compounds in this population compared with other Lithuanian populations.
The PCA2 score plot model explaining 81.83% of the total variance of the dataset was applied to visualize the distribution of populations using the total content of phenolic acids and flavonoids as independent variables (Figure 2).
PC1 explained 65.8% of the total variance of the dataset and showed significant negative correlation with the total content of phenolic acids in all plant parts and significant negative correlations with the total content of flavonoids in leaves and stems. PC2 accounted 16.1% of the total variance and was negatively correlated with the total content of flavonoids in inflorescences (Table 5).
The PCA2 model showed the same tend as in PCA1, with the distribution of populations into distinct groups according to the country of their origin. On the other hand, the scores clustered less tightly on the PC plot, displaying greater variation than in the PCA1 model. The overlap position of some populations indicated their similarity. The overlap position of No. 18 with Turkish populations can be explained by the lowest amount of total phenolic acids compared with other Lithuanian populations. The position of population No. 26 on the right-hand score plot, next to the cluster of Turkish populations, is associated with the similarity of their total flavonoid content.
Consequently, PCA was used to summarize the results of intraspecific diversity of the studied A. millefolium populations from different geographical areas. The PCA score plot models represented the distribution of populations along geographical gradients. Intraspecific variability of A. millefolium based on the accumulation of phenolic compounds is considerably related to the environment of the growing site of the population.

3. Discussion

Chemical diversity of specialized metabolites is a rather common occurrence in vascular plants, induced by different exogenous and endogenous environmental factors. Over time, species adapt to the local environment through micro-evolutionary differentiation of populations, leading to the formation of new metabolome patterns expressed as intraspecific diversity [27,28]. Studies have shown that geographical gradients affect the synthesis of specialized metabolism, which determine the active adaptation of plant species to the environment at higher altitudes and latitudes [29,30]. The main factor associated with differences in phenolic compounds at high altitudes and high latitudes is the response to low temperatures or increased UV-B radiation, which generally induces photo-oxidative stress [31,32] and promotes the synthesis of phenolic compounds [33]. However, previous studies on different plant species have shown the variable effects of environmental gradients on phenolic metabolic pathways [34,35]. The opposite trend of accumulation of phenolic compounds, depending on the elevation, was found in Vaccinium myrtillus L. both for groups of compounds and for part of plants [36,37]. Nataraj et al. [38] reported that the concentration of phenolic compounds decreased in the leaves of Artemisia brevifolia Wall ex DC. with increased elevation. In our study, elevation was an insignificant environmental element at northern latitudes and was not applicable as a comparative factor between the two geographical areas. At the same time, phenolic compound accumulation and the elevation differences between the two Anatolian regions did not show a clearer trend to explain the differences in the accumulation of phenolic compounds between populations.
Large-scale latitudinal gradient studies have been explored on a limited number of different species, yielding controversial results. A positive correlation between flavone content and latitude was estimated for Rutelia species across large-scale latitudinal gradients [39]. Latitudinal and regional variations of flavonoid concentrations from south to north in Finnish Betula pubescens Ehrh. populations showed compound-specific latitudinal gradients associated with an increase in photoprotective quercetin and a decrease in apigenin derivatives towards low temperature areas in the north [40]. A strong positive effect of latitude was found on soluble phenolic and flavonol levels in Vaccinium myritillus leaves [36]. Meanwhile, a negative correlation between latitude and flavonoid accumulation was found in V. myritillus fruits [41] and Juniperus communis L. leaves [29]. It should be noted that the above studies were conducted in Finland, where northern latitudes and higher altitudes corresponded to subarctic growing conditions where plants were exposed to low average temperatures and high irradiance. Thus, our study contributes to the understanding of the increased accumulation of phenolic compounds at higher latitudes, excluding the effect of altitude as an insignificant factor in the studied northern areas. Furthermore, we observed opposite trends in the accumulation of caffeoylquinic acids and flavonoids along geographical gradients, when the relative value of phenolic acids increased in northern latitudes and flavonoids decreased compared with southern latitudes, and vice versa. Consequently, it can be assumed that the low temperature in northern latitudes has a greater importance for the accumulation of phenolic acids than for flavonoids. On the other hand, the trend of increasing total flavonoid content in southern latitudes can be explain by increased UV-B radiation at higher elevations compared with northern, suggesting a greater contribution of flavonoids to radical scavenging potential. In this regard, our findings are partially explained by previous studies showing the promotion of flavonoid synthesis at a high altitude due to increased UV-B radiation and oxidative stress [37].
According to Moore et al. [42], chemical changes should be sought where plants occupy new habitats and where climate and other factors have altered the biotic and abiotic environment. On the other hand, the response of organisms to environmental differences is often under genetic control [31]. Based on the presented data, it can be assumed that the intraspecific chemical diversity of A. millefolium populations from the same geographical location potentially reflected genetic differences in the exposure of the surrounding environment. Molecular studies of genotypes are the most appropriate reliable tool to explain the intraspecific chemical variability and available taxonomic differences, but the use of phytochemical studies can provide insight into further application of populations [43].
Complexes of caffeoylquinic acids and luteolin derivatives are the key components in the fingerprinting of all A. millefolium samples tested. Caffeoylquinic acids have recently attracted much attention owing to their numerous technological, biological, and pharmacological implications [17]. Furthermore, studies have supported the antibacterial and antiviral effects of caffeoylquinic acids [17,44]. In the context of the COVID-19 pandemic, luteolin and its derivatives, owing to anti-neuroinflammatory mechanisms, may be used to manage the post-COVID-virus condition. In its aglycone form, the flavone luteolin can penetrate into the brain and exert an anti-inflammatory effect on the target cells [45,46]. Achillea millefolium raw materials, with their specific profile, gain perspective as a matrix with hepatoprotective, neuroprotective, and cardioprotective activities mainly expressed by anti-inflammatory and antioxidant mechanisms [17,46,47]. Ali et al. [48] elucidated the mechanisms of the above activities with luteolin and chlorogenic acid as key contributors. Reproductive biological activity should be investigated by combining phytochemical and bioactivity markers and determining the phytogeographical and genotypic profiles of plant matrices.
The distribution of phenolic compounds in A. millefolium populations reported from various countries such as Iran [21], Turkey [20,49], Italy [18], Bulgaria [24], Central Europe [50], and Poland [51,52] is difficult to explain by geographical differences in locations. This may be because previous studies were conducted in limited areas and populations or without reference to plant organs, making them difficult to compare. However, in agreement with our results, it was reported that chlorogenic acid, 3,4-O-dicaffeoylquinic, and 3,5-O-dicaffeoylquinic acids, together with the flavonoid aglycones luteolin and apigenin and their glycosides, were the most common and major phenolics in A. millefolium.
According to Zidorn [53], correct taxonomic identification as well as information of geographical location, plant harvesting time, and plant organs, together with other indirect factors, were considered to be crucial in phytochemical studies. On the other hand, the extraction and method of chemical analysis may be factors leading to differences in the chemical composition of plant materials. Consequently, chemical studies of plant materials from different geographical regions using the same methods and the same equipment have many advantages as they reveal a more objective overall picture in the distribution trend of specialized metabolites. Moreover, chemical profiling of specialized metabolites in plants is the basis for further chemophenetic studies.

4. Materials and Methods

4.1. Plant Material, Sampling, and Identification
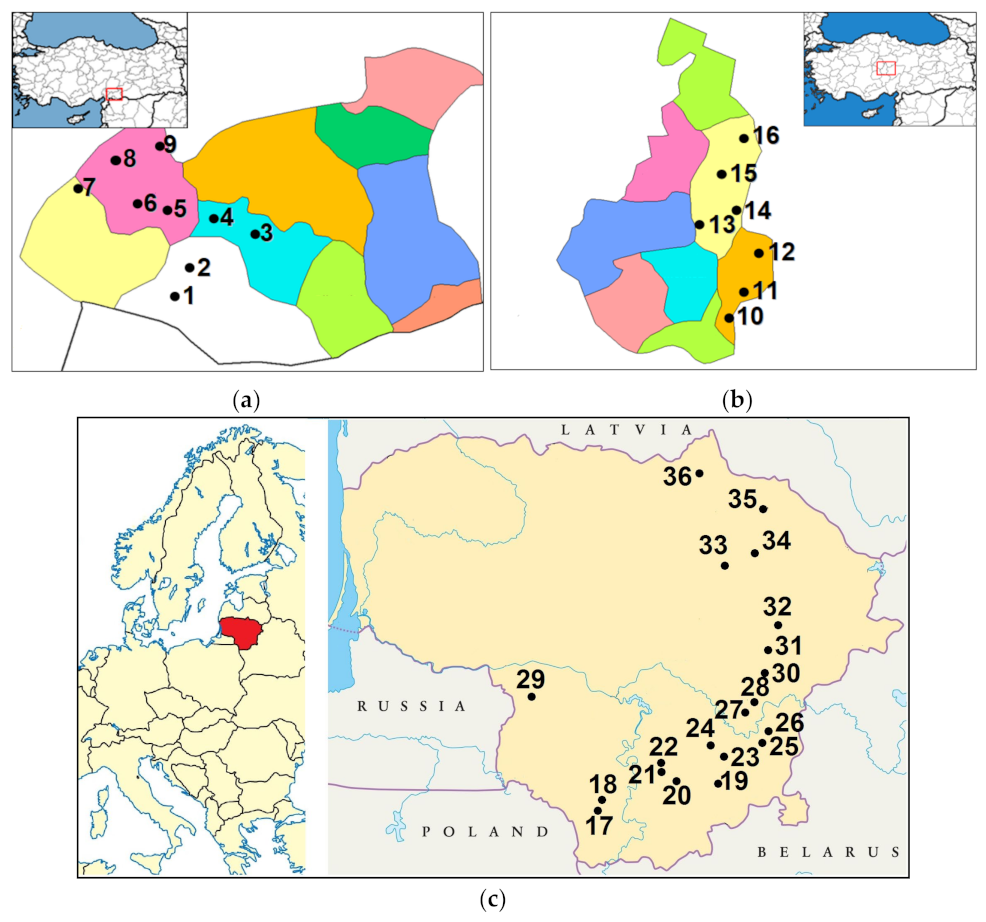
Achillea millefolium aerial plant material, from 16 different populations in Turkey and 20 from Lithuania, was collected during full flowering in June and August of 2019 and 2022. Plant material consisting of 30 single shoots per population was dissected into inflorescences, leaves, and stems and dried separately at room temperature. The botanical identification of species was performed on morphological characters according to descriptors [2,4]. The voucher specimens were deposited in the herbarium of Vocational High School of Bafra, Ondokuz Mayis University and Nature Research Centre, Institute of Botany.

4.2. Sampling Sites

Sampling was carried out in Gaziantep Province in Southeastern Anatolia Region (No. 1–9) and Nevşehir Province in Central Anatolia Region (No. 10–16) and in different districts in Lithuania (No. 17–36) (Figure 3). Data on plant sampling sites are presented in Table 6.
The Gaziantep Province is characterised by a transition between a Mediterranean and continental climate. The winter season is cold and rainy, while the summer is hot and dry. The long-term average temperature is 15.1 °C and the average annual precipitation is 463 mm, most of which falls in winter [54]. Sampling sites were covered between 37.2506–37.2667 °N and 37.1492–37.4663 °E, on calcareous mountain slopes and meadows at an elevation from 639 to 1011 m.a.s.l.
Nevşehir Province has a continental climate (semi-arid) with hot and dry summers and cold and rainy/snowy winters, with an annual rainfall of 415 mm, mainly in spring and winter. The long-term average temperature is 10.73 °C [55]. The sampling sites were located between 38.6167–38.7833 °N and 34 22 12.0–34.8663 °E, at an elevation of 954–1287 m.a.s.l., in open coniferous forest habitats.
Lithuania is situated on the edge of the East European Plain covering 56.27–53.53 °N and 20.56–26.50 °E. The country is in the temperate climate zone, in the subregion of Atlan tic-European continental mixed and broad-leaved forests. The long-term (1991–2020) average temperature is 7.4 °C. The average annual precipitation is 695 mm, most of which falls in summer. The growing season lasts 169 days in the east and 202 days in the west. The country is mostly flat, except for some hilly areas. The highest elevation is 297.84 m.a.s.l. Sampling sites were located between 54.09871–56.24353 °N and 23.72095–25.36114 °E, at elevations of 47–180 m.a.s.l., in dry or mesophytic grassland and pine forest habitats.

4.3. Chemicals

Analytical and HPLC grade solvents and reagents were used for chemical analyses. Acetonitrile (99.9%) and methanol (99.9%)as well as the references as quercetin, quercetin-3-O-glucoside, luteolin-7-O-glucoside, luteolin-7-O-rutinoside, rutin trihydrate, apigenin-7-O-glucoside, santin, 3-O-caffeoylquinic acid, 5-O-caffeoylquinic acid, 4-O-caffeoylquinic acid, 1,3-O-dicaffeoylquinic acid, 3,4-O-dicaffeoylquinic acid, 3,5-O-dicaffeoylquinic acid, 1,5-O-dicaffeoylquinic acid, and 4,5-O-dicaffeoylquinic acid, were obtained from Sigma-Aldrich (Steinheim, Germany); trifluoroacetic acid (≥99%) and apigenin were supplied from Fluka Chemika (Buchs, Switzerland). The purified deionized water (18.2 mΩ/cm) was produced using the Millipore Simpak1 Synergy 185 ultra-pure (Bedford, MA, USA) water system.

4.4. Extraction

The air-dried plant material was mechanically ground with a laboratory mill to obtain a homogenous powder. Samples of approximately 0.1 g (accuracy 0.0001 g) were extracted with 10 mL of 70% methanol at 40 °C for 30 min in an ultra-sonic bath. The extracts were filtered through 0.22 µm nylon syringe filters (Carl Roth GmbH & Co. KG, Karlsruhe, Germany) and stored at 4 °C until analysis.

4.5. Qualitative and Quantitative Analysis

The chemical analysis of plant material for the qualification and quantification of phenolic compounds was performed using a Waters Alliance 2695 mode system coupled with a 2996 PDA photodiode-array detector (Waters, Milford, MA, USA). The phenolic compounds were separated using ACE Super C18 (250 mm × 4.6 mm i.d., 3.0 µm) column (ACT, Aberdeen, UK), maintained at 35 °C. The mobile phase of binary gradient elution at a flow rate of 0.5 mL/min consisted of eluent A (0.1% trifluoroacetic acid in pure water) and eluent B (100% acetonitrile). The elution program was as follows: 0–40 min—10–30% B, 40–60 min—30–70% B, 60–64 min—70–90% B, and 64–70 min—90–10% B. The injection volume of the extract was 10 µL. Identification was performed in a range of 200–400 nm wavelengths by comparing UV/Vis spectral data and retention times to those of standard compounds. Validation data of the method with representative chromatograms are provided in our previous paper [56].

4.6. Data Analysis

Multivariate statistical analysis was performed using the software package Statistica 10.0 (StatSoft Inc., Uppsala, Sweden). One-way analysis of variance (ANOVA) was used to identify the significant differences of phenolic compounds among populations and plant organs. Significant differences were specified by a post-hoc Schefft’s test (p ≤ 0.05). Variable sets were compared pairwise by calculating the Pearson’s correlation coefficient (r) and Student’s t statistic. Differences in the ratio of groups of phenolic compounds between plant organs and between countries were determined using the Wilcoxon matched pairs test and the Kruskal–Wallis test. PCA1 was based on standardized variables that differed significantly between countries, including 15 inflorescence, 15 leaves, and 11 stem compounds. PCA2 was based on the sum of total phenolic acids and flavonoid standardized variables. Datasets of inflorescences, leaves, and stems were pooled together and used in PCA to obtain more compelling results for visualization.

5. Conclusions

Considering widespread application and commercial demand for yarrow raw material (Millefolii herba), which is currently mainly obtained from the wild, it is important for collectors and manufacturers to be aware of the quality and safety of the raw materials used in pharmaceuticals and dietary supplements. In this regard, screening of the intraspecific diversity of A. millefolium allows for the validation of product development from wild materials and helps to identify and select populations with a high potential for phenolic compounds.
This study indicated the importance of geographical gradients in the quality of phenolic compounds in plant organs of A. millefolium, emphasizing the importance of higher latitudes. The amount of phenolic compounds in plant materials from northern latitudes was more than twice as high as that in plants from southern latitudes, which may reflect greater plant adaptation to the respective conditions. Consequently, our study contributes to the understanding of the increased accumulation of phenolic compounds at higher latitudes. Opposite geographical gradient and accumulation trends of caffeoylquinic acids and flavonoids were found, where the relative value of phenolic acids increased in northern populations and the amounts of flavonoids decreased in southern populations, and vice versa.
Information on regional and geographical gradient range differences of phenolic compound profiles in A. millefolium will contribute to the knowledge of the distribution of specialized metabolites and their biochemical wild resources. The findings suggest that spatial geographical data on the distribution of phenolic compounds in A. millefolium populations could be used as a tool to find potential collection sites for high-quality raw materials.
The knowledge gained is important for the potential assessment of the environmental impact on the accumulation of phenolic compounds in medicinal plants, emphasizing the positive influence of northern latitudes. The obtained results have the potential for planning the targeted use of plant materials and for the conservation of plant resources from overexploitation.

Supplementary Materials

The following supporting information can be downloaded at https://www.mdpi.com/article/10.3390/plants12040746/s1, Table S1: Pearson correlation coefficients (r) and significance value (p) between the content of individual phenolic compounds in inflorescences, leaves, and stems of Achillea millefolium and the latitude and longitude of population sites in Turkey and Lithuania; Table S2: The mean quantities (µg/g, DM) of phenolic compounds in inflorescences, leaves, and stems of Achillea millefolium populations from Nevşehir (1) and Gaziantep (2) provinces in Turkey and comparison of their differences (p ≤ 0.05) according to t-test.

Author Contributions

Conceptualization, J.R. and C.Ç.; methodology, G.V.; software, B.K.; validation, G.V. and L.R. (Lina Raudone); investigation, L.R. (Lina Raudone), G.V., M.M., L.R. (Laura Rimkienė) and J.R.; resources, J.R., B.K., F.S., F.Y. and L.I.; data curation, L.R. (Lina Raudone); writing—original draft preparation, J.R. and C.Ç.; writing—review and editing, J.R.; visualization, B.K. and C.Ç.; supervision, J.R. All authors have read and agreed to the published version of the manuscript.

Funding

This research received no external funding.

Institutional Review Board Statement

Not applicable.

Informed Consent Statement

Not applicable.

Data Availability Statement

Data is contained within the article or Supplementary Materials.

Conflicts of Interest

The authors declare no conflict of interest.

References

  1. Ebrahim, F.; Pakniyat, H.; Arzani, A.; Rahimmalek, M. Karyotype analysis and new chromosome number reports in Achillea species. Biologia 2012, 67, 284–288. [Google Scholar] [CrossRef]
  2. Richardson, I.B.K. Achillea L. In Flora Europaea; Tutin, T.G., Heywood, V.H., Burges, N.A., Moore, D.M., Valentine, D.H., Walters, S.M., Webb, D.A., Eds.; Cambridge University Press: London, UK, 1976; Volume 4, pp. 159–165. [Google Scholar]
  3. Ehrendorfer, F.; Guo, Y.-P. Multidisciplinary studies on Achillea sensu lato (Compositae-Anthemideae): New data on systematics and phylogeography. Willdenowia 2006, 36, 69–87. [Google Scholar] [CrossRef]
  4. Arabacı, T. Achillea L. In Türkiye Bitkileri Listesi (Damarlı Bitkiler); Güner, A., Aslan, S., Ekim, T., Vural, M., Babaç, M.T., Eds.; Nezahat Gökyiğit Botanik Bahçesi ve Flora Araştırmaları Derneği Yayını: İstanbul, Turkey, 2012; pp. 108–112. [Google Scholar]
  5. Pomeroy, E.; Bennett, P.; Hunt, C.; Reynolds, T.; Farr, L.; Frouin, M.; Holman, J.; Lane, R.; French, C.; Barker, G. New Neanderthal remains associated with the ‘flower burial’ at Shanidar Cave. Antiquity 2020, 94, 11–26. [Google Scholar] [CrossRef]
  6. Mileffolii herba. European Medicines Agency. Available online: https://www.ema.europa.eu/en/medicines/herbal/millefolii-herba (accessed on 13 December 2022).
  7. Mohamed, D.A.; Hanfy, E.A.; Fouda, K. Evaluation of antioxidant, anti-inflammatory and anti-arthritic activities of yarrow (Achillea millefolium). J. Biol. Sci. 2018, 18, 317–328. [Google Scholar] [CrossRef]
  8. Fierascu, I.; Ungureanu, C.; Avramescu, S.M.; Fierascu, R.C.; Ortan, A.; Soare, L.C.; Paunescu, A. In Vitro antioxidant and antifungal properties of Achillea millefolium L. Rom. Biotechnol. Lett. 2015, 20, 10626–10636. [Google Scholar]
  9. Moradi, M.T.; Rafieian-Koupaei, M.; Imani-Rastabi, R.; Nasiri, J.; Shahrani, M.; Rabiei, Z.; Alibabaeit, Z. Antispasmodic effects of yarrow (Achillea millefolium L.) extract in the isolated ileum of rat. Afr. J. Tradit. Complement. Altern. Med. 2013, 10, 499–503. [Google Scholar] [CrossRef]
  10. Kaczorová, D.; Karalija, E.; Dahija, S.; Bešta-Gajević, R.; Parić, A.; Zeljković, S.Ć. Influence extraction solvent on the phenolic profile and bioactivity of two Achillea species. Molecules 2021, 26, 1601. [Google Scholar] [CrossRef]
  11. Khan, A.U.; Gilani, A.H. Blood pressure lowering, cardiovascular inhibitory and bronchodilatory actions of Achillea millefolium. Phytother. Res. 2011, 25, 577–583. [Google Scholar] [CrossRef]
  12. Noureddini, M.; Rasta, V.R. Analgesic effect of aqueous extract of Achillea millefolium L. on rat’s formalin test. Pharmacologyonline 2008, 3, 659–664. [Google Scholar]
  13. Applequist, W.L.; Moerman, D.E. Yarrow (Achillea millefolium L.): A neglected Panacea? A review of ethnobotany, bioactivity, and biomedical research. Econ. Bot. 2011, 65, 209–225. [Google Scholar] [CrossRef]
  14. Dias, M.I.; Barros, L.; Dueñas, M.; Pereira, E.; Carvalho, A.M.; Alves, R.C.; Oliveira, M.B.; Santos-Buelga, C.; Ferreira, I.C. Chemical composition of wild and commercial Achillea millefolium L. and bioactivity of the methanolic extract, infusion and decoction. Food. Chem. 2013, 141, 4152–4160. [Google Scholar] [CrossRef]
  15. Bessada, S.M.F.; Barreira, J.C.M.; Oliveira, M.B.P.P. Asteraceae species with most prominent bioactivity and their potential applications: A review. Ind. Crops Prod. 2015, 76, 604–615. [Google Scholar] [CrossRef]
  16. Huyut, Z.; Beydemir, Ş.; Gülçin, I. Antioxidant and antiradical properties of selected flavonoids and phenolic compounds. Biochem. Res. Int. 2017, 2017, 6791. [Google Scholar] [CrossRef]
  17. Magana, A.A.; Kamimura, N.; Soumyanath, A.; Stevens, J.F.; Maier, C.S. Caffeoylquinic acids: Chemistry, biosynthesis, occurrence, analytical challenges, and bioactivity. Plant J. 2021, 107, 1299–1319. [Google Scholar] [CrossRef]
  18. Gevrenova, R.; Zengin, G.; Sinan, K.I.; Yıldıztugay, E.; Zheleva-Dimitrova, D.; Picot-Allain, C.; Mahomoodally, M.F.; Imran, M.; Dall’acqua, S. UHPLC-MS Characterization and Biological Insights of Different Solvent Extracts of Two Achillea Species (A. aleppica and A. santolinoides) from Turkey. Antioxidants 2021, 10, 1180. [Google Scholar] [CrossRef]
  19. Sevindik, H.G.; Güvenalp, Z.; Yerdelen, K.Ö.; Yuca, H.; Demirezer, Ö. The discovery of potential anticholinesterase compounds from Achillea millefolium L. Ind. Crops Prod. 2015, 76, 873–879. [Google Scholar] [CrossRef]
  20. Zengin, G.; Aktumsek, A.; Ceylan, R.; Uysal, S.; Mocan, A.; Guler, G.O.; Mahomoodally, M.F.; Glamočlija, J.; Ćirić, A.; Soković, M. Shedding light on the biological and chemical fingerprints of three Achillea species (A. biebersteinii, A. millefolium and A. teretifolia). Food Funct. 2017, 8, 1152–1165. [Google Scholar] [CrossRef]
  21. Afshari, M.; Rahimmalek, M.; Miroliaei, M. Variation in polyphenolic profiles, antioxidant and antimicrobial activity of different Achillea species as natural sources of antiglycative compounds. Chem. Biodivers. 2018, 15, e1800075. [Google Scholar] [CrossRef]
  22. Hawryl, A.; Hawrył, M.; Świeboda, R.; Waksmundzka-Hajnos, M. Chemometric analysis based on high-performance liquid chromatographic data in the fingerprint construction of selected Achillea species. J. Liq. Chromatogr. Relat. Technol. 2018, 41, 1–5. [Google Scholar] [CrossRef]
  23. Gaweł-Bȩben, K.; Strzȩpek-Gomółka, M.; Czop, M.; Sakipova, Z.; Głowniak, K.; Kukula-Koch, W. Achillea millefolium L. and Achillea biebersteinii Afan. hydroglycolic extracts-bioactive ingredients for cosmetic use. Molecules 2020, 25, 3368. [Google Scholar] [CrossRef]
  24. Georgieva, L.; Gadjalova, A.; Mihaylova, D.; Pavlov, A. Achillea millefolium L.—Phytochemical profile and in vitro antioxidant activity. Int. Food Res. J. 2015, 22, 1347–1352. [Google Scholar]
  25. Ahlstrand, N.I.; Reghev, N.H.; Markussen, B.; Hansen, H.C.B.; Eiriksson, F.F.; Thorsteinsdóttir, M.; Rønsted, N.; Barnes, C.J. Untargeted metabolic profiling reveals geography as the strongest predictor of metabolic phenotypes of a cosmopolitan weed. Ecol. Evol. 2018, 8, 6812–6826. [Google Scholar] [CrossRef] [PubMed]
  26. Grebner, D.L.; Bettinger, P.; Siry, J.P. Forest Dynamics. In Introduction to Forestry and Natural Resources; Elsevier BV: Amsterdam, The Netherlands, 2013; pp. 243–254. [Google Scholar] [CrossRef]
  27. Labarrere, B.; Prinzing, A.; Dorey, D.; Chesneau, E.; Hennion, F. Variations of secondary metabolites among natural populations of sub-Antarctic Ranunculus species suggest functional redundancy and versatility. Plants 2019, 8, 234. [Google Scholar] [CrossRef]
  28. Padilla-González, G.F.; Frey, M.; Gómez-Zeledón, J.; Da Costa, F.B.; Spring, O. Metabolomic and gene expression approaches reveal the developmental and environmental regulation of the secondary metabolism of yacón (Smallanthus sonchifolius, Asteraceae). Sci. Rep. 2019, 9, 9246. [Google Scholar] [CrossRef] [PubMed]
  29. Martz, F.; Peltola, R.; Fontanay, S.; Duval, R.E.; Julkunen-Tiitto, R.; Stark, S. Effect of latitude and altitude on the terpenoid and soluble phenolic composition of Juniper (Juniperus communis) needles and evaluation of their antibacterial activity in the boreal zone. J. Agr. Food Chem. 2009, 57, 9575–9584. [Google Scholar] [CrossRef] [PubMed]
  30. Jakaaola, L.; Hohtola, A. Effect of latitude on flavonoid biosynthesis in plants. Plant Cell Environ. 2010, 33, 1239–1247. [Google Scholar] [CrossRef]
  31. Zidorn, C. Altitudinal variation of phenolics contents in flowering heads of the Asteraceae family. Phytochem. Rev. 2010, 9, 197–203. [Google Scholar] [CrossRef]
  32. Asensio, E.; Vitales, D.; Perez, I.; Peralba, L.; Viruel, J.; Montaner, C.; Vallès, J.; Garnatje, T.; Sales, E. Phenolic compounds content and genetic diversity at population level across the natural distribution range of bearberry (Arctostaphylos uva-ursi, Ericaceae) in the Iberian Peninsula. Plants 2020, 9, 1250. [Google Scholar] [CrossRef]
  33. Zou, K.; Liu, X.; Zhang, D.; Yang, Q.; Fu, S.; Meng, D.; Chang, W.; Li, R.; Yin, H.; Liang, Y. Flavonoid biosynthesis is likely more susceptible to elevation and tree age than other branch pathways involved in phenylpropanoid biosynthesis in ginkgo leaves. Front. Plant Sci. 2019, 10, 983. [Google Scholar] [CrossRef]
  34. Spinardi, A.; Cola, G.; Gardana, C.S.; Mignani, I. Variation of anthocyanin content and profile throughout fruit development and ripening of highbush blueberry cultivars grown at two different altitudes. Front. Plant Sci. 2019, 10, 1045. [Google Scholar] [CrossRef]
  35. Yuliani, Y.; Rachmadiarti, F.; Dewi, S.K.; Asri, M.T.; Soegianto, A. Total phenolic and flavonoid contents of Elephantopus scaber and Ageratum conyzoides (Asteraceae) leaves extracts from various altitude habitats. Ecol. Environ. Conserv. 2019, 25, 106–113. [Google Scholar]
  36. Martz, F.; Jaakola, L.; Julkunen-Tiitto, R.; Stark, S. Phenolic composition and antioxidant capacity of bilberry (Vaccinium myrtillus) leaves in Northern Europe following foliar development and along environmental gradients. J. Chem. Ecol. 2010, 36, 1017–1028. [Google Scholar] [CrossRef] [PubMed]
  37. Filippi, A.; Braidot, E.; Petrussa, E.; Fabro, M.; Vuerich, M.; Boscutti, F. Plant growth shapes the effects of elevation on the content and variability of flavonoids in subalpine bilberry stands. Plant Biol. 2021, 23, 241–249. [Google Scholar] [CrossRef] [PubMed]
  38. Nataraj, N.; Hussain, M.; Ibrahim, M.; Hausmann, A.E.; Rao, S.; Kaur, S.; Khazir, J.; Mir, B.A.; Olsson, S.B. Effect of altitude on volatile organic and phenolic compounds of Artemisia brevifolia Wall ex Dc. from the Western Himalayas. Front. Ecol. Evol. 2022, 10, 864728. [Google Scholar] [CrossRef]
  39. Tripp, E.A.; Zhuang, Y.; Schreiber, M.; Stone, H.; Berardi, A.E. Evolutionary and ecological drivers of plant flavonoids across a large latitudinal gradient. Mol. Phylogenet. Evol. 2018, 128, 147–161. [Google Scholar] [CrossRef] [PubMed]
  40. Stark, S.; Julkunen-Tiitto, R.; Holappa, E.; Mikkola, K.; Nikula, A. Concentrations of foliar quercetin in natural populations of white birch (Betula pubescens) increase with latitude. J. Chem. Ecol. 2008, 34, 1382–1391. [Google Scholar] [CrossRef]
  41. Lätti, A.K.; Riihinen, K.R.; Kainulainen, P.S. Analysis of anthocyanin variation in wild populations of bilberry (Vaccinium myrtillus L.) in Finland. J. Agric. Food Chem. 2008, 56, 190–196. [Google Scholar] [CrossRef]
  42. Moore, B.D.; Andrew, R.L.; Külheim, C.; Foley, W.J. Explaining intraspecific diversity in plant secondary metabolites in an ecological context. New Phytol. 2014, 201, 733–750. [Google Scholar] [CrossRef]
  43. López-Caamal, A.; Tovar-Sánche, E. Genetic, morphological, and chemical patterns of plant hybridization. Rev. Chil. Hist. Nat. 2014, 87, 16. [Google Scholar] [CrossRef]
  44. Luo, J.; Wang, K.; Li, G.S.; Lei, D.Q.; Huang, Y.J.; Li, W.D.; Chen, Y.Q.; Kong, J.I. 3,5-dicaffeoylquinic acid disperses Aspergillus fumigatus biofilm and enhances fungicidal efficacy of voriconazole and amphotericin B. Med. Sci. Monit. 2018, 22, 427–437. [Google Scholar] [CrossRef]
  45. Theoharides, T.C.; Cholevas, C.; Polyzoidis, K.; Politis, A. Long-COVID syndrome-associated brain fog and chemofog: Luteolin to the rescue. Biofactors 2021, 47, 232–241. [Google Scholar] [CrossRef]
  46. Franza, L.; Carusi, V.; Nucera, E.; Pandolfi, F. Luteolin, inflammation and cancer: Special emphasis on gut microbiota. Biofactors 2021, 47, 181–189. [Google Scholar] [CrossRef]
  47. Naveed, M.; Hejazi, V.; Abbas, M.; Kamboh, A.A.; Khan, G.J.; Shumzaid, M.; Ahmad, F.; Babazadeh, D.; FangFang, X.; Modarresi-Ghazani, F.; et al. Chlorogenic acid (CGA): A pharmacological review and call for further research. Biomed. Pharmacother. 2018, 97, 67–74. [Google Scholar] [CrossRef]
  48. Ali, S.I.; Gopalakrishnan, B.; Venkatesalu, V. Pharmacognosy, phytochemistry and pharmacological properties of Achillea millefolium L.: A Review. Phytother. Res. 2017, 31, 1140–1161. [Google Scholar] [CrossRef]
  49. Keser, S.; Celik, S.; Turkoglu, S.; Yilmaz, O.; Turkoglu, I. Antioxidant activity, total phenolic and flavonoid content of water and ethanol extracts from Achillea millefolium L. Turk. J. Pharm. Sci. 2013, 10, 385–392. [Google Scholar]
  50. Benedek, B.; Gjoncaj, N.; Saukel, J.; Kopp, B. Distribution of phenolic compounds in Middleeuropean taxa of the Achillea millefolium L. Aggregate. Chem. Biodivers. 2007, 4, 849–857. [Google Scholar] [CrossRef]
  51. Bączek, K.; Kosakowska, O.; Przybył, J.L.; Kuźm, P.; Ejdys, M.; Obiedzinski, M.; Weglarz, Z. Intraspecific variability of yarrow (Achillea millefolium L. s.l.) in respect of developmental and chemical traits. Herba Pol. 2015, 61, 37–52. [Google Scholar] [CrossRef]
  52. Wojdyło, A.; Oszmiański, J.; Czemerys, R. Antioxidant activity and phenolic compounds in 32 selected herbs. Food Chem. 2007, 105, 940–949. [Google Scholar] [CrossRef]
  53. Zidorn, C. Guidelines for consistent characterisation and documentation of plant source materials for studies in phytochemistry and phytopharmacology. Phytochemistry 2017, 139, 56–59. [Google Scholar] [CrossRef]
  54. Aydın, Y. Quantification of water requirement of some major crops under semi-arid climate in Turkey. PeerJ 2022, 10, e13696. [Google Scholar] [CrossRef]
  55. Bağdatlı, M.C.; Arıkan, E.N. Evaluation of monthly maximum, minimum and average temperature changes observed for many years in Nevsehir province of Turkey. World Res. J. Agric. Sci. 2020, 7, 209–220. [Google Scholar]
  56. Raudone, L.; Radušiene, J.; Seyis, F.; Yayla, F.; Vilkickyte, G.; Marksa, M.; Ivanauskas, L.; Cırak, C. Distribution of phenolic compounds and antioxidant activity in plant parts and populations of seven underutilized wild Achillea species. Plants 2022, 11, 447. [Google Scholar] [CrossRef]
Figure 1. PCA1 score plot model representing the accumulation of phenolic compounds in Achillea millefolium plant materials from Turkey (No. 1–16) and Lithuania (No. 17–36) populations. Inflorescence, leaf, and stem datasets were pooled together and used for PCA. Scores marked and outlined in brown indicated Turkish populations; scores marked and outlined in green indicated Lithuanian populations.
Plants 12 00746 g001
Figure 2. PCA2 score plot model representing the accumulation of total phenolic acids and flavonoids in Achillea millefolium plant materials from Turkish (No. 1–16) and Lithuanian (No. 17–36) populations. Inflorescence, leaf, and stem datasets were pooled together and used for PCA2. Scores marked in brown indicate Turkish populations; scores marked in green indicate Lithuanian populations.
Plants 12 00746 g002
Figure 3. Maps of Achillea millefolium sampling sites in the provinces of Gaziantep (a) and Nevşehir (b) in Turkey and Lithuania (c).
Plants 12 00746 g003
Table 1. The mean quantities (µg/g, DM) of phenolic compounds in inflorescences, leaves, and stems of Achillea millefolium in Turkey and Lithuania and comparison of their differences (p ≤ 0.05) according to t-test, as well as differences in compounds among plant organs for all populations by ANOVA (p1).
CompoundsInflorescences (n = 36)Leaves (n = 36)Stems (n = 36)Fp1
TurkeyLithuaniapTurkeyLithuaniapTurkeyLithuaniap
MSDMSDMSDMSDMSDMSD
Neochlorogenic acid219.937.8395.785.5<0.001557.3282.4979.8261.5<0.001265.270.0254.159.00.60769.3<0.001
Chlorogenic acid1443.8736.57735.32273.2<0.0014140.33294.719,483.36832.2<0.0011068.6610.84069.31251.3<0.00127.6<0.001
4-O-caffeoylquinic acid1362.7508.9992.4572.90.0511536.7686.6408.3478.9<0.001641.5237.1967.4791.10.1222.40.097
3.4-O-dicaffeoylquinic acid1701.0997.22582.3690.50.004982.9869.43482.31231.2<0.001184.8116.0738.1378.0<0.00130.7<0.001
3.5-O-dicaffeoylquinic acid2409.41078.68646.81750.2<0.0013749.82156.811,901.14087.7<0.001755.4314.31448.4465.3<0.00135.4<0.001
1,3-O-dicaffeoylquinic acid0000 0082.070.3 0037.047.3 14.1<0.001
1.5-O-dicaffeoylquinic acid002345.6954.3<0.00151.823.64924.72591.7<0.00164.425.51163.8624.4<0.00110.2<0.001
4.5-O-dicaffeoylquinic acid318.4125.51010.8289.0<0.001142.893.51820.3796.7<0.001105.062.5505.2284.7<0.00111.4<0.001
Caffeic acid1.66.419.613.9<0.00135.124.0270.644.60.00714.517.939.529.50.00519.6<0.001
Quercitrin00289.6429.90.01100255.6161.3<0.0010090.056.6<0.0012.40.093
Rutin188.5120.4168.7180.40.7091979.01340.72681.01259.80.116649.4369.2872.6511.20.15269.5<0.001
Quercetin34.226.126.43.60.19630.114.118.62.60.00130.88.822.34.80.0012.10.130
Isoquercitrin425.0432.26.520.7<0.00155.2132.886.8123.60.4660033.464.50.0475.90.004
Luteolin2699.72072.7814.21126.90.001395.2915.7146.257.20.232120.336.5134.49.80.10720.3<0.001
Luteolin-7-O-glucoside1776.1954.52772.1702.50.001262.3485.7975.5670.00.00148.751.694.298.20.103106.4<0.001
Luteolin-7-O-rutinoside601.4409.2575.4370.20.843160.1131.71154.4511.8<0.001214.5125.2195.191.30.59413.6<0.001
Luteolin-3.7-O-diglucoside1836.41507.800<0.001104.6418.400.00.2701.14.430.716.1<0.00111.9<0.001
Apigenin132.9182.5524.0140.8<0.00119.255.29.011.60.4250000 65.1<0.001
Apigenin-7-O-glucoside241.9215.83501.0831.4<0.00123.091.9214.3103.1<0.0010000 45.4<0.001
Santin502.4231.3222.857.31<0.001308.7234.4246.025.40.241232.415.2187.964.50.0117.30.001
Total (sum of compounds)15,895.44349.132,629.07223.8<0.00114,534.07047.048,939.814,818.8<0.0014396.51359.110,883.23080.0<0.00132.6<0.001
Table 2. Mean ratio (%) of total phenolic acids and flavonoids in plant organs of Achillea millefolium from Turkish and Lithuanian populations. Significant differences (p1) between compound groups according to the Wilcoxon matched pairs test and differences (p2) between countries according to Kruskal–Wallis test.
Plant OrganTurkeyp1Lithuaniap1AcidsFlavonoids
AcidsFlavonoidsAcidsFlavonoidsp2p2
Flowers48.4 a51.6 a0.50173.8 a26.2 a<0.001<0.001<0.001
Leaves79.9 b20.1 b0.00188.2 b11.8 b<0.001<0.001<0.001
Stems69.0 b31.0 b<0.00184.4 b15.6 b<0.001<0.001<0.001
Values followed by the different letters differ significantly between plant organs, according to the Kruskal–Wallis test (p < 0.05).
Table 3. Mean values (µg/g dry matter (DM)) of total phenolic acids and flavonoids in plant organs of Achillea millefolium from Turkish and Lithuanian populations. Significant differences (p1) between compound groups and differences (p2) between countries according to t-test.
Plant OrganTurkeyp1 2Lithuaniap1AcidsFlavonoids
AcidsFlavonoidsAcidsFlavonoidsp2p2
Flowers7456.9 a 18438.5 a0.37123,728.4 a8900.6 a<0.001<0.0010.647
Leaves11,196.7 b3337.3 b<0.00143,070.4 b5869.4 b<0.001<0.0010.002
Stems3099.3 c1297.1 c<0.0019185.6 c1697.6 c<0.001<0.0010.056
1 Mean values followed by the different letters differ significantly between plant organs, according to the Scheffe’s test (p ≤ 0.05). 2 df—34.
Table 4. PCA1 results based on Pearson correlation matrix between selected Achillea millefolium phenolic compounds in plant organs that differed significantly between countries and the two principal component scores.
No.VariablesInflorescencesLeavesStems
PC1PC2PC1PC2PC1PC2
1Neochlorogenic acid−0.93−0.12−0.790.45--
2Chlorogenic acid−0.96−0.12−0.920.21−0.93−0.08
34-O-caffeoylquinic acid--0.600.35--
43,4-O-dicaffeoylquinic acid−0.64−0.39−0.890.02−0.89−0.10
53,5-O-dicaffeoylquinic acid−0.95−0.13−0.920.10−0.88−0.09
61,5-O-dicaffeoylquinic acid−0.910.03−0.85−0.10−0.86−0.24
74,5-O-dicaffeoylquinic acid−0.91−0.02−0.89−0.04−0.720.46
8Caffeic acid−0.670.16−0.480.65−0.590.45
9Quercitrin−0.55−0.10−0.86−0.05−0.78−0.28
11Quercetin--0.55−0.340.52−0.40
12Isoquercitrin0.58−0.26--−0.62−0.36
13Luteolin0.430.21----
14Luteolin-7-O-glucoside−0.59−0.59−0.75−0.44--
15Luteolin-7-O-rutinoside--−0.87−0.07--
16Luteolin-3,7 O-diglucoside0.65−0.53----
17Apigenin−0.780.30----
18Apigenin-7-O-glucoside−0.950.00−0.79−0.49−0.80−0.20
19Santin0.64−0.36--0.33−0.77
Table 5. PCA2 results based on Pearson correlation matrix between Achillea millefolium total phenolic acids and flavonoids in plant organs and the two principal component scores.
VariablesInflorescencesLeavesStems
PC1PC2PC1PC2PC1PC2
Phenolic acids−0.920.16−0.900.21−0.930.19
Flavonoids−0.36−0.88−0.850.02−0.75−0.28
Table 6. Sampling sites, coordinates, elevation, and habitats of Achillea millefolium populations from Turkey and Lithuania.
No.Province, Geographical RegionLatitude (°N)Longitude (°E)Elevation (m.a.s.l.)Habitat
1Nevşehir, Central Anatolia38.616734.6162954Open coniferous woodland
2Nevşehir, Central Anatolia38.650034.6495961Open coniferous woodland
3Nevşehir, Central Anatolia38.683334.71621012Open coniferous woodland
4Nevşehir, Central Anatolia38.700134.86631116Open coniferous woodland
5Nevşehir; Central Anatolia38.733334.88291229Open coniferous woodland
6Nevşehir, Central Anatolia38.783334.73291287Open coniferous woodland
7Nevşehir, Central Anatolia38.783334.61621203Open conifer woodland
8Gaziantep, Southeast Anatolia37.250637.1492675Roadside grassland
9Gaziantep, Southeast Anatolia37.250137.1828778Roadside grassland
10Gaziantep, Southeast Anatolia37.233437.19961011Roadside grassland
11Gaziantep, Southeast Anatolia37.233337.2496972Calcareous mountain slope
12Gaziantep, Southeast Anatolia37.233437.3163933Calcareous mountain slope
13Gaziantep, Southeast Anatolia37.250037.3163639High altitude grassland
14Gaziantep, Southeast Anatolia37.266737.3663937High altitude grassland
15Gaziantep, Southeast Anatolia37.266737.4163946High altitude grassland
16Gaziantep, Southeast Anatolia37.266737.4663861High altitude grassland
17Veisiejai, Lazdijai distr.54.0987123.72095125Dry grassland
18Meteliai, Lazdijai distr.54.2846523.74717114Mixed forest, roadside
19Pirčiupiai, Šalčininkai distr.54.3908724.95129131Pine forest, roadside
20Einororys, Alytus distr.54.4461424.38971120Mesophytic grassland
21Geruliai, Alytus distr.54.5312024.27056130Mesophytic grassland
22Gojus, Prienai distr.54.5684524.2812896Dry grassland
23Žuklijai, Trakai distr.54.5098624.68252162Mesophytic grassland
24Pamiškė, Trakai distr.54.6260724.51166180Mesophytic grassland
25Rokantai, Vilnius distr.54.7348825.54795180Mesophytic grassland
26Mickūnai, Vilnius distr.54.7527425.55872156Pine forest, roadside
27Užugriovis, Vilnius distr.54.8278225.24644161Dry grassland
28Bernatonys, Vilnius distr.54.9093425.32271160Mesophytic grassland
29Skardupiai, Šakiai distr.54.8556723.0339847Mesophytic grassland
30Dubingiai, Molėtai distr.55.0591125.43509175Pine forest, roadside
31Apkartai, Molėtai distr.55.2165825.64254160Dry grassland
32Vorėnai, Molėtai distr.55.3577925.61012158Mesophytic grassland
33Mikieriai, Anykščiai dist.55.6605825.19964130Mesophytic grassland
34Svėdasai, Anykščiai distr.55.6775025.36114111Dry grassland
35Maželiai, Rokiškis distr.56.0319725.3249699Mesophytic grassland
36Juodžionys, Biržai distr.56.2435324.8791560Mesophytic grassland
Disclaimer/Publisher’s Note: The statements, opinions and data contained in all publications are solely those of the individual author(s) and contributor(s) and not of MDPI and/or the editor(s). MDPI and/or the editor(s) disclaim responsibility for any injury to people or property resulting from any ideas, methods, instructions or products referred to in the content.

