Article

Genome-Wide Characterization of Tomato FAD Gene Family and Expression Analysis under Abiotic Stresses

1
Institute of Horticulture Crops, Xinjiang Academy of Agricultural Sciences/Xingjiang Engineering Research Center for Vegetables, Urumqi 830091, China
2
The State Key Laboratory of Genetic Improvement and Germplasm Innovation of Crop Resistance in Arid Desert Regions (Preparation), Institute of Horticultural Crops, Xinjiang Academy of Agricultural Sciences, Urumqi 830091, China
3
College of Horticulture, Xinjiang Agricultural University, Urumqi 830052, China
*
Authors to whom correspondence should be addressed.
These authors contributed equally to this work.
Plants 2023, 12(22), 3818; https://doi.org/10.3390/plants12223818
Submission received: 16 October 2023 / Revised: 6 November 2023 / Accepted: 8 November 2023 / Published: 10 November 2023

Abstract

:
The fatty acid desaturase (FAD) gene family plays a crucial regulatory role in the resistance process of plant biomembranes. To understand the role of FADs in tomato growth and development, this study identified and analyzed the tomato FAD gene family based on bioinformatics analysis methods. In this study, 26 SlFADs were unevenly distributed on 10 chromosomes. Phylogenetic analysis showed that the SlFAD gene family was divided into six branches, and the exon–intron composition and conserved motifs of SlFADs clustered in the same branch were quite conservative. Several hormone and stress response elements in the SlFAD promoter suggest that the expression of SlFAD members is subject to complex regulation; the construction of a tomato FAD protein interaction network found that SlFAD proteins have apparent synergistic effects with SPA and GPAT proteins. qRT-PCR verification results show that SlFAD participates in the expression of tomato root, stem, and leaf tissues; SlFAD8 is mainly highly expressed in leaves; SlFAD9 plays a vital role in response to salt stress; and SlFAB5 regulates all stages of fruit development under the action of exogenous hormones. In summary, this study provides a basis for a systematic understanding of the SlFAD gene family. It provides a theoretical basis for in-depth research on the functional characteristics of tomato SlFAD genes.

1. Introduction

Fatty acid desaturase (FAD) is a critical enzyme in plant lipid metabolism, playing essential roles in plant growth, development, and stress responses [1,2,3,4]. Based on their solubility, plant FADs can be categorized into soluble desaturases (FAB2/SAD) and membrane-bound desaturases (FAD) [5], with no evolutionary relationship between the two of them [6,7,8,9]. FAB2s typically contain two conserved histidine motifs (D/EXXH), while membrane-bound FADs contain three conserved histidine motifs (H(X)34H/H(X)23HH/H/Q(X)2~3HH) [10]. Stearoyl-ACP desaturase (FAB2/SAD) is the only known soluble FAD in the plastid stroma, catalyzing the conversion of stearic acid to oleic acid [11]. Membrane-bound FADs can be further divided into four subfamilies based on their functions, including FAD4, FAD2/FAD6 (ω-6 desaturases), FAD3/FAD7/FAD8 (ω-3 desaturases), and ADS/SLD/DES. Amino acid sequences of FADs within the same subfamily exhibit high conservation [12].
The level of unsaturation in FAD is a key determinant of a plant’s ability to withstand adverse environmental conditions, as it enhances the plant’s resistance to stress by regulating the unsaturation of fatty acids in the body. Studies have shown that MaFADs play a crucial role in banana’s response to both high- and low-temperature stress [13]. The overexpression of soybean GmFAD3A in rice induced by low temperature improved the cold tolerance and seed germination rate of transgenic plants [14,15]. Functional analysis of the soybean fatty acid desaturase GmFAD3C-1 gene indicated its close association with linolenic acid content in plants [16]. When the four AhFAD3 genes from peanuts were expressed in Arabidopsis, each had the effect of increasing the total fatty acid content and relative contribution of ALA in seeds, as well as improving seedling survival under salt stress [17]. AtFAD2 promotes seed germination and salt tolerance in Arabidopsis thaliana [18]. The ectopic overexpression of AtFAD3 and AtFAD8 both enhanced drought resistance and osmotic tolerance in transgenic tobacco [19]. Brassica napus FAD3 (BnFAD3) and Arabidopsis FAD8 (AtFAD8) have been shown to increase the linoleic acid/linolenic acid ratio and osmotic stress tolerance [20].
With the continuous development of bioinformatics, a total of 18, 23, 27, 38, and 19 FAD gene family members have been identified in Arabidopsis [21], poplar [22], banana [13], eggplant [23], and cotton [24], respectively. Tomato, as a widely cultivated economic crop globally, has suffered from adverse biotic and abiotic stresses that negatively affect its yield. However, its short growth cycle and abundant mutant resources make tomato highly valuable for scientific research. Identifying and analyzing the FAD gene family can provide a foundation for exploring high-quality stress-tolerant genes in tomato. In this study, based on the SL5.0 reference genome of tomato Heinz 1706 [10], we conducted a comprehensive genome-wide identification of FAD gene family members and studied the differential expression patterns of FAD family genes in tomato seedling leaves in response to salt stress. The aim is to unearth candidate salt-tolerant genes in tomato and lay the theoretical foundation for research on the molecular mechanisms of salt tolerance in tomatoes.

2. Result

2.1. Analysis of Physicochemical Properties of SlFAD Gene Family

In the tomato genome SL5.0, a total of 26 members of the SlFAD gene family (SlFAD19 and SlFAB7) encoding SlFAD were identified. They were named in order of their chromosomal location as SlFAD1~SlFAD19 and SlFAB1~SlFAB7. A systematic analysis of their physicochemical properties (Table 1) revealed that the amino acids encoded by SlFAD ranged from 166 (SlFAB6) to 771 (SlFAD3) aa; the molecular weight distribution was between 89,844.76 (SlFAD3) and 18,924.74 (SlFAB6) kDa; the isoelectric point distribution ranged from 5.72 (SlFAB1) to 9.02 (SlFAD18); the lipid index distribution was between 69.15 (SlFAB1) and 96.73 (SlFAD19). Among the 26 family members, only 5 members (SlFAD4, SlFAD9, SlFAD10, SlFAD11, SlFAD19) were hydrophobic proteins.
The subcellular prediction results of the SlFAD gene family showed that the 26 family members were mainly located in the cell membrane, endoplasmic reticulum, chloroplasts, and cytoplasm. Among them, 42.31% of SlFAD genes were located in the cell membrane, 30.77% of SlFAD genes were located in chloroplasts, and others were located in the endoplasmic reticulum or cytoplasm. These results are also similar to the characteristics of the FAD gene family.

2.2. Phylogenetic Analysis of the SlFAD Gene Family

A phylogenetic tree was constructed using the maximum likelihood method with protein sequences from Arabidopsis, tomato, and eggplant to study the evolutionary relationship of the FAD family. Clustering analysis was performed with 19 and 35 FAD genes obtained from Arabidopsis thaliana and Solanum melongena, respectively, as shown in Figure 1. The phylogenetic tree shows that members of the FAD family in the different branches show high bootstrap values (100%), and if the bootstrap value is closer to the initially set number of replicate samples, the higher the confidence in the result, while lower values indicate less confidence in the grouping. The 79 members of the FAD gene were divided into two subfamilies: membrane-bound FAD and soluble FAD (FAB). Membrane-bound FAD was divided into five branches (FAD2, FAD3/7/8, FAD6, ADS, and SLD), and the FAB2 subfamily was significantly separated from the membrane-bound FAD subfamily. The phylogenetic tree suggests that FAB2 and FAD may have existed in a common ancestor before the differentiation of monocots and dicots. The branch of FAD2, considered to be an ω-6 desaturase, had the most members, totaling 25, 7 of which were from tomatoes. Next was the FAB subfamily with 19 members, 7 of which were from tomatoes. FAD6 is also considered an ω-6 desaturase, and the FAD6 branch includes one member each from Arabidopsis, eggplant, and tomato. The ω-3 desaturases include FAD3, FAD7, and FAD8, with a total of nine members, three of which are from tomatoes. The SLD branch catalyzes the desaturation of sphingolipids at the ∆8 position and includes four members each from tomatoes and eggplants.

2.3. SlFAD Gene Location on Chromosomes and Gene Duplication Analysis

Based on the gene location analysis of tomatoes, it can be found that the 26 members of the tomato FAD gene family are unevenly distributed on 10 chromosomes (Figure 2), with no SlFAD distribution on chromosomes 2 and 9. The number of tomato FADs on each chromosome varies significantly, with most genes mainly located at the ends of the chromosomes and multiple tandem repeats present. Chromosome 12 has the most FAD genes located, totaling 8; followed by chromosome 6 with 7; chromosomes 1, 3, and 10 each have two; while chromosomes 4, 5, 7, 8, and 11 only have one located. This may indicate that tomatoes have experienced fragment loss during evolution, and the independent evolution and gene duplication of homologous genes have promoted the increase in the number of SlFAD members.
Gene duplication is an effective way for organisms to acquire new genes and maintain gene viability. The substitution rate of FAD homologous gene pairs was calculated using KaKs Calculator 2.0 (Table S1). The results showed that there were seven homologous gene pairs in the tomato FAD gene family. Among them, SlFAD1/SlFAD19 and SlFAD4/SlFAD10 homologous gene pairs came from chromosome segment duplications, the rest of the duplication pairs originated from tandem duplications, and the gene pairs of the tandem duplications mainly came from multiple duplication pairs on chromosome 12. The Ka/Ks of all seven homologous gene pairs of the tomato FAD gene family were <1, indicating that these homologous genes were subjected to environmental solid stresses and that gene evolution and protein function were stabilized.

2.4. Analysis of SlFAD Conserved Motifs and Gene Structure

An analysis of the conserved structural domains of the tomato FAD family resulted in a total of 10 motifs (Figure 3A), with a high degree of conservation between the same subfamily and the same branch. The evaluation analysis of the motifs indicates that the reverse motif types, quantities, and distributions of FAD proteins belonging to the same subfamily are more similar. Motifs 1, 2, 3, 4, and 7 are present in all FAD2 branches; FAD3/7/8 branches all contain motifs 4 and 7, while motifs 8, 9, and 10 are only found in the SLD branch. This suggests that genes in different branches have a close phylogenetic relationship. There are significant differences in conserved motifs between membrane-bound FAD and FAB. For example, all members of the FAB subfamily contain motifs 5 and 6, except for SlFAB6, and these two motifs only appear in the FAB subfamily. This may indicate that members of the FAD family were involved in two directions during evolution; one is the FAB subfamily, and the other is the membrane-bound FAD subfamily.
The distribution of introns/exons in each SlFAD gene family was further analyzed (Figure 3B). The results showed that SlFAD genes clustered into the same branch determined a relatively similar gene structure pattern. The number of introns in the 26 SlFAD gene family members ranged from 1 to 9, and the number of exons ranged from 1 to 10. The family members of the FAD3/7/8 branch had the most exons, all above seven. Generally, SLD members only contain one exon and no introns, which is consistent with previous studies, with the least number of exons in the SLD branch, all having one–two. In addition, SlFAD14, SLFAD2, and SLFAD13 all have only one exon. Similar FAD gene structures were found in the same branch, which also indicates that exon–intron distribution supports the phylogenetic classification of FAD. We also examined the intron phases associated with codons. Intron phases were very conserved among intragroup members, whereas intron arrangements and intron phases were significantly different between groups (Figure 3B). This may provide support for the results of phylogenetic and genomic duplication analyses. The amino acid composition of the his-box is highly conserved among members belonging to the same subfamily (Figure 4). A conserved histidine box was found in the FAB subfamily members. Except for SlFAB6, all subfamily members contain EENRH and DEKRH, while all members of the FAD subfamily contain two conserved histidine boxes, H(XX)H and H(XX)HH.

2.5. Analysis of Collinearity Relationships of SlFAD Gene Family

To further investigate the evolutionary process among different species, we characterized duplicate gene pairs among SlFAD, AtFAD, and SmFAD members (Figure 5). The colinearity results showed that all 7 FADs in tomato were colinear with the genomes of Arabidopsis and eggplant. Two of them belonged to soluble FAB gene pairs, and the rest were membrane-bound FAD gene pairs. 10 colinear gene pairs existed for 8 genes from tomato and Arabidopsis (SlFAD4/AtSLD1.1, SlFAD4/AtSLD1.2, SlFAD5/AtFAD3, SlFAD7/AtFAD7, SlFAD7/AtFAD8, SlFAD8/AtFAD6, SlFAD10/AtSLD1.1, SlFAD10/AtSLD1.2, SlFAB4/AtFAB2.2 and SlFAB7/AtFAB2.6). There were more colinear gene pairs between eggplant and tomato, with 15 colinear gene pairs among 13 genes between tomato and eggplant (SlFAD1/SmFAD3, SlFAD4/SmFAD11, SlFAB4/SmFAB2, SlFAB7/SmFAB5, SlFAD5/SmFAD22, SlFAD7/SmFAD24, SlFAD8/SmFAD27, SlFAD9/SmFAD30, SlFAD10/SmFAD6, SlFAD18/SmFAD13, SlFAD18/SmFAD17, SlFAD18/SmFAD12, SlFAD19/SmFAD3, SlFAD19/SmFAD17, and SlFAB1/SmFAD1), which may be related to the close affinity of tomato and eggplant. The 7 genes with colinear relationships with Arabidopsis also co-occurred in eggplant, suggesting that these genes may have played an important role in the evolution of the FAD family genes.

2.6. Analysis of Cis-Acting Elements in SlFAD Promoters

Further analysis was conducted on the cis-acting elements controlling the expression of the SlFAD gene family members in the upstream transcription initiation sites of SlFADs genes, identifying a total of 26 types. Based on function, they can be divided into four major categories: stress response, growth and development, light response, and hormone response (Figure 6). In stress response, the number of drought response factors (MYC, MBS, and as-1) is the highest, totaling 277. The MYC element was detected in all 26 genes and is the most numerous. Among them, there are 13 in the promoter of SlFAD8, indicating that the SlFAD8 gene may be closely related to the drought response of tomatoes. The total number of STRE elements related to stress ranks second, totaling 95. STRE elements were detected in all promoters except for SlFAD6. There are a total of 65 response elements related to anaerobic induction, and this type of element is present in the promoters of all genes except for SlFAD6 and SlFAD12. In addition, elements related to low temperature/wound, defense, and stress responses were found in the promoters of 15, 24, and 17 SlFADs, respectively. In addition, some elements related to plant growth and development responses were found. The most common are promoter elements related to seed specificity. Others include meristem expression elements (CAT-box), zein metabolism (O2-site), endosperm expression (GCN4_motif), and circadian-related cis-elements. Light response elements were identified in all SlFADs promoters. Among them, BOX4 has the most (155), followed by G-box (110). Except for SlFAD6, SlFAD8, and SlFAD11, this element can be found in all SlFADs promoters. In hormone response elements, there are the most methyl jasmonate (MeJA) response elements (132), followed by ABRE response elements (97). Response elements related to MeJA responsiveness (TGACG-motif and CGTCA-motif) were found in the promoters of 20 SlFADs. The promoters of 18, 16, and 24 SlFAD members contain salicylic acid, auxin, and ethylene response elements, respectively. In addition, all SlFAD promoters contain at least two hormone response elements.

2.7. Expression Analysis of SlFAD Genes in Different Tissues and Fruit Development Stages

The expression patterns of 24 SlFAD genes in different tissues such as mature leaves (ML), young leaves (YL), young buds (YFB), roots (ROOT), hypocotyls (HYPO), meristems (MERI), and cotyledons (COTYL) are shown in Figure 7A. The results show that family members of different subfamilies and different branches all have their specific expression patterns. The eight family members of the FAD2 branch are expressed at relatively high levels in tissues such as mature leaves, hypocotyls, meristems, cotyledons, and roots, among which SlFAD13 has the highest expression level in roots; SlFAD7 and SlFAD8 of the FAD3/7/8 branch have very high expression levels in all tissues, but the expression levels of SlFAD5 and SlFAD6 are relatively low; and all genes except SlFAD4 in the SLD branch are highly expressed. Among the members of the soluble FAD subfamily, SlFAB2, SlFAB7, and SlFAB4 are highly expressed in all tissues. In contrast, the expression levels of other members are relatively low, among which SlFAB6 is not expressed in any tissue. Among all 24 family members, SlFAD1, SlFAD8, and SlFAD10 have the highest expression levels in various tissues, indicating that these 3 genes may play a vital role in the growth and development of tomatoes.
During fruit development, in the FAD2 branch, except for the SlFAD1 gene which is highly expressed throughout the development period, the rest are only expressed 10 days after flowering (10DPA1), and are expressed at a low level or not expressed at other times(Figure 7B); the expression levels of family members of the FAD3/7/8 branch significantly increase in the early stage of fruit development (0~10DPA2), and then the gene expression levels significantly decrease; the expression pattern of family members of the SLD branch is basically consistent with that of FAD3/7/8, but the SlFAD4 gene is only highly expressed at 0DPA, and its expression level is low or basically not expressed at other times. The expression pattern of the soluble FADs subfamily is opposite to that of membrane-bound FADs. The expression levels of its members in the late stage of fruit development (20DPA~33DPA) are higher than those in the early stage, suggesting that they may play a role in the accumulation process of linoleic acid in the late stage of fruit maturity. Among all 24 family members, SlFAD1, SlFAD8, and SlFAD10 have the highest expression levels at each fruit development stage, suggesting that these three members play an important role in fruit development.

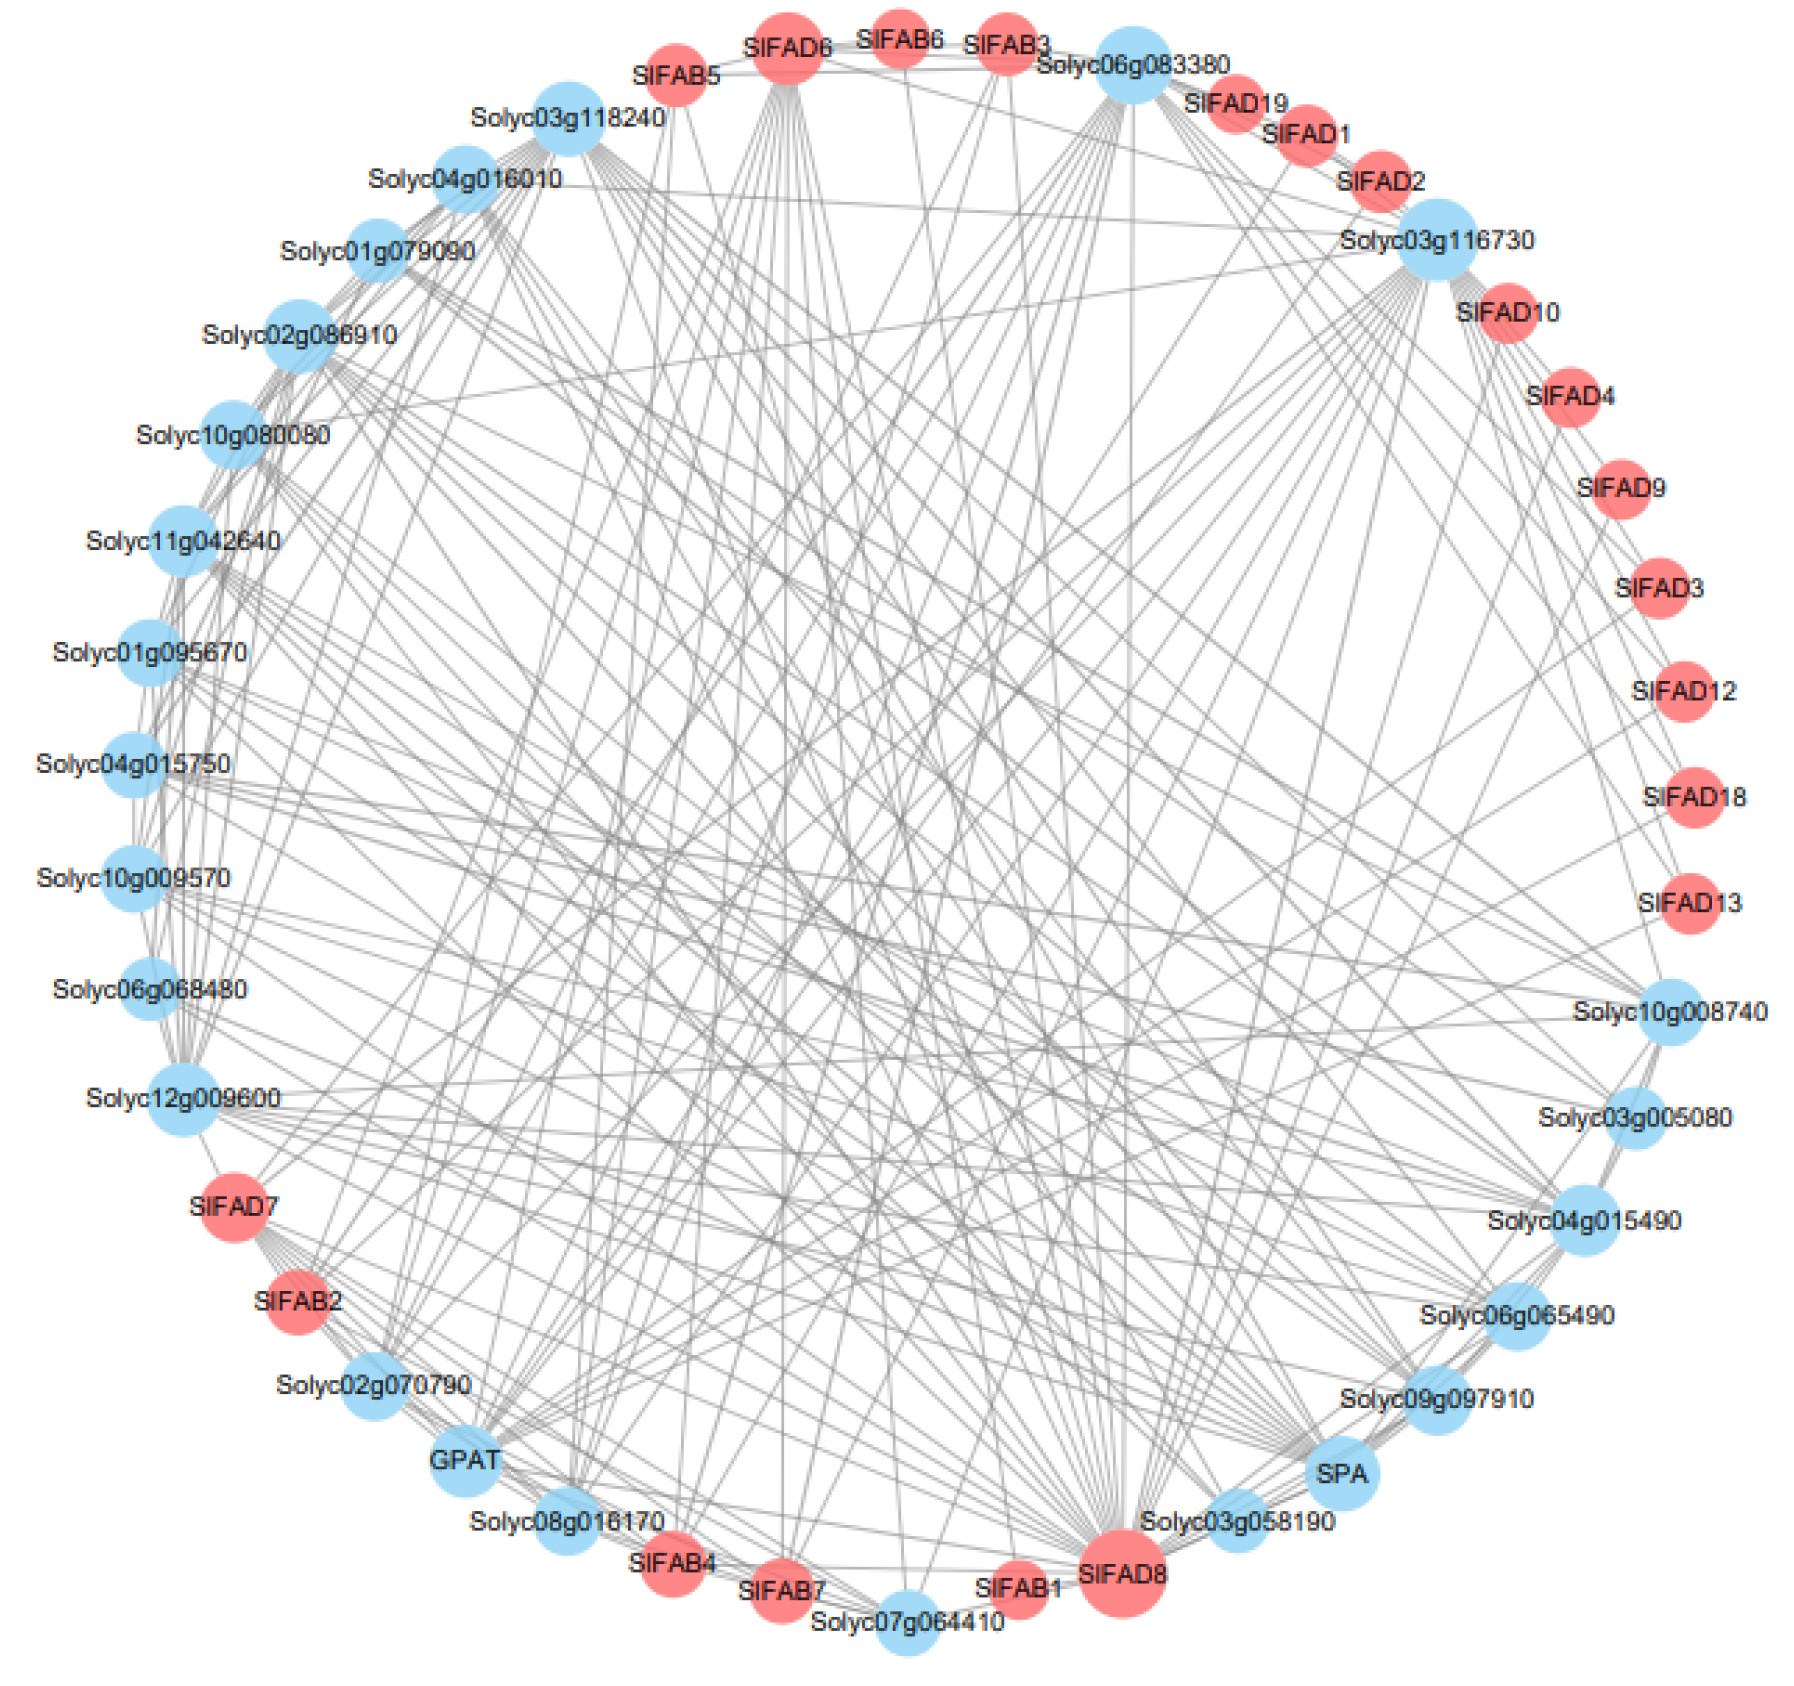
2.8. Protein–Protein Interaction Network Analysis of SlFAD Family Members

By constructing the interaction network of tomato FAD proteins, we specifically analyzed the mechanism of action of tomato FAD proteins (Figure 8). We removed some proteins with missing annotations and low degree values. The results show that the highest number of proteins interact with SlFAD8. Among them, SlFAD8 has strong interactions with SlFAD7, SlFAD6, and SlFAB4; SlFAD7 with SlFAB2, SlFAB4, and SlFAB7; and SlFAD1 with SlFAD2. SPA is a protein in which the cell wall surface antigen of Staphylococcus aureus exists. In humans and mammals, the complex formed by SPA binding to IgG also has various biological activities such as anti-phagocytosis and promoting cell division, and plays an important role in the early development of biological membranes [25]. GPAT is a type of membrane-bound enzyme that mainly participates in the storage of lipids and catalyzes the initial steps of glycerolipid biosynthesis, playing an important role in plant growth, development, and stress response [26]. There are also some proteins lacking annotations in the interaction network diagram. They have obvious direct or indirect synergistic effects with SlFAD proteins, but their functions are still unclear.

2.9. Real-Time Fluorescent Quantitative Analysis of SlFAD Genes

To study the expression pattern of the tomato FAD gene family, we analyzed the expression levels of SlFAD genes in different tissues, under abiotic stress, and under three different hormone treatments through qRT-PCR experiments (Figure 9 and Figure S1). The results show that family members of different subfamilies and different branches all have their specific expression patterns in roots, stems, and leaves. In the FAD2 branch, SlFAD12~SlFAD19 are only expressed in roots, and the expression levels are basically consistent. Except for SlFAD1 and SlFAD2, they are basically not expressed or are expressed very little in stems and leaves, which is significantly different from other gene expression patterns. The specific expression of these genes in roots indicates that they participate in root development during tomato growth and development. SlFAD7 and SlFAD8 of the FAD3/7/8 branch are highly expressed in leaves, which are 10 times and 54 times that of roots, respectively. In the SLD branch, SlFAD4 and SlFAD9 have higher expression levels in stems and leaves, and the expression levels of roots, stems, and leaves in SlFAD10 and SlFAD11 are basically consistent. It is worth mentioning that the genes SlFAB3 and SlFAB5 in the FAB subfamily are super highly expressed in stems and leaves, which are 260 times, 114 times, 245 times, and 122 times that of roots, respectively, and their expression patterns are similar.
Under the treatment of 200 mmol·L−1 NaCl simulated salt stress, many genes also produced positive responses (Figure 10 and Figure S2). The expression levels of SlFAD6, SlFAD9, and SlFAD10 were all up-regulated compared with the control group, reaching a peak at 8 h. Among them, the expression level of SlFAD9 was the most significant compared to the control, which was 33 times that of 0 h. The response levels of SlFAD1, SlFAD2, and SlFAD7 showed a trend of first increasing and then decreasing over time. The expression patterns of SlFAD14, SlFAD16, and SlFAD17 were just the opposite, with their response levels decreasing first and then increasing over time. The overall expression of members of the soluble FADs subfamily was up-regulated, and the time to reach the maximum value varied for different genes. Most genes began to show their regulatory effects after 4 h of treatment. This may indicate that members of this subfamily are closely related to tomato’s response to abiotic stress. The remaining genes were down-regulated to varying degrees.
The response mechanism of tomato FAD genes was explored using different concentrations of naphthaleneacetic acid, brassinosteroid, and melatonin (Figure 11). Through analysis, it can be found that all genes are strongly induced by EBR at a concentration of 0.1 mg·L−1 during the green mature period, indicating that it plays an important role in the early stage of fruit development (Figures S2–S6). Members in the FAD2 branch are significantly up-regulated under NAA, EBR, and MT hormone treatment as a whole, and they all show obvious regulatory effects during the color-changing period. Among them, the expression level of the SlFAD17 gene under MT treatment is the highest, which is 18 times that of the control group. Members in the FAD3/7/8 branch are generally up-regulated under different hormone treatments. What is different is that most members show significant differences in the later stage of fruit development, and the response is most intense under NAA and MT treatment at a concentration of 30 mg·L−1 and 50 mg·L−1 during the red mature period. Most members in the FAB subfamily have a more obvious effect in the early and middle stages of fruit development. Among them, the SlFAB5 gene has significant differences compared with the control group under three hormone treatments at all times, indicating that the SlFAB5 gene may regulate all stages of fruit development.

3. Discussion

Fatty acid desaturase (FAD) plays an important role in plant growth and development and plant defense [13]. Although there have been reports on the resistance of the FAD2 branch in the membrane-bound FAD subfamily to aphid pests in tomatoes, this study differs in that it identifies in the whole genome family members of tomato soluble desaturase (FAB2/SAD) and membrane-bound desaturase (FAD), and performs expression analysis in different tissues and fruit development stages, as well as expression under different exogenous hormones at four maturity stages of fruit. At the same time, we also found that SlFAD family members have a very strong response mechanism under salt stress, which will provide some theoretical support for future comprehensive research on the tomato FAD gene family. In this study, 26 members of the tomato FAD gene family were identified and analyzed. The number of members is not significantly different from that of Arabidopsis and eggplant FAD, but the number is much lower than that of wheat (68) [27], alfalfa (62) [28], and rapeseed (84) [11], indicating that the expansion of the FAD gene family has species specificity. This expansion may be related to gene duplication events [29]. Gene amplification plays a crucial role in the generation of family genes, and fragment duplication and tandem duplication are usually related to the driving force of family genes [30]. Most members of the SlFAD gene family are located in cell membranes and chloroplasts, with a few located in the endoplasmic reticulum and cytoplasm. This is consistent with the conclusion that fatty acid desaturation occurs through two different pathways in cell membranes and chloroplasts/endoplasmic reticulum, as indicated by previous studies [13].
Phylogenetic analysis shows that the FAD family is significantly divided into two subfamilies, including soluble and membrane-bound FADs, which is consistent with previous research [10]. Membrane-bound FADs can be further divided into five branches: FAD2, FAD3/7/8, ADS, FAD6, and SLD, similar to wheat [27]. Tomatoes do not contain the ADS branch, which is the same as rice and bananas, indicating that ADS may have formed after the differentiation of monocots and dicots [13]. Gene structure variation is important for gene evolution [31,32], and its stability is also a prerequisite for maintaining functional effects. Members of SlFAD in the same subfamily branch show similar intron/exon structures, and the proteins they encode have similar motif compositions. The number of conserved motifs in members of the same family branch is close (Figure 3), and the distribution of conserved motifs is similar, indicating that they may have similar functions. The number and position of conserved motifs in different branches vary greatly, indicating that members of different branches may play different roles in plant growth and development and stress response processes. Similar results were also found in rice [33], mustard [10], alfalfa [2], and Brassica napus [34], indicating that the FAD gene family is highly conserved. In addition, five SlFADs (SlFAD2, SlFAD10, SlFAD11, SlFAD14, and SlFAD13) only have one exon, which is similar to the situation where some FAD genes in rice lack introns [33]. Existing research shows that the lack of introns may be due to horizontal gene transfer, the duplication of intronless genes, or the lack of reverse transcription transposons [35]. The analysis results of conserved motifs show that all branches of FAD2 in membrane-bound FADs contain Motif1, 2, 3, 4, and 7; branches of FAD3/7/8 all contain motif4 and motif7, while motif8, 9, 10 are only found in the SLD branch. Most members of the soluble FAB subfamily contain motif5 and motif6. The distribution of conserved motifs matches the subfamily distribution of the phylogenetic tree, which once again proves the conservatism in the evolution process of the SlFAD gene family.
The study of promoter regions helps to understand the interactions and functions of genes. Transcription factors can bind to the promoters of target genes, which is also crucial for the regulation process of abiotic stress signal pathways [35]. Studies have shown that FAD genes play an important role in the regulation mechanism of abiotic stress [22]. This study found that tomato FAD family genes have a variety of cis-acting elements related to hormones and abiotic stress, suggesting that FAD family genes may participate in tomato growth and development through different hormone regulation pathways and are related to the regulation of various abiotic stress responses. In this study, cis-acting elements related to hormones (such as jasmonic acid, abscisic acid, auxin, and ethylene) and stress (such as drought, wound, stress, anaerobic, and low temperature) were identified in the promoter regions of SlFADs, indicating that the expression of SlFADs may respond to several hormones and abiotic stresses. Previous studies have suggested that FADs play an important role in enhancing plant tolerance to different environmental stresses, which is also confirmed by this study [36,37,38].
Differences in gene expression play an important role in family genes, and analyzing the expression patterns of SlFAD is beneficial to the further exploration of its characteristics and functions. The mRNA levels of FAD2/2-1 accumulated in peanut seeds and the expression levels of FAD2-2/6 and SLD1 in leaves increased [39]. BjFAD2s are expressed in all tested tissues, and CaFAD2s mainly accumulate in flowers and seeds [40]. Some LuFAD2s, LuFAD3s, and LuFAB2s in flax seeds are highly expressed at all stages of seed development, and CsFAD genes are constitutively expressed in cotyledons and leaves [40,41]. In this study, some members of the FAB subfamily showed medium or even low expression in different tissues, which is consistent with the results of Nishiuchi et al. [42]. SlFAB4 has much higher expression levels in mature leaves and cotyledons than other members, suggesting that this gene may play an important role in plant growth and development during the induction process. Members of the FAD3/7/8 branch, such as SlFAD8, show significant accumulation in mature leaves, cotyledons, young leaves, and young buds. In addition, higher transcription levels of SlFAD10 were found in hypocotyls and meristems, and SlFAD1 and FAD13 were found to be significantly expressed in roots. Overall, SlFAD gene family members are expressed in all tissues, but they are expressed at higher levels in plant leaves, which is also consistent with previous conclusions [21].
The prediction results of FAD protein interactions in tomatoes indicate that SlFAD proteins are widely involved in various stress-related pathways. They play important roles in stabilizing membrane structure, affecting the composition and accumulation of fats, and promoting plant growth and development. Among them, SPA protein is crucial for photoperiod flowering. It can regulate photoperiod flowering by controlling the stability of the flower inducer CO [43]. SPA protein can regulate gene expression in coordination with COP1, and can inhibit photomorphogenesis by regulating the abundance of downstream TFs in the light signal pathway. In addition, SPA protein may regulate many biological processes and developmental pathways in Arabidopsis in a COP1-dependent and -independent manner [44]. GPAT protein mainly participates in the synthesis of cuticular lipids, membrane lipids, and fats [45]. Cuticular lipids give plants certain mechanical strength, drought resistance, and the ability to resist pathogen invasion. Existing research has found that the overexpression of GPAT can enhance plant salt tolerance and cold tolerance [46].
This study systematically analyzes and predicts the structure and related characteristics of the tomato FAD gene family, laying a solid theoretical foundation for exploring the molecular mechanism of SlFAD in the process of tomato growth and development.

4. Materials and Methods

4.1. Experimental Materials

The material used in this study is the cultivated tomato variety M82, and the seeds were provided by the Tomato Breeding Project Team of the Institute of Horticultural Crops, Xinjiang Academy of Agricultural Sciences. Tomato seeds were germinated, and tomato seedlings with consistent growth were selected and cultured in 1/2 Hogland nutrient solution. When the tomato seedlings grew to the 4-leaf stage, they were treated with 200 mmol·L−1 NaCl solution for stress treatment. Each treatment was set up with three biological replicates, and leaf samples were taken at 0, 0.5, 2, 4, 6, 12, and 24 h after treatment. After sample collection, they were quickly frozen in liquid nitrogen and stored at −80 °C for later use.
The fruit development variety used for research is the potted seedling of cherry tomato “Jingfan Pink Star No.1”. Different concentrations of hormones were sprayed on the fruit during development, including 2,4-Epibrassinolide (EBR), naphthaleneacetic acid (NAA), melatonin (MT), and a control group (see Table 1). Fruit setting was performed at the fruit expansion stage, that is, experimental fruits for green mature stage, color-changing stage, and red mature stage have been selected. For example, when the fruit grows to the red mature stage, its fruits in the previous three stages have also been sprayed with corresponding concentrations of exogenous NAA, EBR, and MT, that is, cumulative spraying. The sprayed fruits were sampled by area at the expansion stage, green mature stage, color-changing stage, and red mature stage. Each treatment was set up with three biological replicates. After quick freezing in liquid nitrogen, they were stored at -80℃ for later use.

4.2. Data Source

The complete genome, protein sequence, and gene annotation gff files of tomatoes were downloaded online (http://solomics.agis.org.cn/tomato/) (accessed on 21 December 2022). The FAD family genes of Arabidopsis [21] were searched and downloaded (https://www.arabidopsis.org/) (accessed on 21 December 2022), and the FAD protein sequences of eggplant [23] were downloaded from (https://solgenomics.net/organism/Solanum_melongena/genome/) (accessed on 21 December 2022).

4.3. Identification and Physicochemical Property Analysis of SlFAD Gene Family

The protein sequences containing the conserved structural domains of SlFAD genes (PF00487) and (PF03405) were searched and downloaded from the Pfam database (http://pfam-legacy.xfam.org/) (accessed on 25 December 2022). The obtained protein sequences were used to build a hidden Markov model using HMMER v3.3.2 software, and the complete protein sequence of the tomato was retrieved. The ncbi-blast-2.12.0+ software was used in conjunction with the FAD protein sequence of Arabidopsis for local blastp search. The candidate protein sequences obtained by the two methods were merged, and the NCBI CD-search database (https://www.ncbi.nlm.nih.gov/search/) (accessed on 25 December 2022) and SMART database (https://smart.embl.de/) (accessed on 25 December 2022) were used for verification, finally obtaining the SlFAD family member sequences of tomatoes.
The physicochemical properties of the SlFAD gene family, including amino acid length, isoelectric point, and molecular weight, etc., were analyzed through the online website ExPASy (https://web.expasy.org/protparam/) (accessed on 25 December 2022). Subcellular localization prediction analysis was performed using the WoLF PSORT platform (https://www.genscript.com/tools/wolf-psort) (accessed on 25 December 2022).

4.4. Construction of Phylogenetic Tree and Collinearity Analysis of SlFAD Family Genes

To analyze the evolutionary relationship between different species, the MUSCLE plugin in MEGA v11.0.10 software was used for multiple sequence alignment, with parameters kept at default values. The output file was used to construct a phylogenetic tree using the maximum likelihood method (bootstrap set to 1000 times), in conjunction with two other species.
The One Step MCScanx program in TBtools v2.019 software was used to analyze the collinearity relationship between FAD family genes in different species, and then the Multiple Synteny Plot tool was used for visualization [47].

4.5. Analysis of Conserved Motifs, Gene Structure, and Chromosome Location of SlFAD

The MEME v5.10.1 online software was used to analyze the motifs of the SlFAD gene family, with the number of motifs searched set to 10. The output was visualized using TBtools software, and the specific conserved histidine sequences were analyzed using GeneDoc v2.7 software. The SlFAD family genes were searched in the gene annotation gff3 file to analyze gene structure features and locate chromosome positions. Visualization was conducted using the Visualize Gene Structure and Gene Location Visualize plugins in TBtools v2.019 software.

4.6. Analysis of Cis-Acting Elements, Interaction Networks, and Expression of SlFAD

The Gtf/Gff3 Sequences extractor program in TBtools software was used to organize the upstream sequences (2000 bp) of SlFADs genes. The organized data were used to predict their cis-acting elements using the Plant Care database. The STRING online website was used to predict protein–protein interaction relationships, and FAD gene expression data in different tissues and developmental stages were retrieved from the Tomato Functional Genome Database (TFGD).

4.7. Expression Analysis of Tomato FAD Family Genes

The method of Tiangen Biochemical Technology (Beijing, China) Co., Ltd.’s RNAprep pure plant total RNA extraction kit (DP432) was followed to extract RNA from tomato leaves, and then ChamQ Universal SYBR qPCR Master Mix (Novozan, Dhaka, Bangladesh) fluorescent quantitative reagent kit was used according to the detailed instructions provided. Specific primers for qRT-PCR analysis were designed using the DNAMAN v6.0.3.99 software online tool. PCR reactions were performed using QuantStudioTM 5 fluorescent quantitative PCR system (Thermo Fisher Scientific, Waltham, MA, USA), with a reaction system of 20 μL, using SlActin as an internal reference gene; gene-specific primers are shown in Table S2, and the amplification conditions are: 95 °C pre-denaturation for 15 min; 95 °C denaturation for 10 s, 60 °C annealing for 30 s, 40 cycles, and a melting curve program is added. The relative expression levels of genes were calculated by the 2−∆∆Ct method. Each treatment was set up with three biological replicates and three technical replicates, and t-tests were used to analyze significant differences between data.

5. Conclusions

In this study, we identified 26 FAD family genes from the tomato genome. Phylogenetic analysis shows that SlFADs can be divided into two subfamilies, including soluble FADs and membrane-bound FADs. The exon–intron composition and conserved motifs of SlFAD are similar within the same branch. In addition, the expression of SlFAD genes may be regulated by various factors, including hormones, stress, transcription factors, etc. The members of the tomato FAD gene family may be expressed directionally and maintain their main functions during evolution. Some SlFADs have potential roles in organ development and adaptive responses to stress. Our results lay a solid theoretical foundation for exploring the molecular mechanism of SlFAD in the process of tomato growth and development.

Supplementary Materials

The following supporting information can be downloaded at: https://www.mdpi.com/article/10.3390/plants12223818/s1.

Author Contributions

R.X., H.L.: Methodology, Writing—original draft. Y.C.: Methodology, Visualization. H.H., H.Z.: Investigation, Validation, Formal analysis. H.W.: Methodology, Data curation, Validation. Q.W., N.L.: Conceptualization, Writing—original draft, Writing—review and editing. All authors have read and agreed to the published version of the manuscript.

Funding

This work was financially supported by the National Natural Science Foundation of China (32260763); Project of Fund for Stable Support to Agricultural Sci-Tech Renovation (xjnkywdzc-2022001-8); National Natural Science Foundation of China, Grant No.31860554; and the Xinjiang Vegetable Crop Research System Fund (XVRS-07).

Informed Consent Statement

This article does not contain any studies with animals performed by any of the authors.

Data Availability Statement

The supporting data involved in this article are all original, and can be provided upon request.

Conflicts of Interest

The authors declare no conflict of interest.

References

  1. Aejaz, A.D.; Abhikshit, R.C.; Pavan, K.K.; Pavan, K.K.; Neelakantan, A. The FAD2 gene in plants: Occurrence, regulation, and role. Front. Plant Sci. 2017, 8, 1789. [Google Scholar]
  2. Zhang, Z.-S.; Wei, X.-Y.; Liu, W.-X.; Min, X.-Y.; Jin, X.-Y.; Boniface, N.; Wang, Y.-R. Genome-wide identification and expression analysis of the fatty acid desaturase genes in Medicago truncatula. Biochem. Biophys. Res. Commun. 2018, 499, 361–367. [Google Scholar] [CrossRef]
  3. Kim, H.; Carlos, R.-N.; Rahul, K.K.; Payal, K.; Ivan, P.; James, B.; Ralf, K.; Ye, J. Unsaturated fatty acids stimulate tumor growth through stabilization of β-catenin. Cell Rep. 2015, 13, 495–503. [Google Scholar] [CrossRef] [PubMed]
  4. Zhu, S.-S.; Zhu, Z.-Y.; Wang, H.-R.; Wang, L.; Cheng, L.-Z.; Yuan, Y.-J.; Zheng, Y.-S.; Li, D.-D. Characterization and functional analysis of a plastidial FAD6 gene and its promoter in the mesocarp of oil palm (Elaeis guineensis). Sci. Hortic. 2019, 239, 163–170. [Google Scholar] [CrossRef]
  5. Fatemeh, D.N.; Kazem, Y. Bioinformatics study of delta-12 fatty acid desaturase 2 (FAD2) gene in oilseeds. Mol. Biol. Rep. 2014, 41, 5077–5087. [Google Scholar]
  6. Shanklin, J.; Cahoon, E.B. Desaturation and related modifications of fatty acids 1. Annu. Rev. Plant Biol. 1998, 49, 611–641. [Google Scholar] [CrossRef]
  7. Dong, C.-J.; Cao, N.; Zhang, Z.-G.; Shang, Q.-M. Characterization of the fatty acid desaturase genes in cucumber: Structure, phylogeny, and expression patterns. PLoS ONE 2016, 11, e149917. [Google Scholar] [CrossRef] [PubMed]
  8. Yin, D.-D.; Xu, W.-Z.; Shu, Q.-Y.; Li, S.-S.; Wu, Q.; Feng, C.-Y.; Gu, Z.-Y.; Wang, L.-S. Fatty acid desaturase 3 (PsFAD3) from Paeonia suffruticosa reveals high α-linolenic acid accumulation. Plant Sci. 2018, 274, 212–222. [Google Scholar] [CrossRef]
  9. He, M.; Qin, C.-X.; Wang, X.; Ding, N.-Z. Plant unsaturated fatty acids: Biosynthesis and regulation. Front. Plant Sci. 2020, 11, 390. [Google Scholar] [CrossRef]
  10. Xue, Y.-F.; Chai, C.-Y.; Chen, B.-J.; Shi, X.-F.; Wang, B.-T.; Mei, F.-R.; Jiang, M.-L.; Liao, X.-L.; Yang, X.; Yuan, C.-L.; et al. Whole-genome mining and in silico analysis of FAD gene family in Brassica juncea. J. Plant Biochem. Biotechnol. 2020, 29, 149–154. [Google Scholar] [CrossRef]
  11. Xue, Y.-F.; Chen, B.-J.; Wang, R.; Aung, N.W.; Li, J.-N.; Chai, Y.-R. Genome-wide survey and characterization of fatty acid desaturase gene family in Brassica napus and its parental species. Appl. Biochem. Biotech. 2018, 184, 582–598. [Google Scholar] [CrossRef] [PubMed]
  12. Rashmi, S.; Sanjeev, K. Genome-wide identification, characterization and in-silico profiling of genes encoding FAD (fatty acid desaturase) proteins in chickpea (Cicer arietinum L.). Plant Gene 2019, 18, 100180. [Google Scholar]
  13. Cheng, C.-Z.; Liu, F.; Sun, X.-L.; Wang, B.; Liu, J.-P.; Ni, X.-T.; Hu, C.-H.; Deng, G.-M.; Tong, Z.; Zhang, Y.-Y.; et al. Genome-wide identification of FAD gene family and their contributions to the temperature stresses and mutualistic and parasitic fungi colonization responses in banana. Int. J. Biol. Macromol. 2022, 204, 661–676. [Google Scholar] [CrossRef]
  14. Wang, X.; Yu, C.; Liu, Y.; Yang, L.; Li, Y.; Yao, W.; Cai, Y.-C.; Yan, X.; Li, S.-B.; Cai, Y.-H.; et al. GmFAD3A, a ω-3 fatty acid desaturase gene, enhances cold tolerance and seed germination rate under low temperature in rice. Int. J. Mol. Sci. 2019, 20, 3796. [Google Scholar] [CrossRef] [PubMed]
  15. Zahra, H.; Amin, A.; Wei, H.; Sun, W.-B.; Ruan, H.-H.; Qiang, Z.-G.; Ali, M. Identification, evolution, expression, and docking studies of fatty acid desaturase genes in wheat (Triticum aestivum L.). BMC Genom. 2020, 10, 21. [Google Scholar]
  16. Ángela, R.; Andreu, V.; Hernández, M.L.; Lagunas, B.; Picorel, R.; Martínez, J.M.; Alfonso, M. Contribution of the different omega-3 fatty acid desaturase genes to the cold response in soybean. Exp. Bot. 2012, 63, 4973–4982. [Google Scholar]
  17. Peng, Z.-Y.; Ruan, J.; Tian, H.-Y.; Shan, L.; Meng, J.; Guo, F.; Zhang, Z.-M.; Ding, H.; Wan, S.; Li, X.-G. The family of peanut fatty acid desaturase genes and a functional analysis of four ω-3 AhFad3 members. Plant Mol. Biol. Rep. 2020, 38, 209–221. [Google Scholar] [CrossRef]
  18. Cheng, C.-Z.; Li, D.; Qi, Q.; Sun, X.-L.; Mensah, R.A.; Bodjrenou, M.D.; Zhang, Y.-Y.; Hao, X.-Y.; Zhang, Z.-H.; Lai, Z.-X. The root endophytic fungus serendipita indica improves resistance of banana to Fusarium oxysporum f. sp. cubense tropical race 4. Eur. J. Plant Pathol. 2020, 156, 87–100. [Google Scholar] [CrossRef]
  19. Jiao, S.-Q.; Zhou, J.-M.; Shang, Y.-Q.; Wang, J.-X.; Zhang, A.-J.; He, H.-B.; Zhao, Q.-Z.; Li, Y.; Yao, D. Cloning and genetic transformation of soybean fatty acid dehydrogenase GmFAD3C-1 gene. Chin. J. Oil Crop Sci. 2022, 44, 1006–1017. [Google Scholar]
  20. Zhang, M.; Barg, R.; Yin, M.-A.; Yardena, G.-D.; Alicia, L.-F.; Yehiam, S.; Sara, S.; Gozal, B.-H. Modulated fatty acid desaturation via overexpression of two distinct ω-3 desaturases differentially alters tolerance to various abiotic stresses in transgenic tobacco cells and plants. Plant J. 2005, 44, 361–371. [Google Scholar] [CrossRef]
  21. Chi, X.-Y.; Yang, Q.-L.; Lu, Y.-D.; Wang, J.-Y.; Zhang, Q.-F.; Pan, L.-J.; Chen, M.-N.; He, Y.-N.; Yu, S.-L. Genome-wide analysis of fatty acid desaturases in soybean (Glycine max). Plant Mol. Biol. Rep. 2011, 29, 769–783. [Google Scholar] [CrossRef]
  22. Wei, H.; Ali, M.; Xu, S.-Z.; Zhang, Y.-Y.; Liu, G.-Y.; Soheila, A.-D.; Mostafa, G.Z.; Zhu, S.; Yu, C.-M.; Chen, Y.-H.; et al. Genome-wide characterization and expression analysis of fatty acid desaturase gene family in poplar. Int. J. Mol. Sci. 2022, 23, 11109. [Google Scholar] [CrossRef] [PubMed]
  23. Zhu, Z.-W.; Zhang, A.-D.; Wu, X.-X.; Zha, D.-S. Identification and bioinformatics analysis of fatty acid desaturase (FAD) gene family in eggplant (Solanum melongena L.). Mol. Plant Breed. 2023, 21, 2453–2463. [Google Scholar]
  24. Liu, W.; Li, W.; He, Q.-L.; Muhammad, K.D.; Chen, J.-H.; Zhu, S.-J. Characterization of 19 genes encoding membrane-bound fatty acid desaturases and their expression profiles in Gossypium raimondii under low temperature. PLoS ONE 2015, 10, e0123281. [Google Scholar] [CrossRef] [PubMed]
  25. Yang, C.-L.; Qi, C.-Y.; Ma, Y.-H.; Xiong, H.-Y.; Duan, R.-J. Identification and expression analysis of GPAT gene family in hulless barley. Plant Physiol. J. 2022, 58, 2006–2016. [Google Scholar]
  26. Sascha, L.; Virginie, M.; José, G.; Stephan, W.; Jessika, A.; Seonghoe, J.; Carmen, K.; Helen, B.; George, C.; Ute, H. Arabidopsis SPA proteins regulate photoperiodic flowering and interact with the floral inducer constans to regulate its stability. Development 2006, 133, 3213–3222. [Google Scholar]
  27. Zhang, Z.-S.; Jin, X.-Y.; Liu, Z.-P.; Zhang, J.-Y.; Liu, W.-X. Genome-wide identification of FAD gene family and functional analysis of MsFAD3.1 involved in the accumulation of-linolenic acid in alfalfa. Crop Sci. 2020, 61, 566–579. [Google Scholar] [CrossRef]
  28. Deborah, A.J.; Michael, A.T. The monosaccharide transporter gene family in Arabidopsis and rice: A history of duplications, adaptive evolution, and functional divergence. Mol. Biol. Evol. 2012, 24, 2412–2423. [Google Scholar]
  29. Steven, B.C.; Arvind, M.; Andrew, B.; Nevin, D.Y.; Georgiana, M. The roles of segmental and tandem gene duplication in the evolution of large gene families in Arabidopsis thaliana. BMC Plant Biol. 2004, 4, 10. [Google Scholar]
  30. Cao, J.; Shi, F. Evolution of the RALF gene family in plants: Gene duplication and selection patterns. Evol. Bioinform. 2012, 8, 271–292. [Google Scholar] [CrossRef]
  31. Xu, L.; Zeng, W.-J.; Li, J.-J.; Liu, H.; Yan, G.-J.; Si, P.; Yang, C.; Shi, Y.; He, Q.-L.; Zhou, W.-J. Characteristics of membrane-bound fatty acid desaturase (FAD) genes in Brassica napus L. and their expressions under different cadmium and salinity stresses. Environ. Exp. Bot. 2019, 162, 144–156. [Google Scholar] [CrossRef]
  32. Li, N.; He, Q.; Wang, J.; Wang, B.-K.; Zhao, J.-T.; Huang, S.-Y.; Yang, T.; Tang, Y.-P.; Yang, S.-B.; Aisimutuola, P.; et al. Super-pangenome analyses highlight genomic diversity and structural variation across wild and cultivated tomato species. Nat. Genet. 2023, 55, 852–860. [Google Scholar] [CrossRef] [PubMed]
  33. Chen, C.; Yang, J.-Y.; Tong, H.-H.; Li, T.-T.; Wang, L.; Chen, H.-Q. Genome-wide analysis of fatty acid desaturase genes in rice (Oryza sativa L.). Sci. Rep. 2019, 9, 19445. [Google Scholar]
  34. Huang, W.; Xian, Z.-Q.; Kang, X.; Tang, N.; Li, Z.-G. Genome-wide identification, phylogeny and expression analysis of GRAS gene family in tomato. BMC Plant Biol. 2015, 15, 209. [Google Scholar] [CrossRef] [PubMed]
  35. Zhang, R.; Huang, J.-J.; Xie, X.-L.; Luo, Z.-Y. Structure and function of the plant PDR-type ABC transporter protein. Chem. Life 2011, 31, 112–119. [Google Scholar]
  36. Huang, J.-X.; Xue, C.-W.; Wang, H.; Wang, L.-S.; Schmidt, W.; Shen, R.-F.; Lan, P. Genes of acyl carrier protein family show different expression profiles and overexpression of acyl carrier protein 5 modulates fatty acid composition and enhances salt stress tolerance in Arabidopsis. Front. Plant Sci. 2017, 8, 987. [Google Scholar] [CrossRef]
  37. Yang, J.I.; Oksoo, H.; Gap, C.C.; Baik, H.C. Antisense expression of an Arabidopsis omega-3 fatty acid desaturase gene reduces salt/drought tolerance in transgenic tobacco plants. Mol. Cells 2002, 13, 264–271. [Google Scholar]
  38. Jin, X.-L.; An, J.-B.; Qi, D.-S.; Qiao, F.; Jiang, D.; Du, S.-B.; Ji, S.; Xie, H.-C. Identification and expression pattern analysis of FAD gene family in Populus tomentosa. Mol. Plant Breed. 2023, 1–23. [Google Scholar] [CrossRef]
  39. Kim, H.; Go, Y.S.; Kim, A.Y.; Lee, S.; Kim, K.-N.; Lee, G.-J.; Kim, G.-J.; Suh, M.C. Isolation and functional analysis of three microsomal delta-12 fatty acid desaturase genes from Camelina sativa (L.). Plant Biochem. 2014, 41, 146–158. [Google Scholar]
  40. Ashwini, V.R.; Narendra, Y.K.; Sanjay, P.B.; Abhay, M.H.; Prakash, B.G.; Vidya, S.G. Differential transcriptional activity of SAD, FAD2 and FAD3 desaturase genes in developing seeds of linseed contributes to varietal variation in α-linolenic acid content. Phytochemistry 2014, 98, 41–53. [Google Scholar]
  41. Nishiuchi, T.; Hamada, T.; Kodama, H.; Iba, K. Wounding changes the spatial expression pattern of the arabidopsis plastid omega-3 fatty acid desaturase gene (FAD7) through different signal transduction pathways. Plant Cell 1997, 9, 1701–1712. [Google Scholar] [CrossRef] [PubMed]
  42. Guan, X.-W.; Tian, Y.; Wei, L.-H. Research progress of relationship between Staphylococcus aureus surface protein and the biofilm. China Mod. Med. 2022, 29, 29–32. [Google Scholar]
  43. Vinh, N.P.; Inyup, P.; Ute, H.; Enamul, H. Genomic evidence reveals SPA-regulated developmental and metabolic pathways in dark-grown Arabidopsis seedlings. Physiol. Plant. 2020, 169, 380–396. [Google Scholar]
  44. Chen, W.-L.; Zhang, Q.-Q.; Tang, S.-H.; Gong, W.; Hong, Y.-Y. Glycerol-3-phosphate acyltransferase in lipid metabolism, growth and response to stresses in plants. Plant Physiol. J. 2018, 54, 725–735. [Google Scholar]
  45. Yang, C.-L.; Duan, R.-J.; Wu, X.-X.; Qi, C.-Y.; Ma, Y.-H.; Xiong, H.-Y. Genome-wide identification, sequence variation, and expression of the GPAT gene family in Medicago truncatula. Pratacultural Sci. 2021, 38, 1966–1974. [Google Scholar]
  46. Wang, B.-K.; Wang, J.; Yang, T.; Wang, J.-X.; Dai, Q.; Zhang, F.-L.; Xi, R.; Yu, Q.-H.; Li, N. The transcriptional regulatory network of hormones and genes under salt stress in tomato plants (Solanum lycopersicum L.). Front. Plant Sci. 2023, 14, 1115593. [Google Scholar] [CrossRef] [PubMed]
  47. Chen, C.-J.; Chen, H.; Zhang, Y.; Thomas, H.-R.; Frank, M.-H.; He, Y.-H.; Xia, R. TBtools: An integrative toolkit developed for interactive analyses of big biological data. Mol. Plant 2020, 13, 1194–1202. [Google Scholar] [CrossRef]
Figure 1. Phylogenetic tree of FAD genes. At: Arabidopsis; Sl: tomato; Sm: eggplant. FAD3/7/8: δ-15 desaturase; FAB: stearoyl-ACP desaturase; FAD2/FAD6: δ-12 desaturase; ADS/SLD: anterior end desaturase.
Plants 12 03818 g001
Figure 2. Distribution of SlFAD gene family members on chromosomes. Different colors indicate different gene densities; the redder the color, the greater the gene density; the bluer the color, the lower the gene density.
Plants 12 03818 g002
Figure 3. Conserved motifs and structural characterization of SlFAD. (A) The 10 conserved motifs of the SlFAD protein are represented by colored rectangles, and different branches are marked with different background colors. (B) Gene structure of SlFAD: CDS indicates coding region; UTR indicates non-coding region; Intron indicates intron.
Plants 12 03818 g003
Figure 4. SlFAD conserved sequence analysis. Sequence comparison was performed using DNAMAN, and the 3 conserved histidine motifs were marked with red boxes.
Plants 12 03818 g004
Figure 5. Co-lineage pairs of the tomato FAD gene with Arabidopsis and eggplant. Red lines highlight homologous gene pairs of SlFAD genes with Arabidopsis, and gray lines indicate genome-wide covariate gene pairs.
Plants 12 03818 g005
Figure 6. The number of cis-acting elements included in the promoters of SlFADs. The number of cis-acting elements involved in different regulatory pathways varies. A darker red color indicates a higher number of cis-acting elements and a lighter red color indicates a lower number of cis-acting elements. Different background colors indicate different types of response elements.
Plants 12 03818 g006
Figure 7. Analysis of expression patterns of SlFADs in different tissues and during fruit development. (A): expression patterns of SlFADs in different tissues; (B): expression patterns of SlFADs in different fruit development periods; COTYL: cotyledons; ML: mature leaves; YL: young leaves, YFB: young buds; ROOT: roots; HYPO: hypocotyls; MERI: meristematic tissues; DPA: days after anthesis.
Plants 12 03818 g007
Figure 8. Member of the SlFAD gene family protein–protein interaction network. Each node is a protein. Each gray line represents interaction presence, and node size indicates the number of interactions. Red nodes represent SlFAD proteins and blue nodes represent proteins that interact with SlFAD.
Plants 12 03818 g008
Figure 9. Expression analysis of SlFAD gene in roots, stems, and leaves. R: roots; S: stems; L: leaves. a–c: highly significant level of difference (p < 0.01). Error bars show the standard deviation of three biological replicates.
Plants 12 03818 g009
Figure 10. Analysis of SlFAD gene expression in leaves under salt stress. a–e: Difference at highly significant level (p < 0.01). Error bars show the standard deviation of three biological replicates.
Plants 12 03818 g010
Figure 11. Expression analysis of SlFAD gene under hormonal stress during fruit development. a–d: Differences were at highly significant level (p < 0.01). Error bars show the standard deviation of the three biological replicates. EP: expansion stage; MG: green ripening stage; BP: color change stage; RRP: red ripening stage.
Plants 12 03818 g011
Table 1. Physicochemical properties and subcellular localization of SlFADs.
Gene IDNameAmino Acid NumberMolecular WeightIsoelectric PointFat IndexHydrophilic/Hydrophobic ProteinsSubcellular Localization
Solyc01T000115.1SlFAD138343,801.588.7090.05Hydrophiliccyto
Solyc03T001114.1SlFAD237843,710.228.0487.59Hydrophilicplas
Solyc04T000841.1SlFAD377189,844.768.5692.14Hydrophilicplas
Solyc05T002114.1SlFAD443950,630.558.6288.18Hydrophobicplas
Solyc06T000108.1SlFAD537743,959.968.9090.69Hydrophilicplas
Solyc06T000109.1SlFAD637744,085.128.4590.69HydrophilicE.R.
Solyc06T000998.1SlFAD743549,659.737.7883.59Hydrophilicchlo
Solyc07T000048.1SlFAD844150,592.878.8489.37HydrophilicE.R.
Solyc08T001312.1SlFAD944751,626.608.6484.79Hydrophobicplas
Solyc10T000506.1SlFAD1043950,655.638.7089.70Hydrophobicplas
Solyc10T000508.1SlFAD1143950,577.548.6889.93Hydrophobicplas
Solyc12T002062.1SlFAD1273686,023.568.6988.22Hydrophilicplas
Solyc12T002837.1SlFAD1337943,983.438.0995.67Hydrophilicchlo
Solyc12T002836.1SlFAD1437943,855.478.7989.26HydrophilicE.R.
Solyc12T002838.1SlFAD1540647,182.438.9090.52Hydrophilicplas
Solyc12T002060.1SlFAD1639946,814.108.6794.31Hydrophilicplas
Solyc12T002061.1SlFAD1739946,814.108.6794.31Hydrophilicplas
Solyc12T002056.1SlFAD1826831,033.899.0296.04Hydrophiliccyto
Solyc12T002835.1SlFAD1962770,440.218.9996.73Hydrophobiccyto
Solyc01T000424.1SlFAB133037,729.035.7269.15Hydrophilicchlo
Solyc03T001283.1SlFAB239344,830.146.1477.43Hydrophilicchlo
Solyc06T001235.1SlFAB376087,195.346.1385.33Hydrophilicchlo
Solyc06T001110.1SlFAB439745,237.556.0479.65Hydrophilicchlo
Solyc06T001237.1SlFAB538744,425.987.0385.17Hydrophilicchlo
Solyc06T000610.1SlFAB616618,924.748.3174.04Hydrophiliccyto
Solyc11T000349.1SlFAB739344,534.046.2483.38Hydrophilicchlo
chlo: chloroplast; cyto: cytoplasm; E.R.: endoplasmic reticulum; plas: cell membrane.
Disclaimer/Publisher’s Note: The statements, opinions and data contained in all publications are solely those of the individual author(s) and contributor(s) and not of MDPI and/or the editor(s). MDPI and/or the editor(s) disclaim responsibility for any injury to people or property resulting from any ideas, methods, instructions or products referred to in the content.

