
Optimizing Nitrogen Application for Jojoba under Intensive Cultivation
 , , , , and
Abstract
:1. Introduction
2. Results
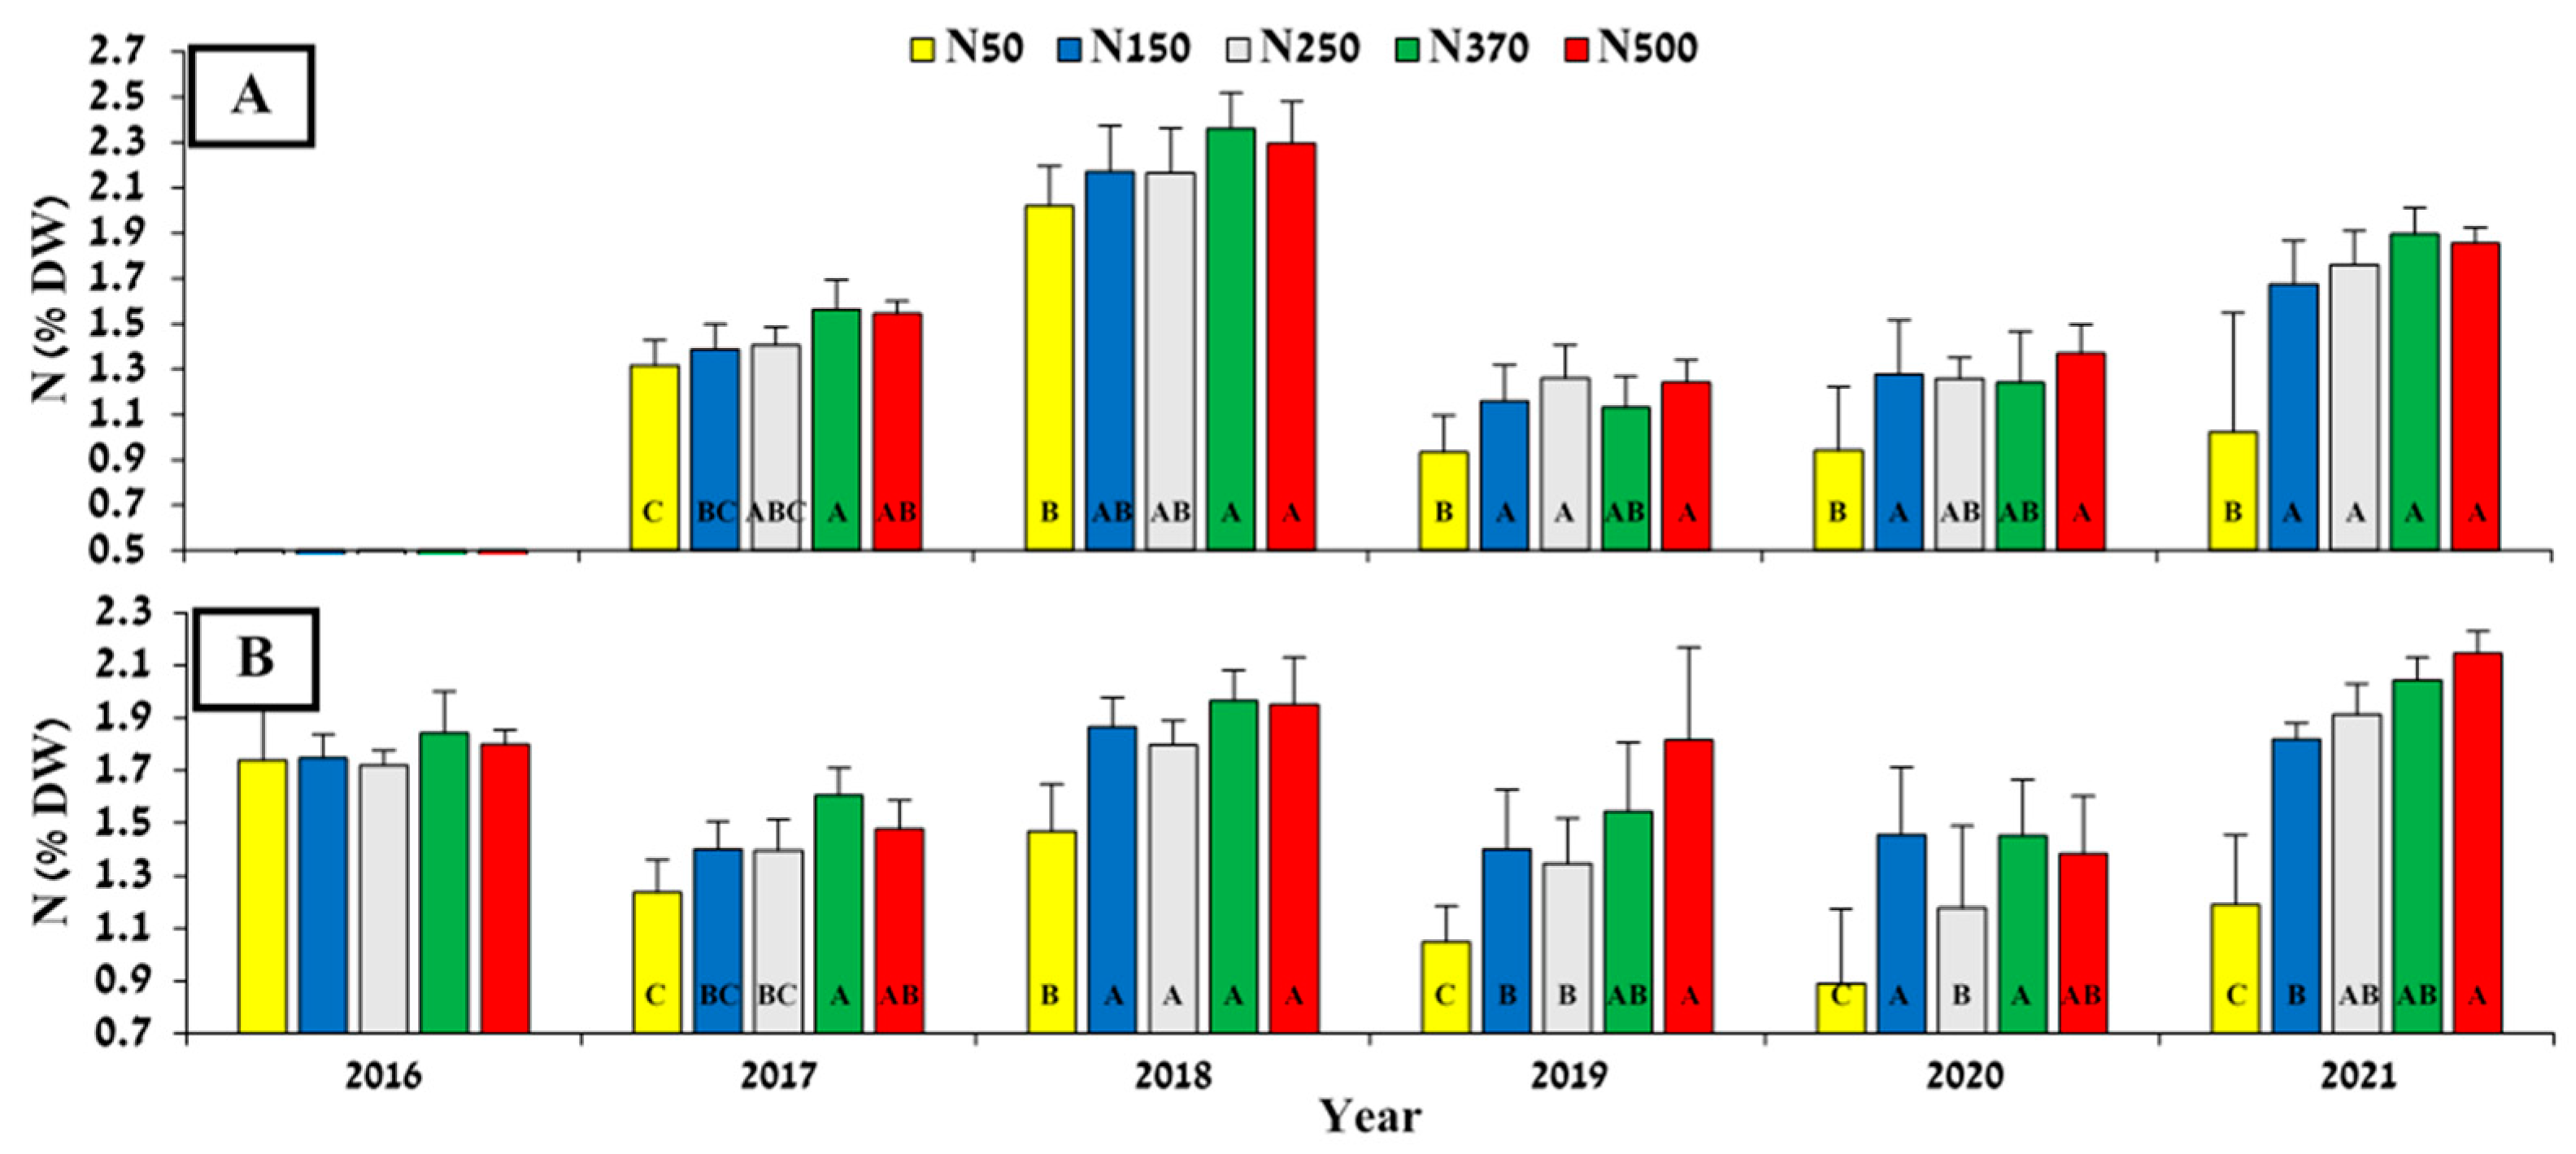
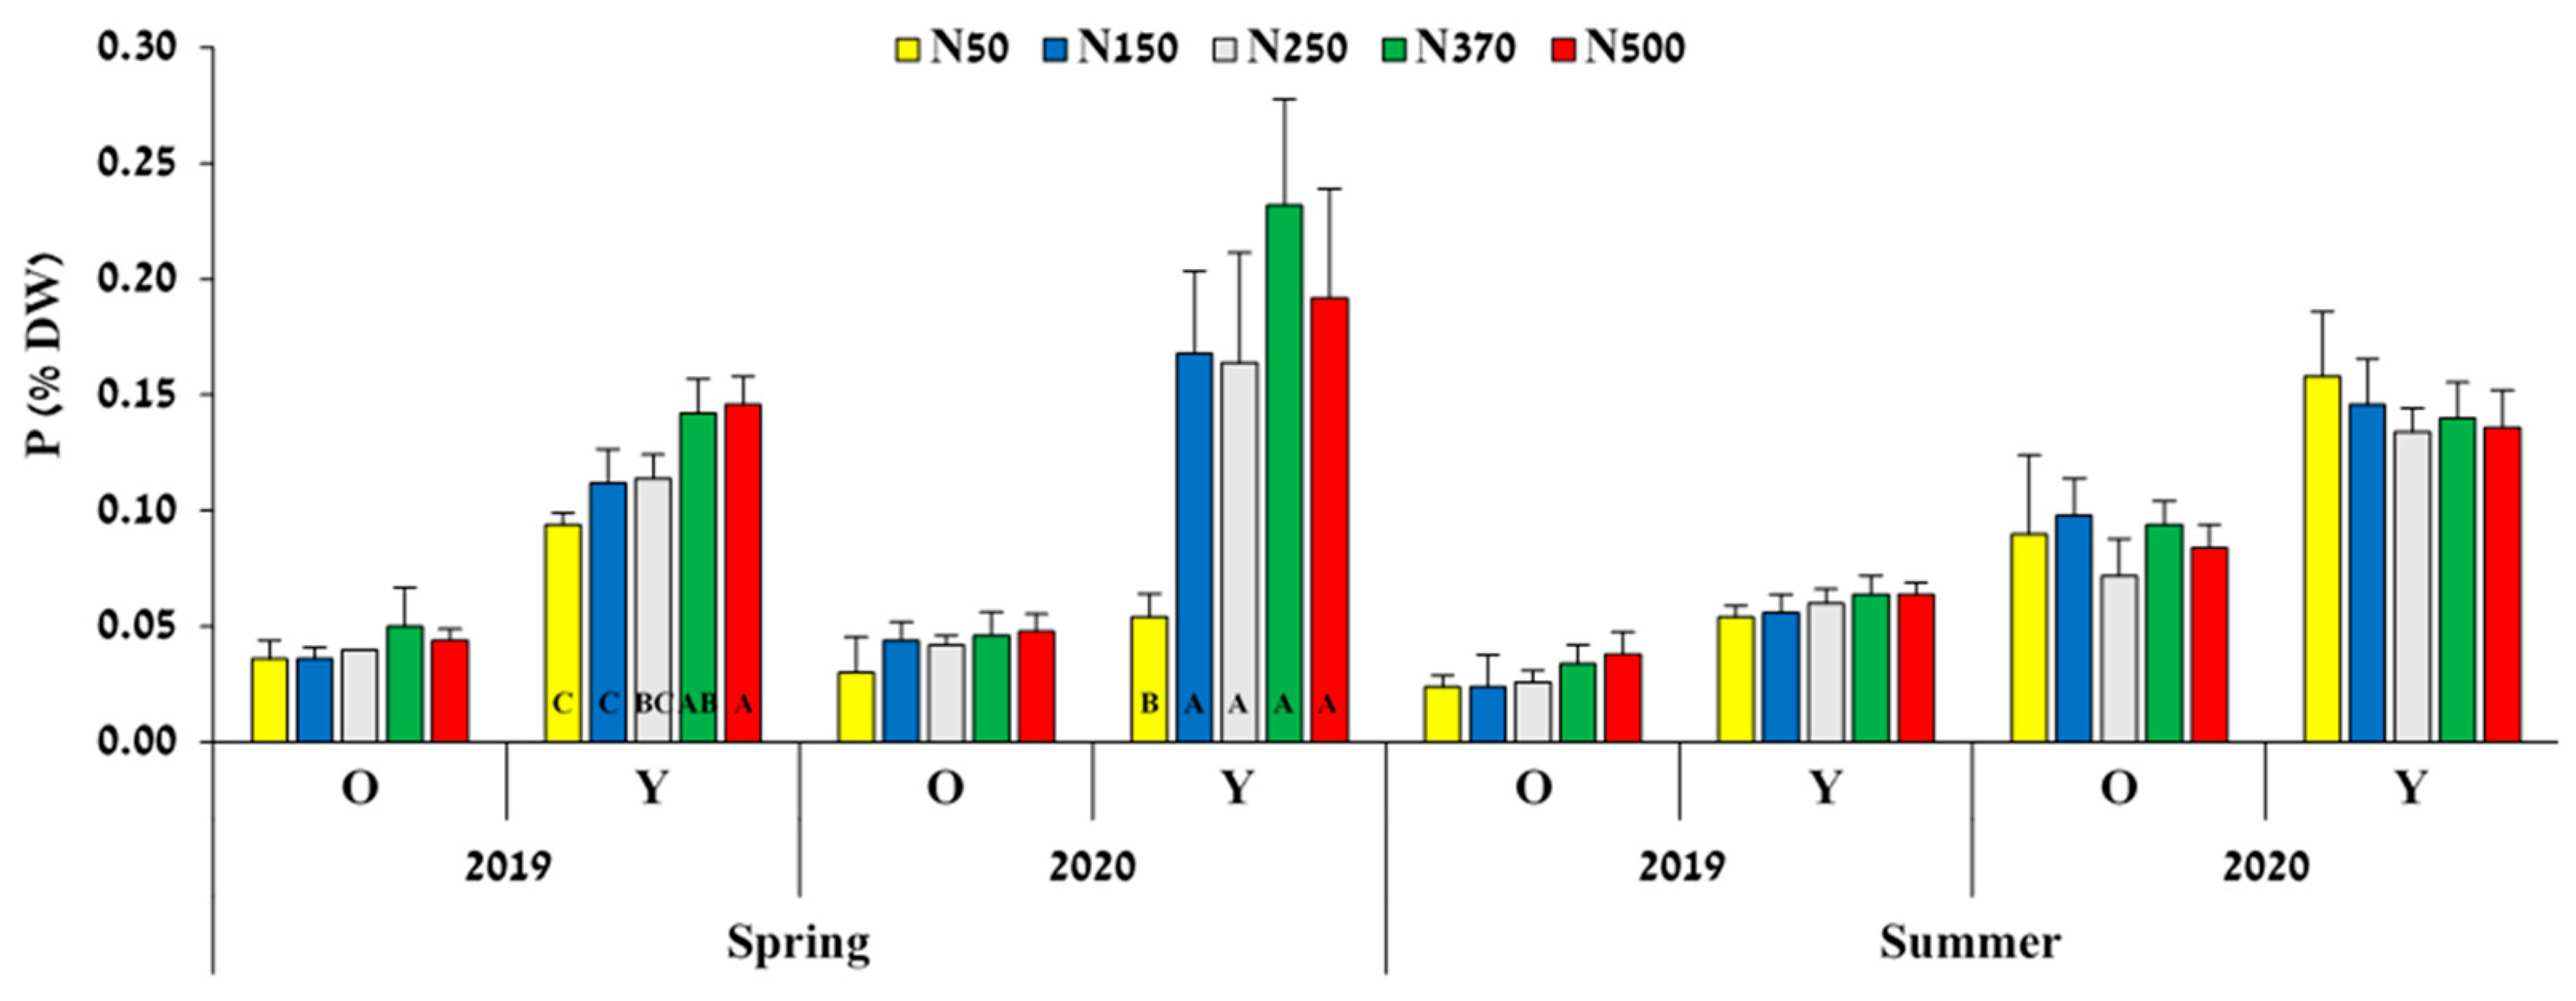
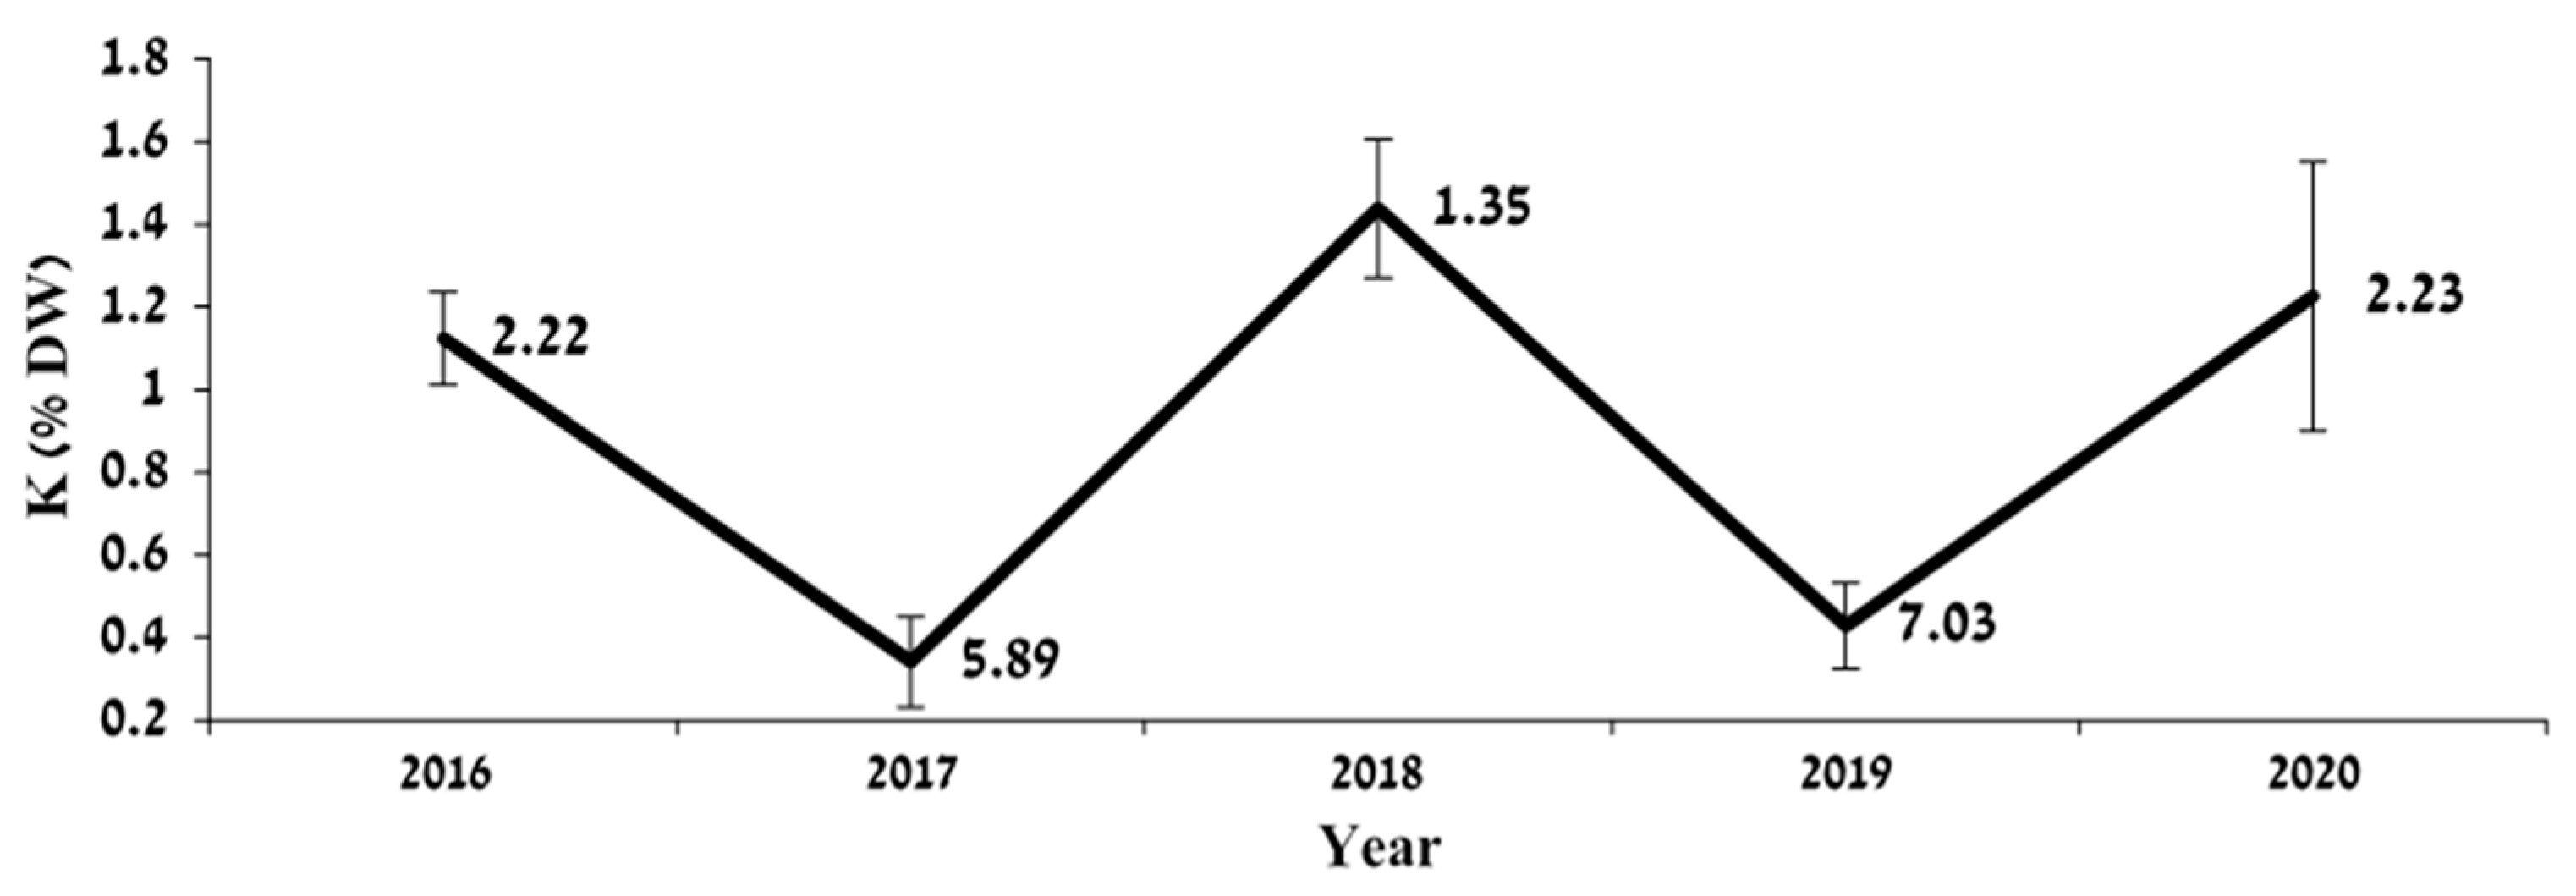
2.1. Leaf Analysis
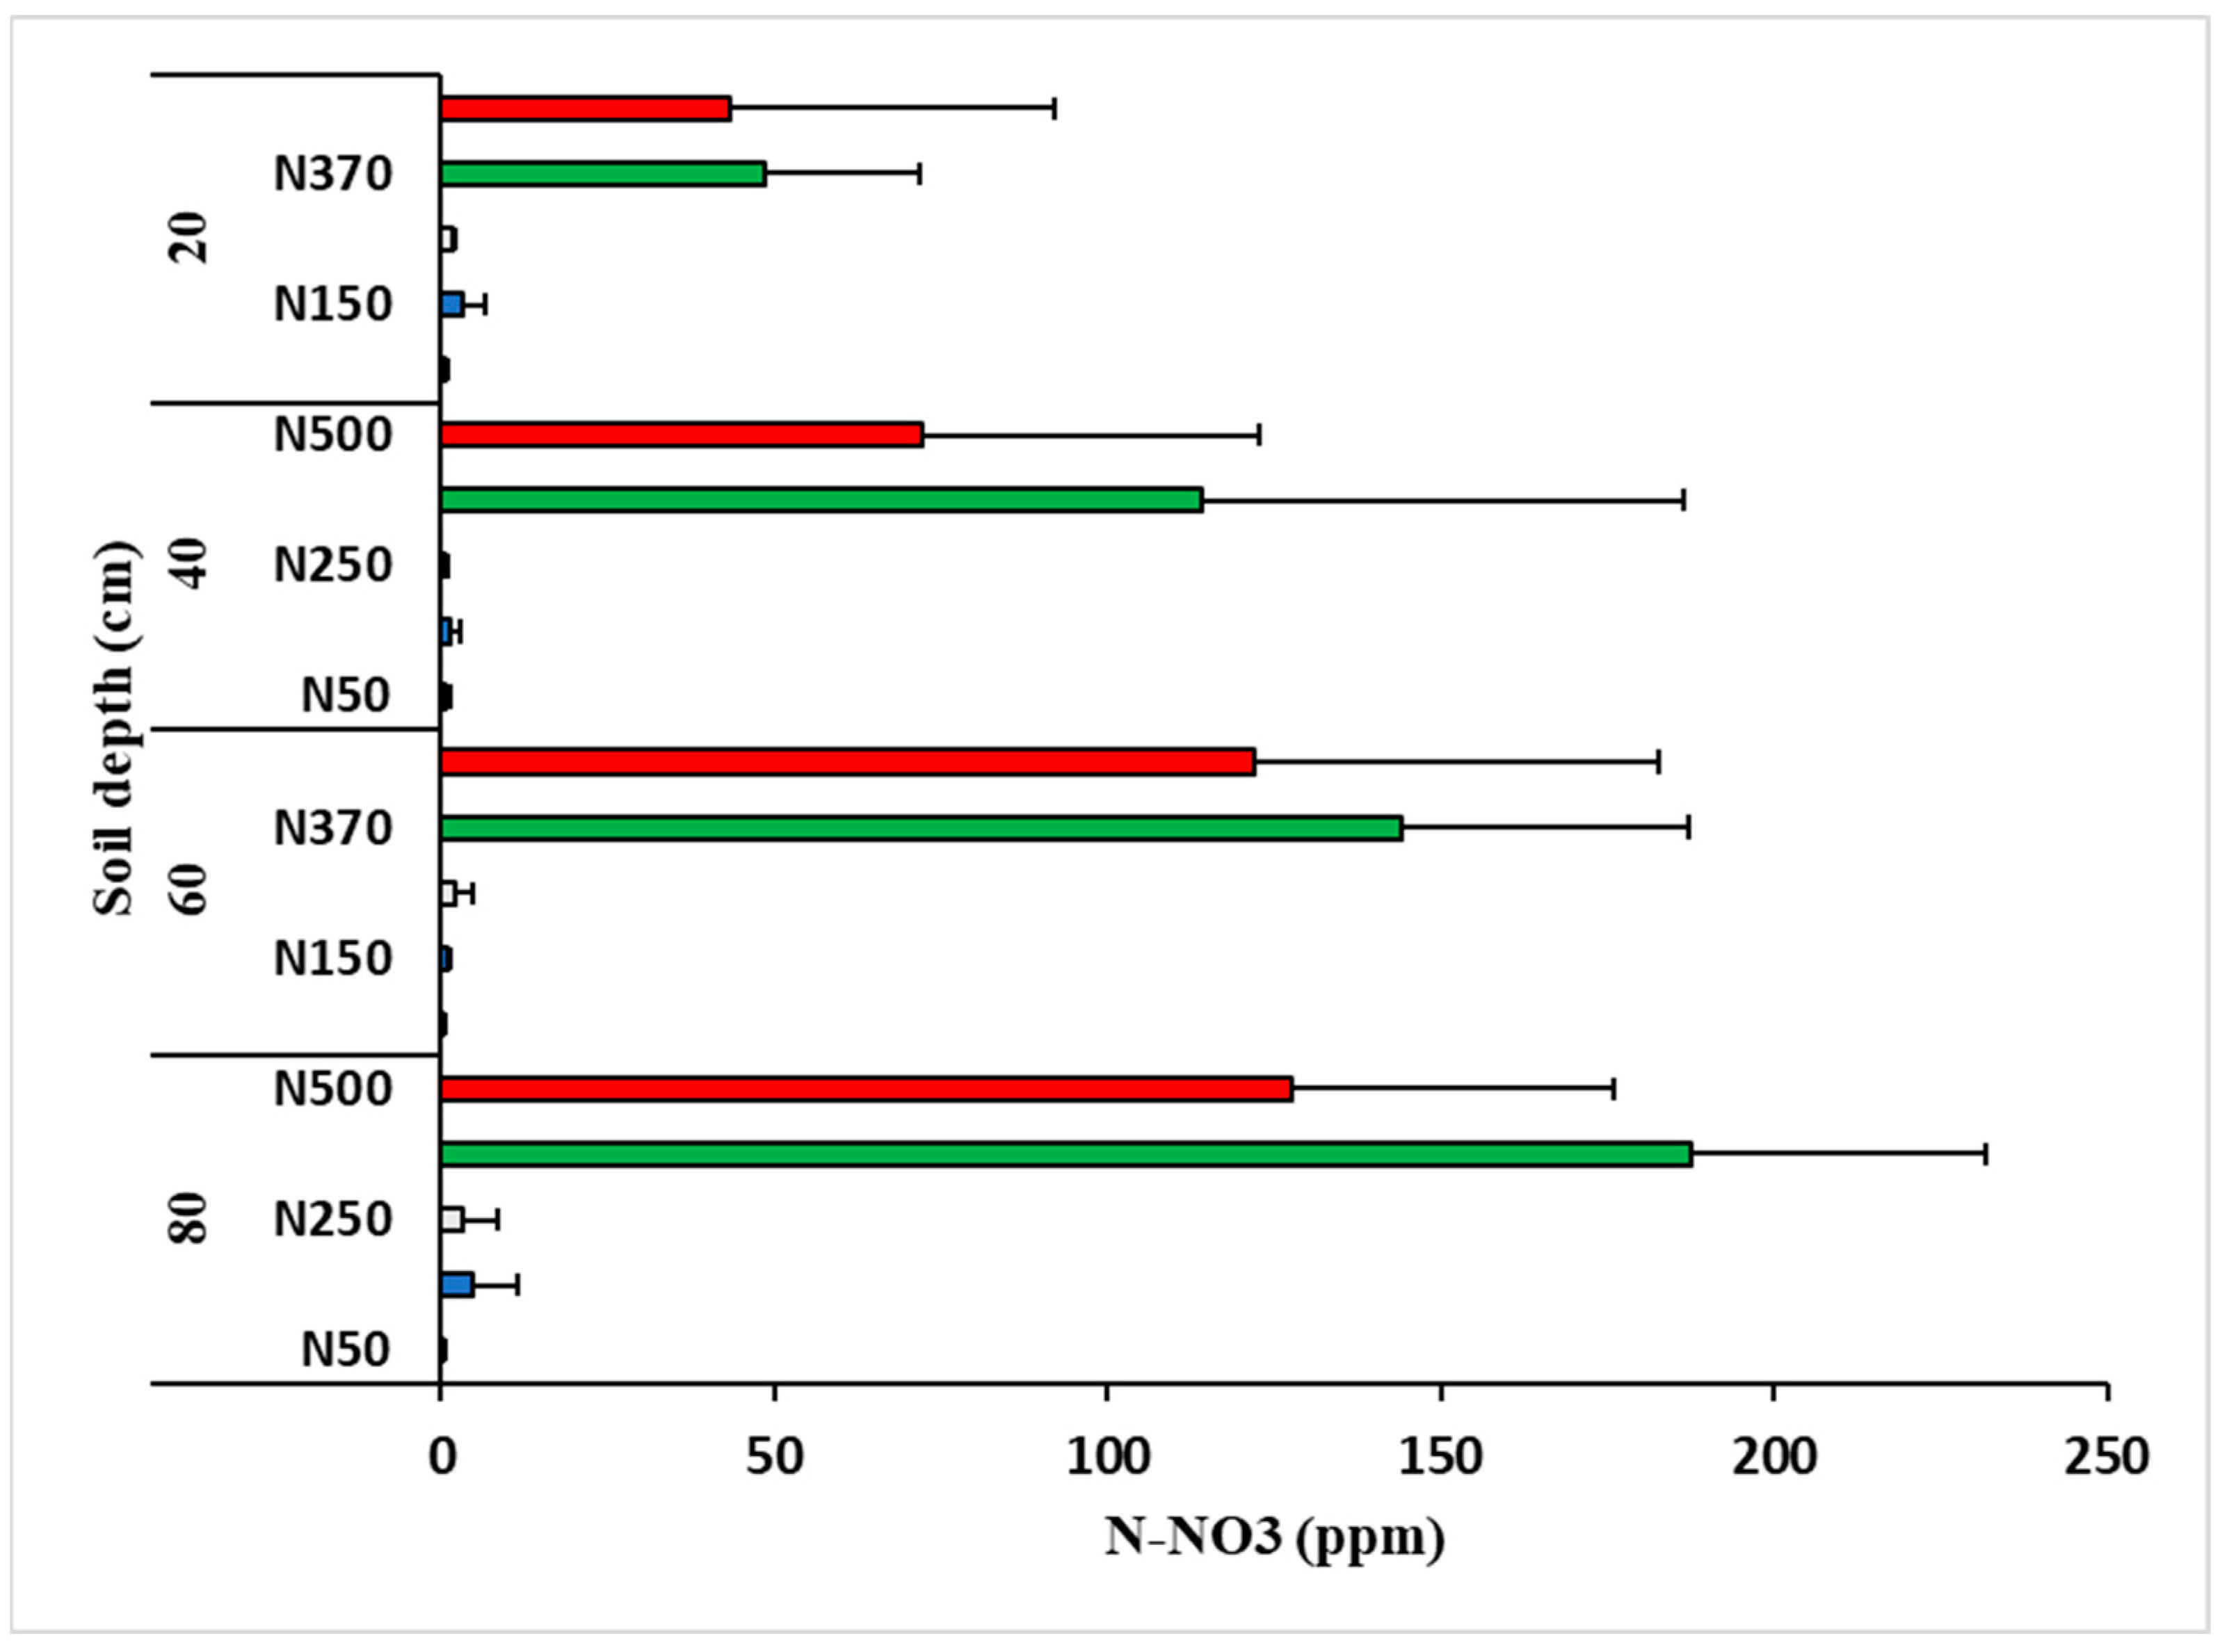
2.2. Soil Nitrogen
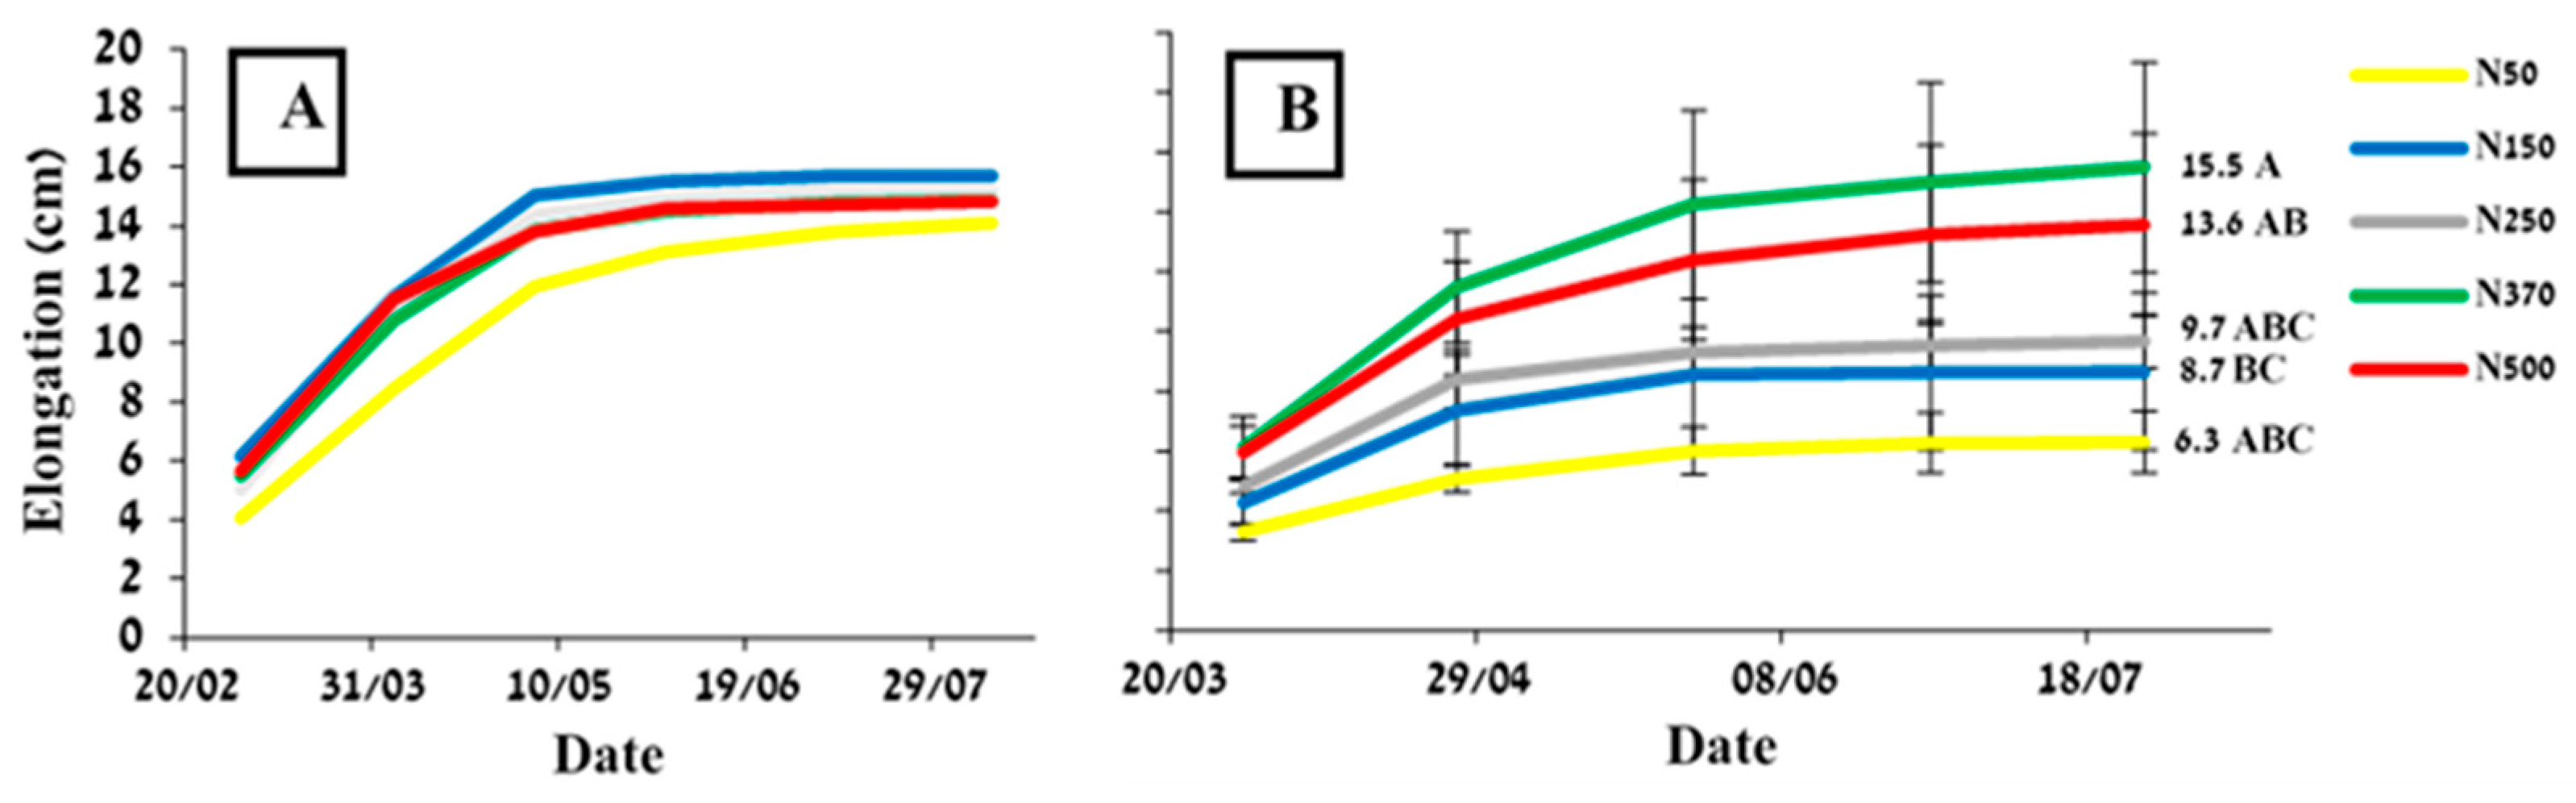
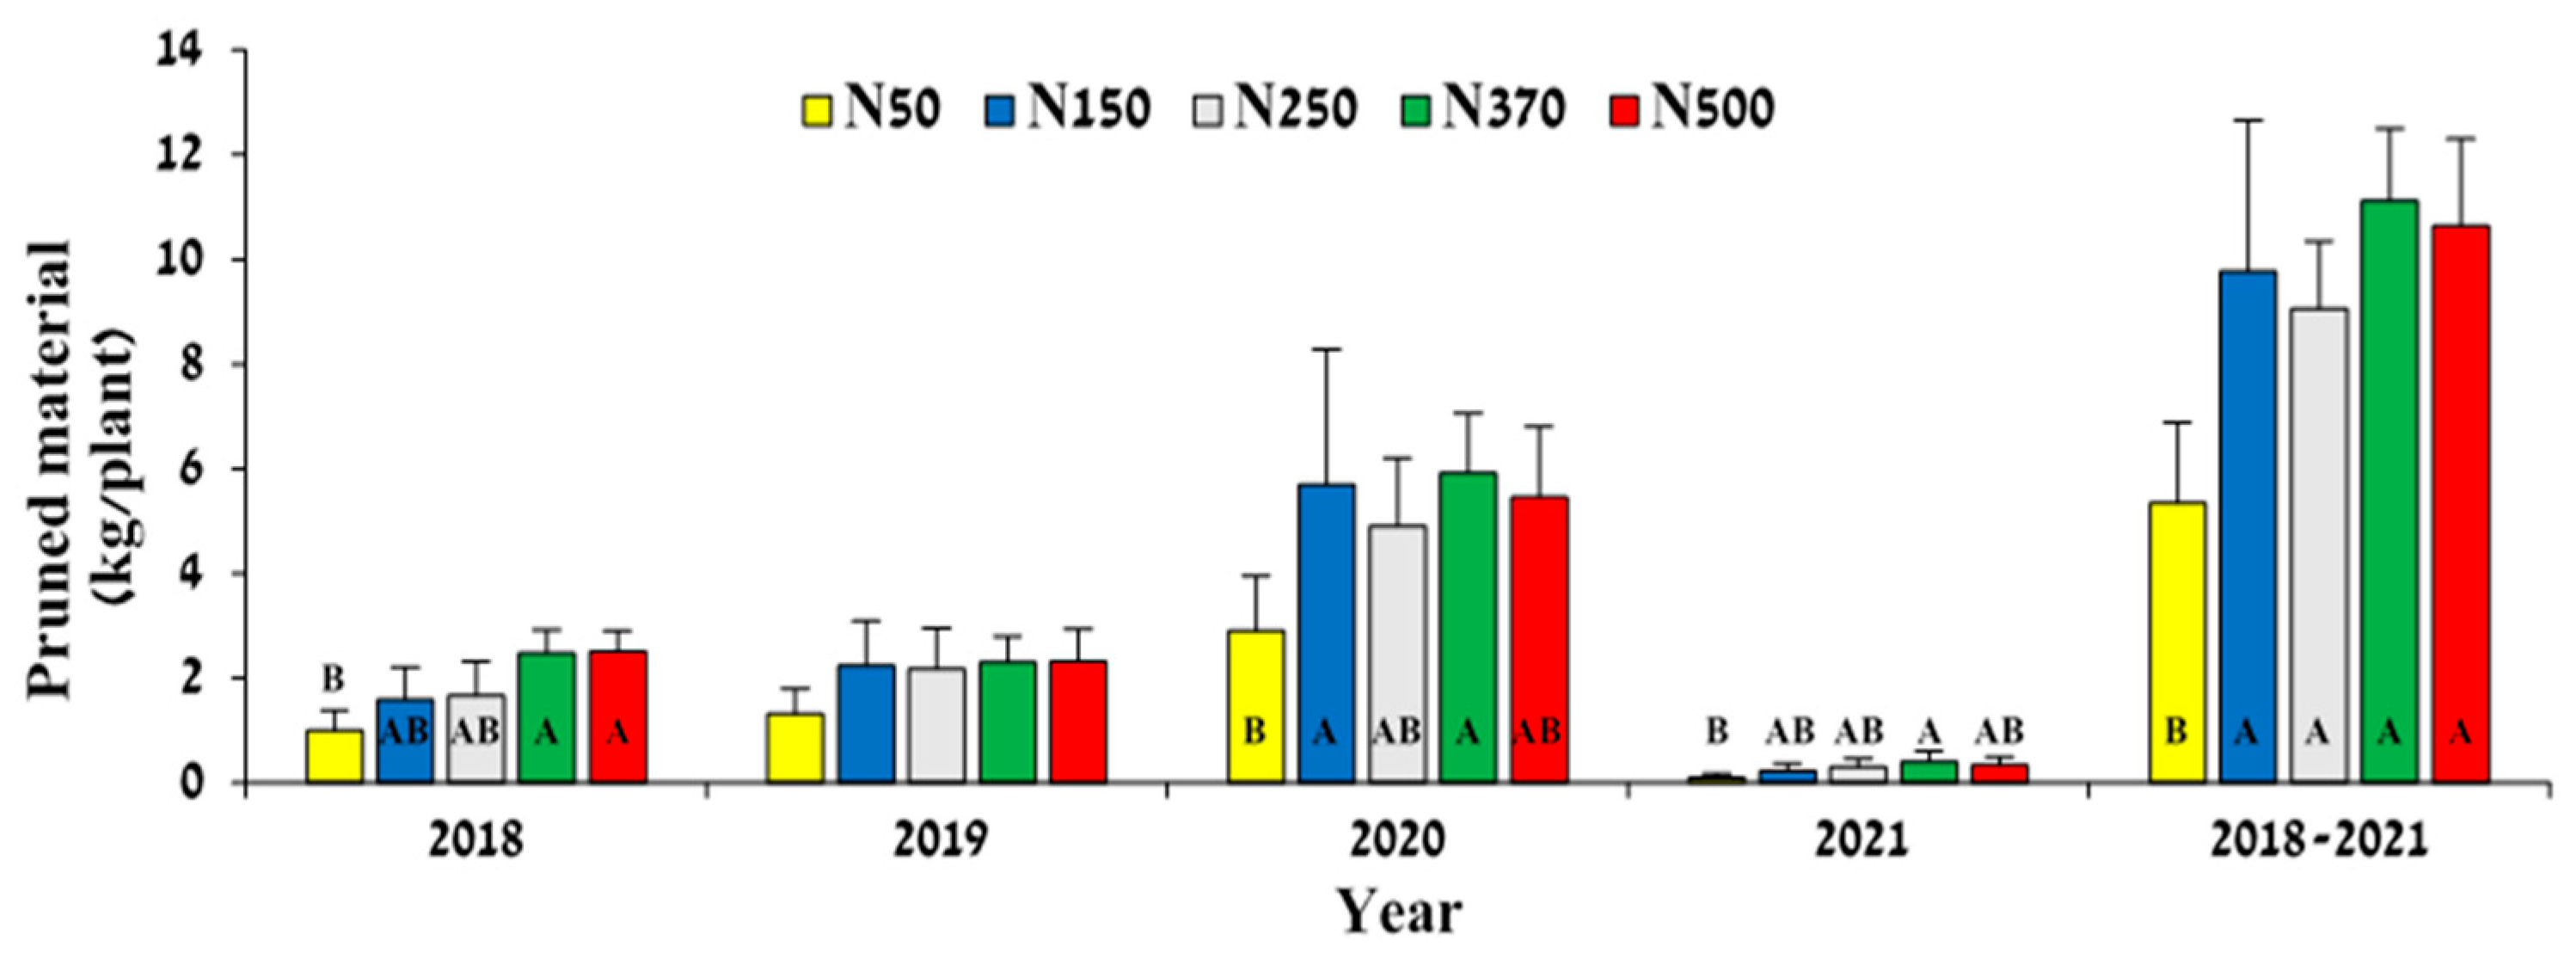
2.3. Vegetative Growth
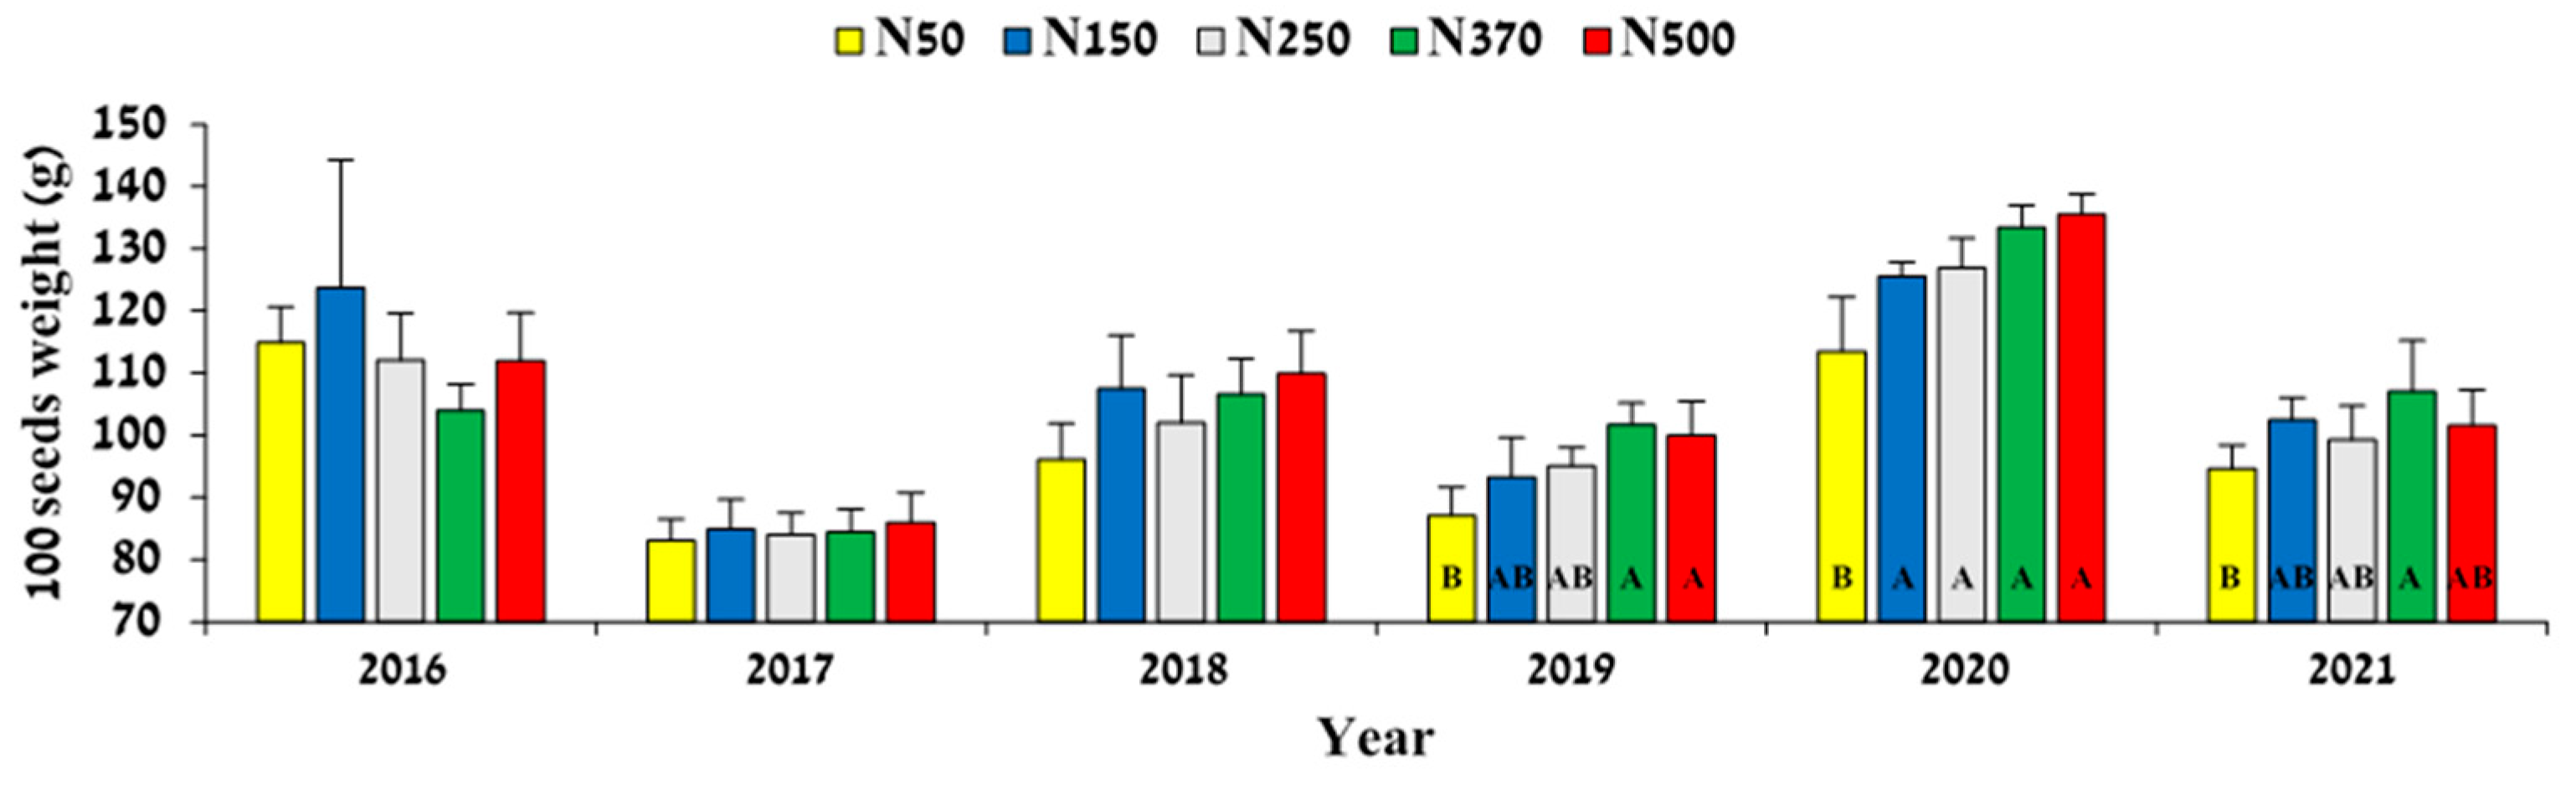
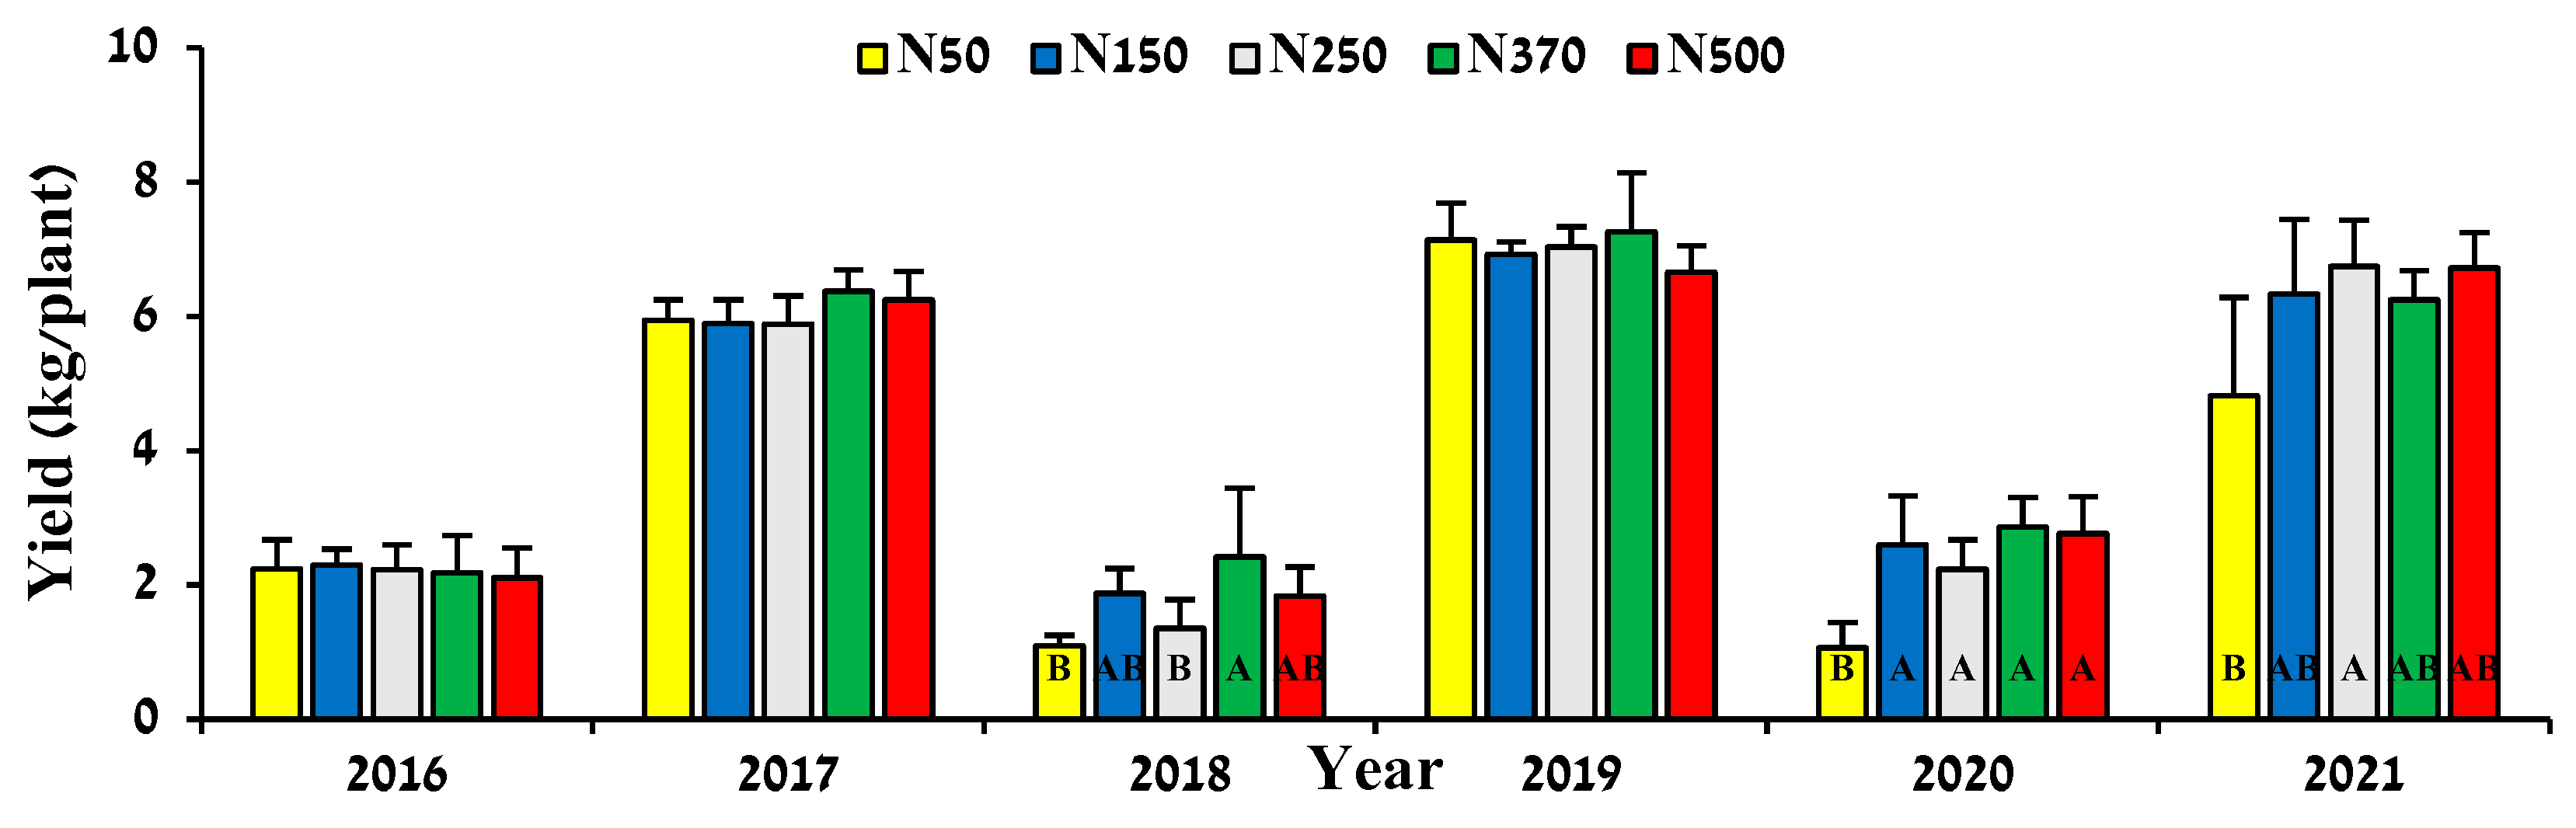
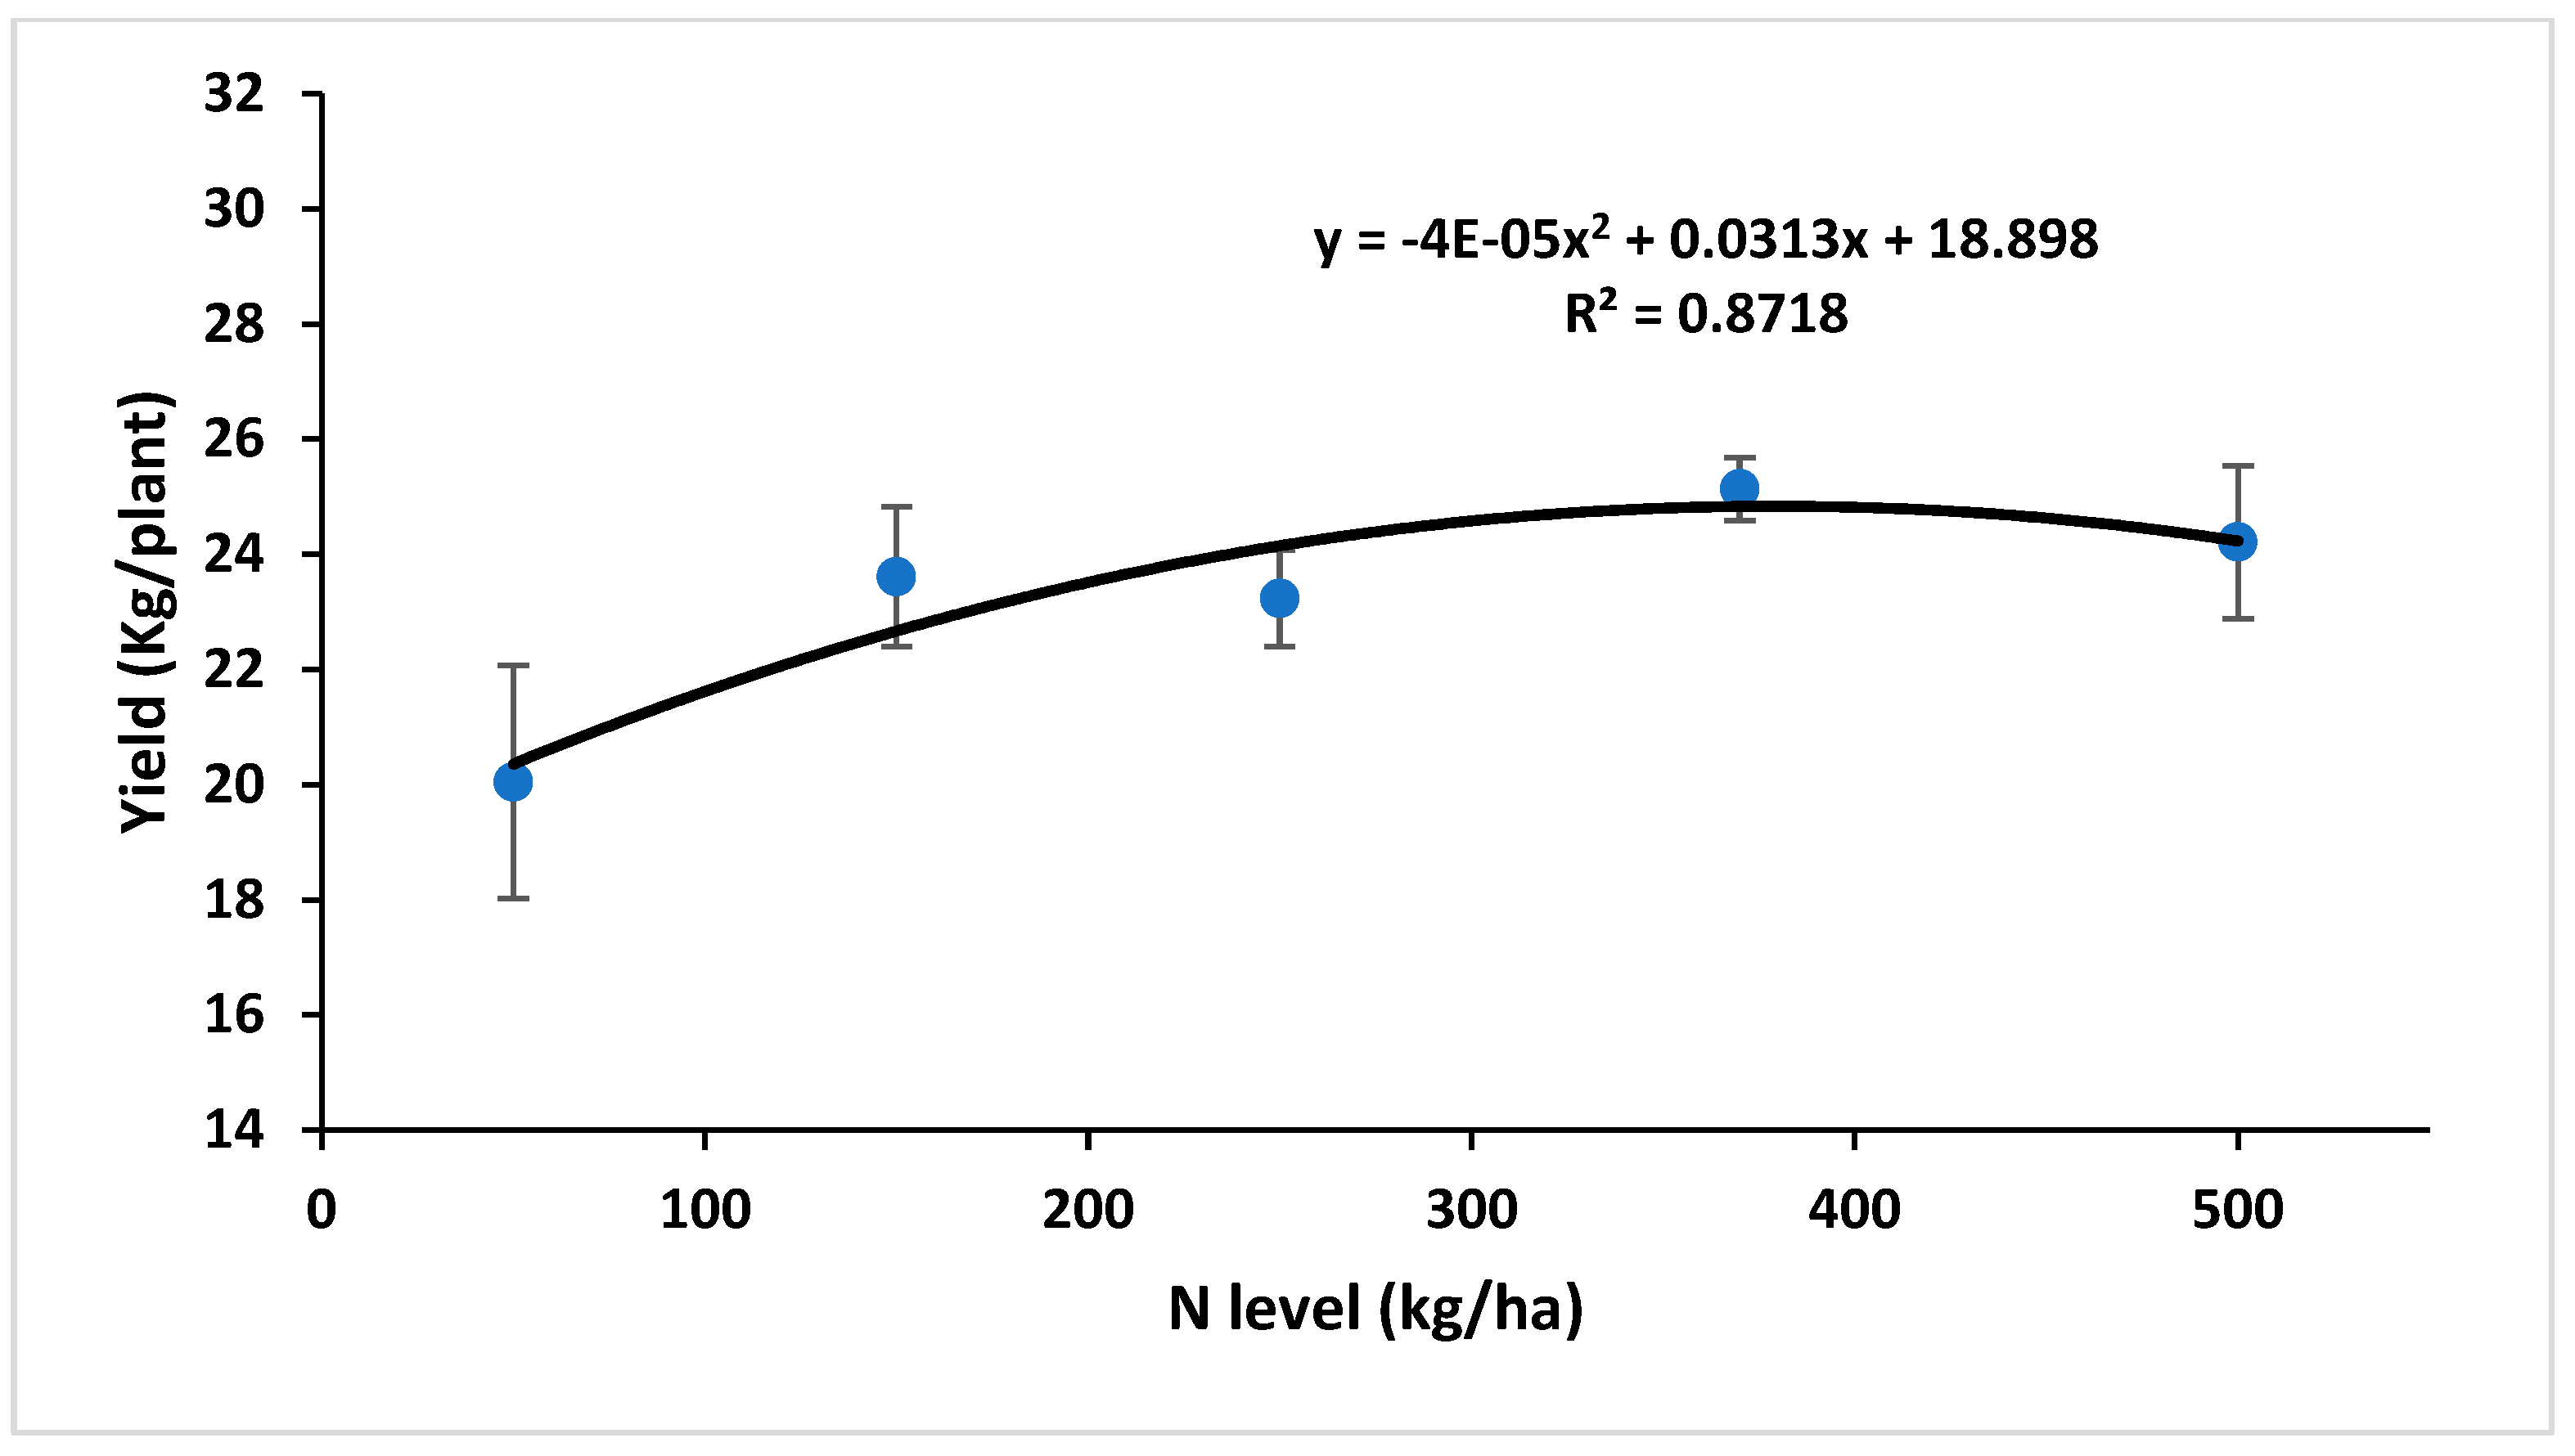
2.4. Productivity
3. Discussion
4. Materials and Methods
4.1. Experimental Design
4.2. Measurements
4.2.1. Leaf Analysis
4.2.2. Soil N Analysis
4.2.3. Vegetative Growth
4.2.4. Seed Weight and Wax-Content Analysis
4.2.5. Fruit Set and Yield
4.3. Data Analysis
5. Conclusions
Supplementary Materials
Author Contributions
Funding
Data Availability Statement
Acknowledgments
Conflicts of Interest
References
- Benzioni, A.; Dunstone, R.L. Jojoba: Adaptation to environmental stress and the implications for domestication. Quart. Rev. Biol. 1986, 61, 177–199. [Google Scholar] [CrossRef]
- Zheng, L.; Wu, W.; Chen, Q.; Zhang, G.; Gao, F.; Zhou, Y. Integrated transcriptomics, proteomics, and metabolomics identified biological processes and metabolic pathways involved in heat stress response in jojoba. Ind. Crops Prod. 2022, 183, 114946. [Google Scholar] [CrossRef]
- Greene, R.A.; Foster, E.O. The liquid wax of seeds of Simmondsia californica. Bot. Gaz. 1933, 94, 826–828. [Google Scholar] [CrossRef]
- Miwa, T.K. Jojoba oil wax esters and derived fatty acids and alcohols: Gas chromatographic analyses. J. Am. Oil Chem. Soc. 1971, 48, 259–264. [Google Scholar] [CrossRef]
- Arya, D.; Khan, S. A review of Simmondsia chinensis (Jojoba) “the desert gold”: A multipurpose oil seed crop for industrial uses. J. Pharm. Sci. Res. 2016, 8, 381–389. [Google Scholar]
- Tietel, Z.; Melamed, S.; Eretz-Kdosha, N.; Guetta, A.; Gvirtz, R.; Ogen-Shtern, N.; Dag, A.; Cohen, G. Anti-herpes simplex 1 activity of Simmondsia chinensis (jojoba) wax. Molecules 2021, 26, 6059. [Google Scholar] [CrossRef]
- Abdel-Hameed, H.S.; El-Saeed, S.M.; Ahmed, N.S.; Nassar, A.M.; El-Kafrawy, A.F.; Hashem, A.I. Chemical transformation of Jojoba oil and Soybean oil and study of their uses as bio-lubricants. Ind. Crops Prod. 2022, 187, 115256. [Google Scholar] [CrossRef]
- Evans, J.R.; Clarke, V.C. The nitrogen cost of photosynthesis. J. Exp. Bot. 2019, 70, 7–15. [Google Scholar] [CrossRef]
- Lea, P.J.; Morot-Gaudry, J.F. Plant Nitrogen; Springer Science & Business Media and INRA: Paris, France, 2013. [Google Scholar]
- Lin, Y.L.; Tsay, Y.F. Influence of differing nitrate and nitrogen availability on flowering control in Arabidopsis. J. Exp. Bot. 2017, 68, 2603–2609. [Google Scholar] [CrossRef]
- Huett, D.O. Prospects for manipulating the vegetative-reproductive balance in horticultural crops through nitrogen nutrition: A review. Aust. J. Agric. Res. 1996, 47, 47–66. [Google Scholar] [CrossRef]
- Lazare, S.; Perry, A.; Tel-Zur, N.; Sperling, O.; Yermiyahu, U.; Yasuor, H.; Dag, A.; Roberts, T. The metabolic reserves, carbohydrate balance and nutritional status of jojoba (Simmondsia chinensis), in relation to its annual cycle and fruit load. Funct. Plant Biol. 2021, 48, 1277–1287. [Google Scholar] [CrossRef] [PubMed]
- Erisman, J.W.; Sutton, M.A.; Galloway, J.; Klimont, Z.; Winiwarter, W. How a century of ammonia synthesis changed the world. Nat. Geosci. 2008, 1, 636–639. [Google Scholar] [CrossRef]
- Erisman, J.W.; Galloway, J.; Seitzinger, S.; Bleeker, A.; Butterbach-Bahl, K. Reactive nitrogen in the environment and its effect on climate change. Curr. Opin. Environ. Sustain. 2021, 3, 281–290. [Google Scholar] [CrossRef]
- Kanter, D.R.; Bartolini, F.; Kugelberg, S.; Leip, A.; Oenema, O.; Uwizeye, A. Nitrogen pollution policy beyond the farm. Nat. Food 2021, 1, 27–32. [Google Scholar] [CrossRef]
- Yermanos, D. Jojoba: A crop whose time has come. Calif. Agric. 1979, 33, 4–11. [Google Scholar]
- Tremper, G. The History and Promise of Jojoba; National Research Council: Los Angeles, CA, USA, 1996.
- Yermanos, D. Performance of jojoba under cultivation between 1973-1982: Information developed at the University of California, Riverside. In Jojoba and Its Uses through 1982: Proceedings of the Fifth International Conference on Jojoba and Its Uses; Office of Arid Lands Studies, University of Arizona: Tucson, AZ, USA, 1982; pp. 197–211. [Google Scholar]
- Lovenstein, H.M. Opportunities for improvement in jojoba production. In Jojoba: Proceedings of the Sixth International Conference on Jojoba and Its Uses; Wisniak, J., Zabicky, J., Eds.; Ben Gurion University of the Negev: Beer-Sheva, Israel, 1985; pp. 119–132. [Google Scholar]
- Nerd, A.; Benzioni, A. Effect of water status, genetic background, gender and fertilizer on flowering in jojoba. Adv. Hort. Sci. 1988, 2, 48–51. [Google Scholar]
- Benzioni, A. Jojoba domestication and commercialization in Israel. Hort. Rev. 1995, 17, 233–266. [Google Scholar]
- Khattab, E.A.; Afifi, M.H.; Amin, G.A. Significance of nitrogen, phosphorus, and boron foliar spray on jojoba plants. Bull. Natl. Res. Cent. 2019, 43, 66. [Google Scholar] [CrossRef]
- Nelson, J.M.; Watson, J.E. Nitrogen fertilization effects on jojoba seed production. Ind. Crops Prod. 2001, 132, 145–154. [Google Scholar] [CrossRef]
- Osman, H.E.; AboHassan, A.A. Jojoba (Simmondsia chinensis Schneider): A potential shrub in the Arabian desert. 9. Effect of NPK fertilization on vegetable growth and N content of leaves. JKAU Met. Environ. Arid Land Agric. Sci. 1998, 9, 85–98. [Google Scholar] [CrossRef]
- Hegab, R. 2021. The growth and production of jojoba plants under NPK-fertilization and irrigation with industrial wastewater. Egypt. J. Soil Sci. 2021, 61, 45–62. [Google Scholar]
- Haberman, A.; Dag, A.; Shtern, N.; Zipori, I.; Erel, R.; Ben-Gal, A.; Yermiyahu, U. Significance of proper nitrogen fertilization for olive productivity in intensive cultivation. Sci. Hort. 2019, 246, 710–717. [Google Scholar] [CrossRef]
- Lazare, S.; Lyu, Y.; Yermiyahu, U.; Heler, Y.; Ben-Gal, A.; Holland, D.; Dag, A. Optimizing nitrogen application for growth and productivity of pomegranates. Agronomy 2020, 10, 366. [Google Scholar] [CrossRef]
- Hasegawa, T.; Horie, T. Leaf nitrogen, plant age and crop dry matter production in rice. Field Crops Res. 1996, 47, 107–116. [Google Scholar] [CrossRef]
- Perry, A.; Tel-Zur, N.; Dag, A. Vegetative and reproductive response to fruit load in two jojoba (Simmondsia chinensis) cultivars. Agronomy 2021, 11, 889. [Google Scholar] [CrossRef]
- Eberhardt, P.J. Leaf analysis and nutrient utilization by jojoba. In International Conference on Jojoba and Its Uses; The American Oil Chemists Society: Champaign, IL, USA, 1988; pp. 36–49. [Google Scholar]
- Miller, M.H. Effects of nitrogen on phosphorus absorption by plants. In The Plant Root and Its Environment; Carson, E.W., Ed.; University Press of Virginia: Charlottesville, VA, USA, 1974; pp. 643–666. [Google Scholar]
- Yang, K.; Zhu, J.; Gu, J.; Yu, L.; Wang, Z. Changes in soil phosphorous fraction after 9 years of continuous nitrogen addition in a Larix gmelinii plantation. Ann. For. Sci. 2014, 72, 435–442. [Google Scholar] [CrossRef]
- Aleixo, S.; Gama-Rodrigues, A.C.; Gama-Rodrigues, E.F.; Campello, E.F.C.; Silva, E.C.; Schripsema, J. Can soil phosphorous availability in tropical forest systems be increased by nitrogen-fixing leguminous trees? Sci. Total Environ. 2020, 712, 136405. [Google Scholar] [CrossRef] [PubMed]
- Bustan, A.; Avni, A.; Yermiyahu, U.; Ben-Gal, A.; Riov, J.; Erel, R.; Zipori, I.; Dag, A. Interactions between fruit load and macroelement concentrations in fertigated olive (Olea europaea L.) trees under arid saline conditions. Sci. Hort. 2013, 152, 44–55. [Google Scholar] [CrossRef]
- Wagh, V.M.; Panaskar, D.B.; Mukate, S.V.; Aamalawar, M.L.; Laxman Sahu, U. Nitrate associated health risks from groundwater of Kadava river basin Nashik, Maharashtra, India. Hum. Ecol. Risk Assess. 2020, 26, 654–672. [Google Scholar] [CrossRef]
- Tran, D.A.; Tsujimura, M.; Loc, H.H.; Dang, D.H.; Le Vo, P.; Ha, D.T.; Trang, N.T.T.; Thuc, P.T.B.; Dang, T.D.; Batdelger, O.; et al. Groundwater quality evaluation and health risk assessment in coastal lowland areas of the Mekong Delta, Vietnam. Groundw. Sust. Dev. 2021, 15, 100679. [Google Scholar] [CrossRef]
- Kirkby, E.A. Plant growth in relation to nitrogen supply. Ecol. Bull. 1981, 33, 249–267. [Google Scholar]
- Naor, A.; Schneider, D.; Ben-Gal, A.; Zipori, I.; Dag, A.; Kerem, Z.; Birger, R.; Peres, M.; Gal, Y. The effects of crop load and irrigation rate in the oil accumulation stage on oil yield and water relations of ‘Koroneiki’ olives. Irrig. Sci. 2013, 31, 781–791. [Google Scholar] [CrossRef]
- Bakeer, S.M. Effect of summer hedge-pruning and gibberellic acid foliar spray on yield and alternate bearing of S-700 jojoba clone (Simmondsia chinensis Schneider). Ind. Crops Prod. 2019, 128, 371–376. [Google Scholar] [CrossRef]
- Congreves, K.A.; Otchere, O.; Ferland, D.; Farzadfar, S.; Williams, S.; Arcand, M.M. Nitrogen use efficiency definitions of today and tomorrow. Front. Plant Sci. 2021, 12, 637108. [Google Scholar] [CrossRef]
- Ayars, J.E.; Phene, C.J.; Phene, R.C.; Gao, S.; Wang, D.; Day, K.R.; Makus, D.J. Determining pomegranate water and nitrogen requirements with drip irrigation. Agric. Water Manag. 2017, 187, 11–23. [Google Scholar] [CrossRef]
- Kowalczyk, W.; Wrona, D.; Przybyłko, S. Effect of nitrogen fertilization of apple orchard on soil mineral nitrogen content, yielding of the apple trees and nutritional status of leaves and fruits. Agriculture 2022, 12, 2169. [Google Scholar] [CrossRef]
- Lazare, S.; Zipori, I.; Cohen, Y.; Haberman, A.; Goldshtein, E.; Ron, Y.; Rotschild, R.; Dag, A. Jojoba pruning: New practices to rejuvenate the plant, improve yield and reduce alternate bearing. Sci. Hort. 2021, 277, 109793. [Google Scholar] [CrossRef]


| Treatment | Composition a | pH | N Total | N-NO3 | N-NH4 | P2O5 | K2O | Cl | Fe | Mn | Zn | Cu | Mo |
|---|---|---|---|---|---|---|---|---|---|---|---|---|---|
| % | ppm | ||||||||||||
| N50 | 2-3-9+3 | 4 | 2.0 | 1.0 | 1.0 | 3.0 | 9.0 | 5.3 | 300 | 150 | 75 | 11 | 8 |
| N150 | 4.5-3-9+3 | 4 | 4.5 | 2.0 | 2.5 | 3.0 | 9.0 | 6.7 | 300 | 150 | 75 | 11 | 8 |
| N250 | 5-2-7+3 | 4 | 5.0 | 2.5 | 2.5 | 2.0 | 7.0 | 4.3 | 300 | 150 | 75 | 11 | 8 |
| N370 | 7-2-7+3 | 4 | 7.0 | 3.3 | 3.7 | 2.0 | 7.0 | 5.3 | 300 | 150 | 75 | 11 | 8 |
| N500 | 10-2.5-5+3 | 4 | 10.0 | 4.7 | 5.3 | 2.5 | 5.0 | 3.8 | 300 | 150 | 75 | 11 | 8 |
Disclaimer/Publisher’s Note: The statements, opinions and data contained in all publications are solely those of the individual author(s) and contributor(s) and not of MDPI and/or the editor(s). MDPI and/or the editor(s) disclaim responsibility for any injury to people or property resulting from any ideas, methods, instructions or products referred to in the content. |
© 2023 by the authors. Licensee MDPI, Basel, Switzerland. This article is an open access article distributed under the terms and conditions of the Creative Commons Attribution (CC BY) license (https://creativecommons.org/licenses/by/4.0/).
Share and Cite
Dag, A.; Badichi, S.; Ben-Gal, A.; Perry, A.; Tel-Zur, N.; Ron, Y.; Tietel, Z.; Yermiyahu, U. Optimizing Nitrogen Application for Jojoba under Intensive Cultivation. Plants 2023, 12, 3132. https://doi.org/10.3390/plants12173132
Dag A, Badichi S, Ben-Gal A, Perry A, Tel-Zur N, Ron Y, Tietel Z, Yermiyahu U. Optimizing Nitrogen Application for Jojoba under Intensive Cultivation. Plants. 2023; 12(17):3132. https://doi.org/10.3390/plants12173132
Chicago/Turabian StyleDag, Arnon, Shamir Badichi, Alon Ben-Gal, Aviad Perry, Noemi Tel-Zur, Yonatan Ron, Zipora Tietel, and Uri Yermiyahu. 2023. "Optimizing Nitrogen Application for Jojoba under Intensive Cultivation" Plants 12, no. 17: 3132. https://doi.org/10.3390/plants12173132