Article

Physiological and Morphological Responses of Blackberry Seedlings to Different Nitrogen Forms

1
Co-Innovation Center for Sustainable Forestry in Southern China, College of Forestry, Nanjing Forestry University, Nanjing 210037, China
2
Institute of Botany, Jiangsu Province and Chinese Academy of Sciences (Nanjing Botanical Garden Mem. Sun Yat-sen), Jiangsu Key Laboratory for the Research and Utilization of Plant Resources, Nanjing 210014, China
*
Authors to whom correspondence should be addressed.
Plants 2023, 12(7), 1480; https://doi.org/10.3390/plants12071480
Submission received: 27 February 2023 / Revised: 24 March 2023 / Accepted: 26 March 2023 / Published: 28 March 2023
(This article belongs to the Special Issue Role of Nitrogen in Plant Growth and Development)

Abstract

:
Blackberries are an emerging third-generation fruit that are popular in Europe, and specific nitrogen (N) supply is an important factor affecting their growth and development. To study the optimal N fertilizer for blackberry seedlings, no N (CK), nitrate (NO3)–N, ammonium (NH4+)–N and urea were applied to one-year-old ‘Ningzhi 4’ blackberry plants at a key growth period (from May to August) to explore the effects of different N forms on the physiological characteristics. Correlation and principal component analysis were used to determine the relationships between various indexes. Ammonium (NH4+) or urea-fed plants had a better growth state, showed a greater plant height, biomass, SPAD values and enhanced antioxidant enzyme activities and photosynthesis. In addition, NH4+ was beneficial to the accumulation of sugars and amino acids in leaves and roots, and promoted the transport of auxin and cytokinin to leaves. NO3 significantly inhibited root growth and increased the contents of active oxygen, malondialdehyde and antioxidants in roots. Correlation and principal component analysis showed that growth and dry matter accumulation were closely related to the antioxidant system, photosynthetic characteristics, amino acids and hormone content. Our study provides a new idea for N regulation mechanism of blackberry and proposes a scientific fertilization strategy.

1. Introduction

The blackberry plant (Rubus spp.), native to North America, is a perennial shrub of the genus Rubus in the Rosaceae [1]. The berries are aggregated fruits that are black when ripe and look like mulberries. Blackberry fruit is rich in anthocyanins, superoxide dismutase (SOD), flavonoids, ellagic acid, tannins and other antioxidants, and has the highest concentration of selenium, which can prevent the occurrence of a range of diseases among a range of tested fruits [2]. In addition, blackberry leaves have been reported to have antibacterial, antiseptic and antidiarrheal properties in traditional medicine, as well as the ability to facilitate labor during pregnancy [3]. With the increasing demand for high-quality and nutritious fruits that improve health, blackberry acreage is increasing. The global commercial cultivated area for blackberry was estimated to increase by 34.92% from 20,035 ha in 2005 to 27,032 ha in 2015 [4]. The global annual output of commercial blackberry exceeds 150,000 tons per year [2].
Nitrogen (N) is an essential element and plays a crucial role in the yield and quality of blackberry fruit. In production practice, farmers usually use N fertilizers in large quantities to increase the productivity of crops. However, unreasonable N fertilizer application will not only make crops over-reliant on chemical fertilizers but also lead to destruction of the soil structure and soil nutrient imbalance [5]. In addition, excess N fertilizer accelerates the pollution of the atmosphere and water resources through surface runoff, leaching and ammonia (NH3) volatilization [6,7]. Therefore, in large-scale cultivation of blackberries, the prudent application of N fertilizer, improvement of N fertilizer use efficiency and maximization of economic output are of great significance for achieving sustainable agricultural development.
Plants obtain a variety of N forms from the soil that undergo a series of processes, such as transport, assimilation, storage and remobilization [8]. Ammonium (NH4+) and nitrate (NO3) are the main forms of N taken up by plants [9], with specific transporters required for their uptake [10]. Urea is often used in agricultural production due to its stable chemical properties and because it has the highest N content among organic N fertilizers. The majority of urea applied as fertilizer is degraded to NH4+ by urease derived from soil bacteria and transported into the plant. Urea that escapes urease degradation is transported into the plant by a high-affinity transport system [11].
There are great differences in N form preference among different plants. The N form preference depends on not only the species and developmental stage, but also a variety of environmental factors, such as temperature, moisture and light [12,13]. In general, NO3 may be more beneficial during a drought, as NH4+ is the primary source of N take up in flooded, freeze-damaged and acidic soils [10]. Taking into account assimilation costs, NH4+ is the preferred N source for most plants, due to its low metabolic cost for assimilation [9]. However, most plants are sensitive to NH4+, and long-term application of NH4+ usually inhibits plant growth and may be toxic [10]. The toxicity of NH4+ to plants depends on its concentration, and the concentration at which toxicity becomes apparent varies among plant species. Only a few plant species can tolerate high concentrations of NH4+, such as tea tree, sugarcane, rice and blueberry [6,14,15,16]. A deficiency of NO3 may also be another NH4+ stress, when NH4+ is fed as a single N source, in addition to the toxicity issue of NH4+ itself. An increasing number of studies have shown that the negative effects of NH4+ on plants can be alleviated by feeding NO3 [17,18,19]. The Columbia strain of Arabidopsis thaliana cannot grow normally when fed with NH4+ as a single N source. However, by adding NO3 or pre-culturing in a medium containing NO3, Arabidopsis thaliana can grow well and absorb NH4+ rapidly [18]. In addition, plants fed with urea as the sole N source may also have the same toxic symptoms as NH4+. This effect may be related to the NH4+ produced by urea hydrolysis [19]. In the study of wheat seedlings, it was found that NO3 could also promote the assimilation rate of urea and NH4+, which had a positive effect on plant cells to alleviate NH4+ poisoning [17]. It should be noted that even plants that are obviously tolerant to NH4+ will have symptoms of poisoning as long as the concentration of NH4+ exceeds the threshold they can bear. For example, under the condition of excessive NH4+ feeding, the leaves of rice will gradually turn yellow, the plants will be thin and growth will be inhibited. Only when NO3 and NH4+ are supplied together can the growth of rice be restored [19]. Another reason for NH4+ toxicity may also be that root acidification hinders cell metabolism. Generally speaking, NH4+-tolerant plants are more adaptable to acidic environment [8,19]. Although it may have adverse effects on most plants under high NH4+ conditions, the existence of NH4+ as the main N source may have important positive significance for plants. A large number of studies have reported that NH4+ nutrition can stimulate N assimilation, promote photosynthetic electron transport and regulate specific secondary metabolic pathways [6,14,19]. In addition, some plants fed with NH4+ also have a higher tolerance to abiotic stresses such as drought and salinity [12,13].
Different N forms have different effects on physiological and biochemical processes such as photosynthesis, antioxidant system regulation and N metabolism [20]. Cruz et al. [21] showed that NO3 promoted photosynthesis during later stages of cassava growth. Some scholars believe that NH4+ is beneficial for crop photosynthesis, but an excessively high concentration can easily lead to NH4+ toxicity in plants, and NO3 can reduce the chlorophyll content of leaves and inhibit photosynthesis [16,22]. Hessini et al. [13] conducted a pot experiment on maize and found that NH4+ was more conducive to the accumulation of leaf dry matter than NO3 and significantly improved stomatal conductance and the transpiration rate, as well as increased the amino acid and sugar contents in leaves. Studies have shown that NH4+ can alter the redox state of reactive oxygen species (ROS) and regulate the homeostasis of antioxidant enzyme systems [16]. After Arabidopsis plants were supplied with NH4+, the leaves exhibited symptoms of stress, and ROS levels increased [23]. Additionally, NH4+ can increase the activity of antioxidant enzymes in maize roots [24]. Notably, N forms also affect the levels of free amino acids and endogenous hormones. Researchers reported that when NH4+ was used as the sole N source, the total amino acid content in coffee seedlings was higher than that with NO3-N treatment [25]. Similar results were found in rice and tea tree [26,27]. It is generally believed that NO3 promotes the synthesis of cytokinin (CTK) in plants and increases the activity and transport rate of CTK, while NH4+ inhibits the transport of CTK from roots to aerial parts and reduces its content [28,29]. A study on maize roots showed that the inhibition of root growth by high NO3 levels was caused by a reduction in the root auxin (IAA) content [30]. The increase in root biomass promoted by NH4+ and urea was related to the increase in the IAA content [31]. The study of N forms affecting the hormone content has only been conducted in a few plant species, and how N forms regulate the movement and distribution of IAA and CTK is still unclear.
To the best of our knowledge, the N form preference of blackberry has not been reported, and there has been no systematic in-depth study on the mechanism of the N adaptation strategy at the whole-plant level. As an emerging fruit, people mainly focus on the preservation, antioxidant and anthocyanin research of blackberry fruit. Moreover, blackberry plants are highly adaptable and have relatively low nutrient requirements compared to other fruits [32], so there is little research on cultivation of blackberry. Based on the above, understanding the preference for N fertilizers is necessary for blackberry fertilization programs.
The experiment was carried out using potted plants after the addition of different N fertilizers. In this study, we performed an in-depth analysis of the N absorption mechanism of blackberry plants at morphological and physiological levels. The purpose of our study was to investigate how the changes in morphological and physiological parameters of blackberry plants depend on different N forms. Another goal was to try to evaluate the availability of different N forms on the growth and development of blackberry seedlings and determine the best fertilization strategy. This study provides some new clues for the study of the mechanism of plant N absorption and utilization in the future.

2. Results

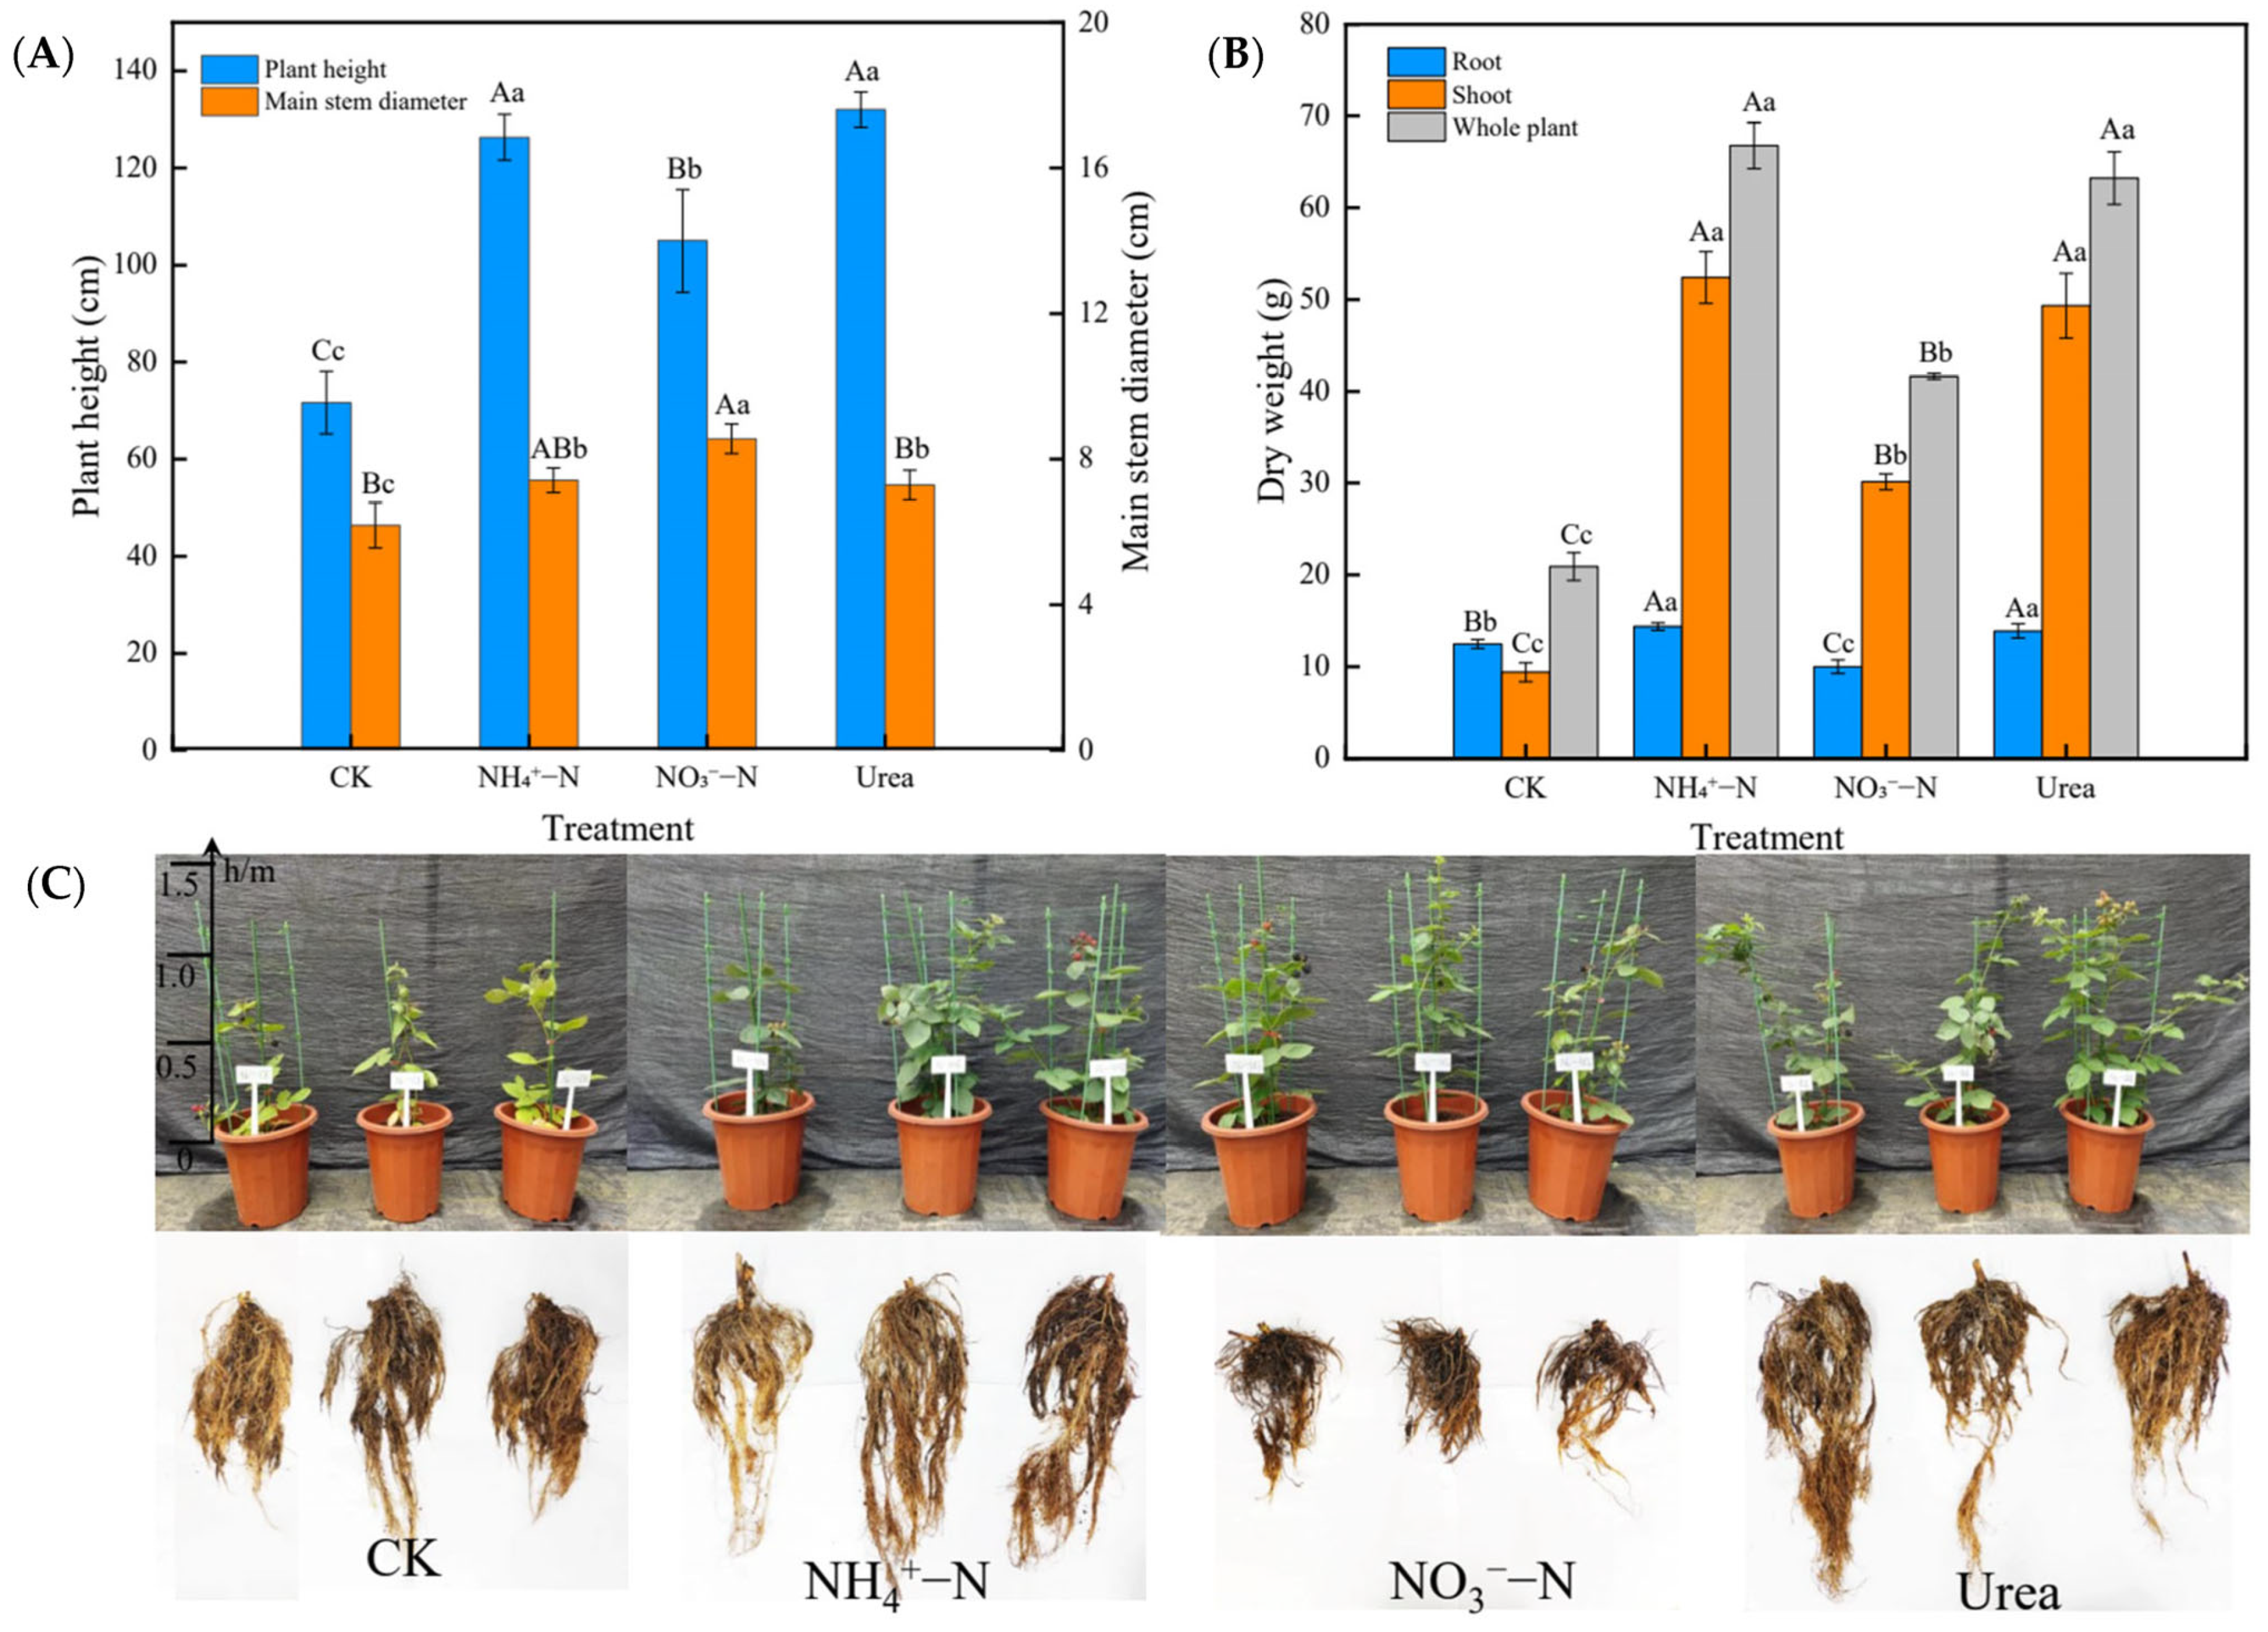
2.1. Growth Characteristics

Different N forms significantly affected the aboveground and underground parts of the blackberry plants (Figure 1 showed a comparison of the NH4+–N, NO3–N and urea treatments). Compared with other treatments, root growth was significantly inhibited with the NO3–N treatment for 60 days (Figure 1B,C). The NH4+–N and urea treatments increased by 76.27% and 84.18%, respectively, in plant height (p < 0.01) relative to the controls (Figure 1A). The main stem diameter with the NH4+-N and urea treatments was similar to that under CK, but the NO3–N treatment resulted in a significantly greater main stem diameter than the other treatments (p < 0.05). The NH4+–N (mean; 66.79 g DW/plant) and urea (mean; 63.24 g DW/plant) treatments increased the whole plant biomass more than the NO3–N treatment (mean; 41.64 g DW/plant) (p < 0.01). This trend was consistent across the roots and shoots (Figure 1B).

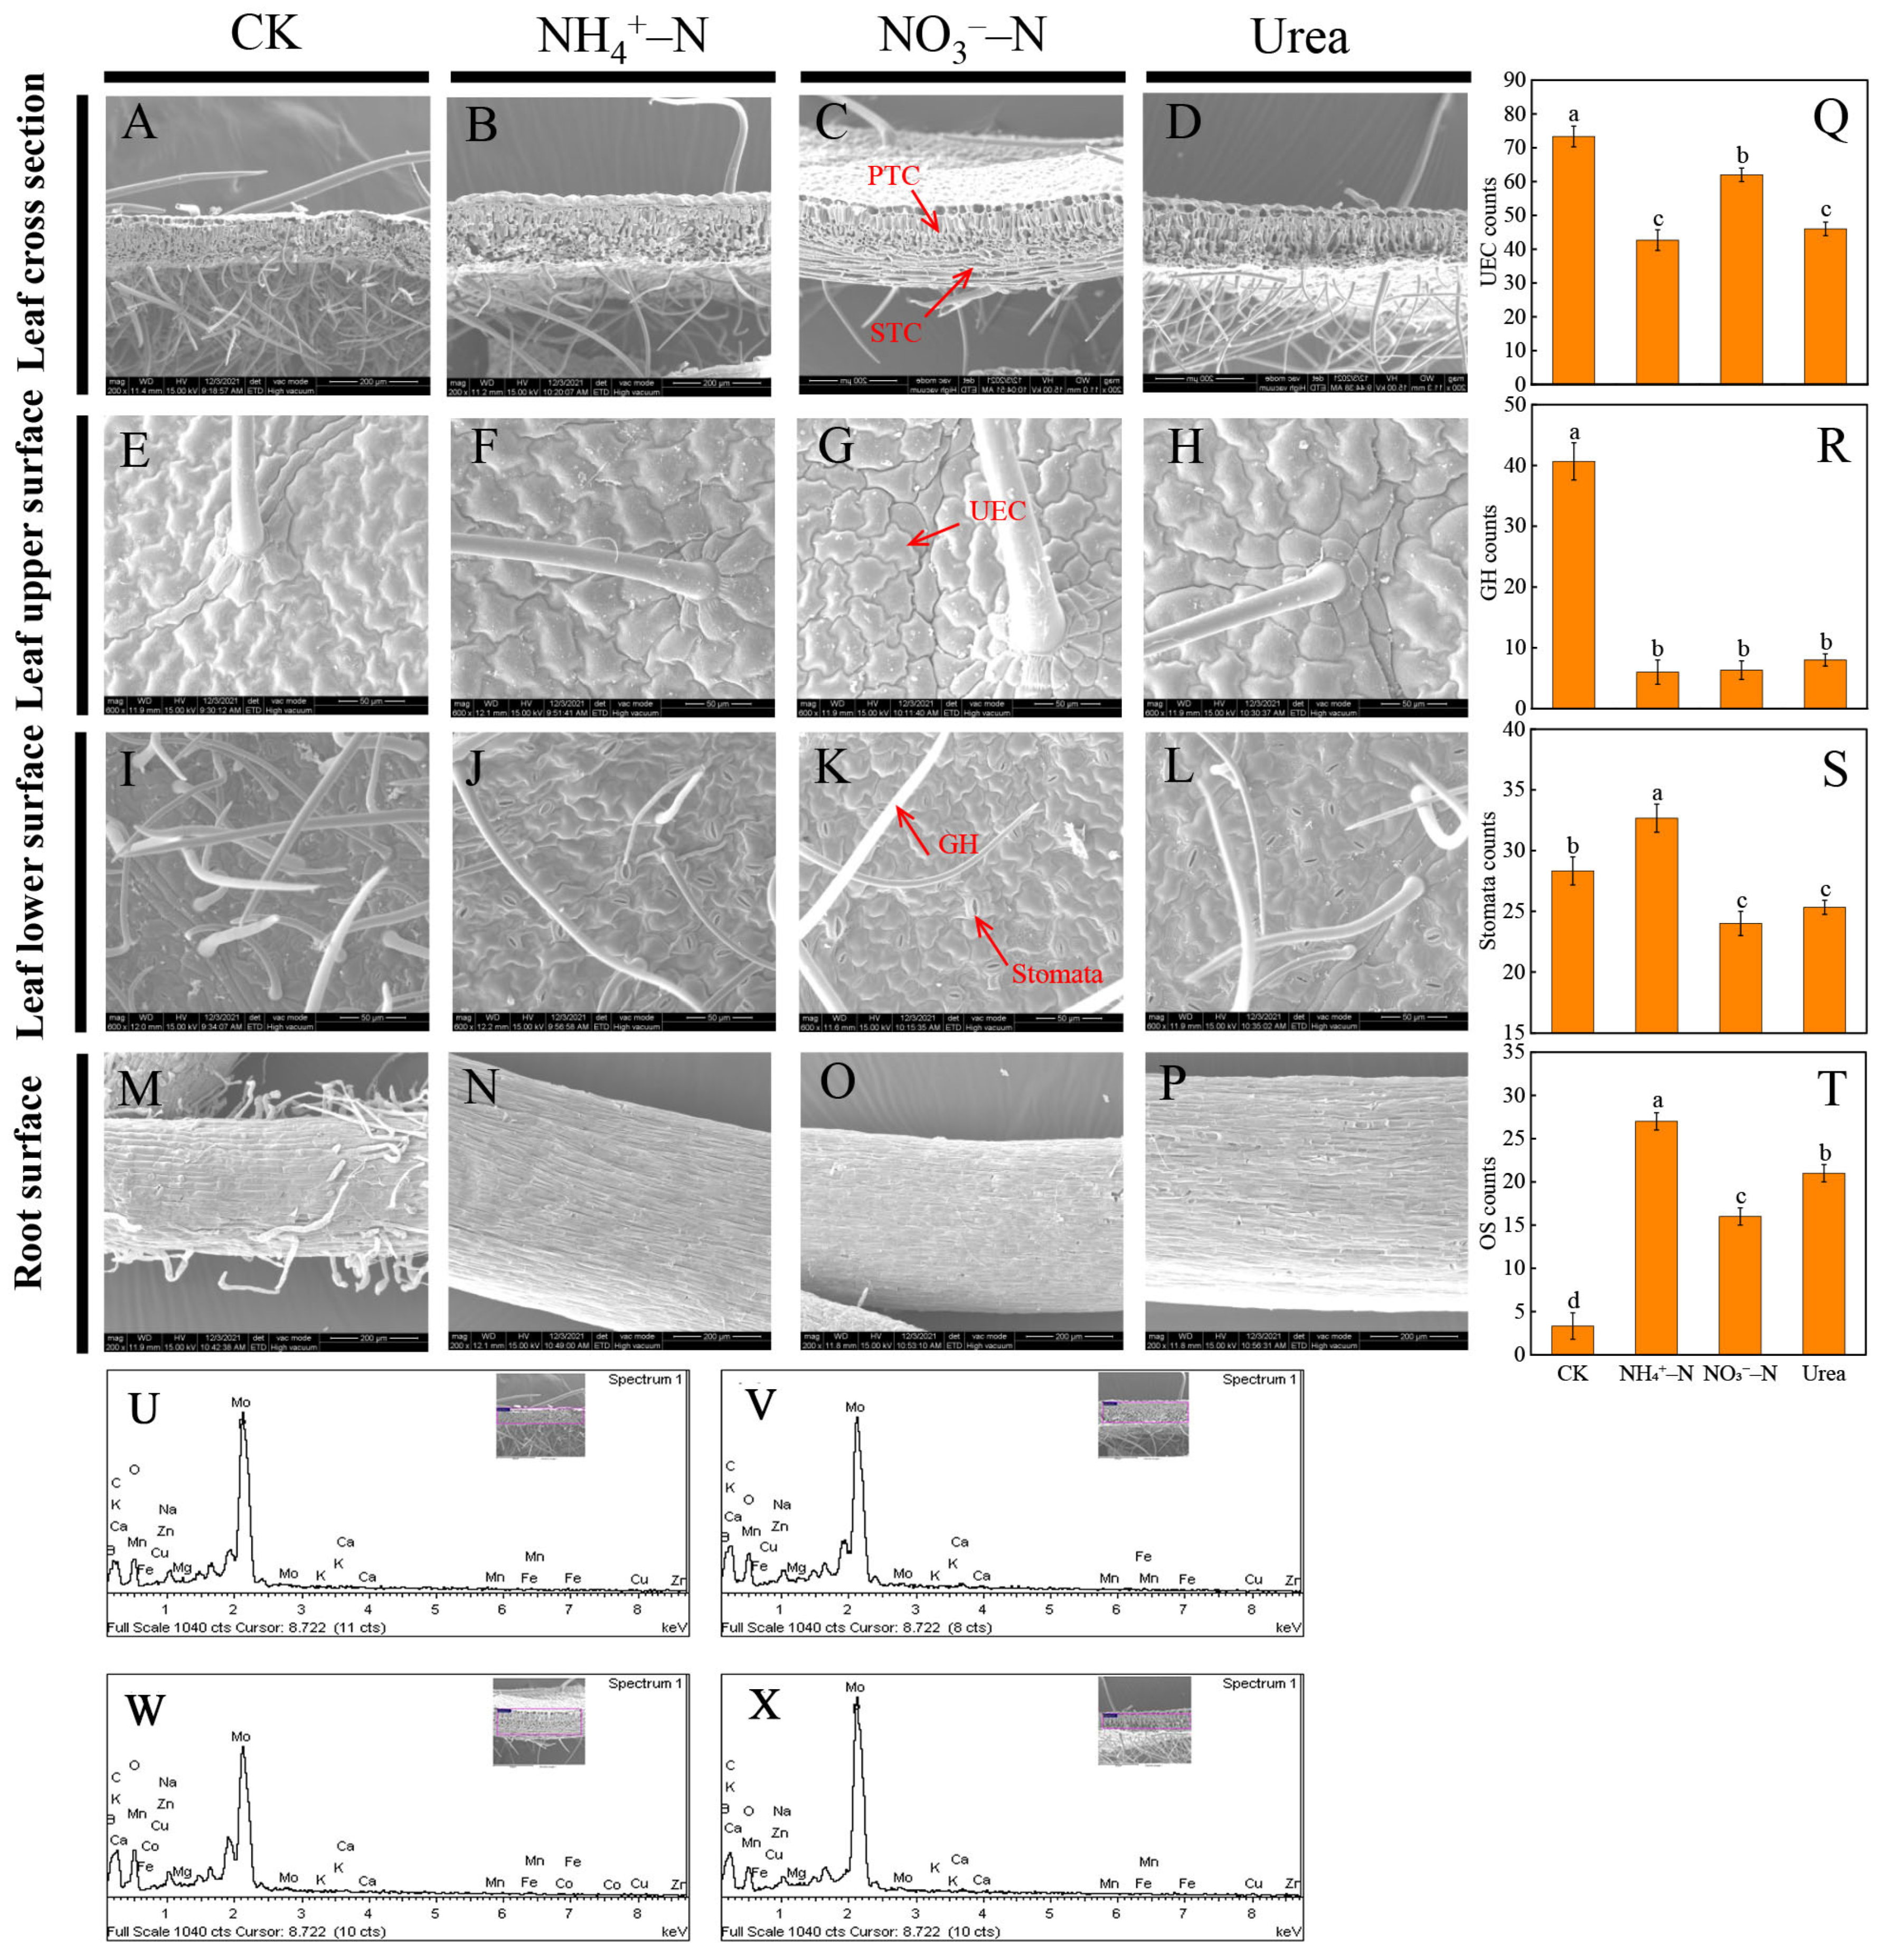
2.2. Morphological Changes

In this study, the application of different N fertilizers significantly influenced the microstructure of blackberry leaves and roots (Figure 2). By observing the cross-section of the leaves, we found that the palisade tissue was more compact and denser in the NH4+–N and urea treatments, while the leaf was thicker with the NO3–N treatment but the spongy tissue was looser compared to that under CK (Figure 2A–D). Upper epidermal cell (UEC) counts were significantly affected in the order CK > NO3–N > urea > NH4+–N, indicating that within the same field of vision, the UEC area was larger with the NH4+–N and urea treatments (p < 0.05) (Figure 2E–H,Q). Compared with that under the other treatments, the lower surface of the leaves in the CK group had the most glandular hairs (GHs), but the single-stomata area was small and most stomata were closed. Among the three N treatments, NH4+–N resulted in the highest number of stomata and greater stomatal opening (Figure 2I–L,S,T). There were a high number of root hairs on the root surface in the CK group, and there was no significant difference among the other treatments (Figure 2M–P).
As shown in Figure 2U–X, the different N forms had no significant effect on the energy spectrum peaks of the leaf cross-section, but all the spectra showed that the peak for Mo was the highest (Kα = 4.5 keV). In each treatment, the leaves all contained C, O, Na and Ca, and Mg, K, Mn, Fe, Cu, Zn and Mo were also detected in some treatments (Table 1). The Na levels in leaves were the lowest with the NH4+–N treatment. The levels of Mg, Ca and Mn in NH4+–fed plants were significantly higher than those in other treatments. Interestingly, among the three N conditions, Fe, Cu and Mo were not detected in the NH4+–N treatment. The differences in the levels of other elements are shown in Table 1.

2.3. Cultivation Substrate Analysis

Compared with other treatments, the NO3–N treatment significantly increased the cultivation substrate pH, and the NH4+–N treatment exhibited the lowest pH (p < 0.05). Different N forms had different effects on the electrical conductivity (EC) of the cultivation substrates, and the EC values were in the following order: NH4+–N > urea > NO3–N (p < 0.05). The EC with the NH4+–N treatment was 1.89 times higher than that with the NO3–N treatment. With the urea treatment, the substrate organic matter (SOM) and organic carbon (SOC) levels peaked, with mean values of 80.72% and 46.82%, respectively (Table 2). The content of alkali-hydrolysable nitrogen (AHN) in the cultivation medium was in the order NH4+–N > urea > NO3–N > CK. Compared with that under the CK treatment, the AHN content increased by 41.99%, 29.93% and 19.72% with the NH4+–N, urea and NO3–N treatments, respectively (p < 0.05).

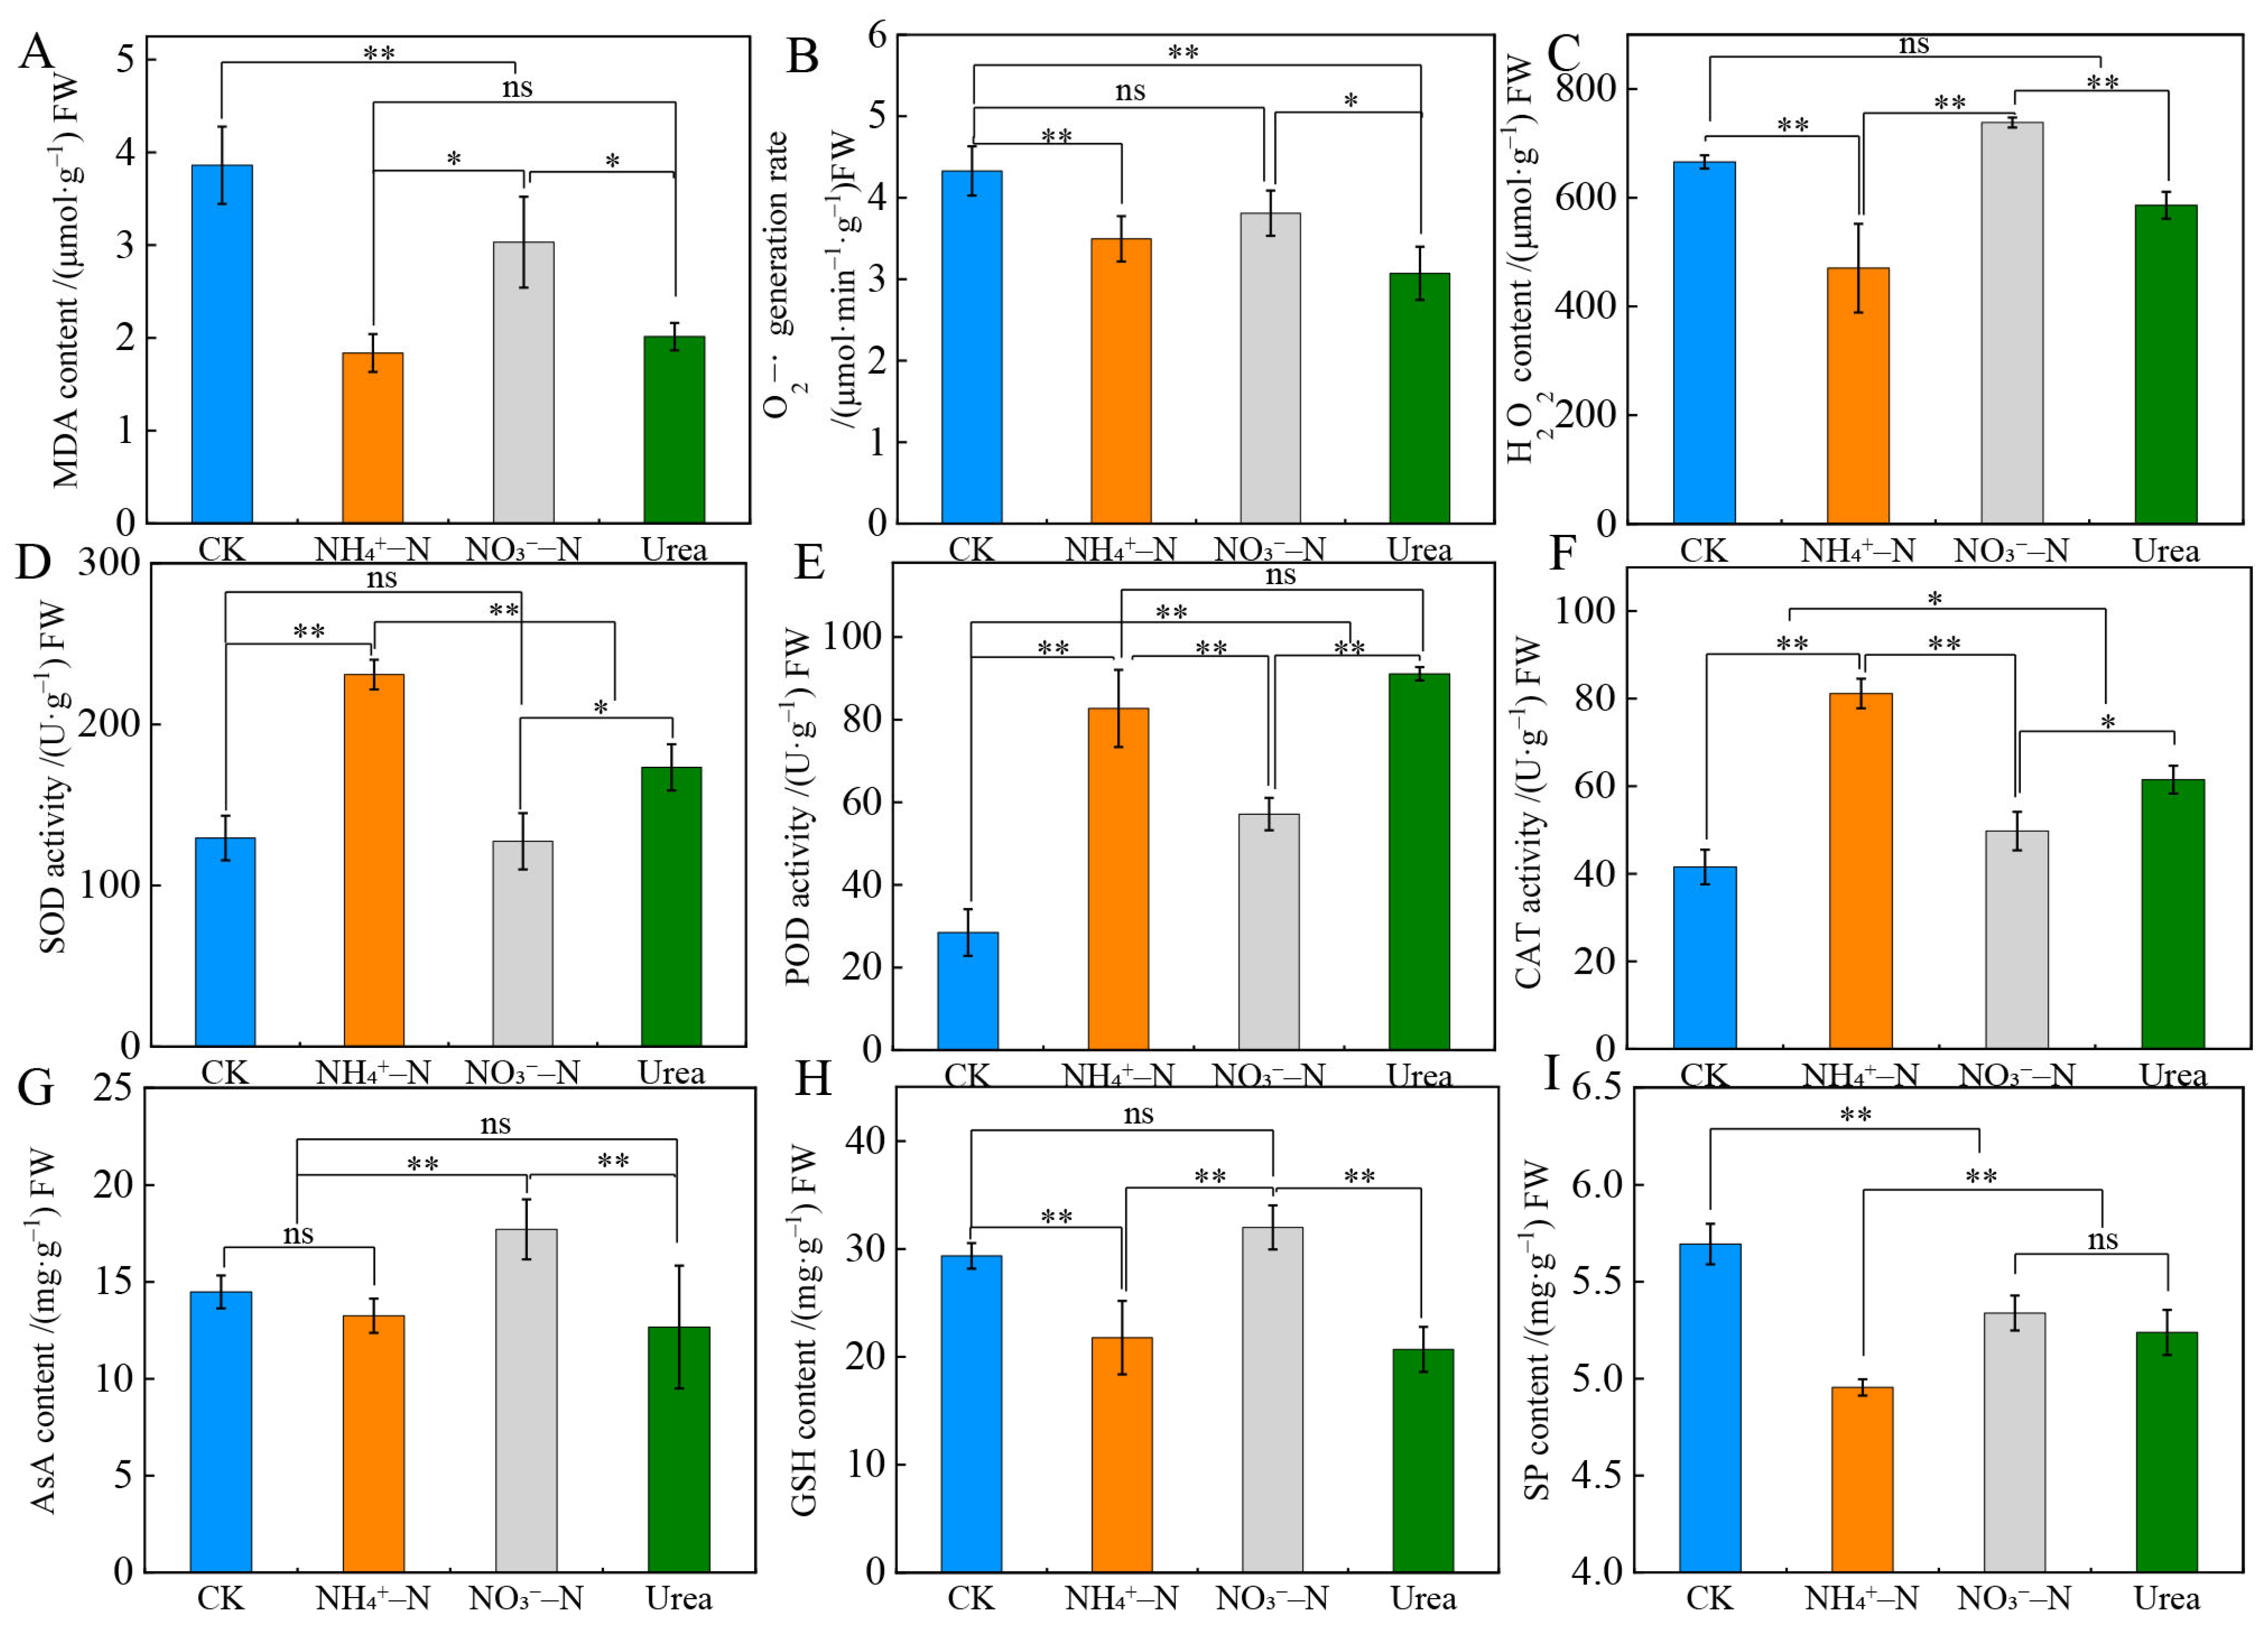
2.4. Root Physiology and Antioxidant Indicators

In the case of long-term zero N fertilizer (CK) treatment, the MDA and H2O2 levels and the O2·− generation rate were high in the roots (Figure 3A–C). Notably, the antioxidant enzyme activity (including that of SOD, POD and CAT) was at the lowest level, but the levels of antioxidant substances (AsA and GSH) and the SP content remained relatively high under CK (Figure 3D–I). The O2 generation rate and the levels of MDA and H2O2 with NO3-N treatment were significantly higher than those with the NH4+–N and urea treatments, while the SOD, POD and CAT activities reached the lowest level [mean; 127.46 (U·g−1) FW, 57.14 (U·g−1) FW, 49.76 (U·g−1) FW]. Except for the SP content, which was not obviously different between the NO3–N and urea treatments, the levels of AsA and GSH after NO3–N treatment were significantly higher than those after NH4+–N and urea supply (p < 0.01). In summary, the above analysis showed that the roots were damaged by more free radicals with the CK and NO3–N treatments.

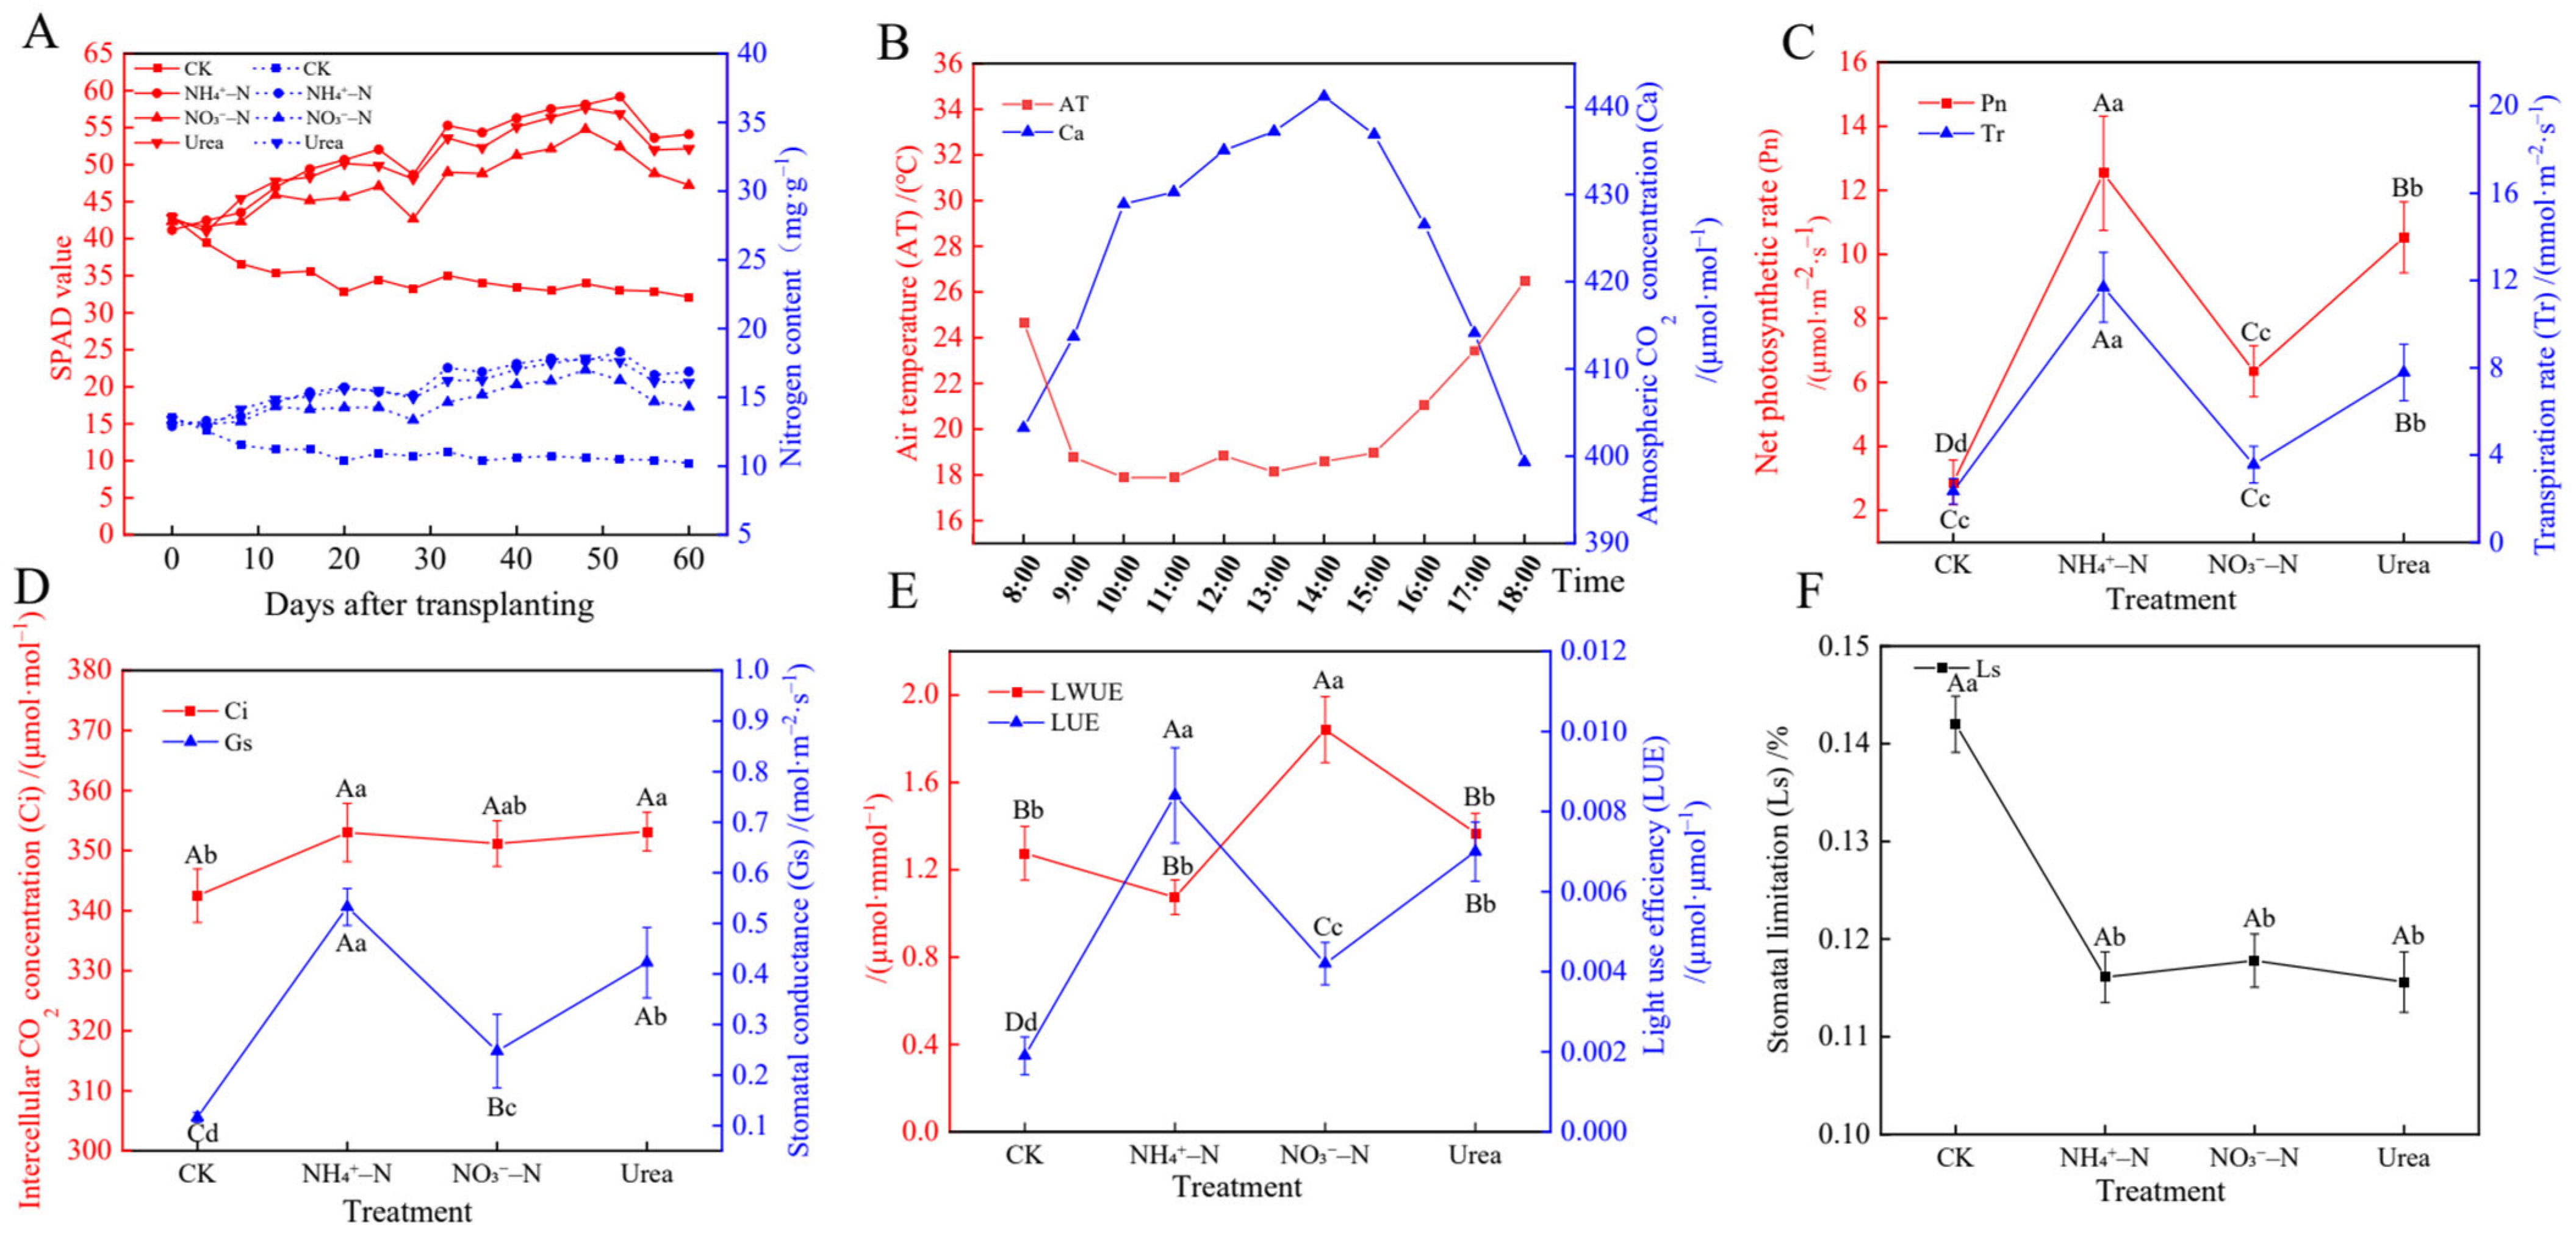
2.5. Photosynthesis and Gas Exchange

Figure 4A showed that with increasing treatment time, the relative chlorophyll content (SPAD value) and N content first increased and then decreased, peaking at approximately 52 days. Without N fertilization (CK), these levels gradually decreased. With the supply of NH4+–N, the SPAD value and N content increased, whereas the lowest values were measured in response to NO3–N. Through real-time monitoring of changes in environmental factors, we found that the temperature peaked at 34 °C at 14:00 and was lowest at 18 °C at 18:00. At the same time, the atmospheric CO2 concentration (Ca) was stable at approximately 400 µmol·mol−1 during the day (Figure 4B). NH4+–N may positively affect the photosynthetic rate and gas exchange performance of blackberry plants (Figure 4C,D). Plants exhibited the highest net photosynthetic rate (Pn), transpiration rate (Tr) and stomatal conductance (Gs) with the NH4+–N treatment (p < 0.01), which were five times, three times and five times higher, respectively, than those under the CK treatment. With the NH4+–N treatment, the light use efficiency (LUE) was highest (mean; 0.0084 g µmol·µmol−1), while the leaf water use efficiency (LWUE) (mean; 1.84 g µmol·mmol−1) was the highest with the NO3–N treatment (p < 0.01) (Figure 4E). The intercellular CO2 concentration (Ci) and stomatal limitation (Ls) did not change significantly among the N forms (Figure 4D,F).

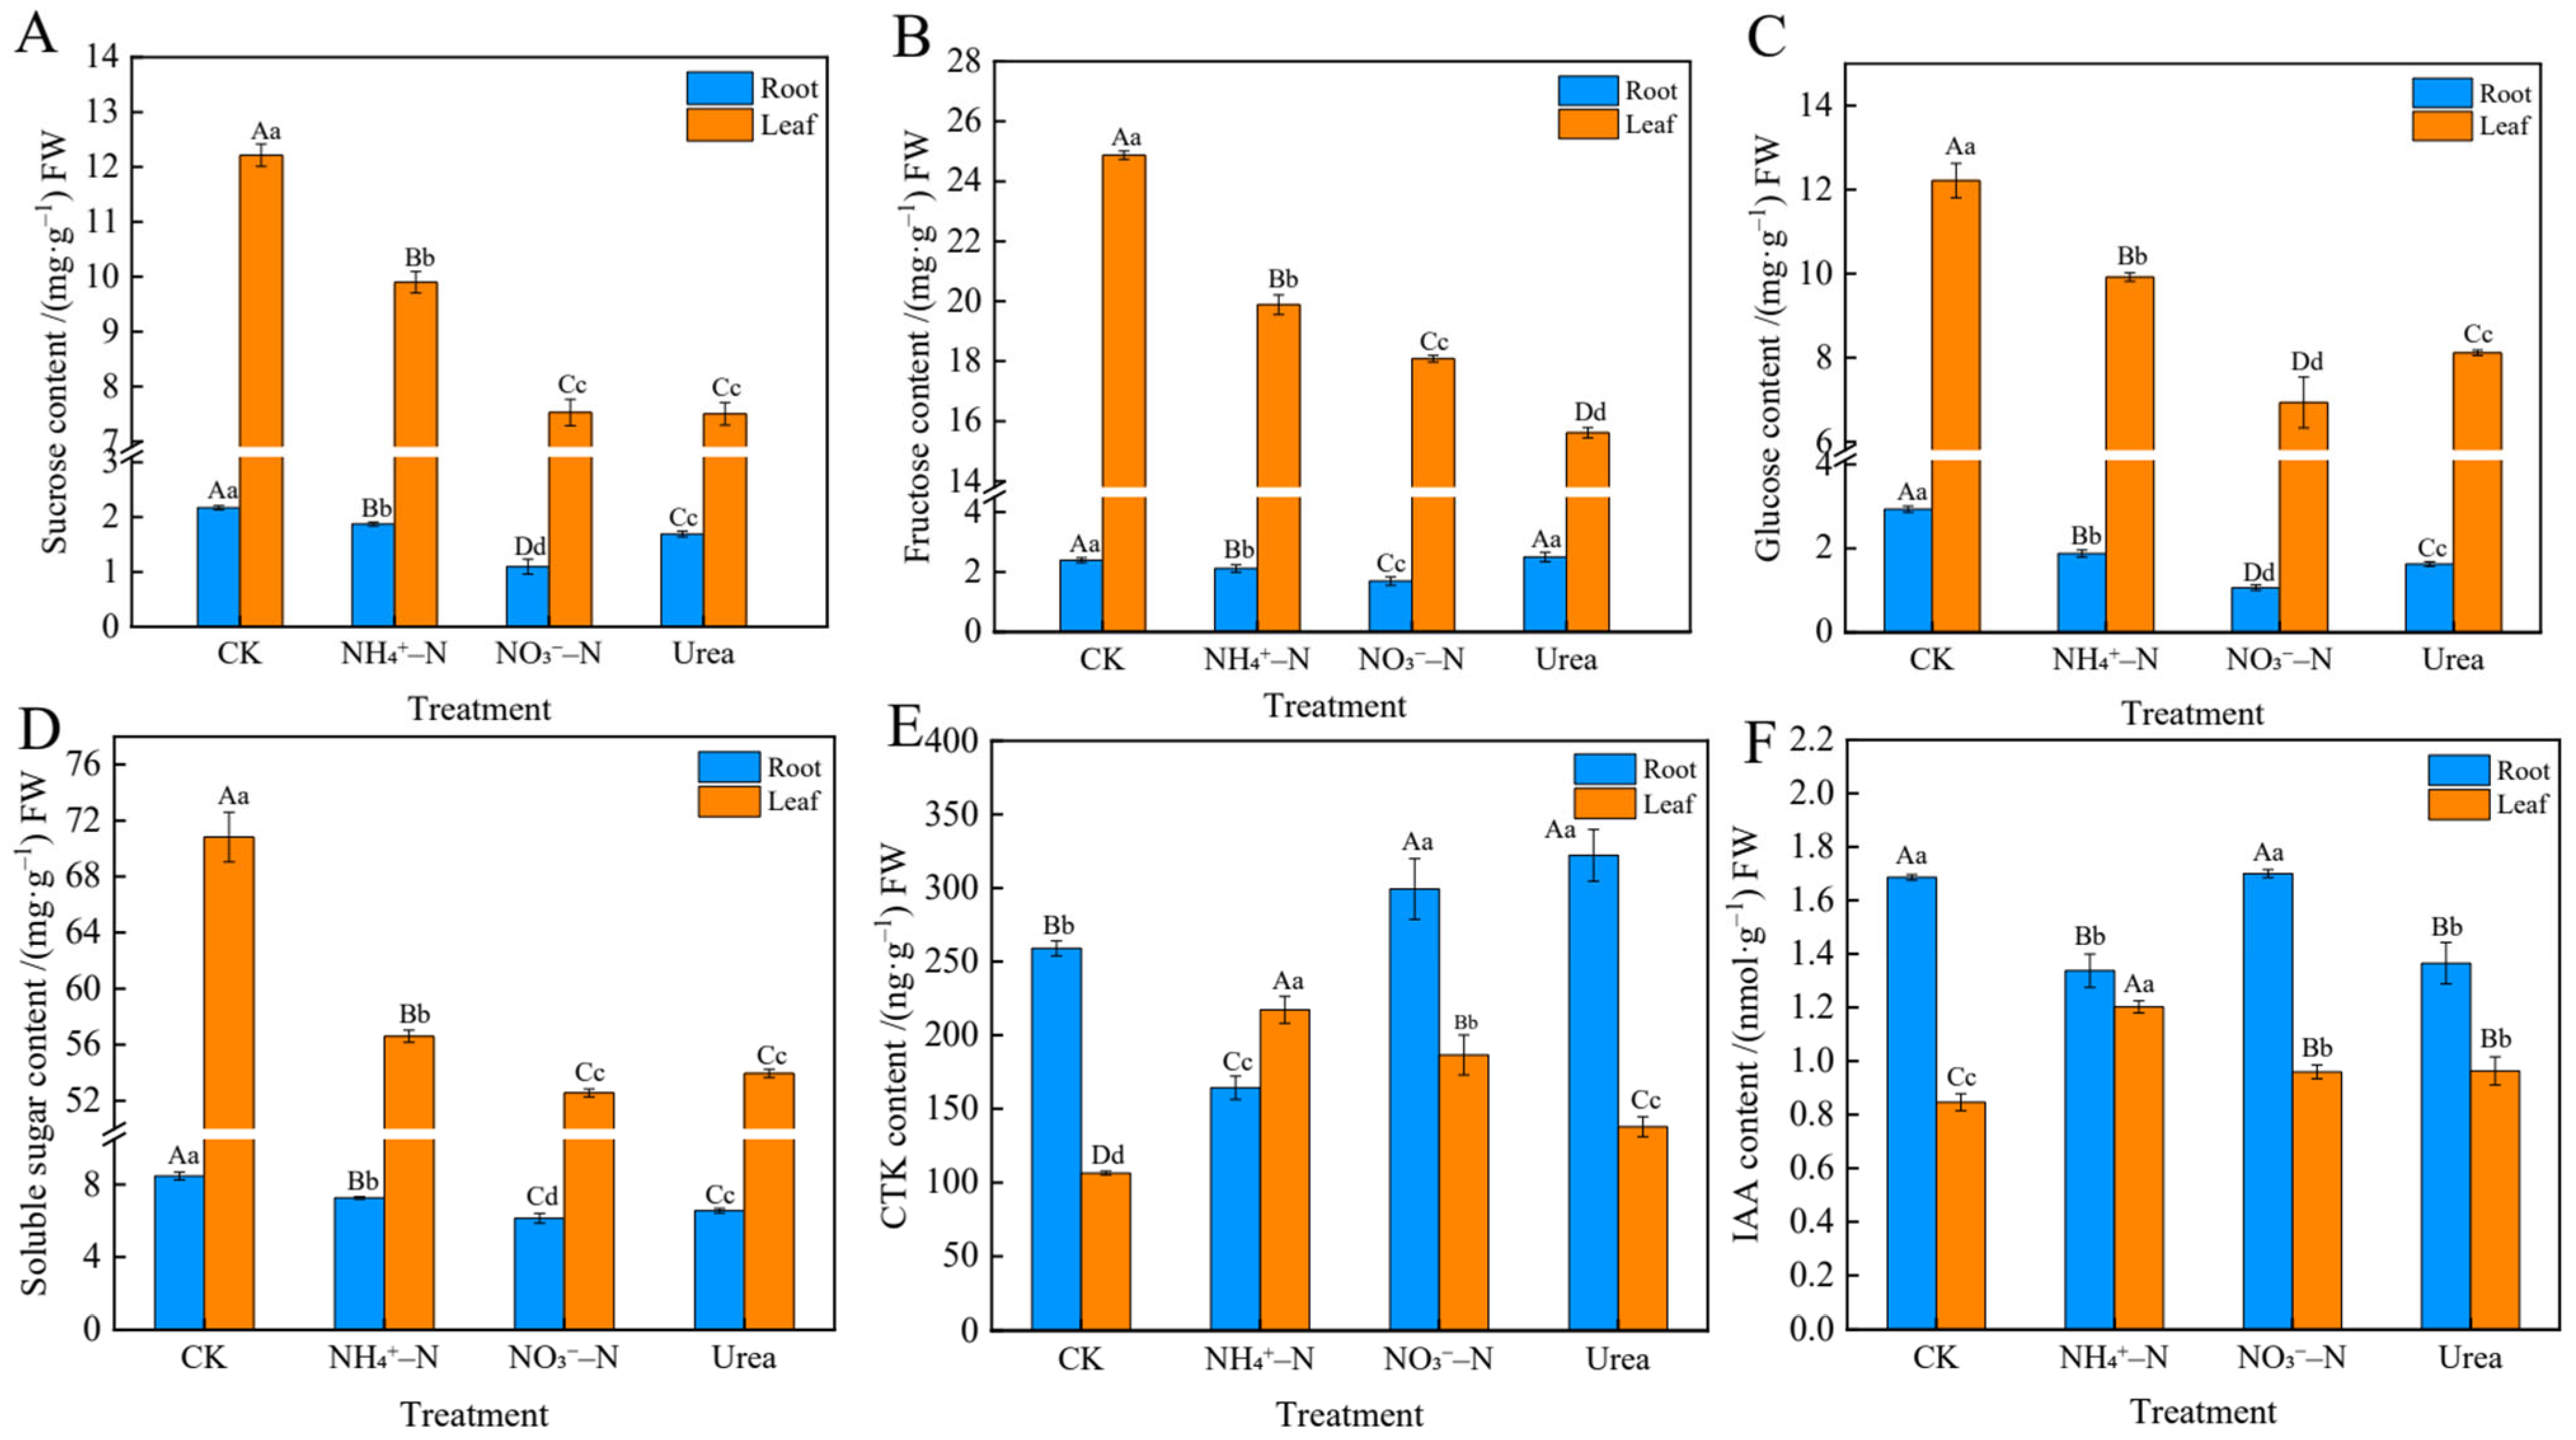
2.6. Sugar and Endogenous Hormone Levels in Roots and Leaves

Differences in N forms resulted in obvious differences in the accumulation and distribution of sugar and endogenous hormones (Figure 5). NH4+–N was more conducive to the accumulation of sugar in leaves and roots. The sucrose content in plants fed the NH4+–N nutrient solution was 31.47% and 32.00% higher in the leaves and 70.00% and 10.65% higher in the roots than in the respective NO3–N and urea treatments (p < 0.01). Fructose was mainly distributed in leaves, exhibiting five times higher levels than in roots (Figure 5A). The change patterns of the fructose, glucose and soluble sugar levels showed a similar result (Figure 5B–D). Except for the fructose content, which was the lowest in leaves with the urea treatment, all sugars in leaves and roots showed the lowest levels with the NO3–N treatment. In addition, CK plants accumulated high levels of various sugars, which may be related to N deficiency stress in plants. The CTK content in the leaves (Figure 5E) peaked at 217.18 ± 7.47 mg∙g−1 with the NH4+–N treatment (p < 0.01), while the CTK content in roots was highest with the urea treatment. Similarly, the NH4+–N treatment increased IAA content in leaves, while NO3–N treatment led to the increase of IAA content in roots (Figure 5F).

2.7. Free Amino Acid Contents in Roots and Leaves

The content and distribution of free amino acids were also affected by different N forms. A total of 17 free amino acids were identified by an automatic amino acid analyzer, i.e., eight essential amino acids (EAAs) and nine nonessential amino acids (NEAAs) (Table 3). Compared with those with the CK treatment, the levels of the free amino acids with three N fertilizer treatments were higher, among which the free amino acid content was highest in roots with the NH4+–N treatment, followed by the NO3–N treatment. In leaves, the content of the free amino acids was also the highest with the supply of NH4+–N, followed by urea treatment. In general, the content of free amino acids in leaves was much higher than that in roots with the different N treatments. In roots and leaves, the total amino acid (TAA) and NEAA levels were ranked in the following order: NH4+–N > urea > NO3–N (p < 0.05). EAAs showed this order only in leaves. The predominant amino acid in roots supplied with NH4+–N was arginine, followed by serine, histidine and alanine, whereas with the NO3–N supply, serine predominated, followed by glutamic acid, alanine and histidine, and with urea supply, arginine predominated, followed by alanine, histidine and phenylalanine. With the NH4+–N and urea treatments in leaves, the accumulation of serine, alanine and proline increased significantly and was higher than that with the NO3–N treatment (p < 0.05), although the phenylalanine content was highest with the NO3–N treatment.

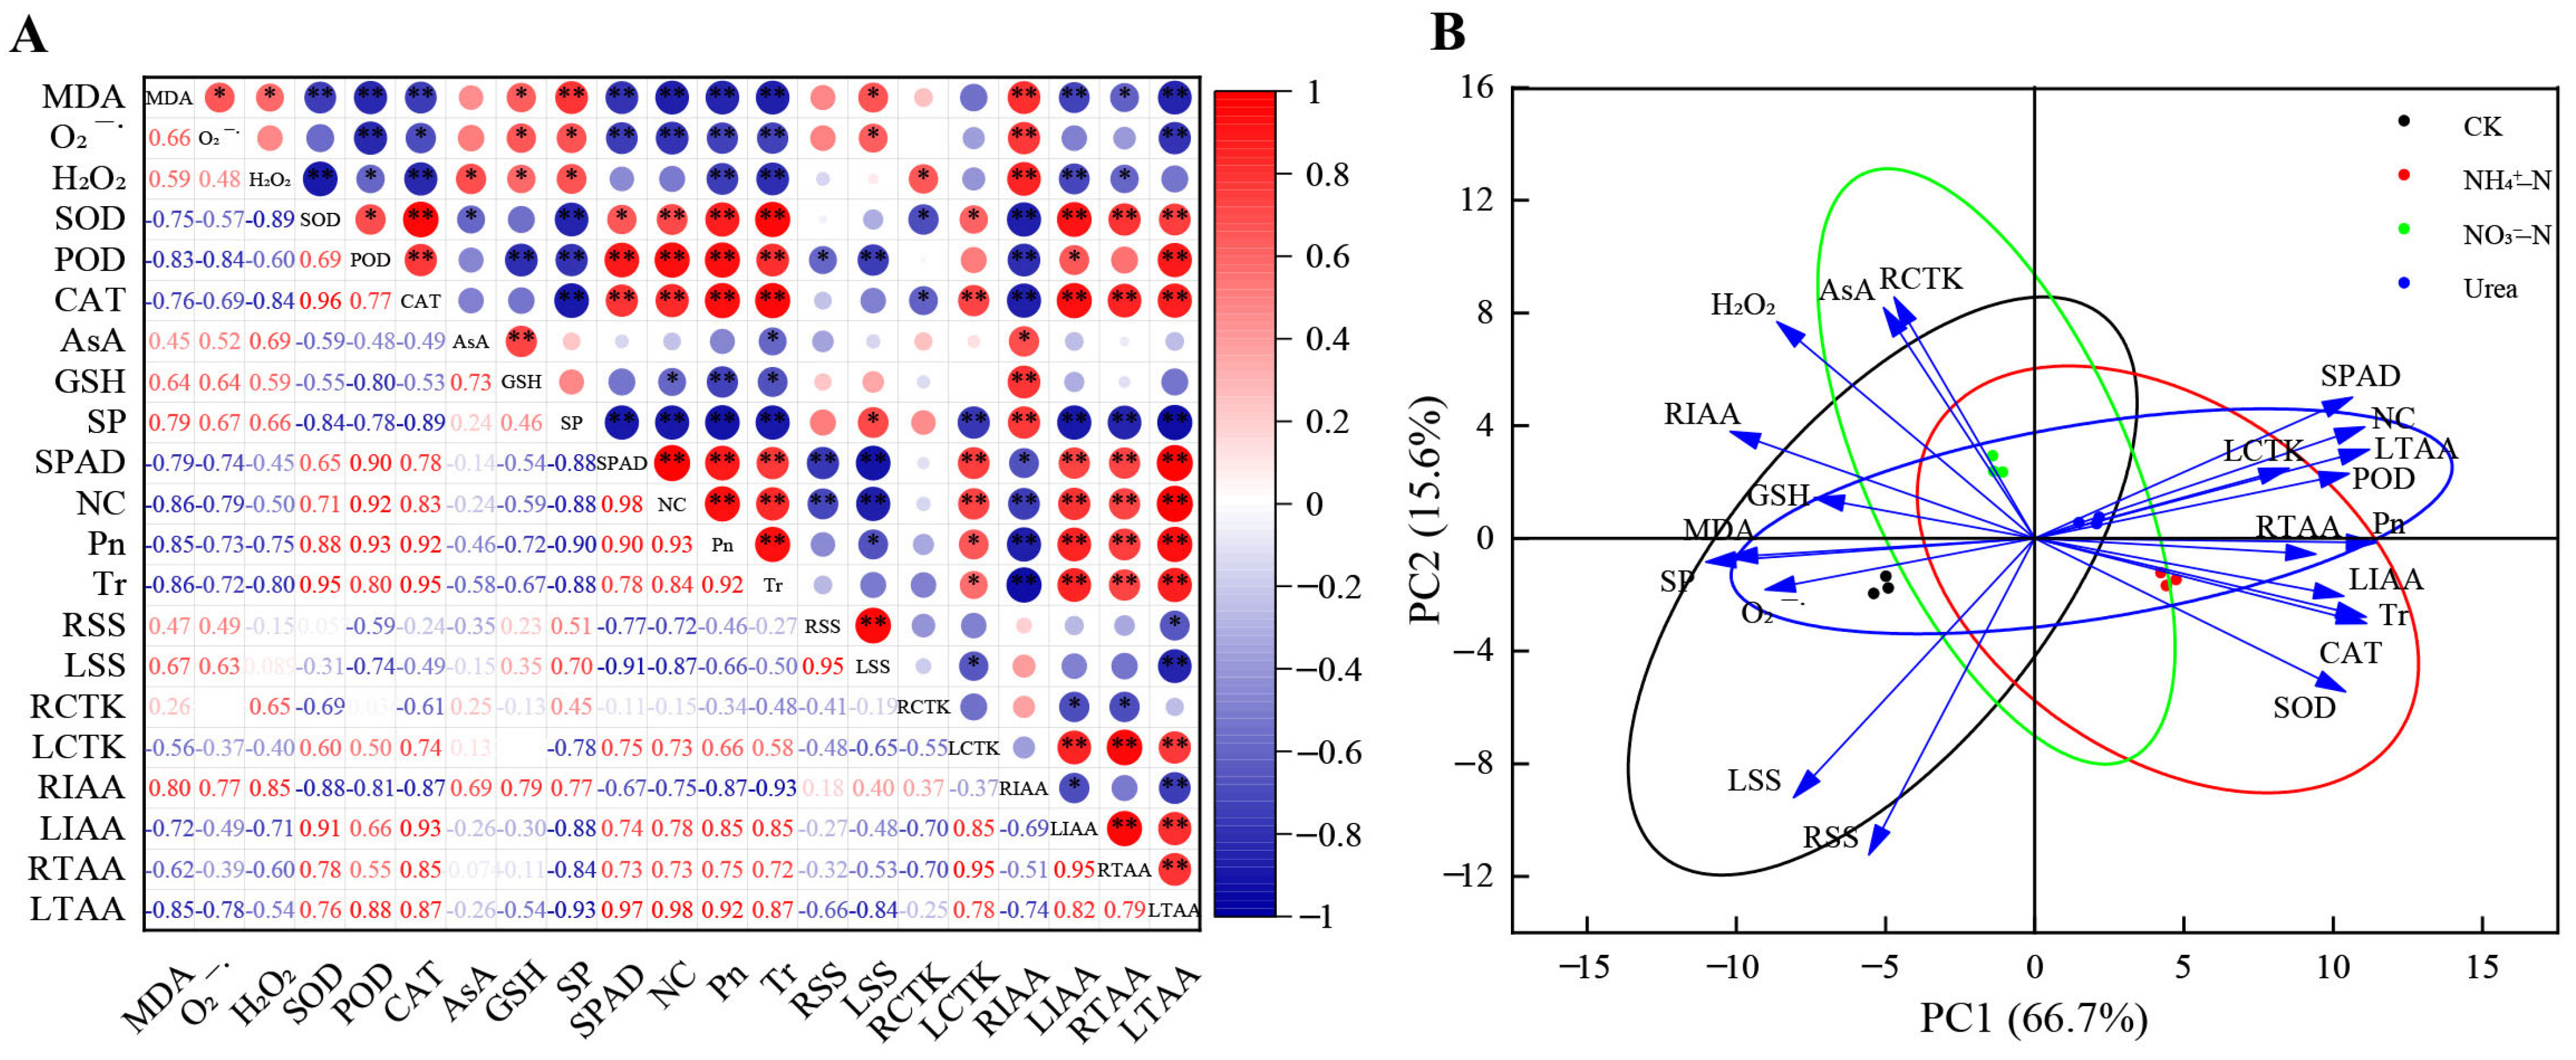
2.8. Correlation and PCA of Physiological Indexes with Different N Forms

According to the correlation matrix analysis results (Figure 6A), the levels of MDA and H2O2 were significantly negatively correlated with the SOD, POD and CAT activities (p < 0.05). The SOD, POD and CAT activities were positively correlated with SP, SPAD, NC, Pn, LIAA and LTAA (p < 0.05). The SPAD, NC, Pn and Tr values were significantly positively correlated with LIAA, RTAA and LTAA (p < 0.01) and negatively correlated with the MDA content and O2·− generation rate (p < 0.01). The other physiological indicators showed varying degrees of correlation.
Principal component analysis (PCA) showed two principal components, PC1 and PC2, and their eigenvalues were greater than 1. Table 4 showed that 66.72% and 15.64% of the variance was explained by PC1 and PC2, respectively. The cumulative variance contribution rate was 82.36% (>75%), so the two principal components accurately covered the information of 21 physiological indicators, with good data interpretation and high reliability. In addition, the scatter points corresponding to each treatment were obviously separated, indicating that different N forms had a significant impact on various indicators of blackberry (Figure 6B). The separation degree between the CK treatment and NH4+–N treatment was the largest, and the area of the intersection between the two circles (black and red ellipses) was the smallest, indicating that the difference between the CK and NH4+–N treatments was the most significant. The eigenvectors reflect the degree and direction of the influence of each trait on the principal component loading. On PC1, antioxidant enzyme activities, photosynthetic indicators, hormones (in leaves) and the total amino acid content had large positive coefficient values, indicating that these indicators had a large positive effect, whereas membrane lipid peroxide, GSH, SP and RIAA were negatively correlated. PC2 was significantly negatively correlated with RSS and LSS, whereas AsA and RCTK showed a significantly positive correlation (eigenvalue > 0.6, Table 4 and Figure 6B).

2.9. Correlation between Growth Indicators and Principal Components

It should be noted that the principal components PC1 and PC2 were independent and uncorrelated with each other. The relationship between the growth status of blackberry with different N forms and the physiological response could be analyzed by exploring the correlation between blackberry growth indexes and the two principal components. Data analysis indicated that all growth indicators showed a good positive correlation with principal component PC1, among which the significance of the plant height, shoot and whole plant dry weight was p < 0.01 and that of the main stem diameter and root dry weight was p < 0.05 (Table 5). In addition, except for root dry weight, which was significantly positively correlated with principal component PC2, the other growth indicators had no correlation. Therefore, principal component PC1 explained the growth of blackberry with different N treatments well. In other words, MDA, O2·−, H2O2, SOD, POD, CAT, GSH, SP, SPAD, NC, Pn, Tr, LCTK, RIAA, LIAA, RTAA and LTAA (marked with ** on PC1) were closely related to the blackberry response to different N forms.

3. Discussion

Our study was designed to evaluate the vegetative growth response of blackberry plants supplied with different N forms, which has not been well addressed in current large-scale commercial blackberry plantations. NH4+–N and NO3–N are the most important forms of inorganic N absorbed by plants and have important effects on plant growth. The mainstream view is that urea, as an organic N form, must be catalyzed to NH4+ before it can be absorbed by plants [11]. In other words, NH4+ and urea share a common metabolic pathway, so it is critical to explore the preferences for the two inorganic N forms. In general, plants can adapt well when NO3–N is supplied as the sole N source, even at high concentrations [33]. In contrast, when NH4+–N is supplied at relatively low concentrations, plants exhibit metabolic disorders such as membrane structure damage and disrupted osmoregulation systems [34]. An increasing number of studies have shown that this phenomenon is not absolute but is mainly related to plant species [35,36]. For example, it has been found that corn, tea tree, blueberry, etc., have better tolerance to NH4+–N [8,27,37]. Our research showed that blackberry grew better with the NH4+–N treatment, especially the roots (Figure 1C). However, NO3–N treatment significantly inhibited root biomass accumulation, indicating that NH4+–N was more strongly associated with root growth. The assimilation cost of NH4+–N is reported to be lower than that of NO3–N [38], which may be the primary reason many plants prefer NH4+–N to NO3–N. Efficient uptake of NH4+–N may contribute to the long-term adaptation of plants to an NH4+–N environment, as our study showed that antioxidant enzyme (SOD, POD and CAT) activities were enhanced to maintain ROS and MDA at normal levels (Figure 3A–F). In addition, the increased photosynthetic rate (Figure 4C) made it possible for roots and leaves to accumulate more carbohydrates (glucose, fructose, etc.) (Figure 5A–D), which, together with the increased free amino acid content (Table 3), may improve the adaptation of blackberry to NH4+–N [10]. This is consistent with previous findings and is a common feature exhibited by plants that prefer or tolerate NH4+–N [10,39].
Different N sources can affect plant growth and biomass allocation. Our study showed that the application of NH4+–N or urea increased the plant height, root biomass and shoot biomass, which indicated that N availability can alter biomass accumulation and distribution between roots and shoots [40], and the preferred N sources for increasing biomass accumulation were NH4+–N and urea (Figure 1A,B). In this study, the higher N and chlorophyll (SPAD) levels in leaves increased the net photosynthetic rate (Figure 4A,C) and generated more carbohydrates, ultimately increasing the biomass of the above- and underground parts. In addition, our findings are also consistent with the results of Hessini et al. [13] and Khalsa et al. [7]. It was reported that NO3–N did not contribute to the increase in biomass, which may be the photosynthetic rates were lower in the NO3–fed plants due to the increased costs of NO3 reduction. The roots of NO3–fed plants exhibited decreased antioxidant enzyme activities and increased ROS and MDA levels, which may be one of the reasons why plants showed suppressed root growth [10].
Many researchers ascribe the negative effects of NH4+–N application on plants to a decrease in the pH in the root zone below five [41]. In our study, acidification and alkalization of substrates were observed in plants supplied with the NH4+-N (or urea) and NO3–N, respectively (Table 2) [5]. When NH4+–N was supplied, the pH of the rhizosphere was the lowest at 4.45, while the EC and the content of alkaline hydrolyzed nitrogen in the root environment reached the highest values, 1.83 mS/cm and 571.2 mg/kg, respectively (Table 2). As the blackberries grew well with NH4+-N or urea, we have reason to assume that blackberries prefer an acidic environment. The reduced pH of the root zone was due to the excessive ion exchange between NH4+ and H+, and then H+ was released from root cells [41]. In addition, nitrification also leads to the release of H+ [42]. Electrical conductivity (EC) is an indicator of water-soluble salts, which are mineral nutrients in soils that can be quickly utilized by plants [43]. We found that NH4+ provided more abundant mineral nutrients in the cultivation substrate. Alkali-hydrolysable nitrogen (AHN) is a form of available N, and NH4+–fed plants exhibited increased available N, which may be one of the reasons that plants with the NH4+–N treatment had higher biomass, photosynthetic rate and SPAD value. In addition, inorganic N had little effect on SOC and SOM, while organic N significantly increased their content, which is the same as conventional results.
ROS (including O2·− and H2O2) and membrane lipid peroxides (MDAs) are metabolites produced by plants during growth, and excessive amounts can trigger membrane lipid peroxidation and damage cell membranes [44]. During evolution, plants formed an antioxidant system to resist the damage caused by ROS and MDAs, which mainly includes antioxidant enzymes (SOD, POD and CAT) and nonenzymatic antioxidants such as AsA and GSH. We found that with NO3–fed plants were more likely to induce the formation of ROS and MDA than NH4+ (or urea) –fed plants (Figure 3), leading to oxidative stress, an imbalance of oxidation and antioxidants [45] and the inhibition of root cell division and elongation. This is consistent with the findings in roots of Spartina alterniflora [46]. Likewise, antioxidant enzyme systems may be closely related to the N preference of plants. Plants prefer certain types of N, showing good adaptation abilities. Long-term natural selection results in plants with higher SOD, POD and CAT activities maintaining free radicals at a normal level [47]. In this study, blackberry roots exhibited higher antioxidant enzyme activities with the NH4+–N and urea treatments than with the NO3–N treatment, which suggests that plants have a strong ability to scavenge free radicals. In addition, the activities of SOD, POD and CAT in blackberry roots were the lowest with the CK treatment, which may be due to the destruction of the antioxidant system and the inhibition of enzyme synthesis in roots under long-term nitrogen deficiency. Interestingly, when NO3 was used as the sole N source, the levels of AsA and GSH increased significantly, which may be because the roots produced a large amount of free radicals with the NO3–N treatment, which stimulated antioxidant action, leading to the synthesis of large amounts of antioxidants to decrease the ROS content. In addition, the soluble protein (SP) content also showed a similar trend (Figure 3I). SP is considered an important osmotic regulator that maintains the balance of osmotic potential inside and outside cells [48]. Compared with other N sources, a high accumulation of SP with the NO3–N treatment was reported to improve the water retention capacity of cells and protect biofilms from NO3 toxicity [49]. NH4+ significantly increased antioxidant enzyme activities and reduced ROS and MDA production in roots compared with the NO3–N treatment. The specific mechanisms are unclear [50] but may be beneficial for enhancing antioxidant defense systems to protect plants from oxidative damage [46].
Photosynthesis and photosynthetic products such as sucrose and glucose are energy sources used to ensure that plants complete specific life activities. Photosynthesis is closely related to N availability, as N is an important component in the synthesis of chlorophyll and enzymes [51]. N availability was positively correlated with photosynthetic activity and sugar metabolism (Figure 6A), which is consistent with the responses to the NH4+–N treatment in this experiment. Our photosynthetic data showed that NH4+–fed plants had the highest net photosynthetic rate (Pn), transpiration rate (Tr) and stomatal conductance (Gs) (Figure 4C,D). This may be related to our observation of the leaf microstructure. NH4+–N can increase the number and size of stomata (Figure 2S,T), which provides the possibility of accelerating the exchange of CO2 and water between the cell and environment, and promote photosynthesis. In the CK group, N deficiency stress changed the leaf surface configuration, resulting in an increase in the UECs, GHs and stomatal closure (Figure 2Q,R,T), thereby reducing water evaporation, inhibiting photosynthesis and slowing metabolic activity, which is a self-protective defense mechanism in plants [52]. In addition, some researchers believe that NH4+ promotes photosynthesis because the cost of light energy to assimilate NH4+ is lower than that of NO3 [9]. In studies on Phaseolus vulgaris L. [53] and sugar beets [54], the CO2 assimilation rate of NH4+–fed plants was higher than that of NO3–fed plants. Our research showed that more Mg and Mn accumulated in leaves with the NH4+–N treatment (Table 2), which was beneficial to the synthesis of chlorophyll and improved the photosynthetic ability of plants. In plants, Ca mainly moves from the xylem to leaves by transpiration, and the Tr was higher in NH4+–fed plants, with higher transpiration rates leading to increased transport of calcium ions (Table 2). Notably, our experiments showed that NH4+ had a negative effect on leaf water use efficiency (LWUE), which may be due to the osmotic regulation of leaves by NH4+, which inhibited the absorption of K+ by leaves and ultimately reduced the water uptake rate [36]. In addition, researchers reported that in kidney beans, NH4+ significantly affected the expression of aquaporins [9]. NH4+–fed plants accumulated more sugars in roots and leaves, including glucose and sucrose (Figure 5A–D), which may be related to the higher photosynthetic rate in the NH4+–fed plants [44]. Building the C skeleton and obtaining energy (ATP) requires the breakdown of sugars for various life activities, so accumulating more sugars means the plant can better adapt to the NH4+–N environment [15].
It is well known that the long-term single application of a certain fertilizer can easily cause soil salinization. Our study showed that NH4+–N could effectively reduce the Na content in leaves (Table 1) and slow the transport of Na+ from the root system to the leaves, contributing to salt tolerance [55]. Ottow et al. [56] used X-ray energy spectrum analysis and found that Populus euphratica leaves can protect the cytoplasm from excessive Na+ entry after sodium ion levels reach a critical threshold. Therefore, we speculate that NH4+–fed blackberry plants may dilute a fixed amount of salt and prevent excess Na+ from entering the root cells.
NH4+ assimilation requires the formation of a large amount of 2-oxoglutarate from glucose, so it has been reported that tolerance to NH4+ is related to carbohydrates in roots [15]. This experiment showed that the glucose concentration in blackberry roots supplied with NH4+ was higher than that in roots supplied with NO3, as were the sucrose and fructose concentrations (Figure 5A–C). Similar results were found in tea tree [57]. With the NH4+–N treatment, the photosynthetic rates of plants increased, as did the biomass, so the plants had more leaves (a higher-capacity source) to synthesize sugars and finally input sugars to the roots [57]. Some researchers believe that CTK is the most significant hormone affecting plant N transport, especially N regulation related to side branch formation and development [58]. Our study found that among the three N treatments, the CTK content in leaves was the highest with the NH4+–N treatment and the lowest in roots (Figure 5D), which indicated that NH4+ could promote the transport of CTK from roots to leaves, thereby promoting plant growth and development of side shoots and increasing the biomass of the aerial part (Figure 1B). At the same time, CTK has a positive effect on the distribution and transport of NH4+ and improves the N absorption and utilization rate of plants, which may explain why NH4+–fed blackberry plants can utilize N more efficiently [59]. Meier et al. [60] found that NH4+ stimulated the accumulation of IAA transported from shoots to root vascular systems and promoted the establishment of a highly branched root system. Interestingly, our study found that IAA accumulated most in the leaves with the NH4+–N treatment, possibly contributing to the growth of the aboveground parts. Moreover, this is a highly complex regulatory process in which IAA and CTK jointly participate, and the response mechanism remains to be further studied.
Amino acid metabolism in blackberry is not only the central link of N metabolism but also plays an important role in the regulation of cell osmosis and ROS detoxification [14,61]. In general, the content of free amino acids in N-supplied blackberry plants was significantly higher than that in N-deficient blackberry plants, especially with the supply of NH4+, and there were certain differences in the accumulation of amino acids in roots and leaves. As a sole N source, NH4+ may accumulate in large amounts in leaves, which is usually toxic to plants [14]. The massive accumulation of proline and soluble sugars in blackberry leaves may be a strategy for detoxifying excess NH4+ [62]. Soluble sugars can maintain leaf turgor, and they collaborate with amino acids to maintain cell membrane structure and function under abiotic stresses [63]. In roots, the levels of most of the amino acids, such as proline, aspartic acid and threonine [64,65], with the NO3–N treatment were significantly higher than those with the other treatments (p < 0.05). This suggests that the levels of osmotic regulators may increase in stressed roots to protect the plants from osmotic stress; the root system was indeed in an unfavorable environment, as evidenced by the minimal biomass and accumulated MDA with the NO3–N treatment. Arginine (Arg), an amino acid used for N transport and storage, also promotes root development [66]. Our study showed that NH4+ could increase the Arg content in roots and leaves, similar to the results of Carr et al. [25]. Notably, the content of Arg in roots was more than 10 times that in leaves. This showed that the high accumulation of Arg in roots did not prevent the timely assimilation and transport of NH4+ and promoted N transport from the roots to the aerial parts; excess N was stored as Arg, which is a manifestation of blackberry tolerance to NH4+ [25].
To understand the correlation between the various indicators and determine which indicators had a large impact on plant growth, we studied the correlation between the physiological response to different N forms and the growth of blackberry plants by correlation analysis and PCA. This investigation showed that the levels of MDA and ROS (O2·−, H2O2) were significantly negatively correlated with antioxidant enzyme activities, and the photosynthetic parameters were significantly positively correlated with the antioxidant enzyme activities and IAA and amino acid levels (Figure 6A). Two principal components were extracted from 21 physiological indicators, of which PC1 was significantly associated with blackberry growth (Figure 6A, Table 4 and Table 5). To elucidate the physiological regulatory mechanism of blackberry growth more intuitively under different N conditions, we drew a mechanistic diagram, and the interconnections and regulatory relationships are shown in Figure 7.

4. Materials and Methods

4.1. Plant Material, Growth Conditions, and Treatments

One-year-old cutting seedlings of blackberry cultivar ‘Ningzhi 4’ (Kiowa × Hull) of the same size with no insect pests were used. The seedlings were supplied by Nanjing Baima National Agricultural Science and Technology Park. The experiment was performed in a greenhouse at the Institute of Botany, Jiangsu Province and Chinese Academy of Sciences (32°3′10.01′′ N, 118°49′58.22′′ E) with an average temperature of 29/16 °C (day/night) and a relative humidity between 55% and 80%.
Notably, the rapid growth period of blackberry plants is mainly from May to August, and the colonization period is mainly from March to April. After August, the number of leaves gradually declines, and the aboveground parts gradually die, while the underground parts can live for many years. Our experiments were conducted to study vegetative growth throughout the growth period. In March 2021, the selected cutting seedlings were transplanted into plastic pots (top diameter 30 cm, bottom diameter 24 cm, height 33 cm) with pure coconut peat (pH 5.0, C/N 80) as a culture substrate. After colonization, 40 d of adaptive precultivation was carried out with NPK full nutrient solution (Shandong Jining Jinshan Biological Engineering Co., Ltd., Jining, China). Subsequently, a 20-d fertilizer control treatment (water only) was carried out. In May, the seedlings were divided into four groups, namely, the nitrogen deficiency group (CK), ammonium nitrogen group (NH4+-N), nitrate nitrogen group (NO3-N) and organic nitrogen group (urea). During the test, the seedlings received different N forms, and the total N supply concentration was 15 mM [19]. Each treatment was set up in nine pots as repeats, completely randomly arranged. The CK group received a modified Hoagland nutrient solution without N, and the other elements remained unchanged. The nutrient solution (excluding N) contained 588 mg/L CaCl2·2H2O, 136 mg/L KH2PO4, 372.8 mg/L KCl, 493 mg/L MgSO4·7H2O, 6.2 mg/L H3BO3, 16.9 mg/L MnSO4·H2O, 36.7 mg/L EDTA·FeNa, 0.83 mg/L KI, 8.6 mg/L ZnSO4·7H2O, 0.25 mg/L Na2MoO4·2H2O, 0.025 mg/L CuSO4·5H2O and 0.025 mg/L CoCl2·6H2O. The N source in the NH4+-N group was replaced by (NH4)2SO4, and that in the NO3-N group was replaced by Ca(NO3)2·4H2O and NaNO3. We used CH4N2O (urea) as an organic N source. In order to prevent the nitration of ammonium and urea, the nitration inhibitor dicyandiamine (DCD) was added to the matrix [9]. During seedling cultivation, the nutrient solution (400 mL per pot) was added twice per week (previously, we have conducted a preliminary experiment, and this amount of N fertilizer was found to be sufficient and suitable for the growth of blackberry plants). The experiment ended in August, and we harvested whole plants.

4.2. Assessment of Plant Growth, Biomass and Morphology

The plant height and main stem diameter were measured using tape and a digital Vernier caliper. The shoots and roots were separately wrapped in paper bags and placed in a drying oven at 80 °C until a constant weight was reached for dry weight determination.
On the 60th day after the experimental treatment, the roots and top fully expanded leaves were cut into small pieces (1.5 × 2 mm) and fixed immediately in 4% (v/v) glutaraldehyde with 0.2 mol/L phosphate buffer (pH 7.8). The samples were further dehydrated in a series of tert-butyl alcohols and lyophilized. Finally, the samples were gold-sputtered and observed using a QUANTA 200 environmental scanning electron microscope (FEI-Co., Ltd., Hillsboro, OR, USA). Five fields of view were randomly selected to count the number of UECs, GHs, stomata and open stomata. In addition, qualitative and quantitative analyses of elements were carried out on the cross section of the leaf blade by using an X-ray energy spectrometer (FEI-Co., Ltd., USA) equipped with a scanning electron microscope.

4.3. Determination of the Physical and Chemical Properties of the Cultivation Substrate

4.3.1. Measurement of pH and EC

The pH and EC of the cultivation substrate were measured by the potentiometric method and electrode method, respectively. Approximately 1 g of dried substrate (passed through a 100-mesh sieve) was weighed and placed in a 50 mL tube. Approximately 10 mL of water was added to dissolve the substrate, followed by centrifugation at 8000 rpm for 10 min at 4 °C. The supernatant was collected and tested, the pH was measured using a pH meter and the EC was measured using a conductivity meter.

4.3.2. Determination of Organic Matter

The potassium dichromate volumetric method is widely applied to estimate the SOM content. The dried substrate (0.01 g) was poured into a glass test tube, and 5 mL 0.8 mol/L 1/6 K2CrO7 standard solution and 5 mL concentrated sulfuric acid were added. The solution was heated to 180 °C in an oil bath and boiled for 5 min. Then, it was titrated with 0.2 mol/L FeSO4, and the solution changed from orange–yellow to blue–green and then to brown–red as the end point of the titration.
S O C ( % ) = 0.8 × 5.0 V 0 × ( V 0 V ) × 0.003 × 1.1 m 1 × K 2 × 100
S O M ( % ) = S O C ( % ) × 1.724
where 0.8 (mol/L) is the concentration of 1/6 K2CrO7 standard solution and 5.0 (mL) is its volume; V 0 is the volume of FeSO4 solution for blank calibration, mL; V is the volume of FeSO4 solution used to titrate the sample, mL; 0.003 is the molar mass in kg of 1/4 carbon atoms; 1.1 is the oxidation correction coefficient; 1.724 is the coefficient used to convert organic carbon into organic matter; m 1 is the mass of the dried substrate sample, g; K 2 is the conversion factor to convert moist substrate to air-dried substrate; and S O C represents substrate organic carbon.

4.3.3. Determination of Alkali-Hydrolysable N

Alkali-hydrolysable N was determined by the alkaline hydrolysis diffusion method [11]. The dried substrate (0.5 g) was evenly placed into the outer chamber of the diffusion dish. Approximately 2 mL of 2% boric acid solution and 1 drop of N indicator were added to the inner chamber of the diffusion dish. The outer edge of the diffusion dish was coated with Arabic glue and covered with a ground glass lid. The glass lid was pushed aside, 10 mL of 1.2 mol/L NaOH was quickly added and the ground glass lid was closed. Rubber bands were used to hold the ground glass lid in place and the diffusion dish was placed in a 40 °C incubator for 24 h. Finally, the solution was titrated with 0.01 mol/L standard hydrochloric acid solution.
A H N ( mg / kg ) = V V 0 × C × 14 × 1000 W
where V 0 is the volume of hydrochloric acid consumed in the blank experiment, mL; V is the volume of hydrochloric acid consumed by the sample, mL; 14 represents the grams of 1 mol N; 1000 represents the grams of N converted into a 1 kg sample; C is the standard concentration of hydrochloric acid; and W is the mass of dried substrate sample, g.

4.4. Measurement of Root Physiology and Antioxidant Indicators

The malondialdehyde (MDA) content in blackberry roots was determined by the thiobarbituric acid (TBA) method [67]. The superoxide anion radical (O2·−) generation rate was determined according to the hydroxylamine oxidation reaction method [68]. The hydrogen peroxide (H2O2) content was determined using a kit (A064-1-1, Nanjing Jiancheng Bioengineering Institute, Nanjing, China). The SOD activity was determined by the nitro blue tetrazolium (NBT) method [69]. POD activity was determined by catalytic hydrogen peroxide reactions [23]. The amount of enzyme that catalyzed 1 microgram of substrate per minute per gram of tissue was defined as a unit of POD activity (U) at 37 °C. The CAT activity was determined by the ammonium molybdate method [70]. One unit of CAT activity (U) was defined as the amount of 1 μM H2O2 decomposed per second per gram of tissue. The ascorbic acid (AsA) content was determined according to the method of Asami et al. [71], and the reduced glutathione (GSH) content was determined according to the method of Anderson [72]. The SP content was determined using Coomassie brilliant blue staining [73].

4.5. Analysis of Photosynthetic Parameters

The relative chlorophyll content (SPAD) and N content (usually the upper fully expanded leaves) were monitored every three days with a plant nutrition measurement instrument (TYS-4N, Zhejiang TOP Cloud-agri Technology Co., Ltd., Hangzhou, Zhejiang, China). Approximately 30 leaves in each treatment were selected for observation for 60 days.
In mid-July (when the weather was sunny), the photosynthetic parameters were measured using an LI-6800 photosynthesis instrument (Beijing Ecotek Technology Co., Ltd., Beijing, China) on mature leaves of robust branches from 8:00 to 11:00. Approximately 5 leaves were selected per plant, and 4 seedlings were selected per treatment. In addition, the atmospheric temperature (AT) and atmospheric CO2 concentration (Ca) were measured every hour on that day. The light intensity during the measurement was approximately 1500 μmol/(m2·s).

4.6. Determination of the Sugar and Endogenous Hormone Contents in Roots and Leaves

The sucrose, fructose, glucose and soluble sugar levels were estimated using a testing kit (Nanjing Jiancheng Bioengineering Company, Nanjing, China). CTK and IAA levels were determined by enzyme-linked immunosorbent assays (ELISAs) [74]. The fresh tissue (0.2 g) was ground in 80% methanol at 4 °C for 12 h and then centrifuged at 10,000 rpm for 15 min. This process was repeated twice, and the supernatants were dried with a N2 blow and rotary evaporator. The freeze-dried remaining substances were dissolved in phosphate buffer (containing 0.1% (v v−1) Tween-20 and 0.4% (m v−1) NaCl; pH 7.5) and then analyzed by ELISA.

4.7. Assessment of Free Amino Acid Contents in Roots and Leaves

The free amino acid levels were determined according to the method of Zhou et al. [75]. Approximately 0.2 g of dry sample (passed through a 0.25 mm sieve) was added to a conical flask and brewed with 10 mL of boiled water. The mixture was heated and shaken in a water bath at 95 °C and extracted for 20 min. Then, vacuum filtration was performed while the mixture was still hot to obtain a filtrate. The filtrate was vacuum freeze-dried (FD5 freeze dryer, SIM, USA). After drying, dilution buffer was added to dissolve the filtrate, which was passed through a 0.22 µm filter membrane, and free amino acids were detected using an S433D automatic amino acid analyzer (Sykam, Eresing, Germany). The analysis conditions were as follows: chromatographic column, LCA K06/Na; mobile phase A, 0.012% citric acid-sodium citrate buffer, pH 3.45; mobile phase B, 0.02% citric acid-sodium citrate, pH 10.85; 58–74 °C, gradient temperature control; flow rate elution pump, 0.45 mL/min + derivatization pump 0.25 mL/min; pressure, 3–4 MPa; UV detection wavelengths, 570 and 440 nm.

4.8. Statistical Analysis
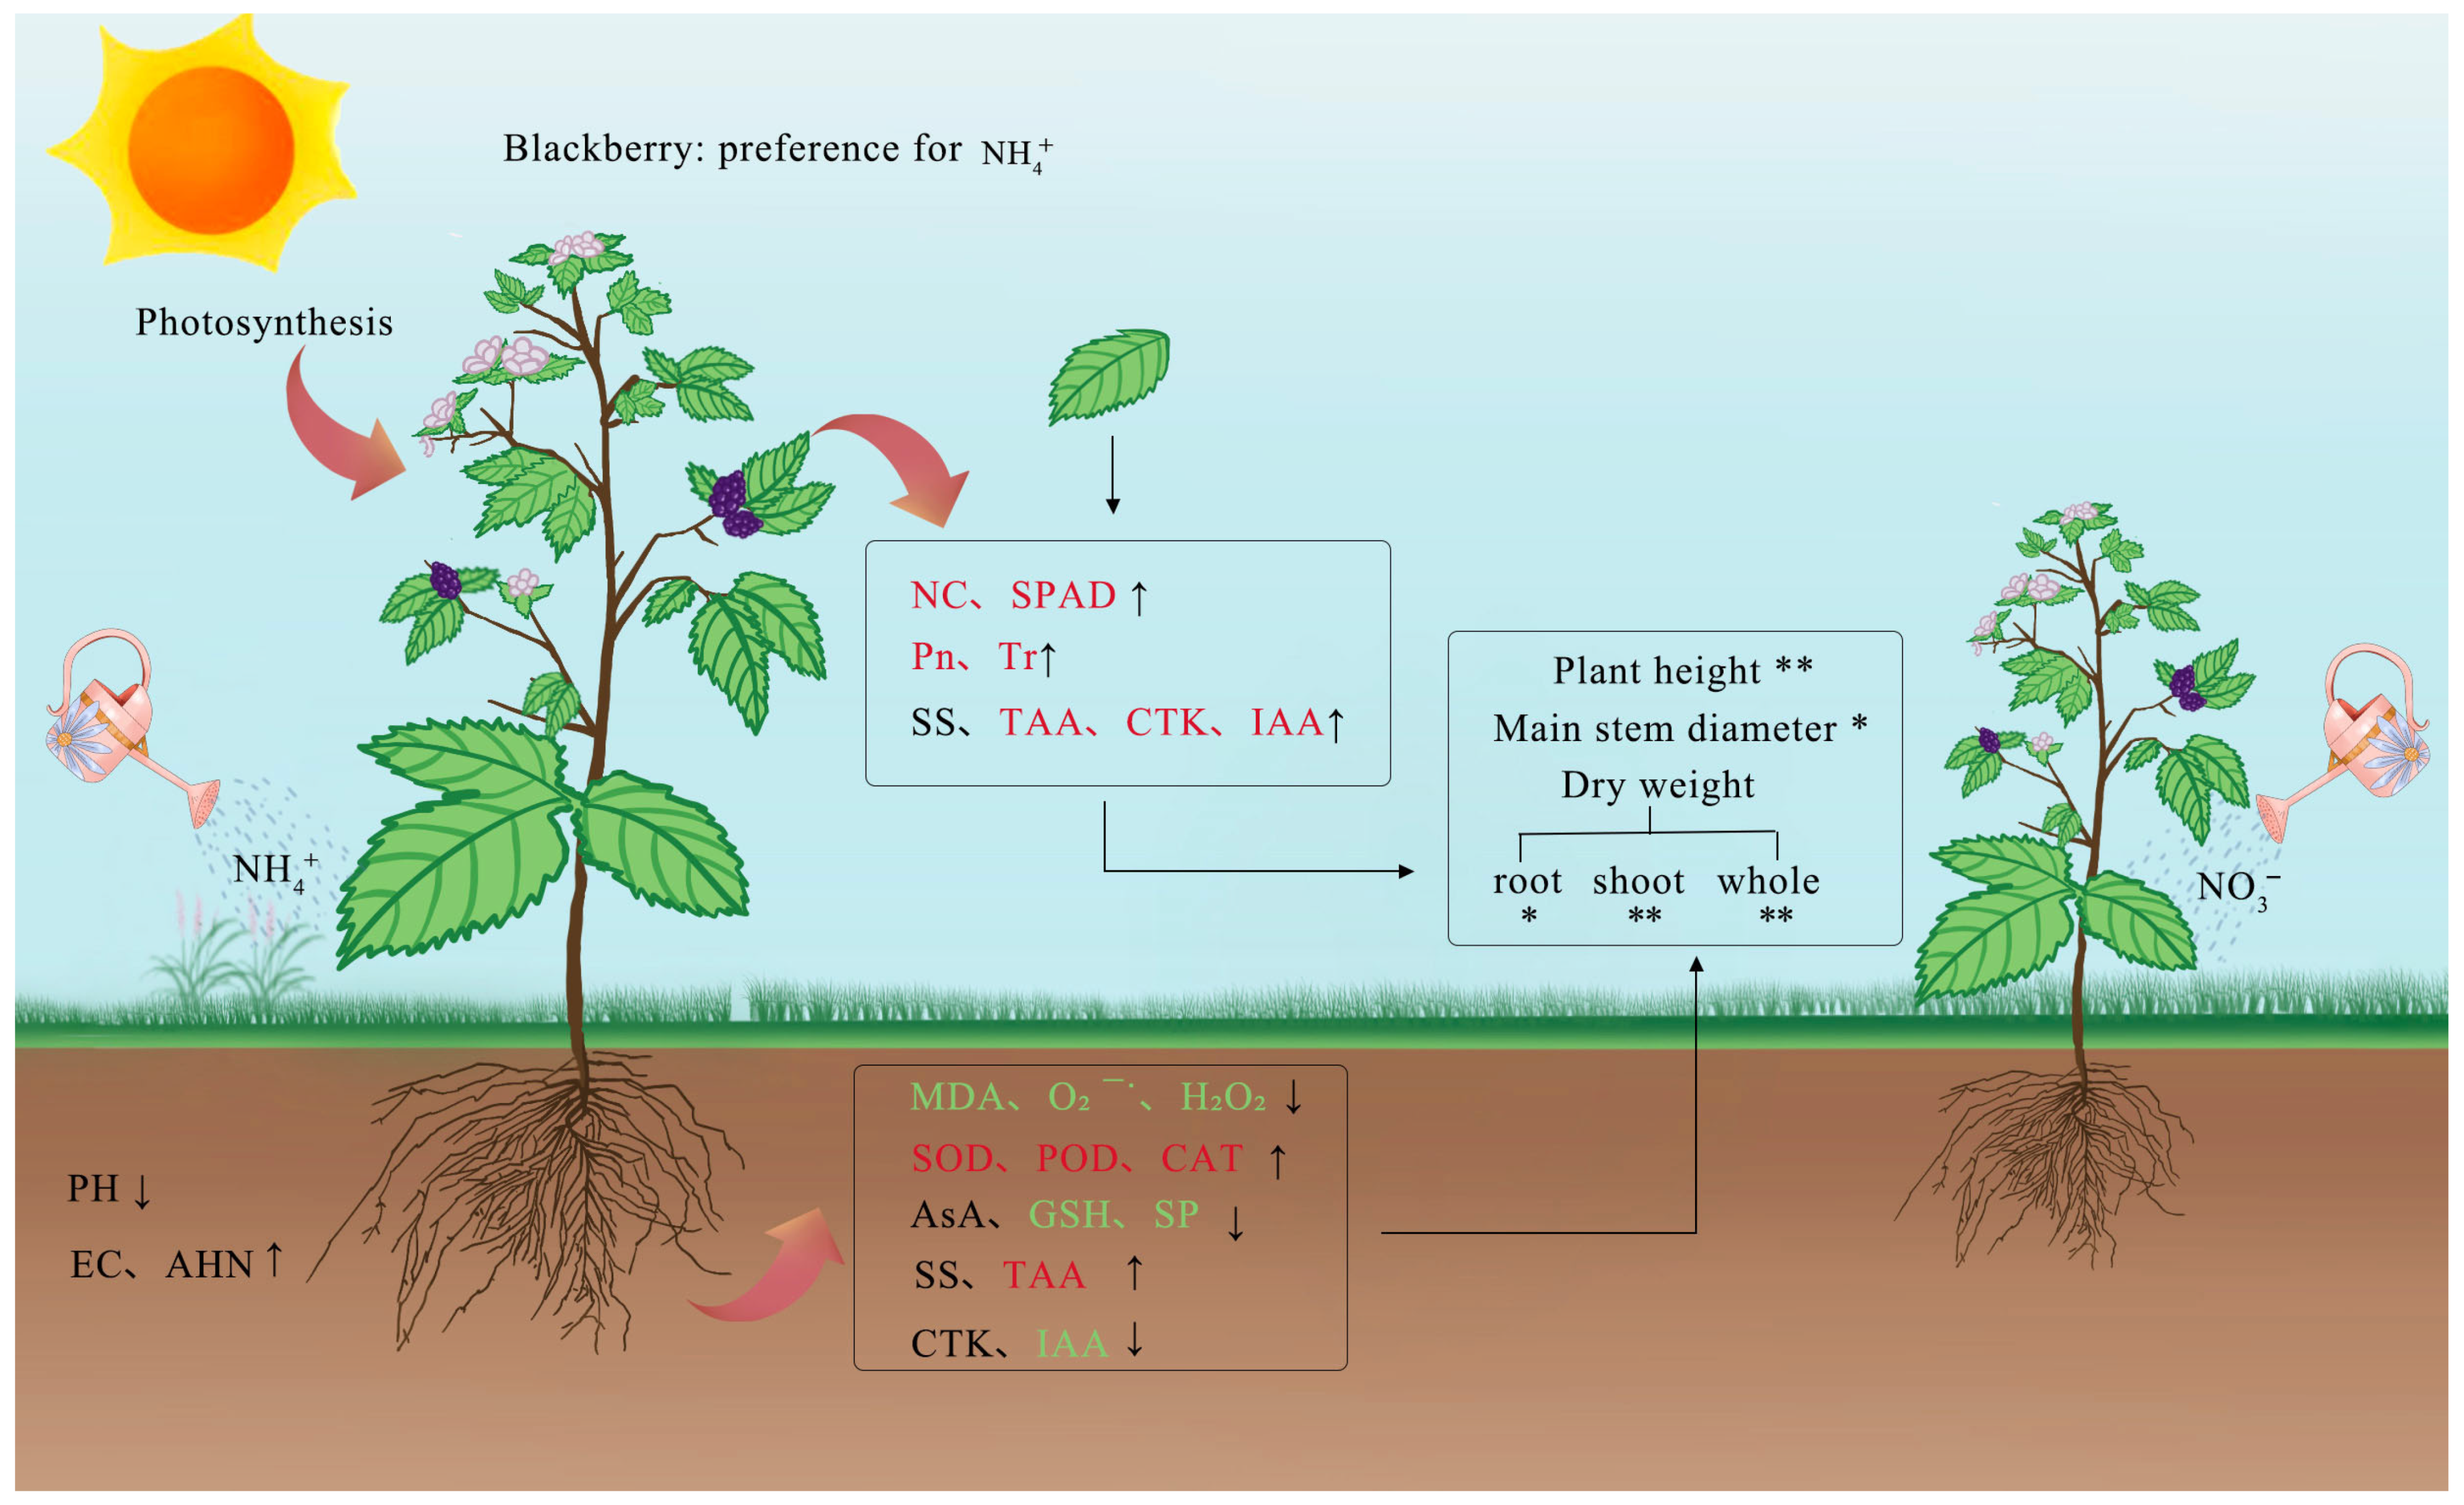
All measurements are presented as the mean ± SD of 3 replicates (photosynthetic parameters n = 20). The data were input and analyzed by Excel 2010 software and IBM SPSS Statistics 25.0 software (IBM Corp., Armonk, NY, USA). The charts were produced by Excel 2010, Origin 2021 (Origin Lab Inc., San Francisco, CA, USA) and Adobe Photoshop 2020 (Photoshop Software, San Diego, CA, USA). The growth parameters, photosynthetic index, antioxidant system, soluble proteins, sugars, amino acids, hormones and the physical and chemical properties of substrates were analyzed by the general linear model, which is a fixed effect model. Normal distribution and homogeneity test of variance were conducted on samples before ANOVA processing, which all met the above conditions. One-way ANOVA was performed for significance testing (p < 0.05). Duncan’s test was used to compare the means of all paired measurement values. Pearson correlation coefficient was used for correlation analysis. Principal component analysis (PCA) analysis was performed with Origin 2021 (Origin Lab Inc., USA). Kaiser-Meyer-Olkin (KMO) test was conducted on sample variables, and KMO > 0.7, so PCA could be conducted.

5. Conclusions

N fertilizer is an important factor affecting the growth and development of the blackberry plant. With the continuous expansion of blackberry cultivation areas in the world, farmers tend to apply excessive N fertilizer to increase yields. However, the unreasonable selection of N fertilizer not only makes blackberry unable to absorb and utilize N normally, but also causes toxicity to plants and pollutes the environment. Based on our findings, the blackberry plant seems to be NH4+–tolerant and NH4+–preferring plants at the seedling stage, and its adaptability to NH4+ is better than that to NO3. Urea is another suitable choice, which has a similar effect as NH4+–N. NH4+ can significantly promote the growth of blackberry and enhance antioxidant enzyme activities and photosynthesis. In addition, NH4+-fed plants were conducive to the accumulation of osmoprotectants such as soluble sugars and amino acids, which could be a strategy to detoxify excess NH4+. In contrast, NO3 inhibited root growth and the plants accumulated more reactive oxygen species and MDA. From the point of view of growers, blackberry seedlings should consider increasing NH4+ in a fertilization program and using less NO3. Our study could provide a practical basis for blackberry fertilization management for sustainable agriculture in the future.

Author Contributions

Conceptualization, W.L. and W.W.; methodology, H.Y. (Haiyan Yang); software, Z.W.; validation, Y.D., Z.W. and L.L.; formal analysis, W.W.; investigation, Y.D. and H.Y. (Hao Yang); resources, W.L. and W.W.; data curation, Y.D. and Z.W.; writing—original draft preparation, Y.D.; writing—review and editing, W.L. and H.Y. (Haiyan Yang); visualization, J.C. All authors have read and agreed to the published version of the manuscript.

Funding

This work was financially supported by the project “Research on Extraction and Utilization Technology of ‘Three Berries’ Functional Components in Nanjing National Agricultural High-Tech Industry Demonstration Zone” (BE2020344), the earmarked fund for Jiangsu Agricultural Industry Technology System (JATS [2021]511 and JATS [2022]510), and the JBGS Project of Seed Industry Revitalization in Jiangsu Province (JBGS [2021]021).

Data Availability Statement

The data generated for this study are available on request to the corresponding author.

Acknowledgments

We thank Nanjing Forestry University for cooperation with the Institute of Botany, Chinese Academy of Sciences of Jiangsu Province, as well as for the experimental materials and experimental sites provided.

Conflicts of Interest

The authors declare no conflict of interest.

References

  1. Yang, H.; Zhang, C.; Wu, W.; Li, W.; Wei, Y.; Dong, S. Physiological responses of blackberry cultivar ‘Ningzhi 1’ to drought stress. Russ. J. Plant Physiol. 2015, 62, 472–479. [Google Scholar] [CrossRef]
  2. Kaume, L.; Howard, L.R.; Devareddy, L. The blackberry fruit: A review on its composition and chemistry, metabolism and bioavailability, and health benefits. J. Agric. Food Chem. 2012, 60, 5716–5727. [Google Scholar] [CrossRef]
  3. Patel, A.; Rojas-Vera, J.; Dacke, C. Therapeutic constituents and actions of Rubus species. Curr. Med. Chem. 2004, 11, 1501–1512. [Google Scholar] [CrossRef]
  4. Strik, B.C.; Clark, J.R.; Finn, C.E.; Bañados, M.P. Worldwide blackberry production. HortTechnology 2007, 17, 205–213. [Google Scholar] [CrossRef] [Green Version]
  5. Hong, S.; Gan, P.; Chen, A. Environmental controls on soil pH in planted forest and its response to nitrogen deposition. Environ. Res. 2019, 172, 159–165. [Google Scholar] [CrossRef]
  6. Liu, S.; Chi, Q.; Cheng, Y.; Zhu, B.; Li, W.; Zhang, X.; Huang, Y.; Müller, C.; Cai, Z.; Zhang, J. Importance of matching soil N transformations, crop N form preference, and climate to enhance crop yield and reducing N loss. Sci. Total Environ. 2019, 657, 1265–1273. [Google Scholar] [CrossRef]
  7. Khalsa, S.D.S.; Smart, D.R.; Muhammad, S.; Armstrong, C.M.; Sanden, B.L.; Houlton, B.Z.; Brown, P.H. Intensive fertilizer use increases orchard N cycling and lowers net global warming potential. Sci. Total Environ. 2020, 722, 137889. [Google Scholar] [CrossRef]
  8. Alt, D.S.; Doyle, J.W.; Malladi, A. Nitrogen-source preference in blueberry (Vaccinium sp.): Enhanced shoot nitrogen assimilation in response to direct supply of nitrate. J. Plant Physiol. 2017, 216, 79–87. [Google Scholar] [CrossRef]
  9. Guo, L.; Meng, H.; Teng, K.; Fan, X.; Zhang, H.; Teng, W.; Yue, Y.; Wu, J. Effects of Nitrogen Forms on the Growth and Nitrogen Accumulation in Buchloe dactyloides Seedlings. Plants 2022, 11, 2086. [Google Scholar] [CrossRef]
  10. Tian, J.; Pang, Y.; Yuan, W.; Peng, J.; Zhao, Z. Growth and nitrogen metabolism in Sophora japonica (L.) as affected by salinity under different nitrogen forms. Plant Sci. 2022, 322, 111347. [Google Scholar] [CrossRef]
  11. Zanin, L.; Tomasi, N.; Wirdnam, C.; Meier, S.; Komarova, N.Y.; Mimmo, T.; Cesco, S.; Rentsch, D.; Pinton, R. Isolation and functional characterization of a high affinity urea transporter from roots of Zea mays. BMC Plant Biol. 2014, 14, 222. [Google Scholar] [CrossRef] [Green Version]
  12. Hessini, K.; Kronzucker, H.J.; Abdelly, C.; Cruz, C. Drought stress obliterates the preference for ammonium as an N source in the C4 plant Spartina alterniflora. J. Plant Physiol. 2017, 213, 98–107. [Google Scholar] [CrossRef]
  13. Hessini, K.; Issaoui, K.; Ferchichi, S.; Saif, T.; Abdelly, C.; Siddique, K.H.; Cruz, C. Interactive effects of salinity and nitrogen forms on plant growth, photosynthesis and osmotic adjustment in maize. Plant Physiol. Biochem. 2019, 139, 171–178. [Google Scholar] [CrossRef]
  14. Huang, H.; Yao, Q.; Xia, E.; Gao, L. Metabolomics and transcriptomics analyses reveal nitrogen influences on the accumulation of flavonoids and amino acids in young shoots of tea plant (Camellia sinensis L.) associated with tea flavor. J. Agric. Food Chem. 2018, 66, 9828–9838. [Google Scholar] [CrossRef]
  15. Jampeetong, A.; Brix, H.; Kantawanichkul, S. Effects of inorganic nitrogen form on growth, morphology, N uptake, and nutrient allocation in hybrid Napier grass (Pennisetum purpureum × Pennisetum americanum cv. Pakchong1). Ecol. Eng. 2014, 73, 653–658. [Google Scholar] [CrossRef]
  16. Boschiero, B.N.; Mariano, E.; Azevedo, R.A.; Trivelin, P.C.O. Influence of nitrate-ammonium ratio on the growth, nutrition, and metabolism of sugarcane. Plant Physiol. Biochem. 2019, 139, 246–255. [Google Scholar] [CrossRef]
  17. Garnica, M.; Houdusse, F.; Yvin, J.C.; Garcia-Mina, J.M. Nitrate modifies urea root uptake and assimilation in wheat seedlings. J. Sci. Food Agric. 2009, 89, 55–62. [Google Scholar] [CrossRef]
  18. Borysiuk, K.; Ostaszewska-Bugajska, M.; Vaultier, M.-N.; Hasenfratz-Sauder, M.-P.; Szal, B. Enhanced formation of methylglyoxal-derived advanced glycation end products in Arabidopsis under ammonium nutrition. Front. Plant Sci. 2018, 9, 667. [Google Scholar] [CrossRef]
  19. Britto, D.T.; Kronzucker, H.J. NH4+ toxicity in higher plants: A critical review. J. Plant Physiol. 2002, 159, 567–584. [Google Scholar] [CrossRef] [Green Version]
  20. Beatty, P.H.; Klein, M.S.; Fischer, J.J.; Lewis, I.A.; Muench, D.G.; Good, A.G. Understanding plant nitrogen metabolism through metabolomics and computational approaches. Plants 2016, 5, 39. [Google Scholar] [CrossRef] [Green Version]
  21. Cruz, J.L.; Alves, A.A.; LeCain, D.R.; Ellis, D.D.; Morgan, J.A. Effect of elevated CO2 concentration and nitrate: Ammonium ratios on gas exchange and growth of cassava (Manihot esculenta Crantz). Plant Soil 2014, 374, 33–43. [Google Scholar] [CrossRef]
  22. Zebarth, B.J.; Tai, H.; Luo, S.; Millard, P.; De Koeyer, D.; Li, X.-Q.; Xiong, X. Effect of nitrogen form on gene expression in leaf tissue of greenhouse grown potatoes during three stages of growth. Am. J. Potato Res. 2012, 89, 315–327. [Google Scholar] [CrossRef]
  23. Podgorska, A.; Gieczewska, K.; Łukawska-Kuźma, K.; Rasmusson, A.G.; Gardeström, P.; Szal, B. Long-term ammonium nutrition of A rabidopsis increases the extrachloroplastic NAD (P) H/NAD (P)+ ratio and mitochondrial reactive oxygen species level in leaves but does not impair photosynthetic capacity. Plant Cell Environ. 2013, 36, 2034–2045. [Google Scholar]
  24. Vuletić, M.; Hadži-Tašković Šukalović, V.; Marković, K.; Dragišić Maksimović, J. Antioxidative system in maize roots as affected by osmotic stress and different nitrogen sources. Biol. Plant. 2010, 54, 530–534. [Google Scholar] [CrossRef]
  25. Carr, N.F.; Boaretto, R.M.; Mattos, D., Jr. Coffee seedlings growth under varied NO3: NH4+ ratio: Consequences for nitrogen metabolism, amino acids profile, and regulation of plasma membrane H+-ATPase. Plant Physiol. Biochem. 2020, 154, 11–20. [Google Scholar] [CrossRef]
  26. Penella, C.; Nebauer, S.G.; San Bautista, A.; López-Galarza, S.; Calatayud, Á. Rootstock alleviates PEG-induced water stress in grafted pepper seedlings: Physiological responses. J. Plant Physiol. 2014, 171, 842–851. [Google Scholar] [CrossRef]
  27. Wang, Y.; Wang, Y.-M.; Lu, Y.-T.; Qiu, Q.-L.; Fan, D.-M.; Wang, X.-C.; Zheng, X.-Q. Influence of different nitrogen sources on carbon and nitrogen metabolism and gene expression in tea plants (Camellia sinensis L.). Plant Physiol. Biochem. 2021, 167, 561–566. [Google Scholar] [CrossRef]
  28. Forde, B.G. The role of long-distance signalling in plant responses to nitrate and other nutrients. J. Exp. Bot. 2002, 53, 39–43. [Google Scholar]
  29. Samuelson, M.E.; Larsson, C.-M. Nitrate regulation of zeation riboside levels in barley roots: Effects of inhibitors of N assimilation and comparison with ammonium. Plant Sci. 1993, 93, 77–84. [Google Scholar] [CrossRef]
  30. Tian, Q.; Chen, F.; Liu, J.; Zhang, F.; Mi, G. Inhibition of maize root growth by high nitrate supply is correlated with reduced IAA levels in roots. J. Plant Physiol. 2008, 165, 942–951. [Google Scholar] [CrossRef]
  31. Mercier, H.; Kerbauy, G.; Sotta, B.; Miginiac, E. Effects of NO3, NH4+ and urea nutrition on endogenous levels of IAA and four cytokinins in two epiphytic bromeliads. Plant Cell Environ. 1997, 20, 387–392. [Google Scholar] [CrossRef]
  32. Strik, B.C.; Bryla, D.R. Uptake and partitioning of nutrients in blackberry and raspberry and evaluating plant nutrient status for accurate assessment of fertilizer requirements. HortTechnology 2015, 25, 452–459. [Google Scholar] [CrossRef] [Green Version]
  33. Glibert, P.M.; Wilkerson, F.P.; Dugdale, R.C.; Raven, J.A.; Dupont, C.L.; Leavitt, P.R.; Parker, A.E.; Burkholder, J.M.; Kana, T.M. Pluses and minuses of ammonium and nitrate uptake and assimilation by phytoplankton and implications for productivity and community composition, with emphasis on nitrogen-enriched conditions. Limnol. Oceanogr. 2016, 61, 165–197. [Google Scholar] [CrossRef]
  34. Moschou, P.N.; Wu, J.; Cona, A.; Tavladoraki, P.; Angelini, R.; Roubelakis-Angelakis, K.A. The polyamines and their catabolic products are significant players in the turnover of nitrogenous molecules in plants. J. Exp. Bot. 2012, 63, 5003–5015. [Google Scholar] [CrossRef] [Green Version]
  35. Camalle, M.; Standing, D.; Jitan, M.; Muhaisen, R.; Bader, N.; Bsoul, M.; Ventura, Y.; Soltabayeva, A.; Sagi, M. Effect of salinity and nitrogen sources on the leaf quality, biomass, and metabolic responses of two ecotypes of Portulaca oleracea. Agronomy 2020, 10, 656. [Google Scholar] [CrossRef]
  36. Zhao, Y.; Wang, Y.; Sun, S.; Liu, W.; Zhu, L.; Yan, X. Different Forms and Proportions of Exogenous Nitrogen Promote the Growth of Alfalfa by Increasing Soil Enzyme Activity. Plants 2022, 11, 1057. [Google Scholar] [CrossRef] [PubMed]
  37. Taylor, S.H.; Hulme, S.P.; Rees, M.; Ripley, B.S.; Woodward, F.I.; Osborne, C.P. Ecophysiological traits in C3 and C4 grasses: A phylogenetically controlled screening experiment. New Phytol. 2010, 185, 780–791. [Google Scholar] [CrossRef]
  38. Guerrero, M.G.; Vega, J.M.; Losada, M. The assimilatory nitrate-reducing system and its regulation. Annu. Rev. Plant Biol. 1981, 32, 169–204. [Google Scholar] [CrossRef]
  39. Esteban, R.; Royo, B.; Urarte, E.; Zamarreño, A.; Garcia-Mina, J.; Moran, J. Both free indole-3-acetic acid and the photosynthetic efficiency play a relevant role in the response of Medicago truncatula to urea and ammonium nutrition under axenic conditions. Front. Plant Sci. 2016, 7, 00140. [Google Scholar] [CrossRef] [Green Version]
  40. Grechi, I.; Vivin, P.; Hilbert, G.; Milin, S.; Robert, T.; Gaudillère, J. Effect of light and nitrogen supply on internal C:N balance and control of root-to-shoot biomass allocation in grapevine. Environ. Exp. Bot. 2007, 59, 139–149. [Google Scholar] [CrossRef]
  41. Dickson, R.W.; Fisher, P.R.; Argo, W.R.; Jacques, D.J.; Sartain, J.B.; Trenholm, L.E.; Yeager, T.H. Solution ammonium: Nitrate ratio and cation/anion uptake affect acidity or basicity with floriculture species in hydroponics. Sci. Hortic. 2016, 200, 36–44. [Google Scholar] [CrossRef] [Green Version]
  42. Heil, J.; Vereecken, H.; Brüggemann, N. A review of chemical reactions of nitrification intermediates and their role in nitrogen cycling and nitrogen trace gas formation in soil. Eur. J. Soil Sci. 2016, 67, 23–39. [Google Scholar] [CrossRef]
  43. Xiao, W.-L.; Wang, Z.-X.; Wu, F.-Z.; Zhou, X.-G. Effects of soil improvement technology on soil quality in solar greenhouse. Environ. Sci. Pollut. Res. 2018, 25, 24093–24100. [Google Scholar] [CrossRef]
  44. Yan, L.P.; Liu, C.L.; Liang, H.M.; Mao, X.H.; Wang, F.; Pang, C.H.; Shu, J.; Xia, Y. Physiological responses to salt stress of T2 alfalfa progenies carrying a transgene for betaine aldehyde dehydrogenase. Plant Cell Tissue Organ Cult. 2012, 108, 191–199. [Google Scholar] [CrossRef]
  45. Hessini, K.; Jeddi, K.; Siddique, K.H.M.; Moran, J.F. Can nitrate-based fertilization be recommended for the cultivation of ammonium-preferring species in a salty ecosystem? The case for Spartina alterniflora. Arab. J. Geosci. 2021, 14, 1259. [Google Scholar] [CrossRef]
  46. Hessini, K. Nitrogen form differently modulates growth, metabolite profile, and antioxidant and nitrogen metabolism activities in roots of Spartina alterniflora in response to increasing salinity. Plant Physiol. Biochem. 2022, 174, 35–42. [Google Scholar] [CrossRef]
  47. Zandalinas, S.I.; Balfagón, D.; Arbona, V.; Gómez-Cadenas, A. Modulation of antioxidant defense system is associated with combined drought and heat stress tolerance in citrus. Front. Plant Sci. 2017, 8, 953. [Google Scholar] [CrossRef] [PubMed] [Green Version]
  48. Kanu, A.S.; Ashraf, U.; Mo, Z.; Sabir, S.-u.-R.; Baggie, I.; Charley, C.S.; Tang, X. Calcium amendment improved the performance of fragrant rice and reduced metal uptake under cadmium toxicity. Environ. Sci. Pollut. Res. 2019, 26, 24748–24757. [Google Scholar] [CrossRef]
  49. Hassanein, R.A.; El Khawas, S.A.; Khafaga, H.S.; Abd El-Nabe, A.S.; Abd Elrady, A. Amelioration of drought stress on physiological performance of pearl millet (Pennisetum americanum) plant grown under saline condition using potassium humate and silicon source. Egypt. J. Exp. Biol. 2017, 13, 57–68. [Google Scholar] [CrossRef]
  50. Wu, Z.; Jiang, Q.; Yan, T.; Zhang, X.; Xu, S.; Shi, H.; Deng, T.; Li, F.; Du, Y.; Du, R. Ammonium nutrition mitigates cadmium toxicity in rice (Oryza sativa L.) through improving antioxidase system and the glutathione-ascorbate cycle efficiency. Ecotoxicol. Environ. Saf. 2020, 189, 110010. [Google Scholar] [CrossRef]
  51. Bassi, D.; Menossi, M.; Mattiello, L. Nitrogen supply influences photosynthesis establishment along the sugarcane leaf. Sci. Rep. 2018, 8, 2327. [Google Scholar] [CrossRef] [PubMed] [Green Version]
  52. Zhao, D.; Reddy, K.R.; Kakani, V.G.; Reddy, V. Nitrogen deficiency effects on plant growth, leaf photosynthesis, and hyperspectral reflectance properties of sorghum. Eur. J. Agron. 2005, 22, 391–403. [Google Scholar] [CrossRef]
  53. Guo, S.; Brück, H.; Sattelmacher, B. Effects of supplied nitrogen form on growth and water uptake of French bean (Phaseolus vulgaris L.) plants. Plant Soil 2002, 239, 267–275. [Google Scholar] [CrossRef]
  54. Raab, T.K.; Terry, N. Carbon, nitrogen, and nutrient interactions in Beta vulgaris L. as influenced by nitrogen source, NO3-versus NH4+. Plant Physiol. 1995, 107, 575–585. [Google Scholar] [CrossRef] [Green Version]
  55. Ahmad, A.; Kazuto, S.; Hans, L.; Kyozo, C. Change in Uptake, Transport and Accumulation of Ions in Nerium oleander (Rosebay) as Affected by Different Nitrogen Sources and Salinity. Ann. Bot. 2008, 102, 735–746. [Google Scholar]
  56. Ottow, E.A.; Brinker, M.; Teichmann, T.; Fritz, E.; Kaiser, W.; Brosché, M.; Kangasjarvi, J.; Jiang, X.; Polle, A. Populus euphratica displays apoplastic sodium accumulation, osmotic adjustment by decreases in calcium and soluble carbohydrates, and develops leaf succulence under salt stress. Plant Physiol. 2005, 139, 1762–1772. [Google Scholar] [CrossRef] [PubMed] [Green Version]
  57. Ruan, J.; Gerendás, J.; Härdter, R.; Sattelmacher, B. Effect of nitrogen form and root-zone pH on growth and nitrogen uptake of tea (Camellia sinensis) plants. Ann. Bot. 2007, 99, 301–310. [Google Scholar] [CrossRef] [PubMed] [Green Version]
  58. Sakakibara, H.; Takei, K.; Hirose, N. Interactions between nitrogen and cytokinin in the regulation of metabolism and development. Trends Plant Sci. 2006, 11, 440–448. [Google Scholar] [CrossRef]
  59. Kiba, T.; Kudo, T.; Kojima, M.; Sakakibara, H. Hormonal control of nitrogen acquisition: Roles of auxin, abscisic acid, and cytokinin. J. Exp. Bot. 2011, 62, 1399–1409. [Google Scholar] [CrossRef]
  60. Meier, M.; Liu, Y.; Lay-Pruitt, K.S.; Takahashi, H.; von Wirén, N. Auxin-mediated root branching is determined by the form of available nitrogen. Nat. Plants 2020, 6, 1136–1145. [Google Scholar] [CrossRef]
  61. Ashraf, M.; Shahzad, S.M.; Imtiaz, M.; Rizwan, M.S.; Arif, M.S.; Kausar, R. Nitrogen nutrition and adaptation of glycophytes to saline environment: A review. Arch. Agron. Soil Sci. 2018, 64, 1181–1206. [Google Scholar] [CrossRef]
  62. Deng, W.-W.; Wang, S.; Chen, Q.; Zhang, Z.-Z.; Hu, X.-Y. Effect of salt treatment on theanine biosynthesis in Camellia sinensis seedlings. Plant Physiol. Biochem. 2012, 56, 35–40. [Google Scholar] [CrossRef] [PubMed]
  63. Zhong, C.; Cao, X.; Bai, Z.; Zhang, J.; Zhu, L.; Huang, J.; Jin, Q. Nitrogen metabolism correlates with the acclimation of photosynthesis to short-term water stress in rice (Oryza sativa L.). Plant Physiol. Biochem. 2018, 125, 52–62. [Google Scholar] [CrossRef] [PubMed]
  64. Caspersen, S.; Svensson, B.; Hkansson, T.; Winter, C.; Asp, H. Blueberry—Soil interactions from an organic perspective. Sci. Hortic. 2016, 208, 78–91. [Google Scholar] [CrossRef]
  65. Nemie-Feyissa, D.; Olafsdottir, S.M.; Heidari, B.; Lillo, C. Nitrogen depletion and small R3-MYB transcription factors affecting anthocyanin accumulation in Arabidopsis leaves. Phytochemistry 2014, 98, 34–40. [Google Scholar] [CrossRef]
  66. Alcântara, B.K.; Rizzi, V.; Gaziola, S.A.; Azevedo, R.A. Soluble amino acid profile, mineral nutrient and carbohydrate content of maize kernels harvested from plants submitted to ascorbic acid seed priming. An. Acad. Bras. Cienc. 2017, 89, 695–704. [Google Scholar] [CrossRef] [PubMed] [Green Version]
  67. Zeng, P.; Huang, F.L.; Guo, Z.H.; Xiao, X.Y.; Peng, C. Physiological responses of Morus alba L. in heavy metal(loid)-contaminated soil and its associated improvement of the microbial diversity. Environ. Sci. Pollut. Res. 2020, 27, 4294–4308. [Google Scholar] [CrossRef]
  68. Wang, A.G.; Luo, G.H. Quantitative Relation between the Reaction of Hydroxylamine and Superoxide Anion Radicals in Plants. Plant Physiol. Commun. 1990, 84, 2895–2898. [Google Scholar]
  69. Dhindsa, R.S.; Pamela, P.D.; Thorpe, T.A. Leaf senescence: Correlated with increased levels of membrane permeability and lipid peroxidation, and decreased levels of superoxide dismutase and catalase. J. Exp. Bot. 1981, 32, 93–101. [Google Scholar] [CrossRef]
  70. Li, H.-X.; Xiao, Y.; Cao, L.-L.; Yan, X.; Li, C.; Shi, H.-Y.; Wang, J.-W.; Ye, Y.-H. Cerebroside C increases tolerance to chilling injury and alters lipid composition in wheat roots. PLoS ONE 2013, 8, e73380. [Google Scholar] [CrossRef] [Green Version]
  71. Asami, D.K.; Hong, Y.J.; Barrett, D.M.; Mitchell, A.E. Comparison of the total phenolic and ascorbic acid content of freeze-dried and air-dried marionberry, strawberry, and corn grown using conventional, organic, and sustainable agricultural practices. J. Agric. Food Chem. 2003, 51, 1237–1241. [Google Scholar] [CrossRef] [PubMed]
  72. Anderson, M.E. Determination of glutathione and glutathione disulfide in biological samples. Methods Enzymol. 1985, 113, 548–555. [Google Scholar] [PubMed]
  73. Bradford, M. A Rapid and Sensitive Method for the Quantitation of Microgram Quantities of Protein Utilizing the Principle of Potein-Dye Binding. Anal. Biochem. 1976, 72, 248–254. [Google Scholar] [CrossRef] [PubMed]
  74. Shah, K.; Maghsoudlou, P. Enzyme-linked immunosorbent assay (ELISA): The basics. Br. J. Hosp. Med. 2016, 77, C98–C101. [Google Scholar] [CrossRef]
  75. Zhou, M.; Hua, T.; Ma, X.; Sun, H.; Xu, L. Protein content and amino acids profile in 10 cultivars of ginkgo (Ginkgo biloba L.) nut from China. R. Soc. Open Sci. 2019, 6, 181571. [Google Scholar] [CrossRef] [Green Version]
Figure 1. (A) Plant height and main stem diameter in response to different N forms. (B) The dry weights of the roots, shoots and whole plants in response to different N forms. (C) Phenotypes of the above- and below-ground parts of blackberry after 60 days of treatment with different N forms. Different letters show significant differences between treatments (uppercase letters indicate p < 0.01, lowercase letters indicate p < 0.05).
Plants 12 01480 g001
Figure 2. Scanning electron micrographs showing the leaf cross-sections ((AD); scale bar is 200 μm), leaf upper surface ((EH); scale bar is 50 μm), leaf lower surface ((IL); scale bar is 50 μm) and root surface ((MP); scale bar is 200 μm) after 60 days of treatment with different N forms. The counts of UEC (Q), GH (R), stomata (S) and OS (T) with different N forms. X-ray energy spectrogram of leaf cross-sections with different N treatments (panels (UX) represent the CK, NH4+–N, NO3–N and urea treatments, respectively). PTC, palisade tissue cell; STC, spongy tissue cell; UEC, upper epidermal cell; GH, glandular hairs; OS, open stomata.
Plants 12 01480 g002
Figure 3. Changes in root physiology and antioxidant indicators with different N forms. The MDA (A), H2O2 (C), AsA (G), GSH (H) and SP (I) levels. O2·− generation rate of (B). Activities of SOD (D), POD (E) and CAT (F). MDA, malondialdehyde; O2·−, superoxide anion radical; H2O2, hydrogen peroxide; SOD, superoxide dismutase; POD, peroxidase; CAT, catalase; AsA, ascorbic acid; GSH, reduced glutathione; SP, soluble protein. The data indicated are the means ± SDs (n = 3). Different letters show significant differences between treatments (** p < 0.01, * p < 0.05).
Plants 12 01480 g003
Figure 4. Effects of different N forms on the leaf photosynthetic parameters of blackberry. Changes in the relative chlorophyll content (SPAD value) and N content with time (A). Changes in air temperature (AT) and atmospheric CO2 concentration (Ca) during the day (B). Effects of different N forms on the net photosynthetic rate (Pn) and transpiration rate (Tr) (C), intercellular CO2 concentration (Ci) and stomatal conductance (Gs) (D), leaf water use efficiency (LWUE) and light use efficiency (LUE) (E) and stomatal limitation (Ls) (F). The data indicated are the means ± SDs (n = 20). Different letters show significant differences between treatments (uppercase letters indicate p < 0.01, lowercase letters indicate p < 0.05).
Plants 12 01480 g004
Figure 5. Effects of different N forms on sugar (AD) and endogenous hormone contents (E,F) in roots and leaves. The data presented are the means ± SDs (n = 3). Different letters show significant differences between treatments (uppercase letters indicate p < 0.01, lowercase letters indicate p < 0.05).
Plants 12 01480 g005
Figure 6. (A) Correlation matrix of the physiological indicators. The results were derived from the Pearson correlation analysis. NC, nitrogen content; RSS, soluble sugar in roots; LSS, soluble sugar in leaves; RCTK, cytokinin in roots; LCTK, cytokinin in leaves; RIAA, auxin in roots; LIAA, auxin in leaves; RTAA, total amino acid in roots; LTAA, total amino acid in leaves. * represents a significant correlation at the 0.05 level and ** represents a significant correlation at the 0.01 level. (B) PCA score chart of the physicochemical properties of blackberry with different N forms.
Plants 12 01480 g006
Figure 7. Physiological characteristics of whole blackberry plants with different N forms affected blackberry growth and the associated correlations: a possible physiological regulatory mechanism. The red font indicates that an indicator has a significant positive correlation with blackberry growth and the green font indicates a negative correlation. The upward arrow indicates that the value of this indicator increases with the NH4+–N treatment relative to the NO3–N treatment, that is, NH4+/NO3 > 1; the downward arrow indicates the opposite. * represents p < 0.05, and ** represents p < 0.01.
Plants 12 01480 g007
Table 1. Quantitative analysis results obtained by EDS with different N treatments.
CKNH4+–NNO3–NUrea
ElementWeight%Atomic%Weight%Atomic%Weight%Atomic%Weight%Atomic%
C37.2145.9235.2644.643949.5738.9850.21
O51.3347.5551.1748.6445.7243.6343.7642.31
Na8.355.385.823.856.824.536.284.22
Mg0.650.41.270.790.530.34
K0.590.23
Ca0.980.363.451.310.890.341.740.67
Mn0.90.241.320.37----
Fe0.440.122.650.731.630.45
Cu0.140.031.570.414.050.99
Zn1.710.42.10.52.440.58
Mo1.250.29
Total100100100100100100100100
Processing option: All elements analyzed (normalized). Number of iterations = 3. The symbol “−” indicates that the instrument did not detect the element.
Table 2. Physical and chemical properties of the cultivation substrate with different N forms.
TreatmentpHEC (mS/cm)SOM (%)SOC (%)AHN (mg/kg)
CK5.37 ± 0.01 b0.96 ± 0.01 c74.02 ± 0.70 b42.93 ± 0.41 b402.27 ± 14.09 d
NH₄+–N4.45 ± 0.01 d1.83 ± 0.02 a72.26 ± 1.39 b41.91 ± 0.80 b571.20 ± 12.83 a
NO₃–N6.25 ± 0.01 a0.97 ± 0.017 c72.02 ± 1.20 b41.78 ± 0.69 b481.60 ± 2.80 c
Urea5.00 ± 0.02 c1.25 ± 0.07 b80.72 ± 0.68 a46.82 ± 0.39 a522.67 ± 9.00 b
EC, electrical conductivity; SOM, substrate organic matter; SOC, organic carbon; AHN, alkali-hydrolysable nitrogen. The data indicated are the means ± SDs (n = 3). Different values in the same column indicate significant differences between different treatments (p < 0.05).
Table 3. Concentrations of free amino acids in blackberry roots and leaves with different N treatments.
Root/mg·(100 g)−1 DW Leaf/mg·(100 g)−1 DW
Amino AcidCKNH₄+–NNO₃–NUreaCKNH₄+–NNO₃–NUrea
Asp1.30 ± 0.11 c1.82 ± 0.02 b2.33 ± 0.04 a1.40 ± 0.09 c1.22 ± 0.18 d6.81 ± 0.55 a4.53 ± 0.40 b3.86 ± 0.17 c
Thr0.91 ± 0.08 c1.23 ± 0.05 b1.52 ± 0.01 a0.84 ± 0.11 c1.00 ± 0.15 c3.24 ± 0.38 a2.39 ± 0.32 b3.36 ± 0.12 a
Ser5.08 ± 0.45 c11.46 ± 0.65 a11.28 ± 0.10 a7.77 ± 0.78 b1.48 ± 0.15 d19.80 ± 1.99 a10.20 ± 0.97 c15.57 ± 0.39 b
Glu 1.56 ± 0.16 c1.92 ± 0.06 b3.60 ± 0.18 a1.82 ± 0.19 bc1.99 ± 0.08 b2.29 ± 0.25 ab2.75 ± 0.24 a2.31 ± 0.12 ab
Gly0.94 ± 0.18 a0.51 ± 0.06 b0.66 ± 0.13 b0.46 ± 0.08 b0.30 ± 0.06 c0.92 ± 0.05 a0.39 ± 0.03 c0.68 ± 0.03 b
Ala 2.32 ± 0.19 c2.93 ± 0.08 b3.47 ± 0.01 a2.10 ± 0.23 c4.04 ± 0.42 d16.30 ± 1.31 a10.78 ± 1.19 c13.63 ± 0.42 b
Cys 0.08 ± 0.01 b0.16 ± 0.01 a0.17 ± 0.01 a0.15 ± 0.02 a0.08 ± 0.01 c0.66 ± 0.03 a0.40 ± 0.03 b0.64 ± 0.04 a
Val 0.76 ± 0.07 d1.48 ± 0.08 b1.80 ± 0.02 a1.01 ± 0.08 c1.34 ± 0.18 c6.10 ± 0.77 a5.05 ± 0.26 b6.02 ± 0.18 a
Met 0.15 ± 0.03 c0.38 ± 0.01 a0.33 ± 0.02 b0.16 ± 0.01 c0.11 ± 0.01 c0.88 ± 0.12 a0.57 ± 0.06 b0.71 ± 0.01 b
Ile 0.45 ± 0.03 c0.93 ± 0.04 a1.05 ± 0.00 a0.57 ± 0.08 b1.11 ± 0.145.12 ± 0.463.7 ± 0.645.03 ± 0.13
Leu0.33 ± 0.04 c0.60 ± 0.05 b1.00 ± 0.05 a0.48 ± 0.11 bc1.24 ± 0.16 c5.40 ± 0.50 a4.34 ± 0.33 b5.59 ± 1.18 a
Tyr0.74 ± 0.09 a0.60 ± 0.05 b0.78 ± 0.02 a0.50 ± 0.03 b1.39 ± 0.05 c4.96 ± 0.32 a4.09 ± 0.44 b3.97 ± 0.09 b
Phe 1.77 ± 0.01 b1.28 ± 0.18 d2.09 ± 0.01 a1.53 ± 0.11 c3.37 ± 0.18 c10.21 ± 0.82 b12.49 ± 1.06 a11.99 ± 0.35 ab
His 1.72 ± 0.02 c3.59 ± 0.08 a2.36 ± 0.06 b1.73 ± 0.13 c1.45 ± 0.15 c5.89 ± 0.42 a4.34 ± 0.47 b4.44 ± 0.36 b
Lys 0.38 ± 0.01 d0.88 ± 0.02 a0.73 ± 0.02 b0.51 ± 0.05 c0.66 ± 0.13 c2.63 ± 0.27 ab2.53 ± 0.20 b3.07 ± 0.10 a
Arg3.61 ± 0.02 d34.61 ± 1.26 a8.1 ± 0.35 c11.08 ± 1.34 b0.39 ± 0.04 d3.39 ± 0.37 a1.74 ± 0.19 c2.64 ± 0.12 b
Pro1.08 ± 0.13 c1.64 ± 0.10 b2.2 ± 0.15 a1.02 ± 0.15 c1.31 ± 0.17 d13.82 ± 0.59 a6.28 ± 0.50 c8.50 ± 0.23 b
∑EAA6.47 ± 0.28 b10.37 ± 0.16 a10.86 ± 0.12 a6.84 ± 0.46 b10.27 ± 1.02 c39.26 ± 2.21 a35.41 ± 2.65 b40.21 ± 1.23 a
∑NEAA16.71 ± 1.14 d55.84 ± 0.74 a32.58 ± 0.67 b26.29 ± 2.78 c12.20 ± 1.12 d68.94 ± 4.79 a41.15 ± 3.74 c51.78 ± 1.26 b
∑TAA23.17 ± 1.47 d66.01 ± 0.78 a43.45 ± 0.59 b33.13 ± 3.08 c22.46 ± 1.97 d108.20 ± 7.02 a76.56 ± 4.09 c91.99 ± 2.27 b
The data indicated are the means ± SDs (n = 3). All data are expressed as mg/100 g DW. Different letters in the same row indicate significant differences between treatments (p < 0.05). Asp, aspartic acid; Thr, threonine; Ser, serine; Glu, glutamic acid; Gly, glycine; Ala, alanine; Cys, cysteine; Val, valine; Met, methionine; Ile, isoleucine; Leu, leucine; Tyr, tyrosine; Phe, phenylalanine; His, histidine; Lys, lysine; Arg, arginine; Pro, proline. Essential amino acids (∑EAA): Thr + Val + Met + Ile + Leu + Phe + His + Lys; nonessential amino acids (∑NEAA): Asp + Ser + Glu + Pro + Gly + Ala + Cys + Tyr + Arg. Total amino acids (∑TAA): ∑EAA + ∑NEAA.
Table 4. Eigenvalues of each principal component.
TraitComponent
12
MDA−0.88 **−0.05
O2·−−0.77 **−0.14
H2O2−0.74 **0.60
SOD0.89 **−0.42
POD0.90 **0.18
CAT0.95 **−0.23
AsA−0.430.64 **
GSH−0.63 **0.11
SP−0.94 **−0.06
SPAD0.91 **0.39
NC0.95 **0.31
Pn0.98 **−0.01
Tr0.95 **−0.22
RSS−0.48−0.87 **
LSS−0.69−0.72 **
RCTK−0.400.66 **
LCTK0.73 **0.19
RIAA−0.88 **0.30
LIAA0.88 **−0.15
RTAA0.81 **−0.04
LTAA0.96 **0.25
Total14.013.28
% of variance66.7215.64
Cumulative %66.7282.36
** represents eigenvalues that are significant, i.e., >0.60.
Table 5. Correlation coefficients between the principal components and growth indexes.
IndexPC1PC2Plant HeightMain Stem DiameterRoot Dry WeightShoot Dry WeightWhole Dry Weight
PC1100.888 **0.588 *0.556 *0.863 **0.837 **
PC2010.3530.0570.770 **0.4760.517
* represents p < 0.05 and ** represents p < 0.01.
Disclaimer/Publisher’s Note: The statements, opinions and data contained in all publications are solely those of the individual author(s) and contributor(s) and not of MDPI and/or the editor(s). MDPI and/or the editor(s) disclaim responsibility for any injury to people or property resulting from any ideas, methods, instructions or products referred to in the content.

