
Unraveling the Molecular Mechanisms of Tomatoes’ Defense against Botrytis cinerea: Insights from Transcriptome Analysis of Micro-Tom and Regular Tomato Varieties
 , and
, and 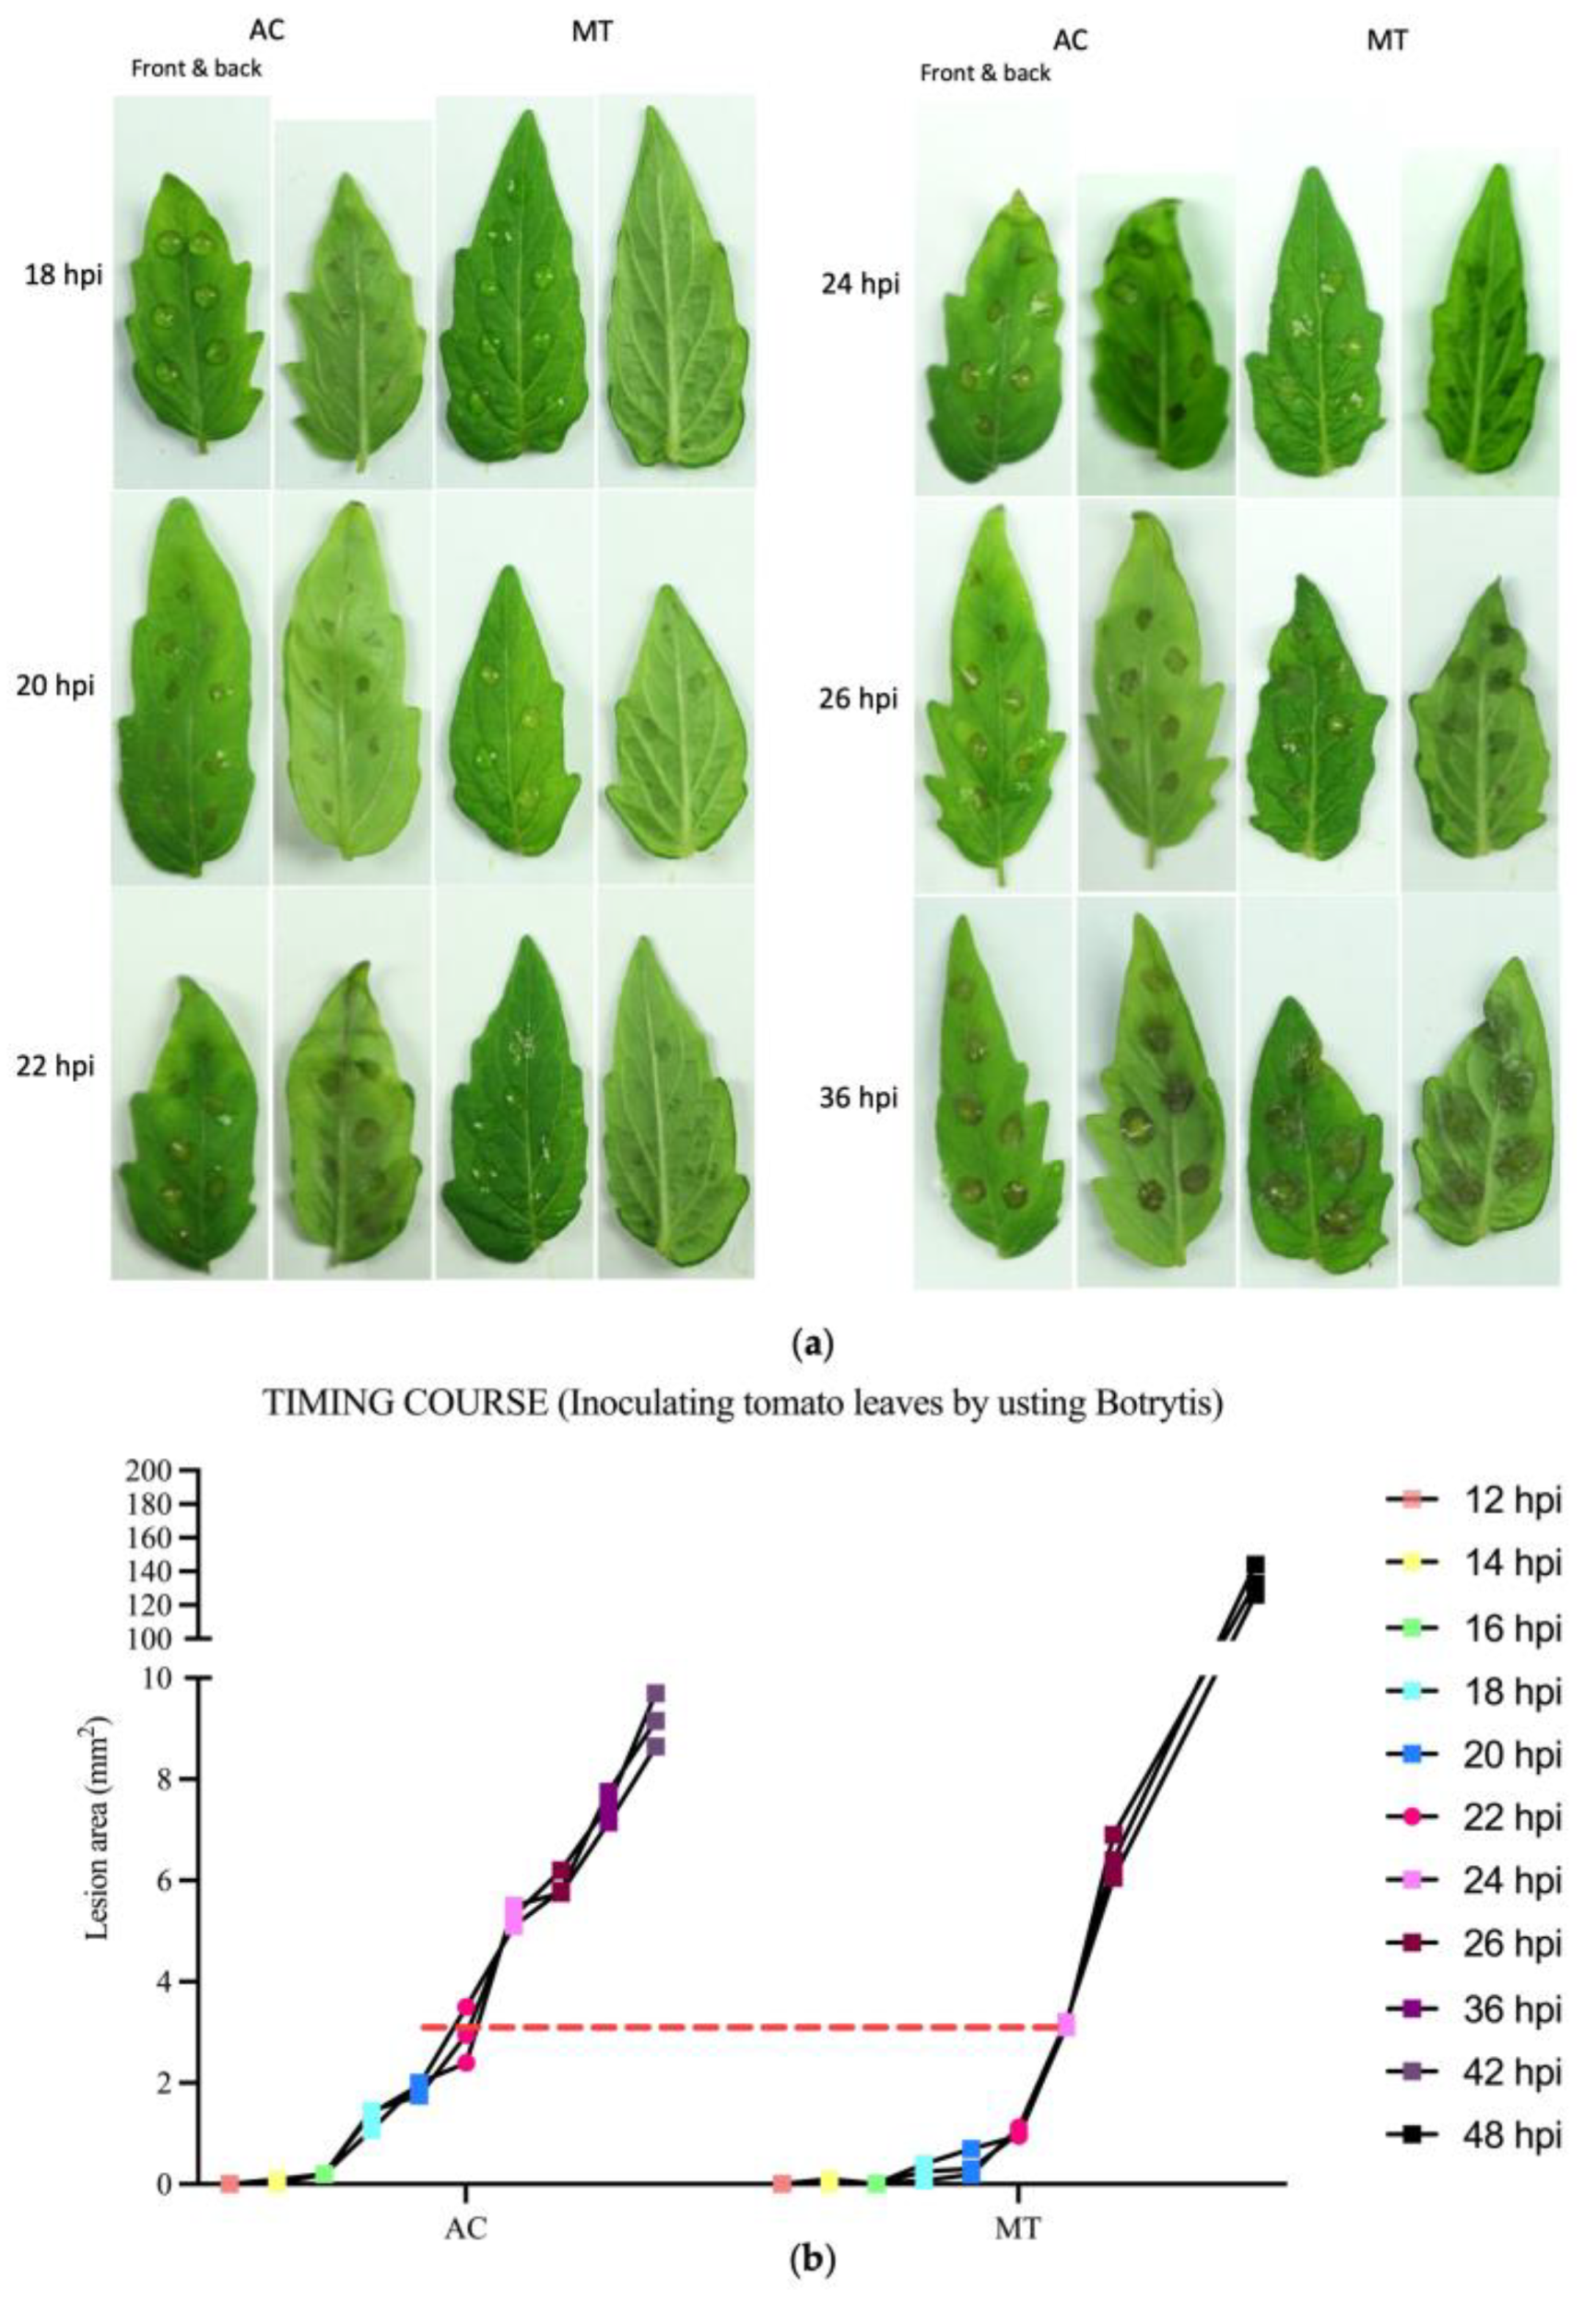
Abstract
:1. Introduction
2. Results
2.1. Different Tomato Varieties Exhibited a Pronounced Response to B. cinerea during the Early Stages of Infection
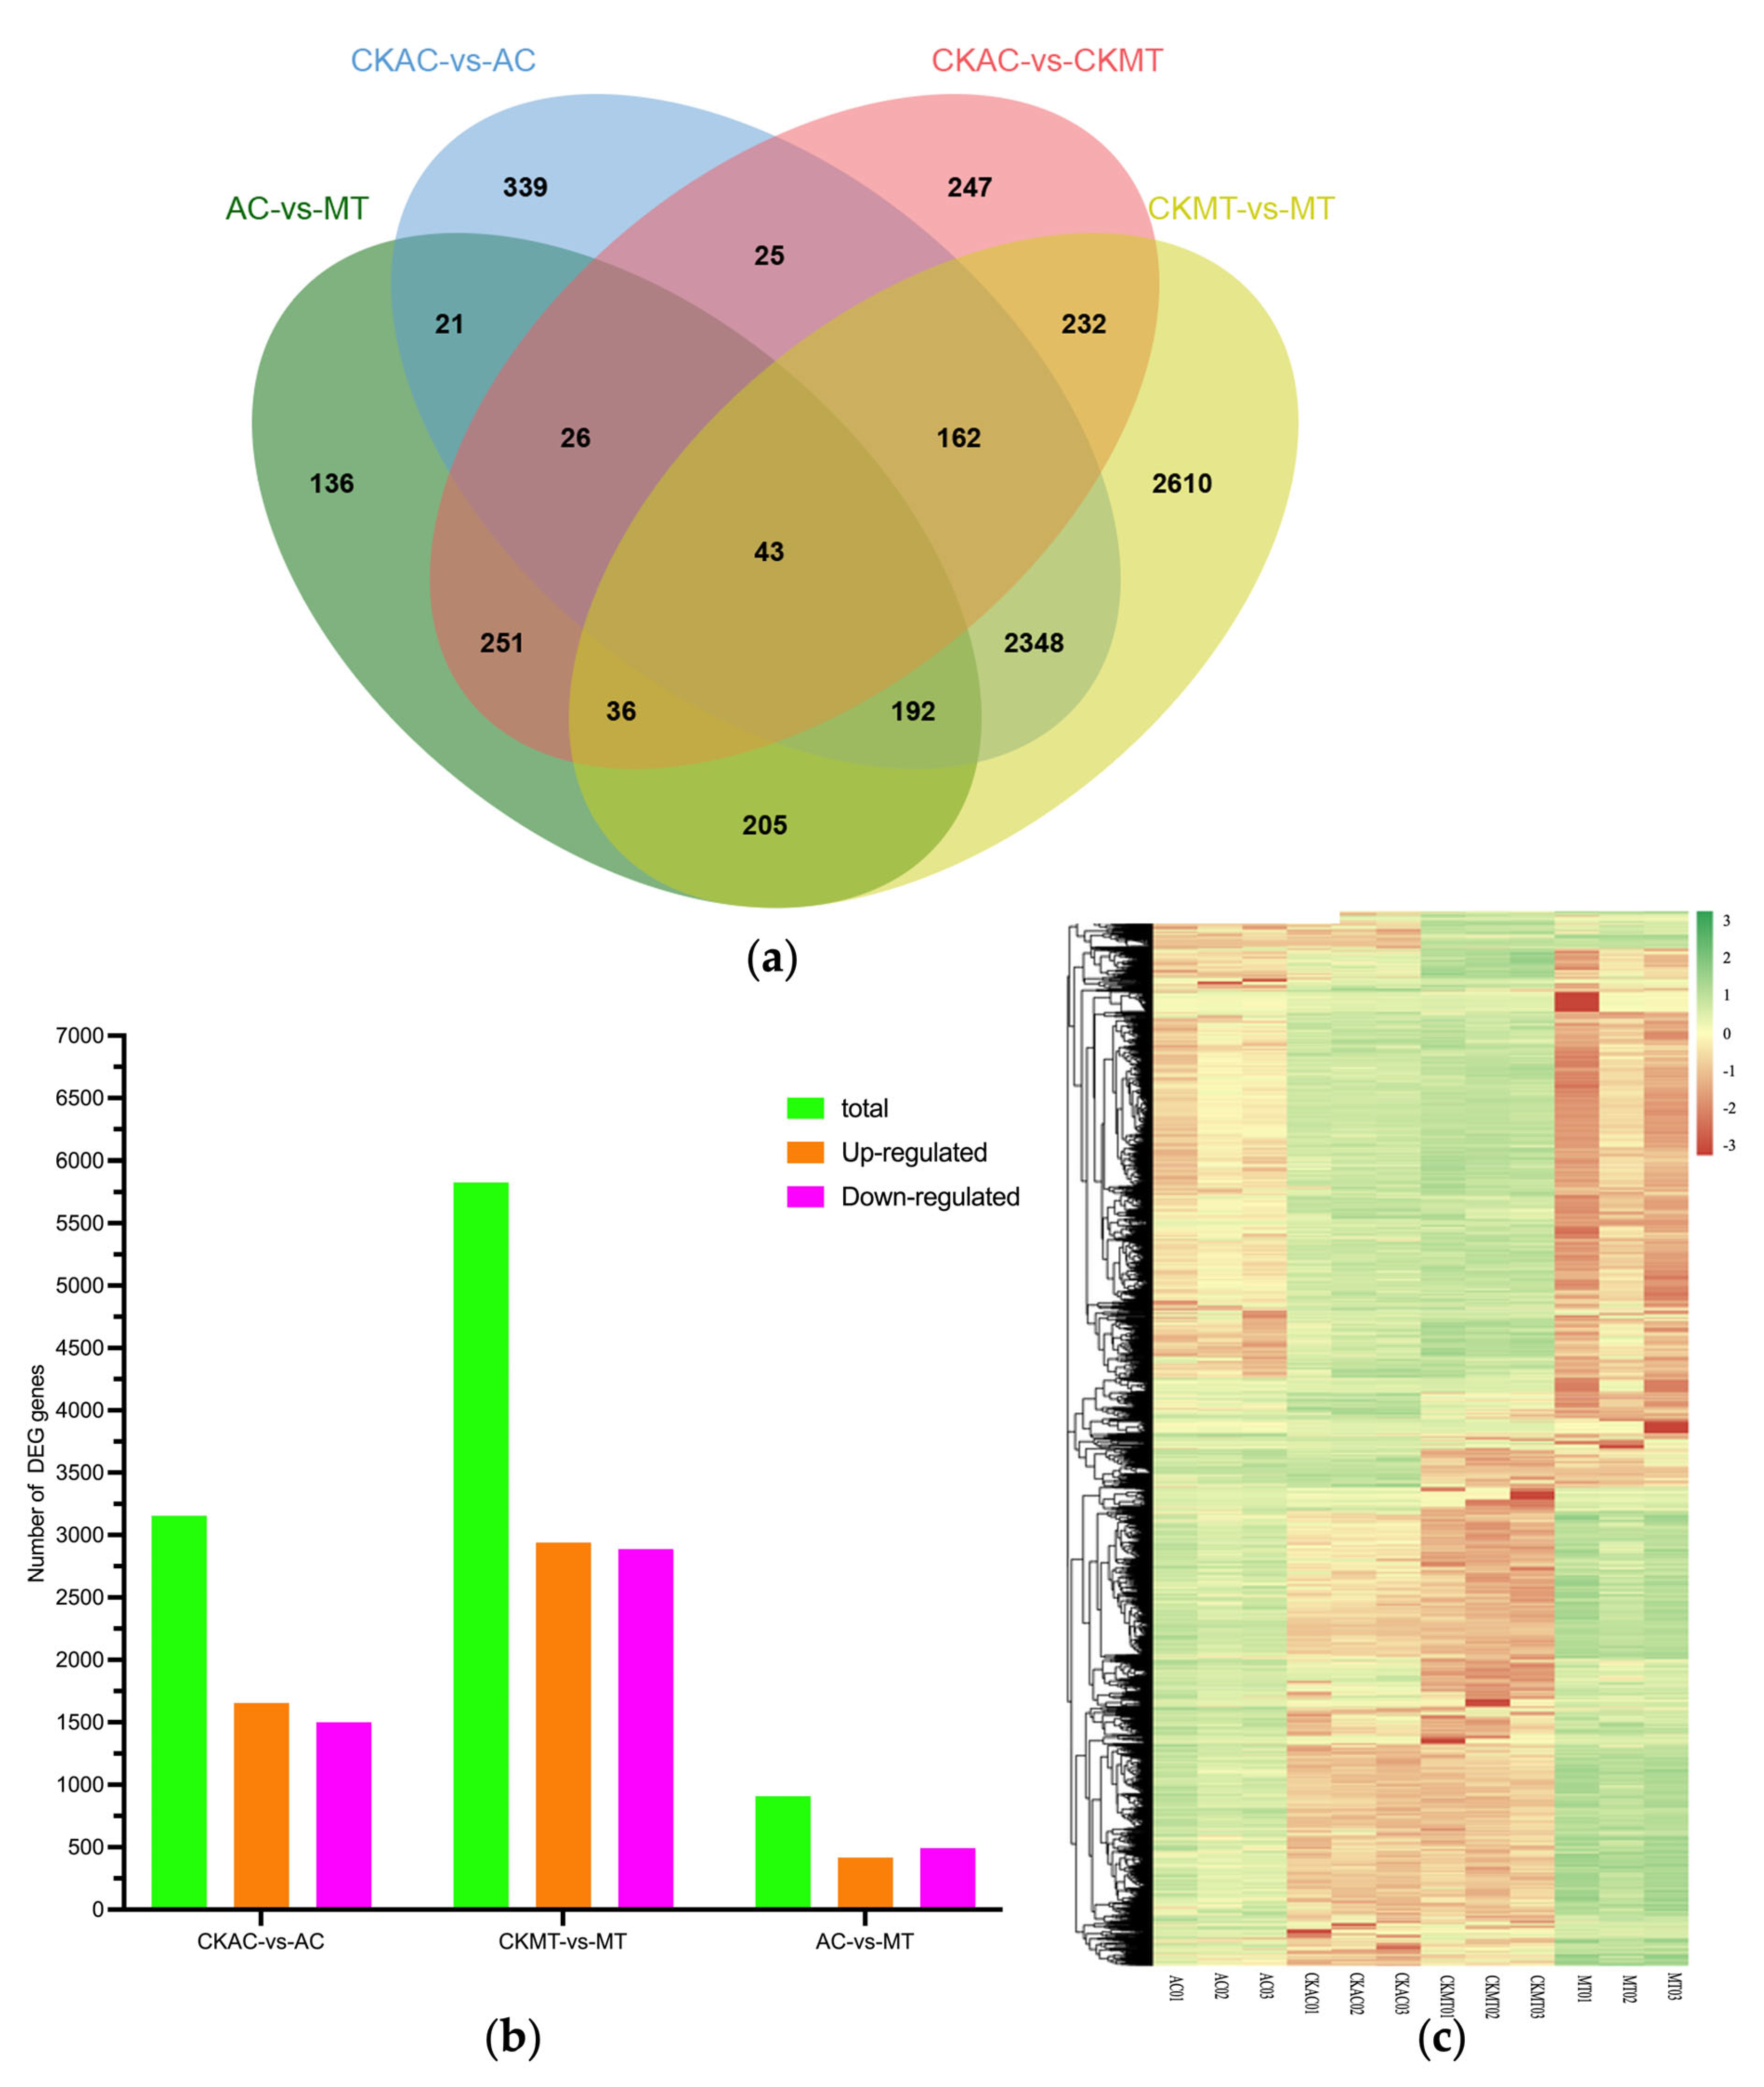
2.2. DEG Analysis of AC and MT Infected Leaves Using RNA-seq
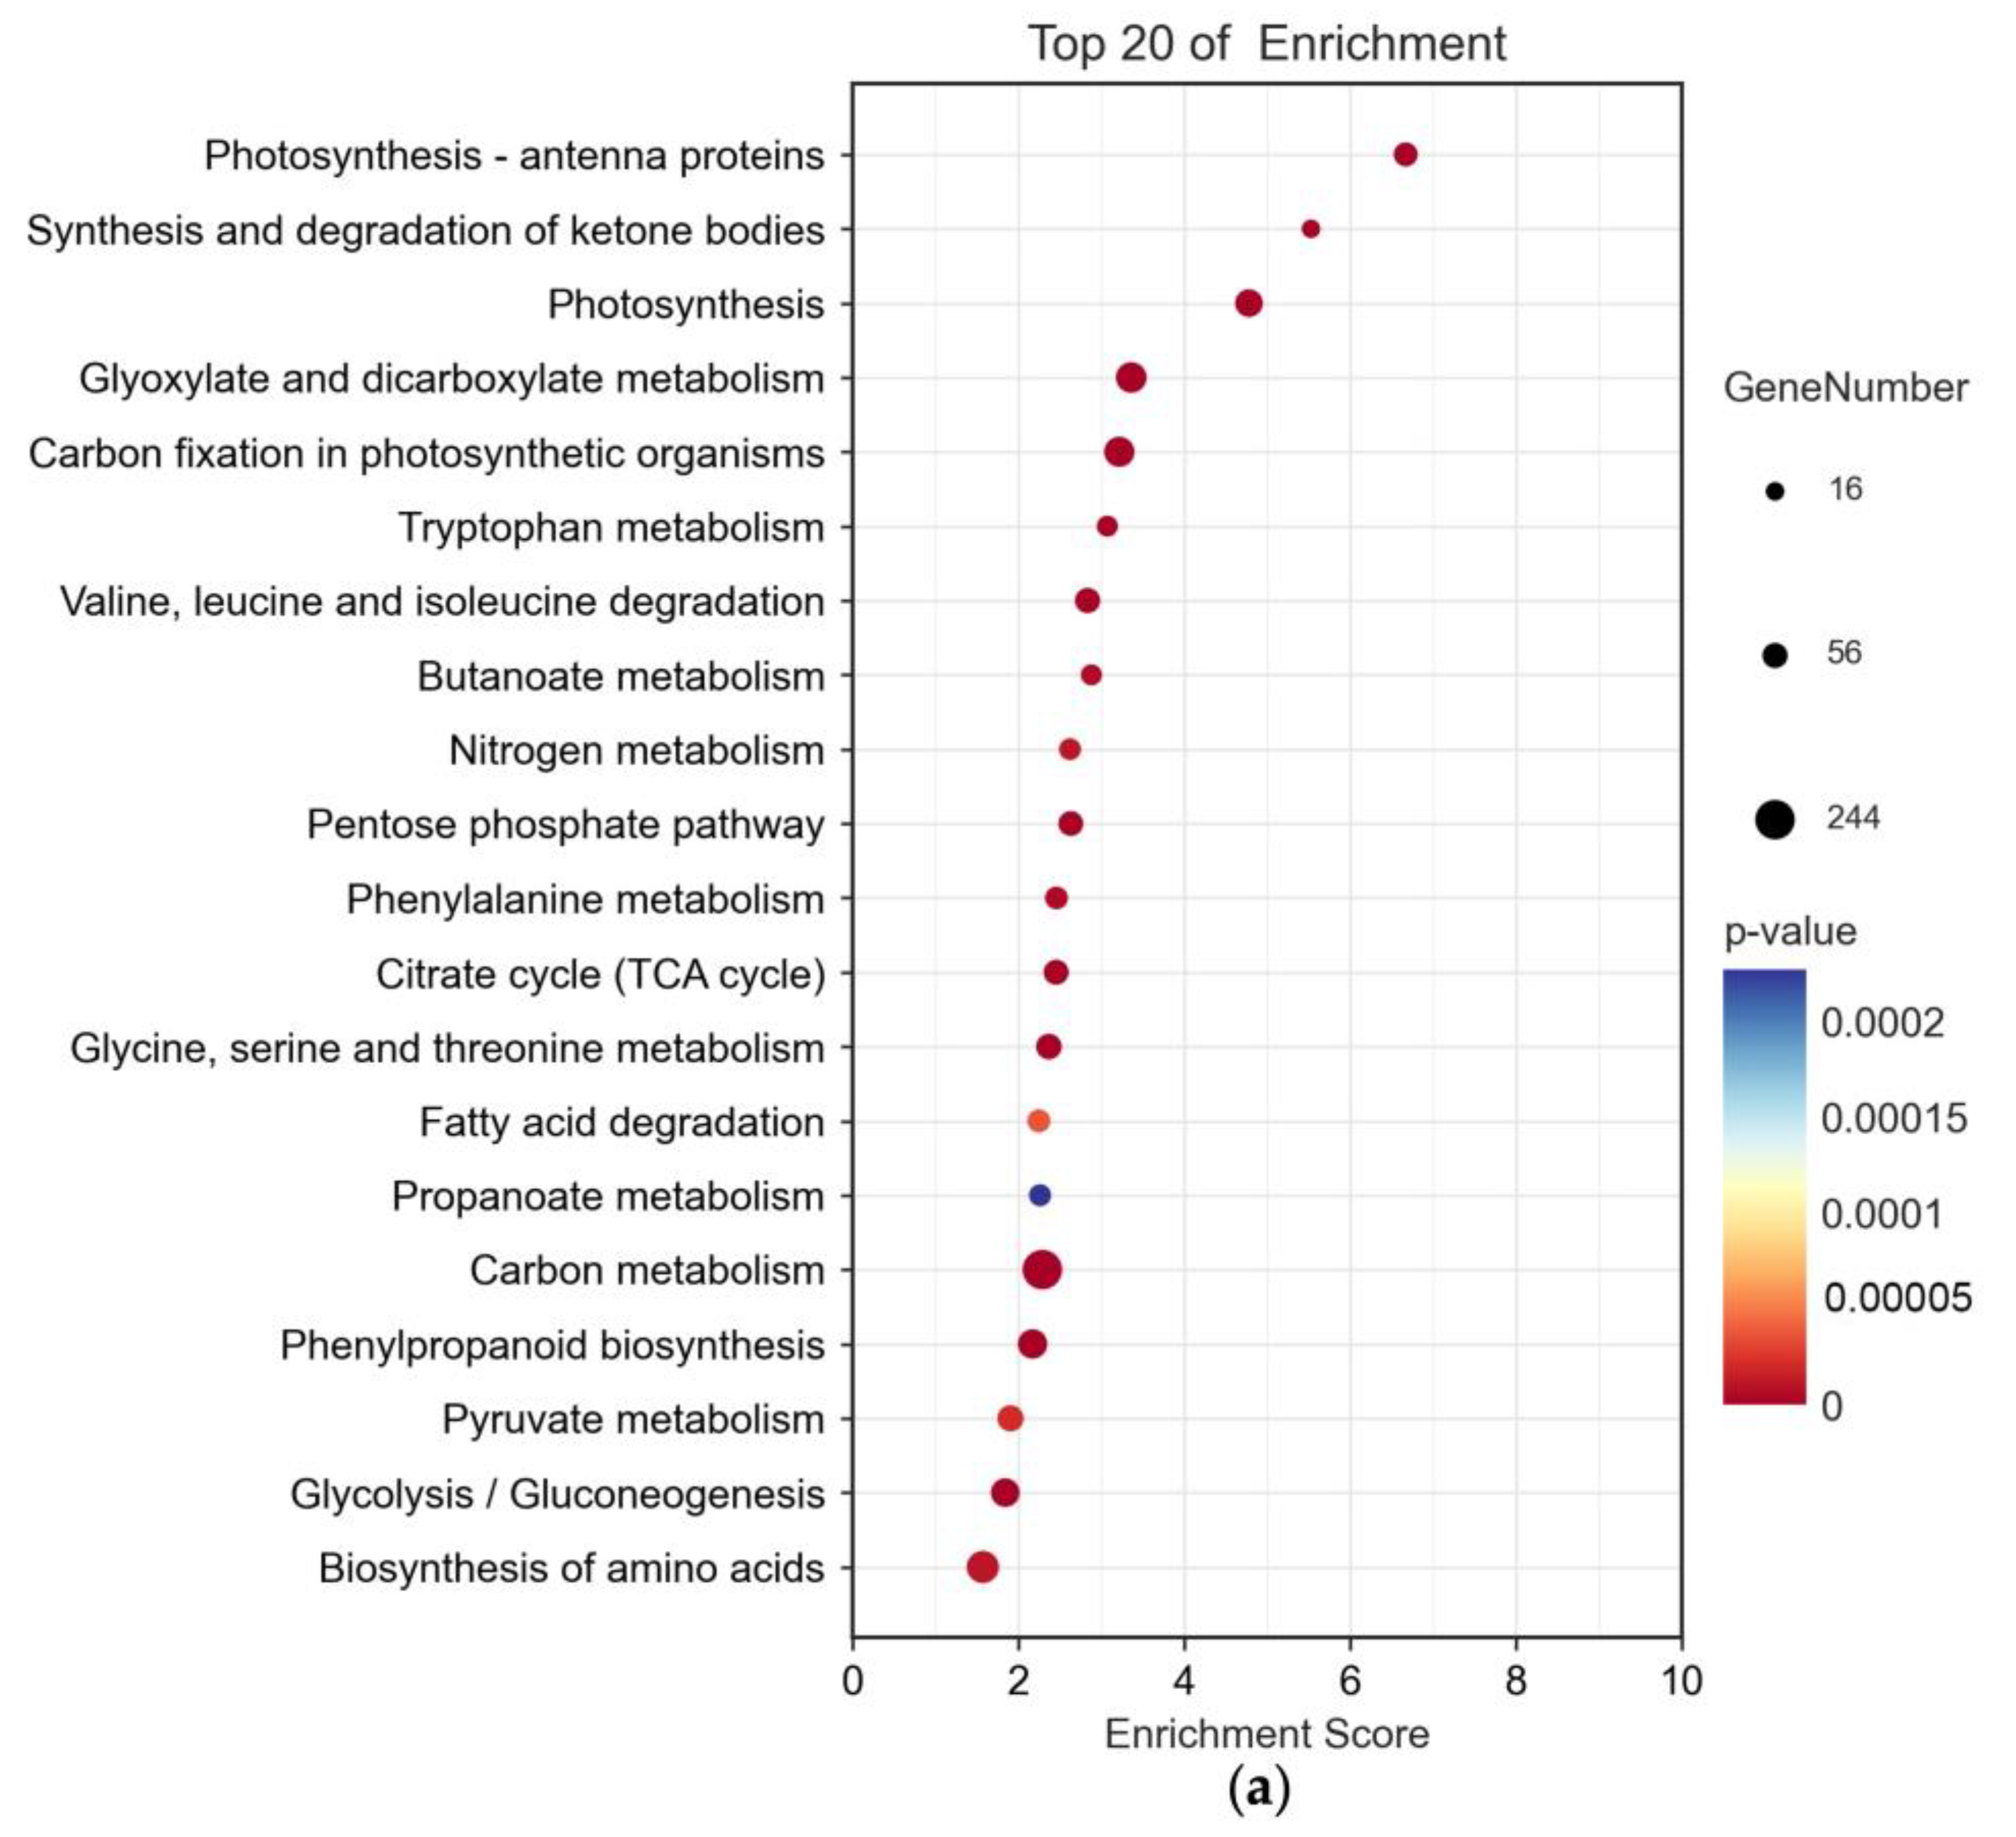
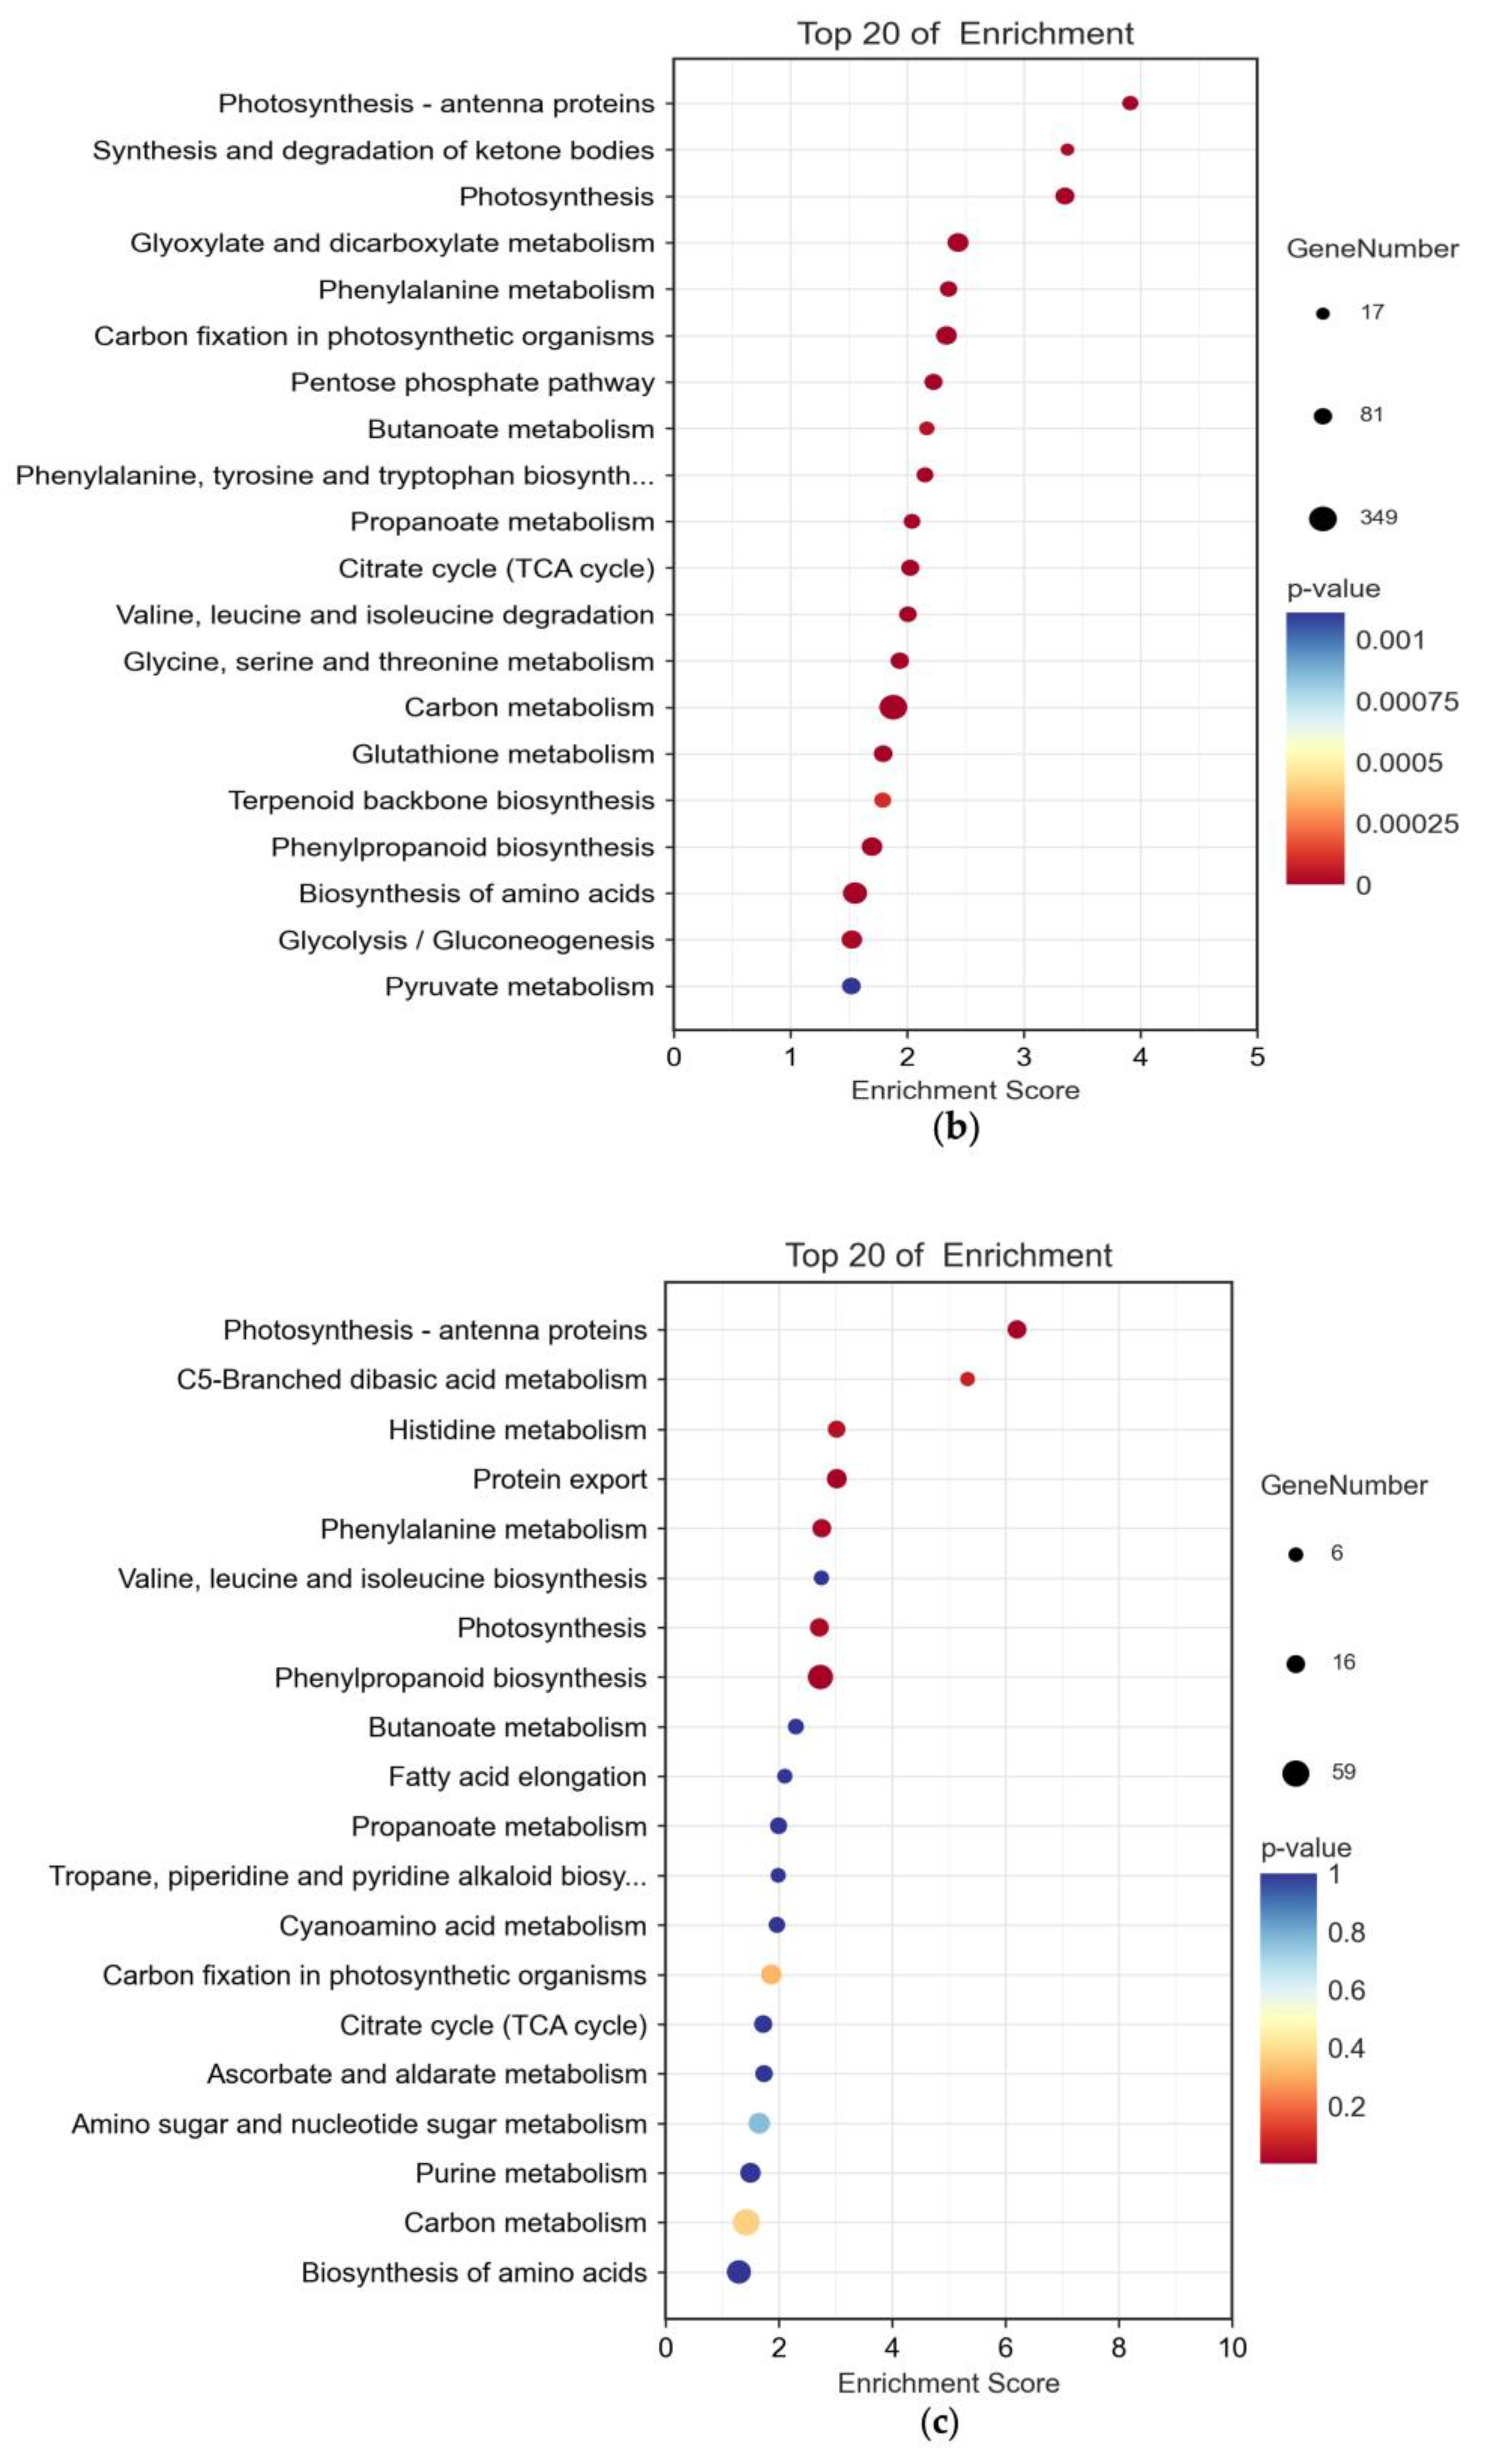
2.3. Significant Impact of B. cinerea Infection on Tomatoes’ Biological Pathways
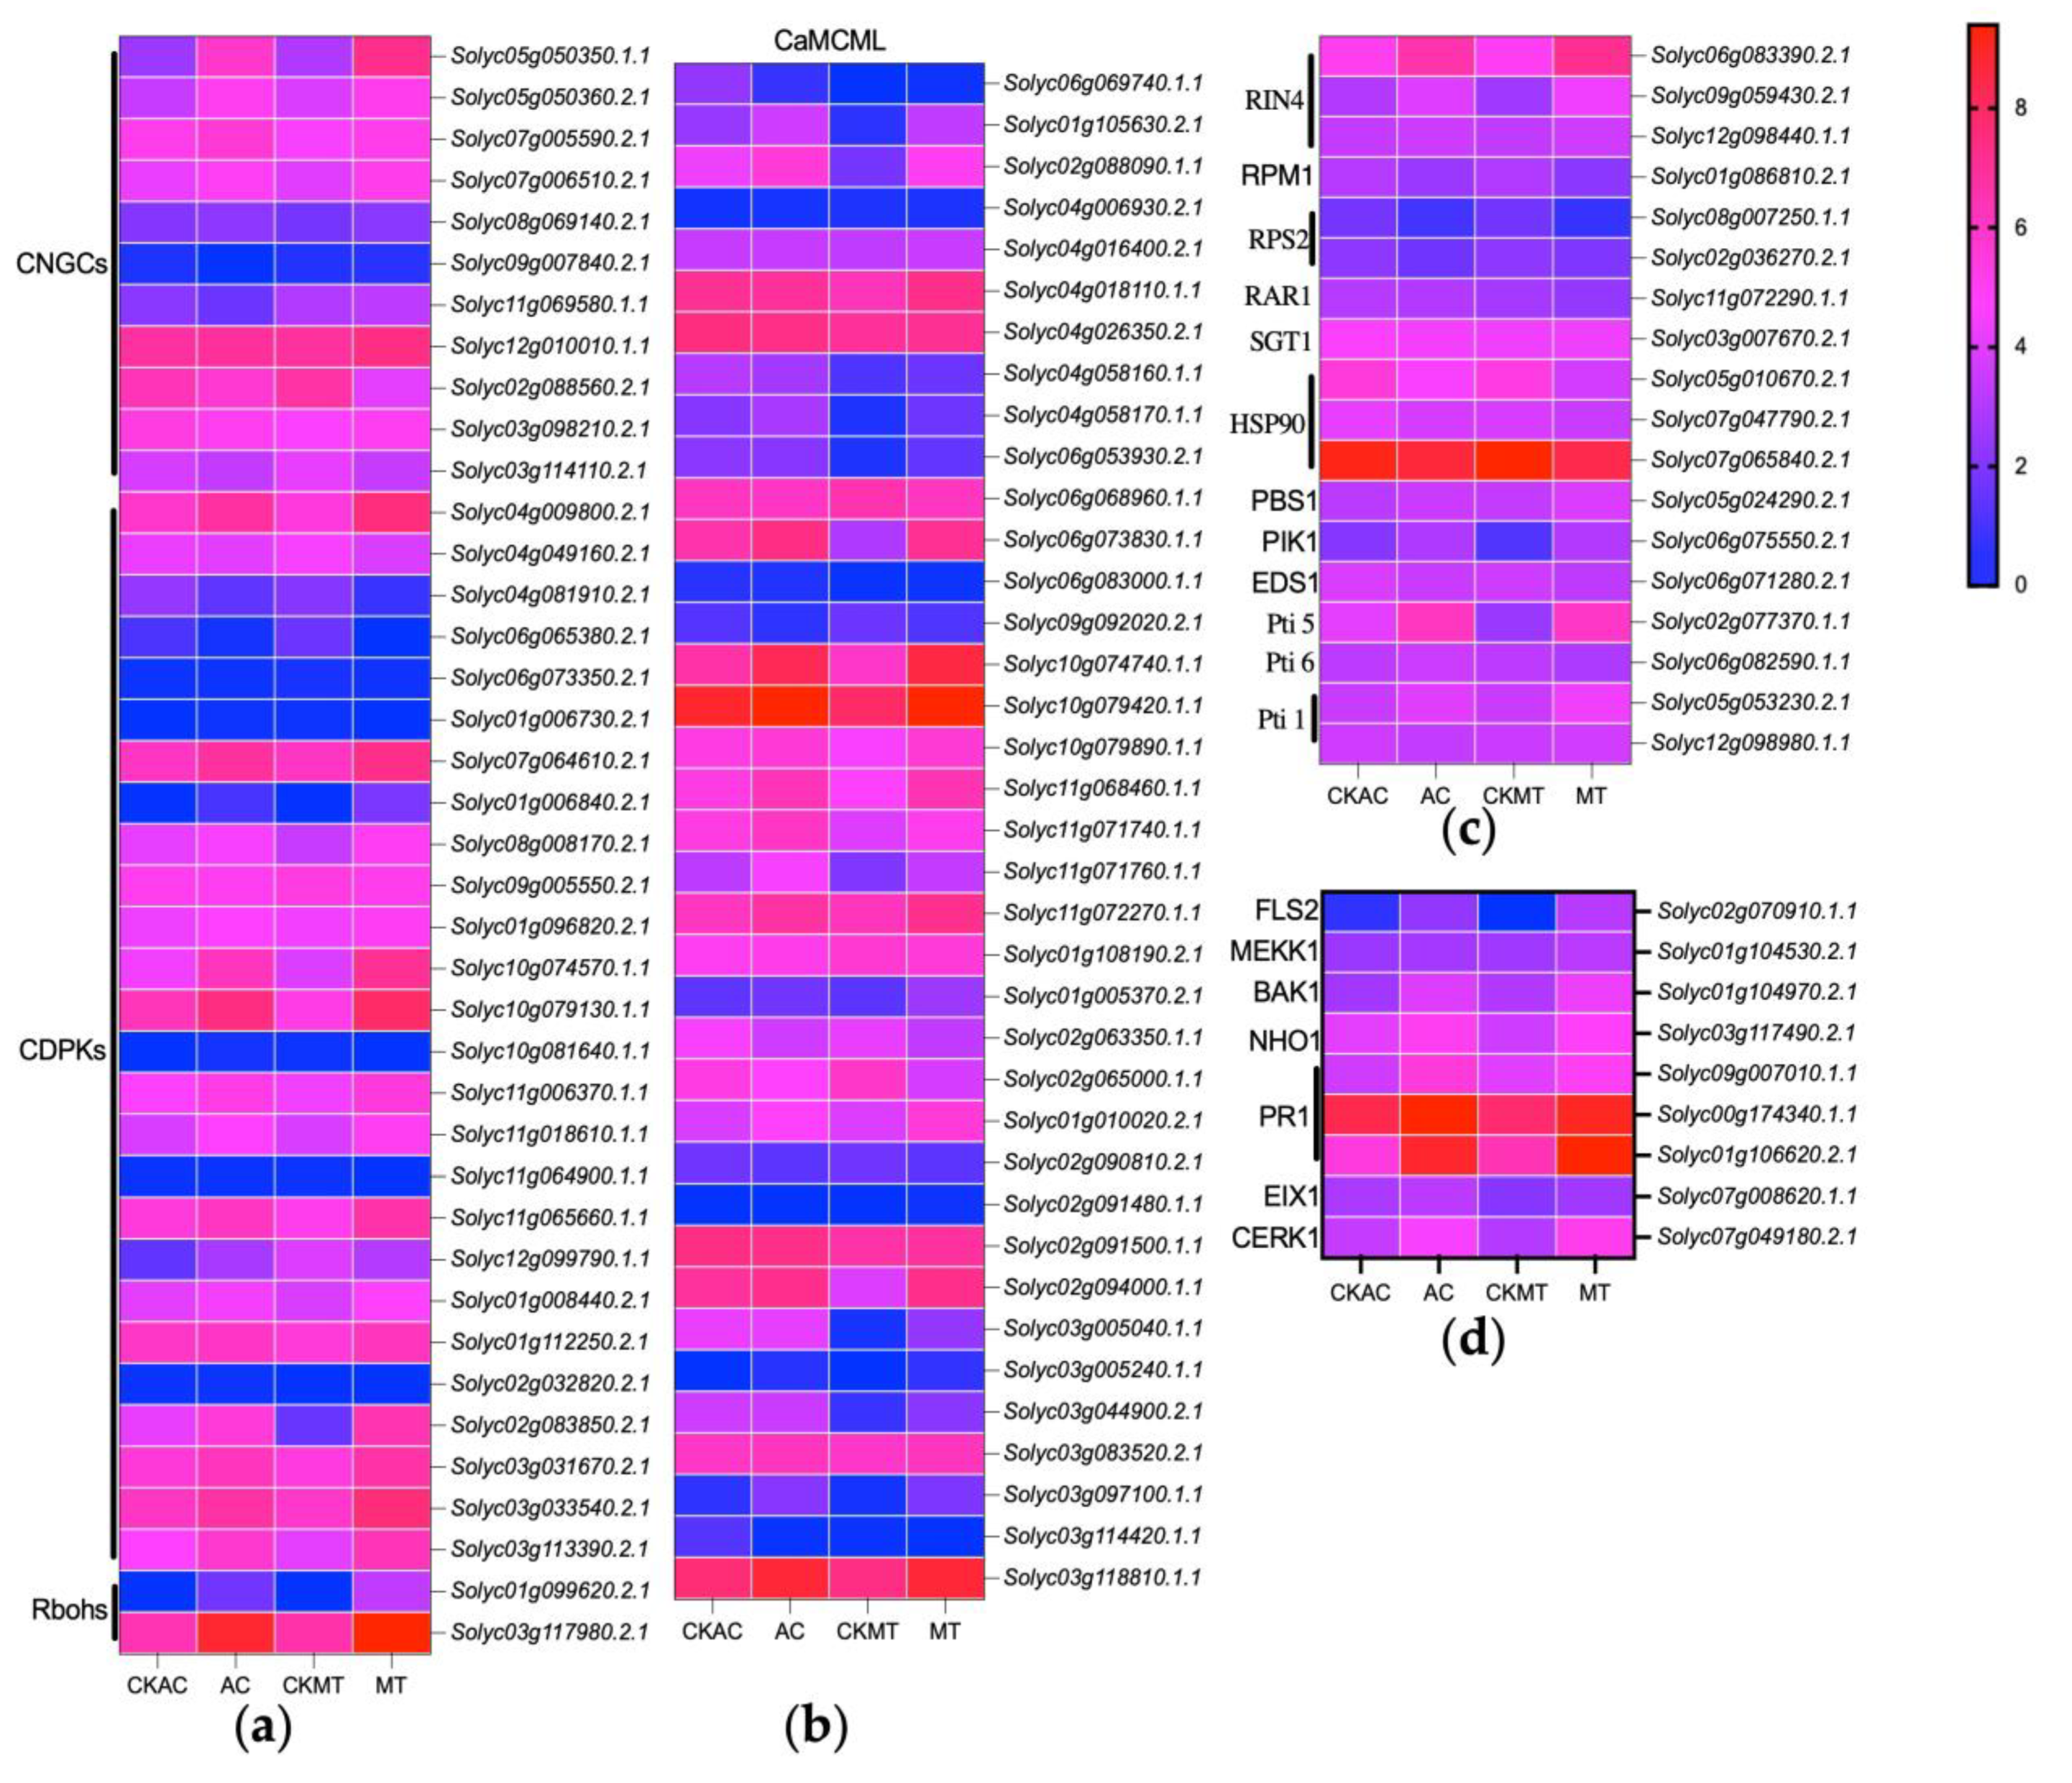
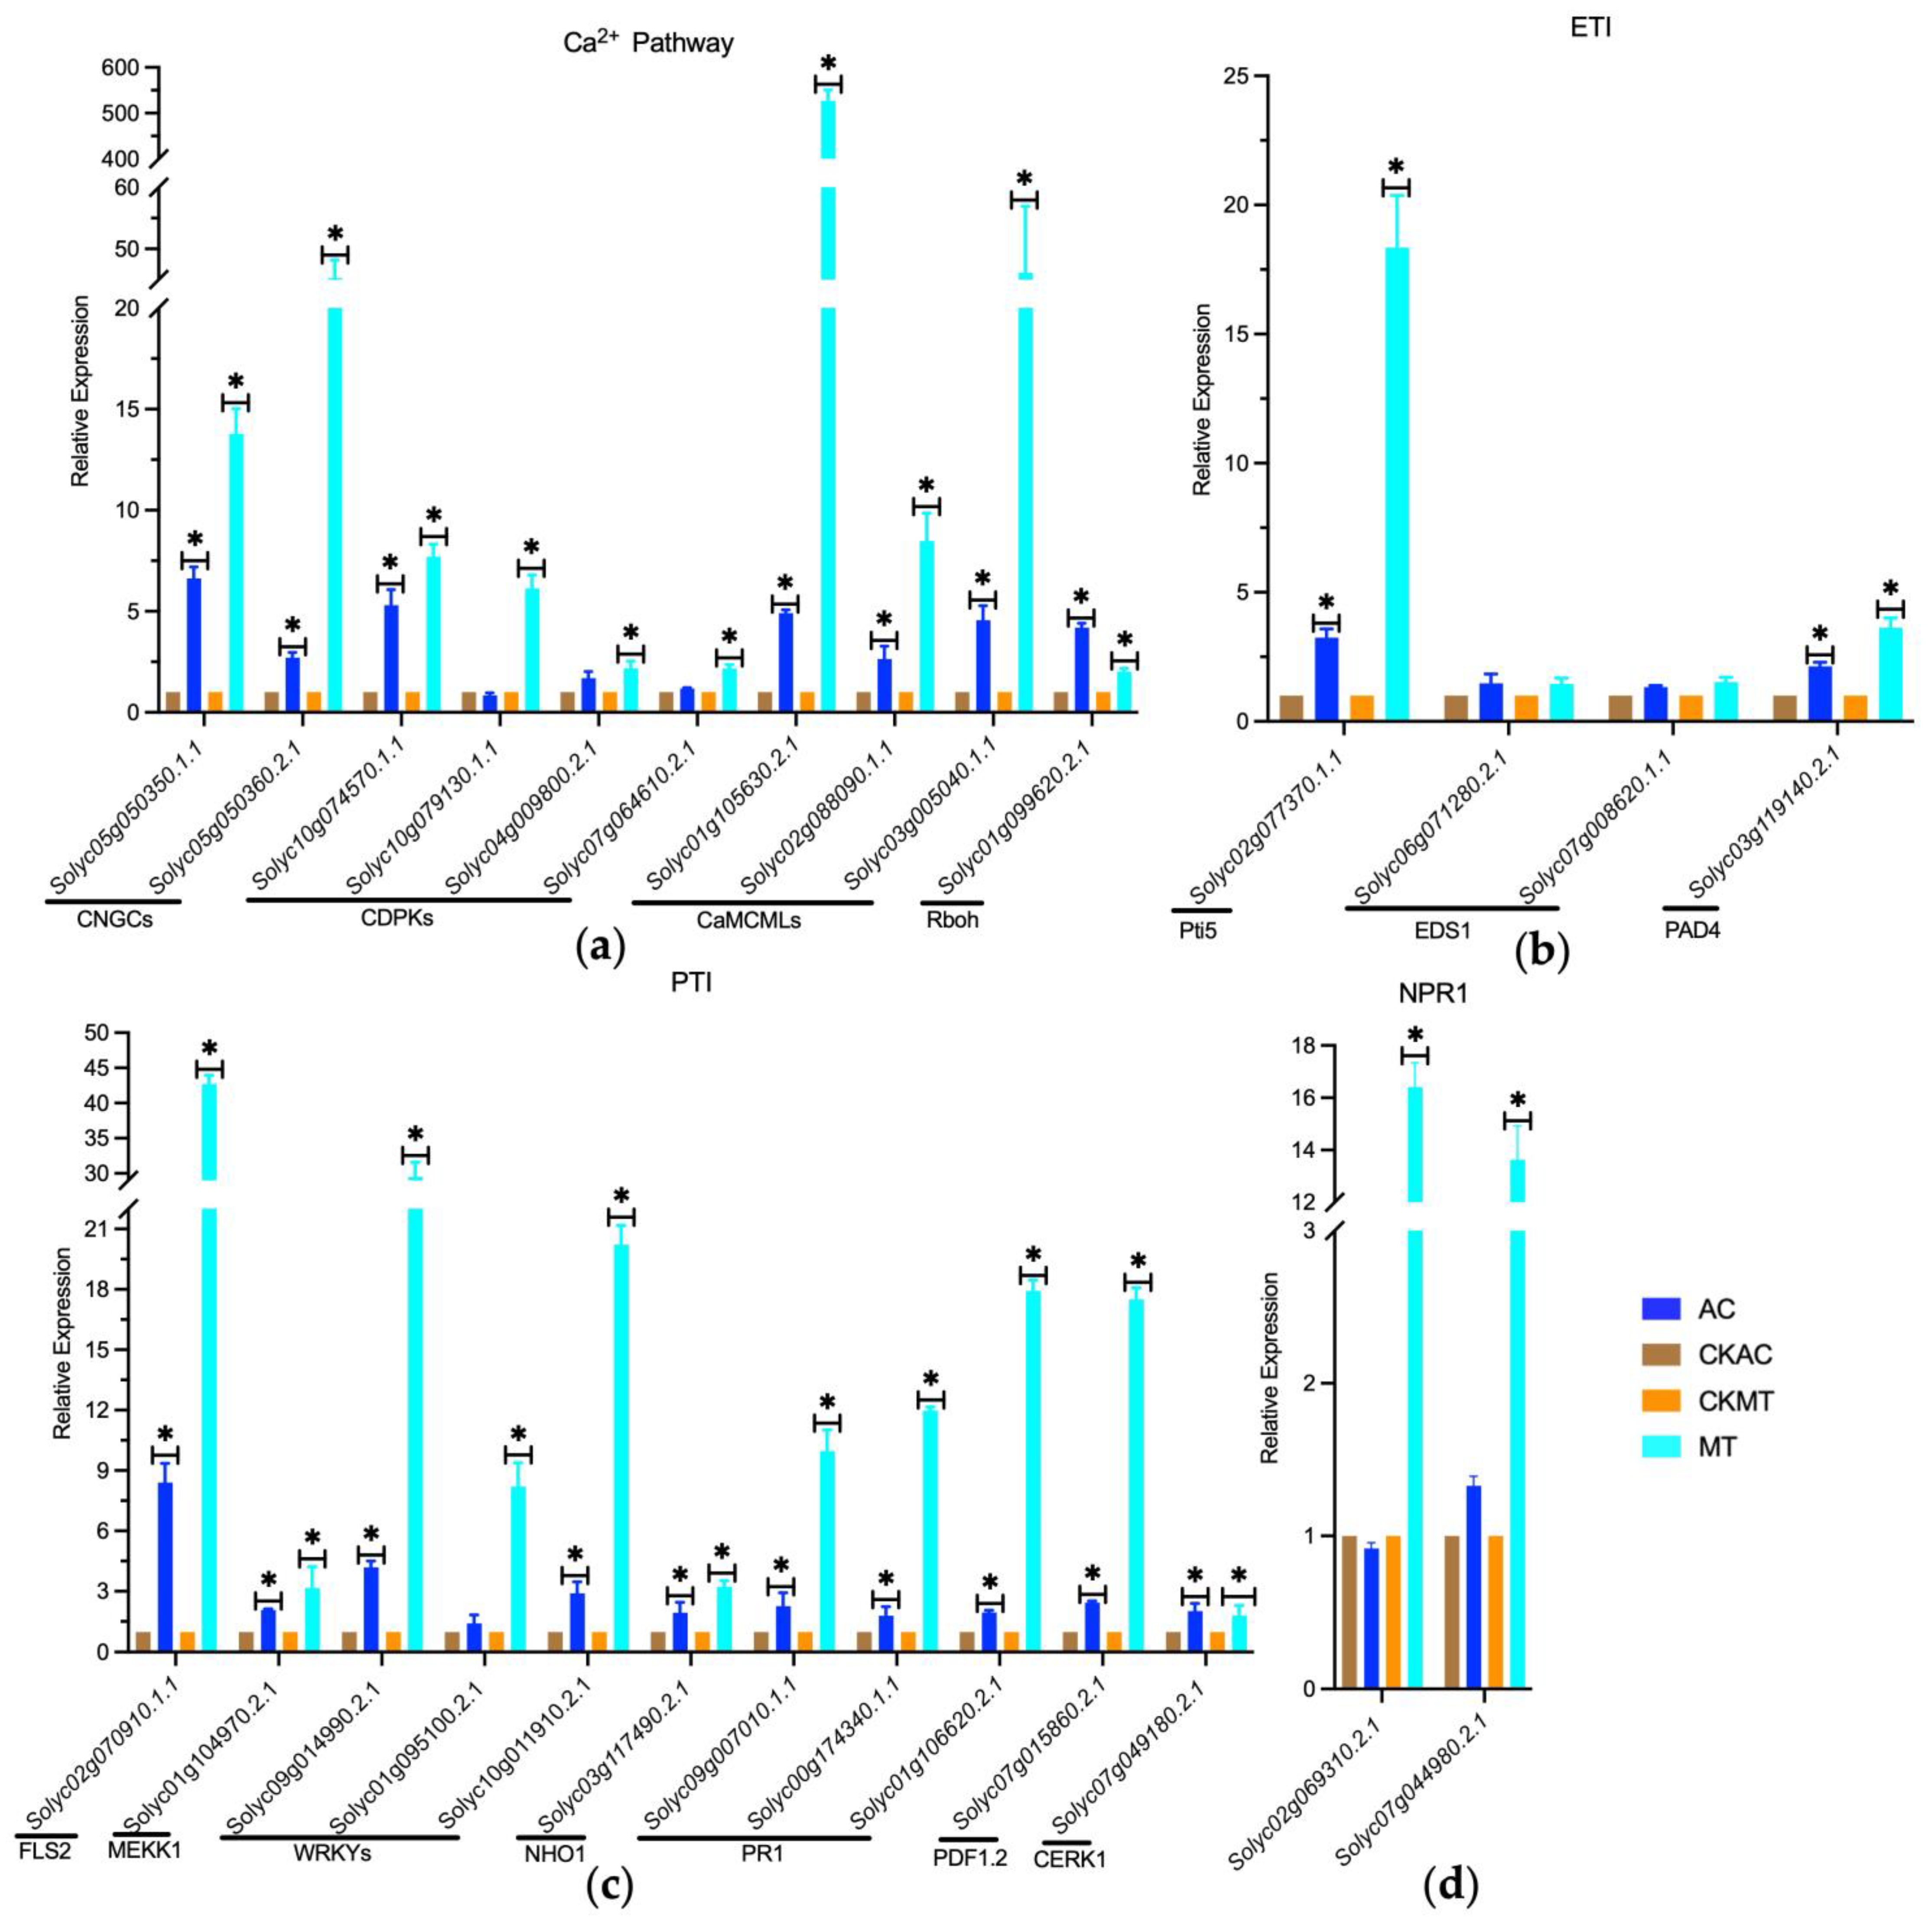
2.4. Enhanced Activation of Ca2+ Channel-Associated Genes in MT Tomato Variety during Early B. cinerea Attacking
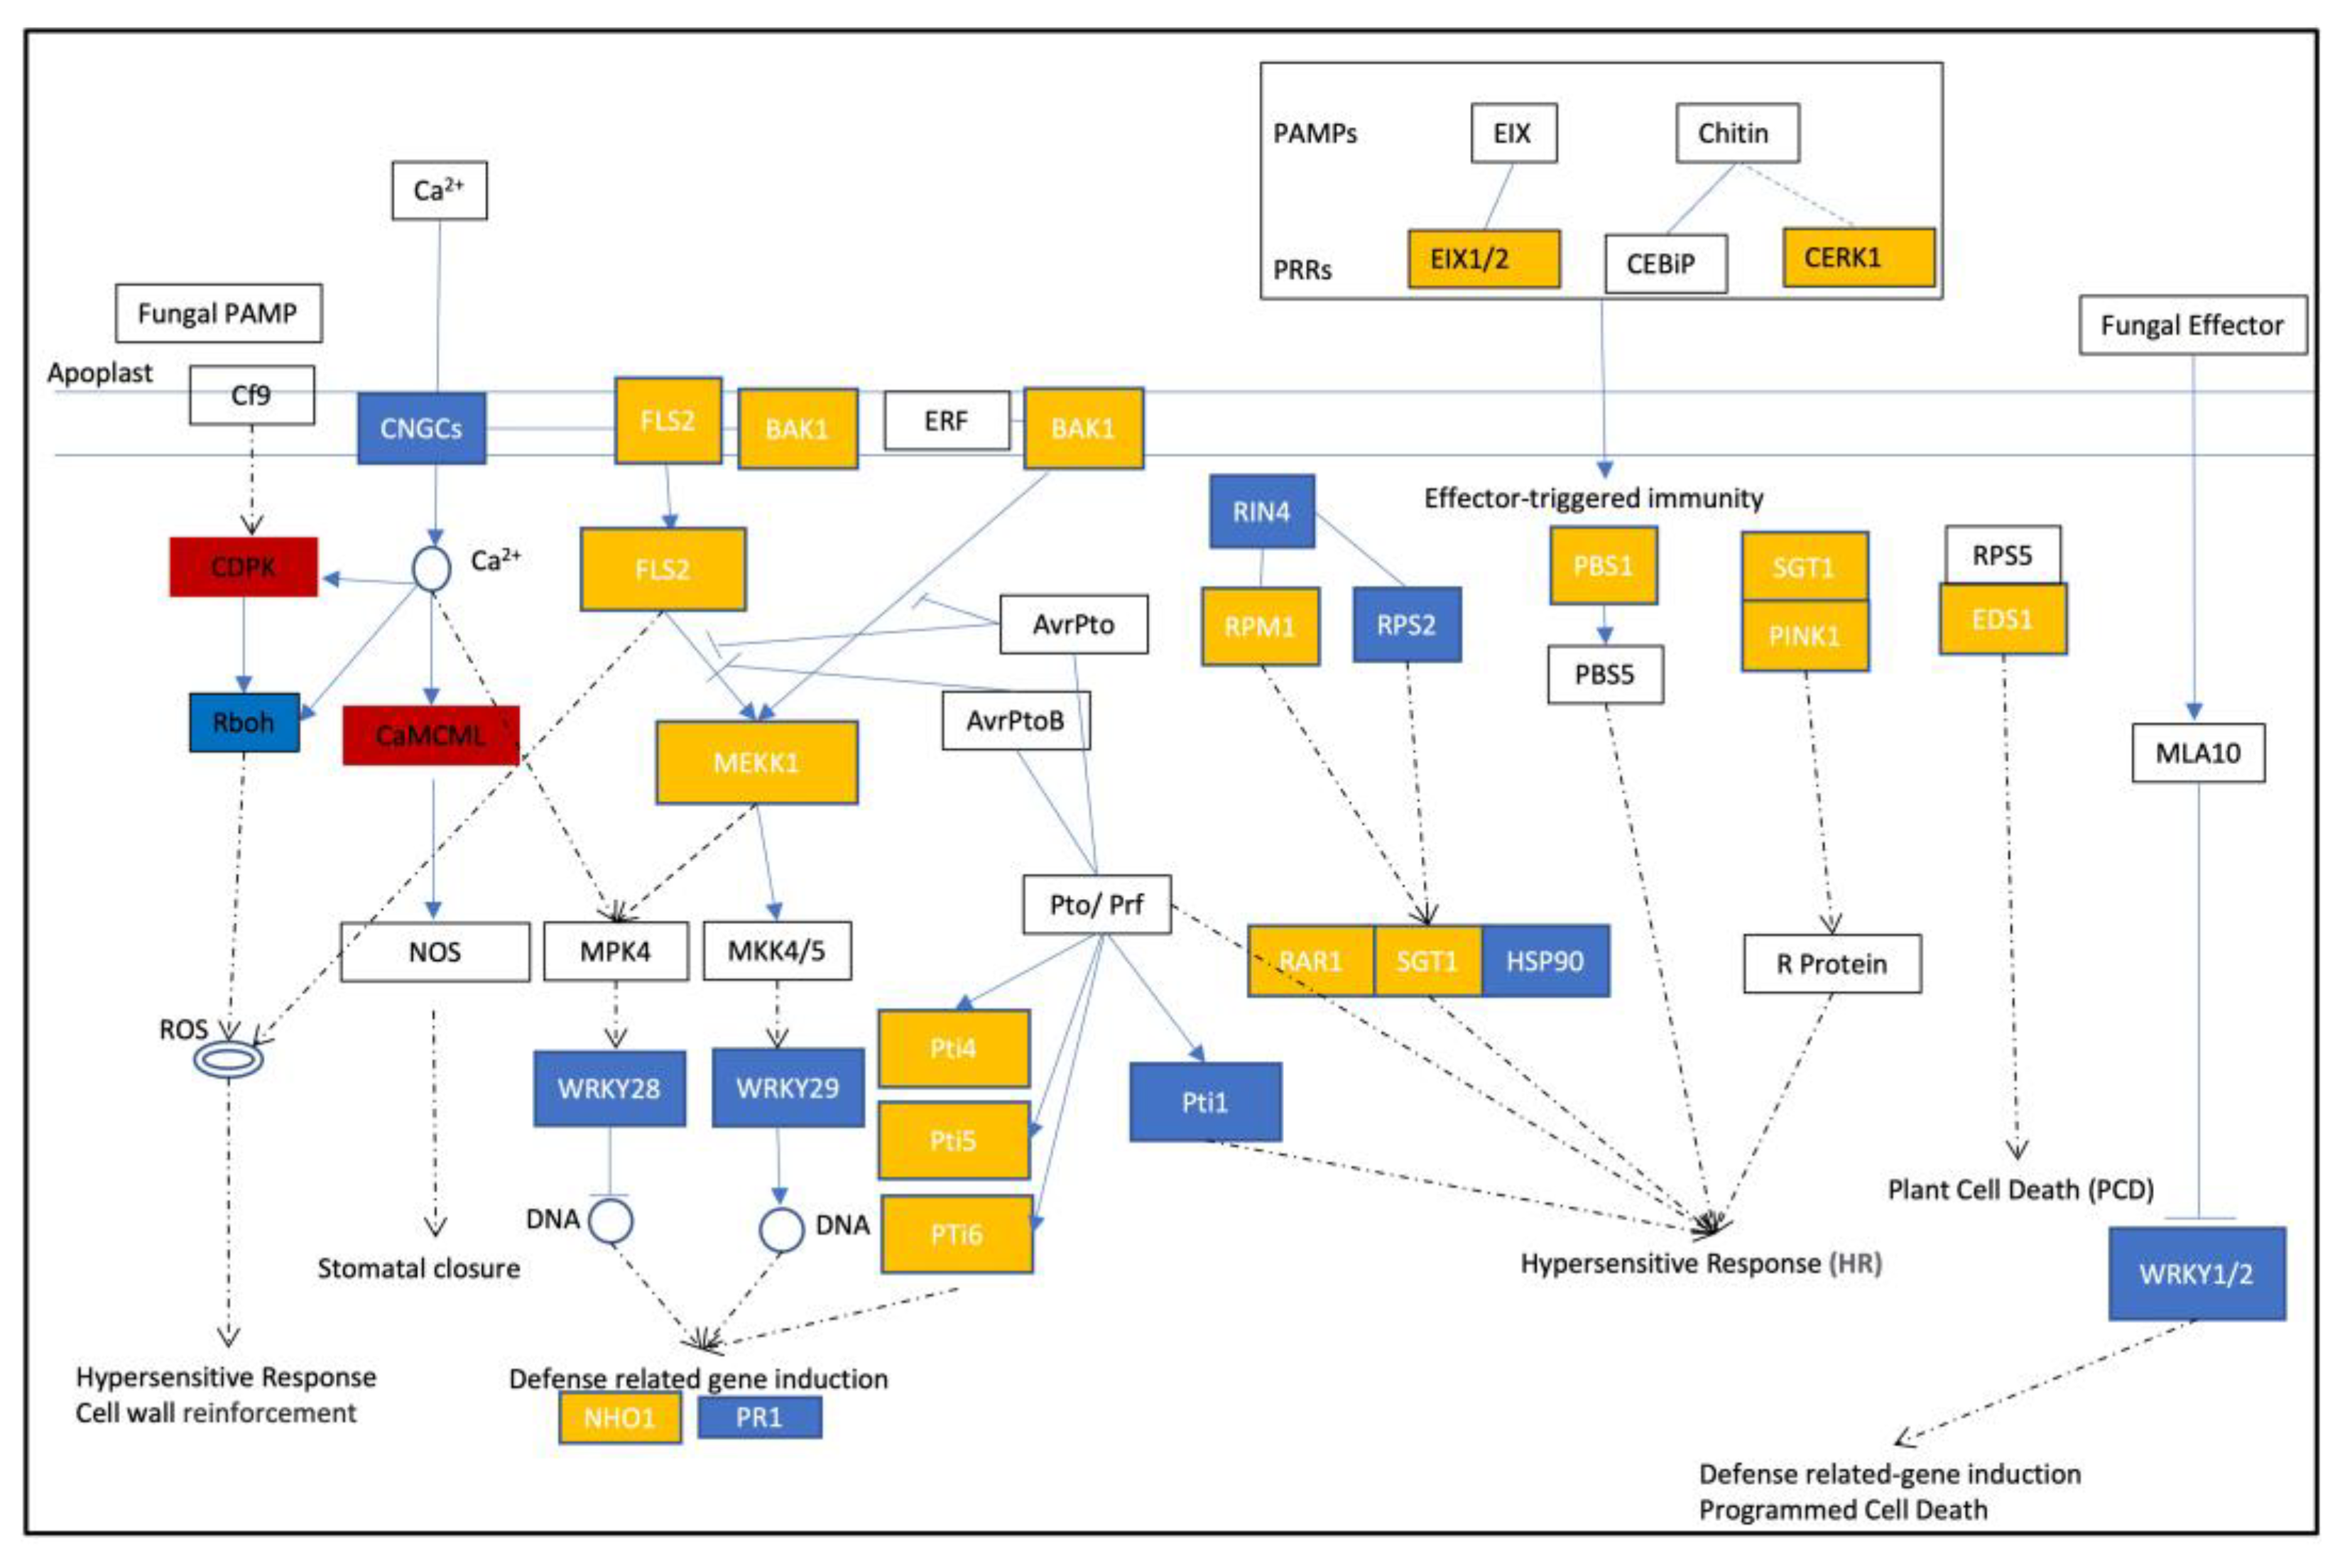
2.5. Partial Activation of PTI, ETI, and SA Signaling Pathways during Early Infection of Tomatoes by Gray Mold Pathogen
3. Discussion
4. Materials and Methods
5. Conclusions
Supplementary Materials
Author Contributions
Funding
Institutional Review Board Statement
Informed Consent Statement
Data Availability Statement
Acknowledgments
Conflicts of Interest
References
- Tieman, D.; Zhu, G.; Resende, M.F., Jr.; Lin, T.; Nguyen, C.; Bies, D.; Rambla, J.L.; Beltran, K.S.; Taylor, M.; Zhang, B.; et al. A chemical genetic roadmap to improved tomato flavor. Science 2017, 355, 391–394. [Google Scholar] [CrossRef]
- Zhang, T.; Liang, J.; Wang, M.; Li, D.; Liu, Y.; Chen, H.H.; Yang, X. Genetic engineering of the biosynthesis of glycinebetaine enhances the fruit development and size of tomato. Plant Sci. 2019, 280, 355–366. [Google Scholar] [CrossRef] [PubMed]
- Shah, P.; Powell, A.L.; Orlando, R.; Bergmann, C.; Gutierrez-Sanchez, G. Proteomic analysis of ripening tomato fruit infected by Botrytis cinerea. J. Proteome Res. 2012, 11, 2178–2192. [Google Scholar] [CrossRef] [PubMed]
- Smith, J.E.; Mengesha, B.; Tang, H.; Mengiste, T.; Bluhm, B.H. Resistance to Botrytis cinerea in Solanum lycopersicoides involves widespread transcriptional reprogramming. BMC Genom. 2014, 15, 334. [Google Scholar] [CrossRef]
- Veloso, J.; van Kan, J.A.L. Many Shades of Grey in Botrytis-Host Plant Interactions. Trends Plant Sci. 2018, 23, 613–622. [Google Scholar] [CrossRef]
- Hashim, A.; Ismail, S.I.; Alsultan, W.; Seman, I.A.; Rashed, O.; Ahmad, K. Control of gray mold disease of tomato caused by Botrytis cinerea using bacterial secondary metabolites. Malays. Appl. Biol. 2020, 49, 89–97. [Google Scholar] [CrossRef]
- Gao, M.; Zhang, N.; Liang, W. Systematic Analysis of Lysine Lactylation in the Plant Fungal Pathogen Botrytis cinerea. Front. Microbiol. 2020, 11, 594743. [Google Scholar] [CrossRef]
- Zipfel, C. Pattern-recognition receptors in plant innate immunity. Curr. Opin. Immunol. 2008, 20, 10–16. [Google Scholar] [CrossRef]
- Cao, Y.; Aceti, D.J.; Sabat, G.; Song, J.; Makino, S.-i.; Fox, B.G.; Bent, A.F. Mutations in FLS2 Ser-938 dissect signaling activation in FLS2-mediated Arabidopsis immunity. PLoS Pathog. 2013, 9, e1003313. [Google Scholar] [CrossRef]
- Farman, M.L.; Leong, S.A. Chromosome walking to the AVR1-CO39 avirulence gene of Magnaporthe grisea: Discrepancy between the physical and genetic maps. Genetics 1998, 150, 1049–1058. [Google Scholar] [CrossRef] [PubMed]
- Houterman, P.M.; Cornelissen, B.J.; Rep, M. Suppression of plant resistance gene-based immunity by a fungal effector. PLoS Pathog. 2008, 4, e1000061. [Google Scholar] [CrossRef] [PubMed]
- El Oirdi, M.; El Rahman, T.A.; Rigano, L.; El Hadrami, A.; Rodriguez, M.C.; Daayf, F.; Vojnov, A.; Bouarab, K. Botrytis cinerea manipulates the antagonistic effects between immune pathways to promote disease development in tomato. Plant Cell 2011, 23, 2405–2421. [Google Scholar] [CrossRef] [PubMed]
- Campos, M.D.; Félix, M.d.R.; Patanita, M.; Materatski, P.; Albuquerque, A.; Ribeiro, J.A.; Varanda, C. Defense strategies: The role of transcription factors in tomato–pathogen interaction. Biology 2022, 11, 235. [Google Scholar] [CrossRef] [PubMed]
- AbuQamar, S.; Moustafa, K.; Tran, L.S. Mechanisms and strategies of plant defense against Botrytis cinerea. Crit. Rev. Biotechnol. 2017, 37, 262–274. [Google Scholar] [CrossRef]
- AbuQamar, S.; Chai, M.-F.; Luo, H.; Song, F.; Mengiste, T. Tomato protein kinase 1b mediates signaling of plant responses to necrotrophic fungi and insect herbivory. Plant Cell 2008, 20, 1964–1983. [Google Scholar] [CrossRef]
- Gupta, R.; Pizarro, L.; Leibman-Markus, M.; Marash, I.; Bar, M. Cytokinin response induces immunity and fungal pathogen resistance, and modulates trafficking of the PRR LeEIX2 in tomato. Mol. Plant Pathol. 2020, 21, 1287–1306. [Google Scholar] [CrossRef]
- Ito, M.; Ohnishi, K.; Hikichi, Y.; Kiba, A. Molecular chaperons and co-chaperons, Hsp90, RAR1, and SGT1 negatively regulate bacterial wilt disease caused by Ralstonia solanacearum in Nicotiana benthamiana. Plant Signal. Behav. 2015, 10, e970410. [Google Scholar] [CrossRef]
- Leibman-Markus, M.; Gupta, R.; Pizarro, L.; Bar, M. The LeEIX locus determines pathogen resistance in tomato. Phytopathology 2023, 113, 277–285. [Google Scholar] [CrossRef]
- Monaghan, J.; Zipfel, C. Plant pattern recognition receptor complexes at the plasma membrane. Curr. Opin. Plant Biol. 2012, 15, 349–357. [Google Scholar] [CrossRef]
- Fradin, E.F.; Zhang, Z.; Juarez Ayala, J.C.; Castroverde, C.M.; Nazar, R.N.; Robb, J.; Liu, C.-M.; Thomma, B.P.H.J. Genetic Dissection of Verticillium Wilt Resistance Mediated by Tomato Ve1. Plant Physiol. 2009, 150, 320–332. [Google Scholar] [CrossRef]
- Feng, S.; Pan, C.; Ding, S.; Ma, Q.; Hu, C.; Wang, P.; Shi, K. The glutamate receptor plays a role in defense against Botrytis cinerea through electrical signaling in tomato. Appl. Sci. 2021, 11, 11217. [Google Scholar] [CrossRef]
- Birkenbihl, R.P.; Diezel, C.; Somssich, I.E. Arabidopsis WRKY33 is a key transcriptional regulator of hormonal and metabolic responses toward Botrytis cinerea infection. Plant Physiol. 2012, 159, 266–285. [Google Scholar] [CrossRef] [PubMed]
- Zhou, J.; Wang, J.; Zheng, Z.; Fan, B.; Yu, J.-Q.; Chen, Z. Characterization of the promoter and extended C-terminal domain of Arabidopsis WRKY33 and functional analysis of tomato WRKY33 homologues in plant stress responses. J. Exp. Bot. 2015, 66, 4567–4583. [Google Scholar] [CrossRef] [PubMed]
- Chen, L.; Zhang, L.; Xiang, S.; Chen, Y.; Zhang, H.; Yu, D. The transcription factor WRKY75 positively regulates jasmonate-mediated plant defense to necrotrophic fungal pathogens. J. Exp. Bot. 2021, 72, 1473–1489. [Google Scholar] [CrossRef] [PubMed]
- Le Hénanff, G.; Profizi, C.; Courteaux, B.; Rabenoelina, F.; Gérard, C.; Clément, C.; Baillieul, F.; Cordelier, S.; Dhondt-Cordelier, S. Grapevine NAC1 transcription factor as a convergent node in developmental processes, abiotic stresses, and necrotrophic/biotrophic pathogen tolerance. J. Exp. Bot. 2013, 64, 4877–4893. [Google Scholar] [CrossRef] [PubMed]
- Zhu, W.; Ronen, M.; Gur, Y.; Minz-Dub, A.; Masrati, G.; Ben-Tal, N.; Savidor, A.; Sharon, I.; Eizner, E.; Valerius, O. BcXYG1, a secreted xyloglucanase from Botrytis cinerea, triggers both cell death and plant immune responses. Plant Physiol. 2017, 175, 438–456. [Google Scholar] [CrossRef] [PubMed]
- Gui, Y.-J.; Zhang, W.-Q.; Zhang, D.-D.; Zhou, L.; Short, D.P.; Wang, J.; Ma, X.-F.; Li, T.-G.; Kong, Z.-Q.; Wang, B.-L. A Verticillium dahliae extracellular cutinase modulates plant immune responses. Mol. Plant-Microbe Interact. 2018, 31, 260–273. [Google Scholar] [CrossRef]
- Gui, Y.J.; Chen, J.Y.; Zhang, D.D.; Li, N.Y.; Li, T.G.; Zhang, W.Q.; Wang, X.Y.; Short, D.P.; Li, L.; Guo, W. Verticillium dahliae manipulates plant immunity by glycoside hydrolase 12 proteins in conjunction with carbohydrate-binding module 1. Environ. Microbiol. 2017, 19, 1914–1932. [Google Scholar] [CrossRef]
- Ma, Z.; Song, T.; Zhu, L.; Ye, W.; Wang, Y.; Shao, Y.; Dong, S.; Zhang, Z.; Dou, D.; Zheng, X.; et al. A Phytophthora sojae glycoside hydrolase 12 protein is a major virulence factor during soybean infection and is recognized as a PAMP. Plant Cell 2015, 27, 2057–2072. [Google Scholar] [CrossRef]
- Bi, K.; Scalschi, L.; Jaiswal, N.; Mengiste, T.; Fried, R.; Sanz, A.B.; Arroyo, J.; Zhu, W.; Masrati, G.; Sharon, A. The Botrytis cinerea Crh1 transglycosylase is a cytoplasmic effector triggering plant cell death and defense response. Nat. Commun. 2021, 12, 2166. [Google Scholar] [CrossRef]
- Yuan, M.; Ngou, B.P.M.; Ding, P.; Xin, X.-F. PTI-ETI crosstalk: An integrative view of plant immunity. Curr. Opin. Plant Biol. 2021, 62, 102030. [Google Scholar] [CrossRef] [PubMed]
- Tena, G. PTI and ETI are one. Nat. Plants 2021, 7, 1527. [Google Scholar] [CrossRef] [PubMed]
- Castañeda, P.; Pérez, L.M. Calcium ions promote the response of Citrus limon against fungal elicitors or wounding. Phytochemistry 1996, 42, 595–598. [Google Scholar] [CrossRef]
- Leba, L.J.; Cheval, C.; Ortiz-Martín, I.; Ranty, B.; Beuzón, C.R.; Galaud, J.P.; Aldon, D. CML9, an Arabidopsis calmodulin-like protein, contributes to plant innate immunity through a flagellin-dependent signalling pathway. Plant J. 2012, 71, 976–989. [Google Scholar] [CrossRef] [PubMed]
- Li, L.; Zou, Y. Induction of disease resistance by salicylic acid and calcium ion against Botrytis cinerea in tomato (Lycopersicon esculentum). Emir. J. Food Agric. 2017, 29, 78–82. [Google Scholar] [CrossRef]
- Ghosh, S.; Bheri, M.; Bisht, D.; Pandey, G.K. Calcium signaling and transport machinery: Potential for development of stress tolerance in plants. Curr. Plant Biol. 2022, 29, 100235. [Google Scholar] [CrossRef]
- Moeder, W.; Phan, V.; Yoshioka, K. Ca2+ to the rescue—Ca2+ channels and signaling in plant immunity. Plant Sci. 2019, 279, 19–26. [Google Scholar] [CrossRef]
- Saand, M.A.; Xu, Y.-P.; Li, W.; Wang, J.-P.; Cai, X.-Z. Cyclic nucleotide gated channel gene family in tomato: Genome-wide identification and functional analyses in disease resistance. Front. Plant Sci. 2015, 6, 303. [Google Scholar] [CrossRef] [PubMed]
- Lee, J.; Shim, D.; Moon, S.; Kim, H.; Bae, W.; Kim, K.; Kim, Y.-H.; Rhee, S.-K.; Hong, C.P.; Hong, S.-Y.; et al. Genome-wide transcriptomic analysis of BR-deficient Micro-Tom reveals correlations between drought stress tolerance and brassinosteroid signaling in tomato. Plant Physiol. Biochem. 2018, 127, 553–560. [Google Scholar] [CrossRef] [PubMed]
- Shikata, M.; Ezura, H. Micro-tom tomato as an alternative plant model system: Mutant collection and efficient transformation. Plant Signal Transduct. Methods Protoc. 2016, 1363, 47–55. [Google Scholar]
- Harel, Y.M.; Mehari, Z.H.; Rav-David, D.; Elad, Y. Systemic Resistance to Gray Mold Induced in Tomato by Benzothiadiazole and Trichoderma harzianum T39. Phytopathology 2014, 104, 150–157. [Google Scholar] [CrossRef] [PubMed]
- Mehari, Z.H.; Elad, Y.; Rav-David, D.; Graber, E.R.; Meller Harel, Y. Induced systemic resistance in tomato (Solanum lycopersicum) against Botrytis cinerea by biochar amendment involves jasmonic acid signaling. Plant Soil 2015, 395, 31–44. [Google Scholar] [CrossRef]
- Audenaert, K.; De Meyer, G.B.; Höfte, M.M. Abscisic Acid Determines Basal Susceptibility of Tomato to Botrytis cinerea and Suppresses Salicylic Acid-Dependent Signaling Mechanisms. Plant Physiol. 2002, 128, 491–501. [Google Scholar] [CrossRef] [PubMed]
- Vicedo, B.; Flors, V.; de la O Leyva, M.; Finiti, I.; Kravchuk, Z.; Real, M.D.; García-Agustín, P.; González-Bosch, C. Hexanoic Acid-Induced Resistance against Botrytis cinerea in Tomato Plants. Mol. Plant-Microbe Interact. 2009, 22, 1455–1465. [Google Scholar] [CrossRef] [PubMed]
- Anders, S.; Huber, W. Differential expression analysis for sequence count data. Genome Biol. 2010, 11, R106. [Google Scholar] [CrossRef]
- Doughari, J. An overview of plant immunity. J. Plant Pathol. Microbiol. 2015, 6, 11. [Google Scholar]
- Van Baarlen, P.; van Belkum, A.; Summerbell, R.C.; Crous, P.W.; Thomma, B.P. Molecular mechanisms of pathogenicity: How do pathogenic microorganisms develop cross-kingdom host jumps? FEMS Microbiol. Rev. 2007, 31, 239–277. [Google Scholar] [CrossRef] [PubMed]
- Biemelt, S.; Sonnewald, U. Plant–microbe interactions to probe regulation of plant carbon metabolism. J. Plant Physiol. 2006, 163, 307–318. [Google Scholar] [CrossRef]
- Veillet, F.; Gaillard, C.; Lemonnier, P.; Coutos-Thévenot, P.; La Camera, S. The molecular dialogue between Arabidopsis thaliana and the necrotrophic fungus Botrytis cinerea leads to major changes in host carbon metabolism. Sci. Rep. 2017, 7, 17121. [Google Scholar] [CrossRef]
- Bolton, M.D. Primary metabolism and plant defense—Fuel for the fire. Mol. Plant-Microbe Interact. 2009, 22, 487–497. [Google Scholar] [CrossRef]
- Seo, Y.-S.; Cho, J.-I.; Lee, S.-K.; Ryu, H.-S.; Han, M.; Hahn, T.-R.; Sonnewald, U.; Jeon, J. Current insights into the primary carbon metabolic flux that occurs in plants undergoing a defense response. Plant Stress 2007, 1, 42–49. [Google Scholar]
- Zhao, X.; Li, F.; Li, K. The 14-3-3 proteins: Regulators of plant metabolism and stress responses. Plant Biol. 2021, 23, 531–539. [Google Scholar] [CrossRef] [PubMed]
- Liu, B.; Ouyang, Z.; Zhang, Y.; Li, X.; Hong, Y.; Huang, L.; Liu, S.; Zhang, H.; Li, D.; Song, F. Tomato NAC transcription factor SlSRN1 positively regulates defense response against biotic stress but negatively regulates abiotic stress response. PLoS ONE 2014, 9, e102067. [Google Scholar] [CrossRef]
- Wang, X.; Basnayake, B.V.S.; Zhang, H.; Li, G.; Li, W.; Virk, N.; Mengiste, T.; Song, F. The Arabidopsis ATAF1, a NAC transcription factor, is a negative regulator of defense responses against necrotrophic fungal and bacterial pathogens. Mol. Plant-Microbe Interact. 2009, 22, 1227–1238. [Google Scholar] [CrossRef]
- Erpen, L.; Devi, H.S.; Grosser, J.W.; Dutt, M. Potential use of the DREB/ERF, MYB, NAC and WRKY transcription factors to improve abiotic and biotic stress in transgenic plants. Plant Cell Tissue Organ Cult. 2018, 132, 1–25. [Google Scholar] [CrossRef]
- Baillo, E.H.; Kimotho, R.N.; Zhang, Z.; Xu, P. Transcription factors associated with abiotic and biotic stress tolerance and their potential for crops improvement. Genes 2019, 10, 771. [Google Scholar] [CrossRef] [PubMed]
- Rothan, C.; Diouf, I.; Causse, M. Trait discovery and editing in tomato. Plant J. 2019, 97, 73–90. [Google Scholar] [CrossRef]
- Takahashi, H.; Shimizu, A.; Arie, T.; Rosmalawati, S.; Fukushima, S.; Kikuchi, M.; Hikichi, Y.; Kanda, A.; Takahashi, A.; Kiba, A.; et al. Catalog of Micro-Tom tomato responses to common fungal, bacterial, and viral pathogens. J. Gen. Plant Pathol. 2005, 71, 8–22. [Google Scholar] [CrossRef]
- Sefloo, N.G.; Wieczorek, K.; Steinkellner, S.; Hage-Ahmed, K. Serendipita Species Trigger Cultivar-Specific Responses to Fusarium Wilt in Tomato. Agronomy 2019, 9, 595. [Google Scholar]
- Yu, W.; Zhao, R.; Sheng, J.; Shen, L. SlERF2 Is Associated with Methyl Jasmonate-Mediated Defense Response against Botrytis cinerea in Tomato Fruit. J. Agric. Food Chem. 2018, 66, 9923–9932. [Google Scholar] [CrossRef]
- Hou, R.; Shi, J.; Ma, X.; Wei, H.; Hu, J.; Tsang, Y.F.; Gao, M.-T. Effect of phenolic acids derived from rice straw on Botrytis cinerea and infection on tomato. Waste Biomass Valorization 2020, 11, 6555–6563. [Google Scholar] [CrossRef]
- Cristescu, S.M.; De Martinis, D.; Te Lintel Hekkert, S.; Parker, D.H.; Harren, F.J. Ethylene production by Botrytis cinerea in vitro and in tomatoes. Appl. Environ. Microbiol. 2002, 68, 5342–5350. [Google Scholar] [CrossRef]
- Williamson, B.; Tudzynski, B.; Tudzynski, P.; van Kan, J.A. Botrytis cinerea: The cause of grey mould disease. Mol. Plant Pathol. 2007, 8, 561–580. [Google Scholar] [CrossRef] [PubMed]
- Ren, H.; Bai, M.; Sun, J.; Liu, J.; Ren, M.; Dong, Y.; Wang, N.; Ning, G.; Wang, C. RcMYB84 and RcMYB123 mediate jasmonate-induced defense responses against Botrytis cinerea in rose (Rosa chinensis). Plant J. 2020, 103, 1839–1849. [Google Scholar] [CrossRef] [PubMed]
- Vega, A.; Canessa, P.; Hoppe, G.; Retamal, I.; Moyano, T.C.; Canales, J.; Gutiérrez, R.A.; Rubilar, J. Transcriptome analysis reveals regulatory networks underlying differential susceptibility to Botrytis cinerea in response to nitrogen availability in Solanum lycopersicum. Front. Plant Sci. 2015, 6, 911. [Google Scholar] [CrossRef] [PubMed]
- Blanco-Ulate, B.; Vincenti, E.; Powell, A.L.; Cantu, D. Tomato transcriptome and mutant analyses suggest a role for plant stress hormones in the interaction between fruit and Botrytis cinerea. Front. Plant Sci. 2013, 4, 142. [Google Scholar] [CrossRef] [PubMed]
- Min, D.; Li, F.; Cui, X.; Zhou, J.; Li, J.; Ai, W.; Shu, P.; Zhang, X.; Li, X.; Meng, D. SlMYC2 are required for methyl jasmonate-induced tomato fruit resistance to Botrytis cinerea. Food Chem. 2020, 310, 125901. [Google Scholar] [CrossRef] [PubMed]
- Li, R.; Li, Y.; Zhang, Y.; Sheng, J.; Zhu, H.; Shen, L. Transcriptome analysis reveals that SlNPR1 mediates tomato fruit resistance against Botrytis cinerea by modulating phenylpropanoid metabolism and balancing ROS homeostasis. Postharvest Biol. Technol. 2021, 172, 111382. [Google Scholar] [CrossRef]
- Rezzonico, F.; Rupp, O.; Fahrentrapp, J. Pathogen recognition in compatible plant-microbe interactions. Sci. Rep. 2017, 7, 6383. [Google Scholar] [CrossRef]
- Wang, Y.; Zhu, X.; Wang, J.; Shen, C.; Wang, W. Identification of Mycoparasitism-Related Genes against the Phytopathogen Botrytis cinerea via Transcriptome Analysis of Trichoderma harzianum T4. J. Fungi 2023, 9, 324. [Google Scholar] [CrossRef]
- Zhang, J.; Li, Y.; Du, S.; Deng, Z.; Liang, Q.; Song, G.; Wang, H.; Yan, M.; Wang, X. Transcriptomic and proteomic analysis reveals (E)-2-hexenal modulates tomato resistance against Botrytis cinerea by regulating plant defense mechanism. Plant Mol. Biol. 2023, 111, 505–522. [Google Scholar] [CrossRef] [PubMed]
- Windram, O.; Madhou, P.; McHattie, S.; Hill, C.; Hickman, R.; Cooke, E.; Jenkins, D.J.; Penfold, C.A.; Baxter, L.; Breeze, E.; et al. Arabidopsis Defense against Botrytis cinerea: Chronology and Regulation Deciphered by High-Resolution Temporal Transcriptomic Analysis. Plant Cell 2012, 24, 3530–3557. [Google Scholar] [CrossRef] [PubMed]
- Zimmermann, S.; Nürnberger, T.; Frachisse, J.M.; Wirtz, W.; Guern, J.; Hedrich, R.; Scheel, D. Receptor-mediated activation of a plant Ca2+-permeable ion channel involved in pathogen defense. Proc. Natl. Acad. Sci. USA 1997, 94, 2751–2755. [Google Scholar] [CrossRef] [PubMed]
- Gao, M.; He, Y.; Yin, X.; Zhong, X.; Yan, B.; Wu, Y.; Chen, J.; Li, X.; Zhai, K.; Huang, Y.; et al. Ca2+ sensor-mediated ROS scavenging suppresses rice immunity and is exploited by a fungal effector. Cell 2021, 184, 5391–5404.e5317. [Google Scholar] [CrossRef] [PubMed]
- Zhao, C.; Tang, Y.; Wang, J.; Zeng, Y.; Sun, H.; Zheng, Z.; Su, R.; Schneeberger, K.; Parker, J.E.; Cui, H. A mis-regulated cyclic nucleotide-gated channel mediates cytosolic calcium elevation and activates immunity in Arabidopsis. New Phytol. 2021, 230, 1078–1094. [Google Scholar] [CrossRef] [PubMed]
- Yuan, P.; Tanaka, K.; Poovaiah, B.W. Calcium/Calmodulin-Mediated Defense Signaling: What Is Looming on the Horizon for AtSR1/CAMTA3-Mediated Signaling in Plant Immunity. Front Plant Sci. 2021, 12, 795353. [Google Scholar] [CrossRef] [PubMed]
- Wang, J.P.; Xu, Y.P.; Munyampundu, J.P.; Liu, T.Y.; Cai, X.Z. Calcium-dependent protein kinase (CDPK) and CDPK-related kinase (CRK) gene families in tomato: Genome-wide identification and functional analyses in disease resistance. Mol. Genet. Genom. 2016, 291, 661–676. [Google Scholar] [CrossRef]
- Wang, R.; He, F.; Ning, Y.; Wang, G.L. Fine-Tuning of RBOH-Mediated ROS Signaling in Plant Immunity. Trends Plant Sci. 2020, 25, 1060–1062. [Google Scholar] [CrossRef]
- Li, X.; Lin, H.; Zhang, W.; Zou, Y.; Zhang, J.; Tang, X.; Zhou, J.M. Flagellin induces innate immunity in nonhost interactions that is suppressed by Pseudomonas syringae effectors. Proc. Natl. Acad. Sci. USA 2005, 102, 12990–12995. [Google Scholar] [CrossRef]
- Hauck, P.; Thilmony, R.; He, S.Y. A Pseudomonas syringae type III effector suppresses cell wall-based extracellular defense in susceptible Arabidopsis plants. Proc. Natl. Acad. Sci. USA 2003, 100, 8577–8582. [Google Scholar] [CrossRef]
- Strohmayer, A.; Moser, M.; Si-Ammour, A.; Krczal, G.; Boonrod, K. ‘Candidatus Phytoplasma mali’genome encodes a protein that functions as an E3 ubiquitin ligase and could inhibit plant basal defense. Mol. Plant-Microbe Interact. 2019, 32, 1487–1495. [Google Scholar] [CrossRef] [PubMed]
- Pruitt, R.N.; Locci, F.; Wanke, F.; Zhang, L.; Saile, S.C.; Joe, A.; Karelina, D.; Hua, C.; Fröhlich, K.; Wan, W.L.; et al. The EDS1-PAD4-ADR1 node mediates Arabidopsis pattern-triggered immunity. Nature 2021, 598, 495–499. [Google Scholar] [CrossRef] [PubMed]
- Wang, Y.; Feng, G.; Zhang, Z.; Liu, Y.; Ma, Y.; Wang, Y.; Ma, F.; Zhou, Y.; Gross, R.; Xu, H.; et al. Overexpression of Pti4, Pti5, and Pti6 in tomato promote plant defense and fruit ripening. Plant Sci. 2021, 302, 110702. [Google Scholar] [CrossRef] [PubMed]
- Gu, Y.Q.; Yang, C.; Thara, V.K.; Zhou, J.; Martin, G.B. Pti4 is induced by ethylene and salicylic acid, and its product is phosphorylated by the Pto kinase. Plant Cell 2000, 12, 771–786. [Google Scholar] [CrossRef] [PubMed]
- Sun, M.; Qiu, L.; Liu, Y.; Zhang, H.; Zhang, Y.; Qin, Y.; Mao, Y.; Zhou, M.; Du, X.; Qin, Z.; et al. Pto Interaction Proteins: Critical Regulators in Plant Development and Stress Response. Front. Plant Sci. 2022, 13, 774229. [Google Scholar] [CrossRef]
- He, P.; Warren, R.F.; Zhao, T.; Shan, L.; Zhu, L.; Tang, X.; Zhou, J.M. Overexpression of Pti5 in tomato potentiates pathogen-induced defense gene expression and enhances disease resistance to Pseudomonas syringae pv. tomato. Mol. Plant Microbe Interact. 2001, 14, 1453–1457. [Google Scholar] [CrossRef]
- Jones, J.D.; Dangl, J.L. The plant immune system. Nature 2006, 444, 323–329. [Google Scholar] [CrossRef]
- Lal, N.K.; Nagalakshmi, U.; Hurlburt, N.K.; Flores, R.; Bak, A.; Sone, P.; Ma, X.; Song, G.; Walley, J.; Shan, L.; et al. The Receptor-like Cytoplasmic Kinase BIK1 Localizes to the Nucleus and Regulates Defense Hormone Expression during Plant Innate Immunity. Cell Host Microbe 2018, 23, 485–497.e485. [Google Scholar] [CrossRef]
- Singh, K.B.; Foley, R.C.; Oñate-Sánchez, L. Transcription factors in plant defense and stress responses. Curr. Opin. Plant Biol. 2002, 5, 430–436. [Google Scholar] [CrossRef]
- Yuan, X.; Wang, H.; Cai, J.; Li, D.; Song, F. NAC transcription factors in plant immunity. Phytopathol. Res. 2019, 1, 3. [Google Scholar] [CrossRef]
- Pandey, S.P.; Somssich, I.E. The role of WRKY transcription factors in plant immunity. Plant Physiol. 2009, 150, 1648–1655. [Google Scholar] [CrossRef] [PubMed]
- Tsuda, K.; Somssich, I.E. Transcriptional networks in plant immunity. New Phytol. 2015, 206, 932–947. [Google Scholar] [CrossRef]
- Alves, M.S.; Dadalto, S.P.; Gonçalves, A.B.; De Souza, G.B.; Barros, V.A.; Fietto, L.G. Transcription factor functional protein-protein interactions in plant defense responses. Proteomes 2014, 2, 85–106. [Google Scholar] [CrossRef] [PubMed]
- Ng, D.W.; Abeysinghe, J.K.; Kamali, M. Regulating the regulators: The control of transcription factors in plant defense signaling. Int. J. Mol. Sci. 2018, 19, 3737. [Google Scholar] [CrossRef] [PubMed]
- Yun, K.-Y.; Park, M.R.; Mohanty, B.; Herath, V.; Xu, F.; Mauleon, R.; Wijaya, E.; Bajic, V.B.; Bruskiewich, R.; de Los Reyes, B.G. Transcriptional regulatory network triggered by oxidative signals configures the early response mechanisms of japonica rice to chilling stress. BMC Plant Biol. 2010, 10, 16. [Google Scholar] [CrossRef]
- Slavokhotova, A.; Korostyleva, T.; Shelenkov, A.; Pukhalskiy, V.; Korottseva, I.; Slezina, M.; Istomina, E.; Odintsova, T. Transcriptomic analysis of genes involved in plant defense response to the cucumber green mottle mosaic virus infection. Life 2021, 11, 1064. [Google Scholar] [CrossRef]
- Amorim, L.L.; da Fonseca Dos Santos, R.; Neto, J.P.B.; Guida-Santos, M.; Crovella, S.; Benko-Iseppon, A.M. Transcription factors involved in plant resistance to pathogens. Curr. Protein Pept. Sci. 2017, 18, 335–351. [Google Scholar] [CrossRef]
- Du, Y.; Fan, Y.; Chen, H.; Wang, J.; Xiong, C.; Zheng, Y.; Chen, D.; Guo, R. A full-length transcriptome dataset of normal and Nosema ceranae-challenged midgut tissues of eastern honeybee workers. bioRxiv 2020. [Google Scholar] [CrossRef]
- Bayega, A.; Oikonomopoulos, S.; Zorbas, E.; Wang, Y.C.; Gregoriou, M.-E.; Tsoumani, K.T.; Mathiopoulos, K.D.; Ragoussis, J. Transcriptome landscape of the developing olive fruit fly embryo delineated by Oxford Nanopore long-read RNA-Seq. bioRxiv 2018. [Google Scholar] [CrossRef]
- Jenjaroenpun, P.; Wongsurawat, T.; Pereira, R.; Patumcharoenpol, P.; Ussery, D.W.; Nielsen, J.; Nookaew, I. Complete genomic and transcriptional landscape analysis using third-generation sequencing: A case study of Saccharomyces cerevisiae CEN. PK113-7D. Nucleic Acids Res. 2018, 46, e38. [Google Scholar] [CrossRef]
- Hyatt, D.; Chen, G.-L.; LoCascio, P.F.; Land, M.L.; Larimer, F.W.; Hauser, L. Integrated nr database in protein annotation system and its localization. Nat. Commun. 2010, 6, 1–8. [Google Scholar]
- Koonin, E.V.; Fedorova, N.D.; Jackson, J.D.; Jacobs, A.R.; Krylov, D.M.; Makarova, K.S.; Mazumder, R.; Mekhedov, S.L.; Nikolskaya, A.N.; Rao, B.S.; et al. A comprehensive evolutionary classification of proteins encoded in complete eukaryotic genomes. Genome Biol. 2004, 5, R7. [Google Scholar] [CrossRef]
- Powell, S.; Forslund, K.; Szklarczyk, D.; Trachana, K.; Roth, A.; Huerta-Cepas, J.; Gabaldon, T.; Rattei, T.; Creevey, C.; Kuhn, M. eggNOG v4. 0: Nested orthology inference across 3686 organisms. Nucleic Acids Res. 2014, 42, D231–D239. [Google Scholar] [CrossRef]
- Finn, R.D.; Bateman, A.; Clements, J.; Coggill, P.; Eberhardt, R.Y.; Eddy, S.R.; Heger, A.; Hetherington, K.; Holm, L.; Mistry, J.; et al. Pfam: The protein families database. Nucleic Acids Res. 2014, 42, D222–D230. [Google Scholar] [CrossRef] [PubMed]
- Botstein, D.; Cherry, J.M.; Ashburner, M.; Ball, C.A.; Blake, J.A.; Butler, H.; Davis, A.P.; Dolinski, K.; Dwight, S.S.; Eppig, J.T.; et al. Gene Ontology: Tool for the unification of biology. Nat. Genet. 2000, 25, 25–29. [Google Scholar]
- Kanehisa, M.; Goto, S.; Kawashima, S.; Okuno, Y.; Hattori, M. The KEGG resource for deciphering the genome. Nucleic Acids Res. 2004, 32, D277–D280. [Google Scholar] [CrossRef] [PubMed]
- Tatusov, R.L.; Galperin, M.Y.; Natale, D.A.; Koonin, E.V. The COG database: A tool for genome-scale analysis of protein functions and evolution. Nucleic Acids Res. 2000, 28, 33–36. [Google Scholar] [CrossRef] [PubMed]
- Zhou, X.; Lindsay, H.; Robinson, M.D. Robustly detecting differential expression in RNA sequencing data using observation weights. Nucleic Acids Res. 2014, 42, e91. [Google Scholar] [CrossRef]
- Zheng, Y.; Jiao, C.; Sun, H.; Rosli, H.G.; Pombo, M.A.; Zhang, P.; Banf, M.; Dai, X.; Martin, G.B.; Giovannoni, J.J.; et al. iTAK: A program for genome-wide prediction and classification of plant transcription factors, transcriptional regulators, and protein kinases. Mol. Plant 2016, 9, 1667–1670. [Google Scholar] [CrossRef]
- Mistry, J.; Finn, R.D.; Eddy, S.R.; Bateman, A.; Punta, M. Challenges in homology search: HMMER3 and convergent evolution of coiled-coil regions. Nucleic Acids Res. 2013, 41, e121. [Google Scholar] [CrossRef]
- Zhang, H.-M.; Chen, H.; Liu, W.; Liu, H.; Gong, J.; Wang, H.; Guo, A.-Y. AnimalTFDB: A comprehensive animal transcription factor database. Nucleic Acids Res. 2012, 40, D144–D149. [Google Scholar] [CrossRef] [PubMed]
- Livak, K.J.; Schmittgen, T.D. Analysis of relative gene expression data using real-time quantitative PCR and the 2−ΔΔCT method. Methods 2001, 25, 402–408. [Google Scholar] [CrossRef] [PubMed]


Disclaimer/Publisher’s Note: The statements, opinions and data contained in all publications are solely those of the individual author(s) and contributor(s) and not of MDPI and/or the editor(s). MDPI and/or the editor(s) disclaim responsibility for any injury to people or property resulting from any ideas, methods, instructions or products referred to in the content. |
© 2023 by the authors. Licensee MDPI, Basel, Switzerland. This article is an open access article distributed under the terms and conditions of the Creative Commons Attribution (CC BY) license (https://creativecommons.org/licenses/by/4.0/).
Share and Cite
Tian, S.; Liu, B.; Shen, Y.; Cao, S.; Lai, Y.; Lu, G.; Wang, Z.; Wang, A. Unraveling the Molecular Mechanisms of Tomatoes’ Defense against Botrytis cinerea: Insights from Transcriptome Analysis of Micro-Tom and Regular Tomato Varieties. Plants 2023, 12, 2965. https://doi.org/10.3390/plants12162965
Tian S, Liu B, Shen Y, Cao S, Lai Y, Lu G, Wang Z, Wang A. Unraveling the Molecular Mechanisms of Tomatoes’ Defense against Botrytis cinerea: Insights from Transcriptome Analysis of Micro-Tom and Regular Tomato Varieties. Plants. 2023; 12(16):2965. https://doi.org/10.3390/plants12162965
Chicago/Turabian StyleTian, Shifu, Bojing Liu, Yanan Shen, Shasha Cao, Yinyan Lai, Guodong Lu, Zonghua Wang, and Airong Wang. 2023. "Unraveling the Molecular Mechanisms of Tomatoes’ Defense against Botrytis cinerea: Insights from Transcriptome Analysis of Micro-Tom and Regular Tomato Varieties" Plants 12, no. 16: 2965. https://doi.org/10.3390/plants12162965