Article

Metabolomic and Transcriptomic Analysis Reveal the Role of Metabolites and Genes in Modulating Flower Color of Paphiopedilum micranthum

1
School of Life Sciences, Guizhou Normal University, Guiyang 550025, China
2
Eastern China Conservation Centre for Wild Endangered Plant Resources, Shanghai Chenshan Botanical Garden, Shanghai 201602, China
3
College of Forestry, Hainan University, Haikou 570228, China
4
State Key Laboratory of Systematic and Evolutionary Botany, Institute of Botany, Chinese Academy of Sciences, Beijing 100000, China
5
China National Botanical Garden, Beijing 100000, China
*
Authors to whom correspondence should be addressed.
Plants 2023, 12(10), 2058; https://doi.org/10.3390/plants12102058
Submission received: 18 April 2023 / Revised: 16 May 2023 / Accepted: 19 May 2023 / Published: 22 May 2023
(This article belongs to the Special Issue Floral Biology 2.0)

Abstract

:
Food-deceptive flowers primarily use visual signals (such as color) to mimic model plants and deceive insects into achieving pollination. Paphiopedilum micranthum is a food-deceptive orchid that has a pink labellum and two purple petals with a yellow base and has been proven to be pollinated by bumblebees. However, the chemical and molecular bases of the floral color are not well understood. We conducted targeted metabolite profiling and transcriptomic analysis to determine the color signal and its genetic basis in P. micranthum. We found that both anthocyanins and carotenoids contribute significantly to the formation of floral color that determines the color signal. Higher concentrations of anthocyanins (cyanidin and peonidin) and carotenoids (primarily lutein and zeaxanthin) were detected in the petal compared to the labellum. The upregulation of structural genes of CHS, F3H, DFR and ANS on the anthocyanin biosynthesis pathway in petals was identified, as well as three genes of LCYE, BCH, and CCD4 on the carotenoid biosynthesis pathway. Furthermore, we discovered that three R2R3-MYBs and one bHLH transcription factors were co-expressed with the expression of different genes. These genes and transcription factors may be responsible for the spatial color difference of P. micranthum. Our study emphasizes that the color of this food-deceptive orchids is achieved through specific genes and transcription factors associated with the pigment biosynthesis pathway.

1. Introduction

Flowering plants often rely on multi-sensory advertisements such as color, odor, and shape to attract pollinators and ensure successful reproduction. In turn, pollinators rely on these advertisements to locate flowers that offer rewards such as pollen, nectar, or oil [1]. However, some flowers are deceptive by mimicking the appearance of rewarding flowers without actually providing any rewards. Such flowers are considered as food deception [2].
The visual signals provided by deceptive flowers play a critical role in food deception [2,3,4,5]. The similarity in visual signals between rewarding flowers and deceptive species is a decisive factor in the pollination success of food deception [2,3,4,5]. Numerous studies have shown that olfactory signals can work together with visual signals to increase pollinator discrimination [5,6,7,8,9]. Conversely, several food-deceptive species that resemble the visual signals of model species produce scents that differ greatly to prevent inhibitory learning [10,11]. Therefore, the visual signal is the primary determinant of pollination success in food deception, while the role of olfactory signals varies among species [5,6,12].
Floral color is the most powerful visual signal in food deception [5,13,14,15]. The color signal, perceived by pollinators, is strongly determined by the type, concentration, and location of the pigment [16]. There are three major types of pigments—betalains, anthocyanins, and carotenoids—with betalains being restricted to the order of the Caryophyllales [17]. The other two pigments are widely found in angiosperms for the attractive natural display of flower colors and lay the groundwork for mimicking the color of rewarding species [18].
Anthocyanins and carotenoids can coexist within a single cell or in different regions of a flower [1,17]. Two biosynthesis pathways of pigments are conserved in angiosperms, with both genes in related biosynthesis pathways and transcription factors that regulate gene expression contributing to the concentration and location of pigments [19,20,21]. The accumulation of anthocyanins in vacuoles is strongly influenced by the expression level of any genes involved in the anthocyanin biosynthesis pathway (ABP) [20,22]. The transcription factor R2R3-MYBs forms a complex with bHLH and WD40 and plays a crucial role in regulating gene expression in the ABP [23]. Carotenoids are primarily localized in the plastids of many flowers, with lutein and beta-carotene being the most commonly discovered pigments [24]. R2R3-MYBs have also been reported to play a role in regulating the expression of genes involved in the carotenoid biosynthesis pathway (CBP) [25,26,27].
Food deception strategy is frequently found in Orchidaceae [2,28]. About one-third of orchids employ food deception, indicating the efficacy of deceptive pollination strategy in orchids [29,30,31]. The visual signal is also the major factor in the pollination success of food deception orchids [5,6,12]. The pollination accomplishment of food deceptive orchids, Anacamptis (Orchis) morio, is influenced by the proximity to rewarding plants and the similarity of flower color to that of magnet plants, while also emitting a highly variable scent to avoid pollinator learning and selective behavior [10,11]. Diuris brumalis is a food-deceptive orchid that attracts pollinators using visual signals similar to Daviesia decurrens at close range and ultraviolet visual signals at long range [32,33].
Paphiopedilum micranthum (Cypripedioideae, Orchidaceae) is fascinating owing to its bright and striking floral displays, with bumblebees as their primary pollinators. Ma et al. demonstrated that the pollination success of P. micranthum is facilitated by the color resemblance of their flowers to the model plant Rosa roxburghii [4]. However, the metabolic and molecular bases underlying flower color in this species are poorly understood. In this study, we conducted targeted metabolic profiling and transcriptome analysis intended to reveal the formation and genetic basis of floral color in P. micranthum.

2. Results

2.1. Morphology and Phenotypic Modifications of P. micranthum during Floral Development

The mature flowers of P. micranthum have two notable structures with distinct colors, a pink labellum and two purple petals with a yellow base (Figure 1). For the petals in stage 1 (i.e., bud length 2–2.5 cm, hereafter S1), dark purple and yellow coloration have already formed which turn into purple and bright yellow in stage 2 (i.e., full-bloom stage, hereafter S2). Meanwhile, the labellum changes from a pale pink to pink from S1 to S2.

2.2. Identification and Quantification of Pigment Components

To identify the primary pigments contributing to the coloration of petal and labellum in S2, pigment separation experiments were conducted (Figure 2a). Petals contain both anthocyanin and carotenoid responsible for the purple and yellow color, respectively. Anthocyanin was the primary pigment responsible for the pink coloration of the labellum with little carotenoid.
The targeted assay showed a considerable increase in total anthocyanidin of the petal compared to the labellum (Figure 2b). There were six types of anthocyanidin both in the petal and labellum, with significant amounts of cyanidin and peonidin (Figure 2d). The content of cyanidin was the highest both in the petal and labellum, followed by peonidin and pelargonidin. These findings revealed that a higher anthocyanin concentration in the petal contributed to dark purple coloration whereas a lower anthocyanin concentration contributed to pink coloration.
According to the targeted assay, the total carotenoid content in the petal significantly increased compared to the labellum (Figure 2c). The concentrations of lutein and zeaxanthin were the major compounds in the petal that contributed to the yellow coloration of the petal (Figure 2e).
Our findings suggested that the different coloration of P. micranthum was a result of the main accumulation of cyanidin via the ABP, as well as lutein and zeaxanthin produced by the CBP. To investigate the genetic changes in floral coloration, we collected petals and labellums in S1 and S2 for transcriptomics analysis.

2.3. Differentially Expressed Genes Related to the Pigment Biosynthesis

Pairwise sample comparisons of transcriptomes from various floral parts in two developmental stages were conducted to identify differentially expressed genes (DEGs). We identified 2928, 2614, 7277, and 8597 DEGs in S1-L vs. S1-P, S2-L vs. S2-P, S1-P vs. S2-P, S1-L vs. S2-L groups, respectively (Figure 3a), while 422 DEGs were common in all comparisons (Figure 3b).
By using the Kyoto Encyclopedia of Genes and Genomes (KEGG) enrichment analysis, the 422 DEGs were grouped into 11 differential metabolic pathways and 1 organismal system. Photosynthesis-antenna proteins, photosynthesis, flavonoid, and carotenoid biosynthesis were the most distinct metabolic pathways (Figure 4a). The known results well supported the alternation of flavonoid biosynthesis, and carotenoid biosynthesis was the underlying factor leading to differential pigment accumulations between the petal and labellum during the floral development of P. micranthum. To acquire the functions of DEGs, the top 20 terms were shown through the Gene Ontology (GO) enrichment analysis, including 6 molecular function terms, 11 cellular component terms, and 3 biological process terms (Figure 4b). Most terms were related to photosynthesis.

2.4. DEGs Involved in the ABP and CBP

The expression heatmap of DEGs involved in anthocyanin pathways can be found in Figure 5. In S1, the expressions of CHS, F3H, DFR, and ANS were up-regulated in the petal compared to the labellum, consistent with the color difference in the petals (purple) and labellum (pale pink). In S2, CHS and F3H were further up-regulated in the petal compared to those in the labellum, consistent with darker coloration and higher anthocyanins in the petal than those in the labellum.
In the metabolic analyses, lutein, zeaxanthin, violaxanthin, and neoxanthin were the main pigments that contributed to the yellow coloration of the petal, but β-carotene was not detected in the petal or labellum (Figure 2e). Correspondingly, the expression of CCD4 and BCH, which causes β-carotene to be cleaved and zeaxanthin to be synthesized, respectively, was upregulated in the petal in S2 (Figure 6). In addition, the expressions of the DEGs of LCYE, CCD4, and BCH were upregulated in the petal both in S1 and S2, and were consistent with high carotenoid concentrations in the petal, resulting in a yellow color base.

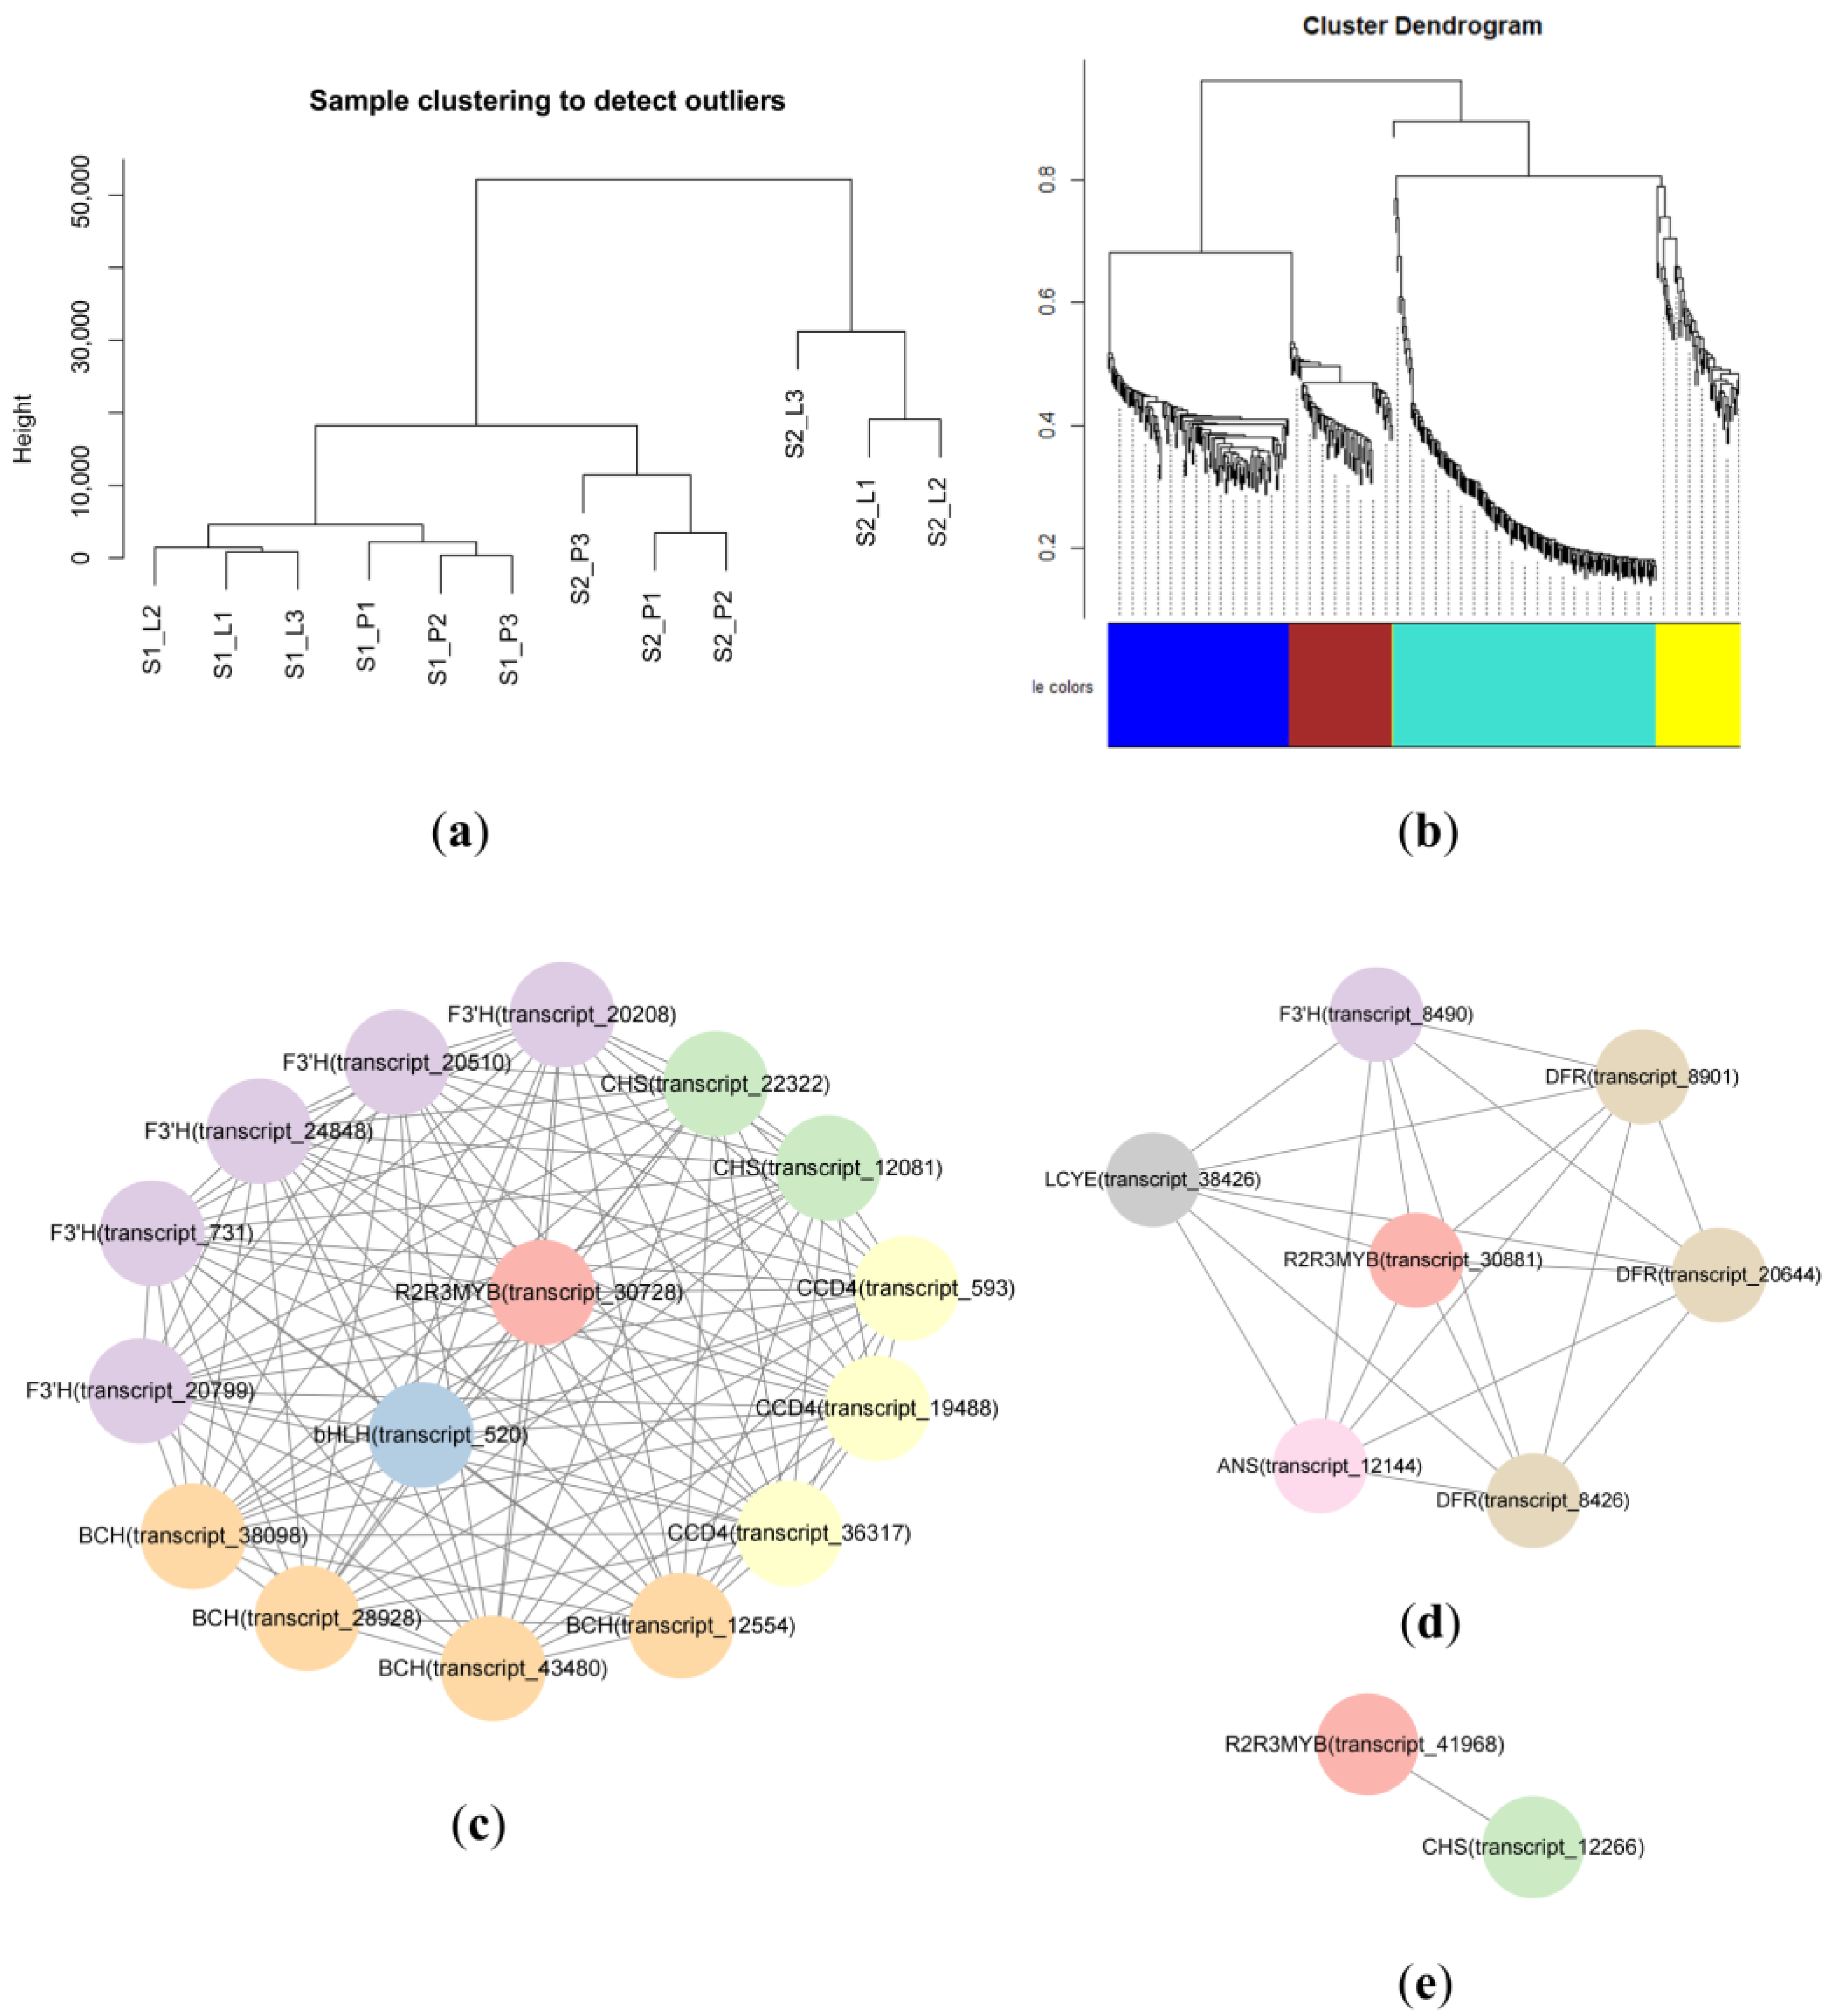
2.5. Weighted Gene Coexpression Network Analysis (WGCNA)

The sample clustering analysis showed that all the samples were well clustered and no outliers were found (Figure 7a). A WGCNA of 422 DEGs showed contrasting modules regarding color regulation. The different expressions of structural genes and transcription factors related to ABP and CBP were discovered in the blue, turquoise, and yellow modules, but none were found in the brown module (Figure 7b). In the blue module, R2R3-MYB (transcript_30728) and bHLH (transcript_520) were co-expressed with these genes (CHS, F3H, BCH, CCD4) (Figure 7c). In the turquoise module, R2R3-MYB (transcript_30881) presented a co-expression relationship with structural genes (F3H, DFR, ANS, LCYE) (Figure 7d). R2R3-MYB (transcript_41968) was also co-expressed with CHS in the yellow module (Figure 7e). Three R2R3-MYBs (transcript_30728, transcript_30881, and transcript_41968) and one bHLH (transcript_520) might promote the expression of ABP and CBP structural genes.

3. Discussion

3.1. Different Concentration of Accumulated Pigments Instigate Phenotypic Modifications in P. micranthum

Purple hue in orchids is caused by anthocyanin, and the most frequent anthocyanin in them is cyanidin [34,35]. Anthocyanins contributed to the pink-to-purple color of the petal and labellum in P. micranthum, especially cyanidin. Additionally, the color hue is related to the pigment concentration; the change in the color of Chrysanthemum morifolium is correlated with the cyanidin concentration, with the more cyanidins being present, the darker is the color of the flower [36]. The various concentration of cyanidins might contribute to the dark purple coloration in the petal and the pink coloration in the labellum.
Distinct carotenoid species produce diversity in floral color, indicating that a lack of carotenoids causes white flowers, an accumulation of lutein and zeaxanthin causes yellow flowers, and the presence of β-carotene causes orange-red flowers [37,38]. The higher levels of lutein and zeaxanthin than those in the labellum, with little β-carotene in the petal and labellum, were consistent with the yellow coloration of the petal of P. micranthum.

3.2. Different Accumulation of Pigments Related to the Expression of the Structural Genes

By utilizing KEGG and GO enrichment analysis, DEGs were found to be significantly connected to photosynthesis. This difference could be attributed to the presence of chloroplasts in the floral tissues, which act as an energy source similar to those found in Phalaenopsis orchids [39]. However, most of all, the enrichment analysis found that DEGs were related to flavonoid and carotenoid biosynthesis pathways, suggesting that the differential expression of these genes may underlie the pigment accumulation between the petal and labellum during floral development.
The expression levels of structural genes in pigment biosynthesis pathways can have a direct impact on the amount of pigment accumulation, ultimately determining the color of the flower [20,25]. The results of the morphological and anatomical analysis indicate that the changes in the petal and labellum are different from each other (Figure 2). The petals initially exhibited a dark purple hue in S1 and gradually lightened in color as they matured. In S1, the expression of late biosynthetic genes, DFR and ANS, was strongly activated, whereas their activity was comparatively lower in S2. The difference was that as it developed, the color of the labellum became gradually darker. Furthermore, the different expression of genes CHS and F3H in S1 and S2 might also affect the pigment accumulation.
In addition, the metabolomics analysis revealed a significantly higher accumulation of anthocyanins in the petals compared to that in the labellum. The reason for this difference in anthocyanin accumulation might be attributed to the higher expression levels of CHS, F3H, DFR, and ANS in the petals in S1, and CHS, F3H, and DFR in S2, than those in the labellum.
The expression of LCYE affects the accumulation of lutein, responsible for yellow coloration [24,40]. Based on our transcriptome analysis, LCYE expression levels were higher in the petal than in the labellum both in S1 and S2, indicating its correlation with increased lutein accumulation in the petal.
Furthermore, the upregulation of BCH in the petal compared to the labellum may result in higher concentrations of zeaxanthin, violaxanthin, and neoxanthin. Similar observations have been reported in Dendrobium chrysotoxum and Ipomoea nil [41,42]. Another upregulated gene in the petal is CCD4, which is accountable for the cleavage of β-carotene [37]. The increased expression of CCD4 and BCH conceivably led to a reduction in the accumulation of β-carotene, thus preventing the petal from appearing with an orange-red hue. In Eustoma grandiflorum, the CCD4 gene is highly expressed in both yellow and white petals. However, the PSY and LCYB genes are expressed at higher levels in yellow petals [43]. Therefore, we suggest that maintaining a balance between carotenoid production and degradation activities regulates the overall level of carotenoid accumulation in P. micranthum.

3.3. R2R3-MYBs and bHLH Regulate the Structural Genes of ABP and CBP

R2R3-MYB control pigment concentration and localization by regulating pigment biosynthesis genes [20,44]. In tree peony, R2R3-MYB interacts with bHLH and a WD40 protein activates CHS expression, which causes purple spots to appear on white petals [45]. Moreover, the R2R3-MYB transcription factor, RCP1, regulates carotenoid synthesis in flowers [27]. In P. micranthum, we observed differential expression of three R2R3-MYBs and one bHLH transcription factors between the petal and labellum, and these transcriptome factors exhibited co-expression with structural genes involved in ABP and CBP, possibly responsible for the color pattern.

4. Materials and Methods

4.1. Plant Materials and Sampling

All flowers of P. micranthum used in this study were offered by Qianxinan Green Animal and Plant Science and Technology Development Company (Guizhou, China). We collected petals and labellums of P. micranthum in S1 and S2 (Figure 1) for metabolomics and transcriptome sequencing. We also collected flowers at different stages (i.e., bud length <1.5 cm, 1.5–2 cm, 2–2.5 cm, 2.5–3 cm, 3–3.5 cm, 3.5–4 cm, 4–4.5 cm, and full-bloom stage) for subsequent PacBio Iso-Seq. All samples were collected and immediately frozen in liquid nitrogen, and then stored at −80 °C.

4.2. Pigment Separation

To find out the main categories of floral pigments, 50 mg of the petal or labellum was ground into a powder in liquid nitrogen, dissolved into 200 µL methanol, and then mixed with 200 µL water and 200 µL dichloromethane [46]. Lastly, anthocyanins and carotenoids were separated, respectively, in the upper and lower layers after 5 min of centrifugation at 13,000 rpm.

4.3. Targeted Metabolome Profiling and Analysis

Anthocyanin contents were analyzed using MetWare (http://www.metware.cn/ (accessed on 21 May 2023)) based on the AB Sciex QTRAP 6500 LC-MS/MS platform. Three biological replicates were assessed. The freeze-dried samples were crushed to powder for 1.5 min at 30 Hz. A total of 0.5 mL of methanol/water/hydrochloric acid (500:500:1, v/v/v) was used to extract 50 mg of powder. The extraction was vortexed for 5 min, ultrasound for 5 min, and centrifuged at 12,000× g under 4 °C for 3 min. After filtration, the supernatants were used for the examination by using the UPLC-ESI-MS/MS system (UPLC, ExionLC™ AD, https://sciex.com.cn/ (accessed on 21 May 2023); MS, Applied Biosystems 6500 Triple Quadrupole, https://sciex.com.cn/(accessed on 21 May 2023)).
Carotenoid contents were detected using MetWare (http://www.metware.cn/ (accessed on 21 May 2023)) based on the AB Sciex QTRAP 6500 LC-MS/MS platform. Three biological replicates were assessed. The freeze-dried sample of carotenoid extraction was ground to powder for 1.5 min at 30 Hz. A total of 50 mg powder was extracted with 0.5 mL mixed solution of n-hexane: acetone: ethanol (1:1:1, v/v/v). After 20 min vortexing, the extract was centrifuged at 12,000 r/min for 5 min at 4 °C, and then the supernatants were collected. The supernatants were evaporated till they were dry and then, they were reconstituted in a mixed solution of MeOH/methyl tert-butyl ether (1:1, v/v). After filtration, the solution was used for further LC-MS/MS analysis.
For statistical analysis, the Student’s t-tests were performed using R to evaluate the differences in anthocyanin and carotenoid in the S2-P and S2-L, following the confirmation of normality using a Shapiro-Wilk test.

4.4. RNA Extraction, Library Preparation, Sequencing, and Annotation

Total RNA was extracted using TRIzol® Reagent and DNA was removed using DNase I (TaKara, Beijing, China). We used 1% agarose gel electrophoresis to assess RNA degradation and contamination. The integrity and purity of the RNA samples were determined with the 2100 Bioanalyser (Agilent Technologies, Wilmington, DE, USA) and ND-2000 (NanoDrop Technologies, Wilmington, DE, USA), respectively.
PacBio Iso-Seq and Illumina sequencing were performed at the Shanghai Majorbio Bio-Pharm Technology Co (Shanghai, China). To obtain the reference transcripts, the total RNA of flowers at different stages was extracted, and the RNA of each sample was equally mixed. The mixed RNA reversed transcription to the full-length 1st strand cDNA using Clontech SMARTer PCR cDNA synthesis kit. After PCR amplification, DNA damage repair, terminal repair, adapter connection, and purification, products were sequenced on the PacBio Sequel platform. The circular consensus sequence (CCS) reads were extracted following the filtering of raw data. Then, to categorize the CCS and identify the full-length (FLNC) and non-full-length (nFL) nonchimeric sequences, we determined if the CCS comprised the 5′-primer, 3′-primer, and poly-A sequences. The FLNC was through clustered, corrected, and polished. Reference transcripts were created using the polished consensus sequence. The reference transcripts were annotated against the nonredundant protein (Nr) database (http://www.ncbi.nlm.nih.gov (accessed on 21 May 2023)), KEGG database (http://www.genome.jp/kegg (accessed on 21 May 2023)), and GO database (http://www.geneontology.org (accessed on 21 May 2023)).
The Illumina library was prepared following TruSeq TM RNA sample preparation Kit from Illumina (San Diego, CA, USA) using 1 μg of total RNA to obtain messenger RNA. Secondly, double-stranded cDNA was synthesized using a SuperScript double-stranded cDNA synthesis kit (Invitrogen, San Diego, CA, USA) with random hexamer primers (Illumina). After selection and amplification, the paired-end RNA-seq sequencing library was sequenced with the Illumina NovaSeq 6000 sequencer. The raw paired-end reads were trimmed and quality controlled using fastp (https://github.com/OpenGene/fastp (accessed on 21 May 2023)) with default parameters to obtain clean data.

4.5. DEGs, Functional Enrichment Analysis, and WGCNA

The clean data were mapped to the reference transcripts and the gene expression levels were estimated via the transcripts per kilobase of exon model per million mapped reads (TPM) method using StringTie v1.3.4 (https://ccb.jhu.edu/software/stringtie/index.shtml?t=example (accessed on 21 May 2023)).
The differential expression analysis was based on the TPM value, which represents the mean of three biological replicates. DEGs were identified using the DESeq2 software based on |log2(foldchange)| ≥ 1 and p-value ≤ 0.05. A total of 422 DEGs were identified, and then, we performed KEGG and GO enrichment analysis. Significantly enriched terms were selected at q value ≤ 0.05. The structural genes of anthocyanin synthesis pathway and carotenoid synthesis pathway were screened from 422 genes, and the heatmap was illustrated using R v4.1.2.
To analyze the gene co-expression network, 422 DEGs were analyzed via the WGCNA v4.1.3 by using R. The TPM values were imported into the WGCNA package to establish co-expression modules and the power was 4. R2R3-MYB and transcription factors, which may be related to anthocyanin and carotenoids, are screened from each module [42]. The networks were visualized using Cytoscape v3.9.1.

5. Conclusions

The floral color of the food-deceptive orchid P. micranthum varies in the petal and labellum. Our studies show that both anthocyanins and carotenoids contribute to the formation of floral color. Different amounts of pigments are uncovered in two floral parts. Higher concentrations of anthocyanins (cyanidin and peonidin) and carotenoids (primarily lutein and zeaxanthin) were detected in the petal compared to the labellum. The upregulations of structural genes of CHS, F3H, DFR, and ANS on the anthocyanin biosynthesis pathway in petals as well as three genes of LCYE, BCH, and CCD4 on the carotenoid biosynthesis pathway were identified. Furthermore, three R2R3-MYBs and one bHLH transcription factors were co-expressed with the structural genes. These genes and transcription factors may be responsible for the spatial color difference of P. micranthum. Further studies such as qRT-PCR and transient overexpression can be used to verify the function of these genes. Moreover, a former study demonstrated that the contrast between the inner (such as the staminode and the base of the petal) and the outer (such as the tip of the petal, labellum, and sepal) colors of P. micranthum are important during the foraging of bumblebees [4]. Therefore, more studies on the color of staminode should be performed to further reveal the function and molecular basis of the inner color.

Author Contributions

Conceptualization, W.H., Y.L. and T.P.; methodology, X.D. and C.H.; software, X.D.; validation, X.D., C.X. and A.L.; formal analysis, X.D., C.X. and A.L.; investigation, X.D. and C.H.; resources, X.D. and C.H.; data curation, X.D.; writing—original draft preparation, X.D., C.H.; writing—review and editing, Y.L., T.P. and W.H.; funding acquisition, C.H. and W.H. All authors have read and agreed to the published version of the manuscript.

Funding

This research was funded by Shanghai Landscaping and City Appearance Administrative Bureau grant number G202401, and the Science and Technology Commission, Shanghai Municipality, grant number 19390743600.

Institutional Review Board Statement

Not applicable.

Informed Consent Statement

Not applicable.

Data Availability Statement

The raw data have been deposited in NCBI under BioProject accession number PRJNA918555.

Acknowledgments

The authors are grateful to Qianxinan Green Animal and Plant Science and Technology Development Co., LTD. for cultivating the plants. We thank Baijun Li, Dongmei Jin, Hanwen Xiao, Shaofan Luo for the assistance of data analysis, and we are especially grateful to Honghua Chen for her help in improving our manuscript.

Conflicts of Interest

The authors declare no conflict of interest.

References

  1. Willmer, P. Pollination and Floral Ecology; Princeton University Press: Princeton, NJ, USA, 2011. [Google Scholar]
  2. Jersáková, J.; Johnson, S.D.; Jürgens, A. Food deception by plants: From generalized systems to specialized floral mimicry. In Plant-Environment Interactions; Balu¿ka, F., Ed.; Springer: Berlin/Heidelberg, Germany, 2009; pp. 223–246. [Google Scholar]
  3. Gumbert, A.; Kunze, J. Colour similarity to rewarding model plants affects pollination in a food deceptive orchid, Orchis boryi. Biol. J. Linn. Soc. 2001, 72, 419–433. [Google Scholar] [CrossRef]
  4. Ma, X.; Shi, J.; Bänziger, H.; Sun, Y.; Guo, Y.; Liu, Z.; Luo, Y. The functional significance of complex floral colour pattern in a food-deceptive orchid. Funct. Ecol. 2016, 30, 721–732. [Google Scholar] [CrossRef]
  5. Galizia, C.G.; Kunze, J.; Gumbert, A.; Borg-Karlson, A.K.; Sachse, S.; Markl, C.; Menzel, R. Relationship of visual and olfactory signal parameters in a food-deceptive flower mimicry system. Behav. Ecol. 2005, 16, 159–168. [Google Scholar] [CrossRef]
  6. Kunze, J.; Gumbert, A. The combined effect of color and odor on flower choice behavior of bumble bees in flower mimicry systems. Behav. Ecol. 2001, 12, 447–456. [Google Scholar] [CrossRef]
  7. Luo, H.; Liang, Y.; Xiao, H.; Liu, N.; Chen, Y.; Wang, W.; Tang, J.; Xiong, D.; Yang, B.; Ren, Z. Deceptive pollination of Calanthe by skippers that commonly act as nectar thieves. Entomol. Sci. 2020, 23, 3–9. [Google Scholar] [CrossRef]
  8. Policha, T.; Davis, A.; Barnadas, M.; Dentinger, B.T.; Raguso, R.A.; Roy, B.A. Disentangling visual and olfactory signals in mushroom-mimicking Dracula orchids using realistic three-dimensional printed flowers. New Phytol. 2016, 210, 1058–1071. [Google Scholar] [CrossRef]
  9. Niggebrugge, C.; Leboulle, G.; Menzel, R.; Komischke, B.; de Ibarra, N.H. Fast learning but coarse discrimination of colours in restrained honeybees. J. Exp. 2009, 212, 1344–1350. [Google Scholar] [CrossRef]
  10. Salzmann, C.C.; Nardella, A.M.; Cozzolino, S.; Schiestl, F.P. Variability in floral scent in rewarding and deceptive orchids: The signature of pollinator-imposed selection? Ann. Bot. 2007, 100, 757–765. [Google Scholar] [CrossRef]
  11. Peter, C.I.; Johnson, S.D. Mimics and magnets: The importance of color and ecological facilitation in floral deception. Ecology 2008, 89, 1583–1595. [Google Scholar] [CrossRef]
  12. Jersáková, J.; Jürgens, A.; Šmilauer, P.; Johnson, S.D. The evolution of floral mimicry: Identifying traits that visually attract pollinators. Funct. Ecol. 2012, 26, 1381–1389. [Google Scholar] [CrossRef]
  13. Fenster, C.B.; Armbruster, W.S.; Wilson, P.; Dudash, M.R.; Thomson, J.D. Pollination syndromes and floral specialization. Annu. Rev. Ecol. Evol. Syst. 2004, 35, 375–403. [Google Scholar] [CrossRef]
  14. Fantinato, E.; Del Vecchio, S.; Baltieri, M.; Fabris, B.; Buffa, G. Are food-deceptive orchid species really functionally specialized for pollinators? Ecol. Res. 2017, 32, 951–959. [Google Scholar] [CrossRef]
  15. Phillips, R.D.; Peakall, R.; van der Niet, T.; Johnson, S.D. Niche perspectives on plant–pollinator interactions. Trends Plant Sci. 2020, 25, 779–793. [Google Scholar] [CrossRef] [PubMed]
  16. Van der Kooi, C.J.; Elzenga, J.T.M.; Staal, M.; Stavenga, D.G. How to colour a flower: On the optical principles of flower coloration. Proc. R. Soc. B Biol. Sci. 2016, 283, 20160429. [Google Scholar] [CrossRef]
  17. Grotewold, E. The genetics and biochemistry of floral pigments. Annu. Rev. Plant Biol. 2006, 57, 761–780. [Google Scholar] [CrossRef]
  18. Schlüter, P.M.; Schiestl, F.P. Molecular mechanisms of floral mimicry in orchids. Trends Plant Sci. 2008, 13, 228–235. [Google Scholar] [CrossRef]
  19. Zhang, R.; Lu, Y. Molecular mechanisms and natural selection of flower color variation. Bot. Res. 2016, 5, 186–209. [Google Scholar]
  20. Wessinger, C.A.; Rausher, M.D. Lessons from flower colour evolution on targets of selection. J. Exp. Bot. 2012, 63, 5741–5749. [Google Scholar] [CrossRef]
  21. Sun, T.; Li, L. Toward the “golden” era: The status in uncovering the regulatory control of carotenoid accumulation in plants. Plant Sci. 2019, 290, 110331. [Google Scholar] [CrossRef]
  22. Farzad, M.; Griesbach, R.; Hammond, J.; Weiss, M.R.; Elmendorf, H.G. Differential expression of three key anthocyanin biosynthetic genes in a color-changing flower, Viola cornuta cv. Yesterday, Today and Tomorrow. Plant Sci. 2003, 1651, 1333–1342. [Google Scholar] [CrossRef]
  23. Jaakola, L. New insights into the regulation of anthocyanin biosynthesis in fruits. Trends Plant Sci. 2013, 18, 477–483. [Google Scholar] [CrossRef] [PubMed]
  24. Ohmiya, A. Diversity of carotenoid composition in flower petals. Jpn. Agric. Res. Q. JARQ 2011, 45, 163–171. [Google Scholar] [CrossRef]
  25. Stanley, L.; Yuan, Y.W. Transcriptional regulation of carotenoid biosynthesis in plants: So many regulators, so little consensus. Front. Plant Sci. 2019, 10, 1017. [Google Scholar] [CrossRef] [PubMed]
  26. Meng, Y.; Wang, Z.; Wang, Y.; Wang, C.; Zhu, B.; Liu, H. The MYB activator WHITE PETAL1 associates with MtTT8 and MtWD40-1 to regulate carotenoid-derived flower pigmentation in Medicago truncatula. Plant Cell 2019, 31, 2751–2767. [Google Scholar] [CrossRef] [PubMed]
  27. Sagawa, J.M.; Stanley, L.E.; LaFountain, A.M.; Frank, H.A.; Liu, C.; Yuan, Y.W. An R2R3-MYB transcription factor regulates carotenoid pigmentation in Mimulus lewisii flowers. New Phytol. 2016, 209, 1049–1057. [Google Scholar] [CrossRef]
  28. Renner, S.S. Rewardless flowers in the angiosperms and the role of insect cognition in their evolution. In Plant-Pollinator Interactions: From Specialization to Generalization; Waser, N.M., Ollerton, J., Eds.; University of Chicago Press: Chicago, MA, USA, 2006; pp. 123–144. [Google Scholar]
  29. Jersáková, J.; Johnson, S.D.; Kindlmann, P. Mechanisms and evolution of deceptive pollination in orchids. Biol. Rev. 2006, 81, 219–235. [Google Scholar] [CrossRef]
  30. Cozzolino, S.; Widmer, A. Orchid diversity: An evolutionary consequence of deception? Trends Ecol. Evol. 2005, 20, 487–494. [Google Scholar] [CrossRef]
  31. Shrestha, M.; Dyer, A.G.; Dorin, A.; Ren, Z.X.; Burd, M. Rewardlessness in orchids: How frequent and how rewardless? Plant Biol. 2020, 22, 555–561. [Google Scholar] [CrossRef]
  32. Scaccabarozzi, D.; Cozzolino, S.; Guzzetti, L.; Galimberti, A.; Milne, L.; Dixon, K.W.; Phillips, R.D. Masquerading as pea plants: Behavioural and morphological evidence for mimicry of multiple models in an Australian orchid. Ann. Bot. 2018, 122, 1061–1073. [Google Scholar] [CrossRef]
  33. Scaccabarozzi, D.; Lunau, K.; Guzzetti, L.; Cozzolino, S.; Dyer, A.G.; Tommasi, N.; Gagliano, M. Mimicking orchids lure bees from afar with exaggerated ultraviolet signals. Ecol. Evol. 2023, 13, e9759. [Google Scholar] [CrossRef]
  34. Liang, C.Y.; Rengasamy, K.P.; Huang, L.M.; Hsu, C.C.; Jeng, M.F.; Chen, W.H.; Chen, H.H. Assessment of violet-blue color formation in Phalaenopsis orchids. BMC Plant Biol. 2020, 20, 1–16. [Google Scholar] [CrossRef] [PubMed]
  35. Wong, D.C.; Perkins, J.; Peakall, R. Anthocyanin and Flavonol Glycoside Metabolic Pathways Underpin Floral Color Mimicry and Contrast in a Sexually Deceptive Orchid. Front. Plant Sci. 2022, 13, 860997. [Google Scholar] [CrossRef] [PubMed]
  36. Nozaki, K.; Takamura, T.; Fukai, S. Effects of high temperature on flower colour and anthocyanin content in pink flower genotypes of greenhouse chrysanthemum (Chrysanthemum morifolium Ramat). J. Hortic. Sci. Biotechnol. 2006, 81, 728–734. [Google Scholar] [CrossRef]
  37. Wang, Y.; Zhang, C.; Dong, B.; Fu, J.; Hu, S.; Zhao, H. Carotenoid accumulation and its contribution to flower coloration of Osmanthus fragrans. Front. Plant Sci. 2018, 9, 1499. [Google Scholar] [CrossRef]
  38. Chiou, C.Y.; Pan, H.A.; Chuang, Y.N.; Yeh, K.W. Differential expression of carotenoid-related genes determines diversified carotenoid coloration in floral tissues of Oncidium cultivars. Planta 2010, 232, 937–948. [Google Scholar] [CrossRef]
  39. Hsiao, Y.Y.; Huang, T.H.; Fu, C.H.; Huang, S.C.; Chen, Y.J.; Huang, Y.M.; Chen, H.H. Transcriptomic analysis of floral organs from Phalaenopsis orchid by using oligonucleotide microarray. Gene 2013, 518, 91–100. [Google Scholar] [CrossRef]
  40. Han, Y.; Wang, X.; Chen, W.; Dong, M.; Yuan, W.; Liu, X.; Shang, F. Differential expression of carotenoid-related genes determines diversified carotenoid coloration in flower petal of Osmanthus fragrans. Tree Genet. Genomes 2014, 10, 329–338. [Google Scholar] [CrossRef]
  41. Yamamizo, C.; Kishimoto, S.; Ohmiya, A. Carotenoid composition and carotenogenic gene expression during Ipomoea petal development. J. Exp. Bot. 2010, 61, 709–719. [Google Scholar] [CrossRef]
  42. Li, J.; Wang, Z.H. Integrative Metabolomic and Transcriptome Analysis Reveal the Differential Mechanisms of Spot Color in the Lips of Dendrobium chrysotoxum. J. Plant Biol. 2022, 1–13. [Google Scholar] [CrossRef]
  43. Liu, H.; Kishimoto, S.; Yamamizo, C.; Fukuta, N.; Ohmiya, A. Carotenoid accumulations and carotenogenic gene expressions in the petals of Eustoma grandiflorum. Plant Breed. 2013, 132, 417–422. [Google Scholar] [CrossRef]
  44. Davies, K.M.; Albert, N.W.; Schwinn, K.E. From landing lights to mimicry: The molecular regulation of flower colouration and mechanisms for pigmentation patterning. Funct. Plant Biol. FPB 2012, 39, 619–638. [Google Scholar] [CrossRef] [PubMed]
  45. Gu, Z.; Zhu, J.; Hao, Q.; Yuan, Y.W.; Duan, Y.W.; Men, S.; Wang, L. A novel R2R3-MYB transcription factor contributes to petal blotch formation by regulating organ-specific expression of PsCHS in tree peony (Paeonia suffruticosa). Plant Cell Physiol. 2019, 60, 599–611. [Google Scholar] [CrossRef] [PubMed]
  46. Li, B.J.; Zheng, B.Q.; Wang, J.Y.; Tsai, W.C.; Lu, H.C.; Zou, L.H. New insight into the molecular mechanism of colour differentiation among floral segments in orchids. Commun. Biol. 2020, 3, 1–13. [Google Scholar] [CrossRef] [PubMed]
Figure 1. Phenotypic changes of P. micranthum flowers during floral development. S1, bud length 2–2.5 cm; S2, full-bloom stage.
Plants 12 02058 g001
Figure 2. Targeted metabolome analyses of anthocyanins and carotenoids in the petal and labellum in S2. (a) The primary identification of pigments, (b) Different total anthocyanin content in the petal and labellum, (c) Different total carotenoid content in the petal and labellum, (d) Anthocyanin-targeted metabolome identified differentially accumulating compounds, (e) Carotenoid-targeted metabolome identified compounds that accumulate differently. “*” indicates p < 0.05, and “**” indicates p < 0.01.
Plants 12 02058 g002
Figure 3. Transcriptomic features for P. micranthum. (a) The number of genes that are up- and down-regulated in four comparisons, (b) The Venn diagram illustrates the specific and shared numbers of DEGs present in the labellum and petal tissues. S1-P, the petal of S1, S1-L, the labellum of S1, S2-P, the petal of S2, S2-L, the labellum of S2.
Plants 12 02058 g003
Figure 4. KEGG and GO enrichment analysis of common DEGs. (a) KEGG enrichment analysis. (b) GO enrichment analysis.
Plants 12 02058 g004
Figure 5. Overview of the anthocyanin biosynthesis pathway and the roles of DEGs in the flower of P. micranthum. The data are the mean TPM value of three biological replicates. CHS, chalcone synthase; CHI, chalcone isomerase; F3H, flavone 3-hydroxylase; F3H, flavone 3′-hydroxylase; F35H, flavone 3′5′-hydroxylase; DFR, dihydroflavonol reductase; ANS, anthocyanidin synthase. S1-P, the petal of S1, S1-L, the labellum of S1, S2-P, the petal of S2, S2-L, the labellum of S2. In scale bar, the expression of DEGs is indicated in red (high abundance) and blue (low abundance).
Plants 12 02058 g005
Figure 6. Overview of the carotenoid biosynthesis pathway and the roles of DEGs in the flower of P. micranthum. The data are the mean TPM value of three biological replicates. PSY, Phytoene synthase; PDS, phytoene desaturase; Z-ISO, zeta-carotene isomerase; ZDS, zeta-carotene desaturase; LCYB, lycopene beta-cyclase; LCYE, lycopene epsilon-cyclase; CYP97, cytochrome P450–type hydroxylase; BCH, beta-carotene hydroxylase; ZEP, zeaxanthin epoxidase; VDE, violaxanthin de-epoxidase; NXS, neoxanthin synthase; CCD4, carotenoid cleavage dioxygenase 4. S1-P, the petal of S1, S1-L, the labellum of S1, S2-P, the petal of S2, S2-L, the labellum of S2. In scale bar, the expression of DEGs is indicated in red (high abundance) and blue (low abundance).
Plants 12 02058 g006
Figure 7. Module identification by using WGCNA. (a) Sample clustering analysis. (b) Gene dendrogram obtained by clustering the dissimilarity, based on consensus topological overlap with the corresponding module colors, indicated by the color row, and each colored row represents a color-coded module that contains a group of highly connected genes. (c) The blue module. (d) The turquoise module. (e) The yellow module.
Plants 12 02058 g007
Disclaimer/Publisher’s Note: The statements, opinions and data contained in all publications are solely those of the individual author(s) and contributor(s) and not of MDPI and/or the editor(s). MDPI and/or the editor(s) disclaim responsibility for any injury to people or property resulting from any ideas, methods, instructions or products referred to in the content.

