Article

The Influence of Elevated CO2 on Volatile Emissions, Photosynthetic Characteristics, and Pigment Content in Brassicaceae Plants Species and Varieties

Faculty of Food Engineering, Tourism and Environmental Protection, Institute for Research, Development and Innovation in Technical and Natural Sciences, Aurel Vlaicu University of Arad, Elena Drăgoi St., No. 2, 310330 Arad, Romania
*
Author to whom correspondence should be addressed.
Plants 2022, 11(7), 973; https://doi.org/10.3390/plants11070973
Submission received: 20 February 2022 / Revised: 22 March 2022 / Accepted: 31 March 2022 / Published: 2 April 2022
(This article belongs to the Section Plant Response to Abiotic Stress and Climate Change)

Abstract

:
Climate change will determine a sharp increase in carbon dioxide in the following years. To study the influence of elevated carbon dioxide on plants, we grew 13 different species and varieties from the Brassicaceae family at three carbon dioxide concentrations: 400, 800, and 1200 ppmv. The photosynthetic parameters (assimilation rate and stomatal conductance to water vapor) increase for all species. The emission of monoterpenes increases for plants grown at elevated carbon dioxide while the total polyphenols and flavonoids content decrease. The chlorophyll content is affected only for some species (such as Lipidium sativum), while the β-carotene concentrations in the leaves were not affected by carbon dioxide.

1. Introduction

Carbon dioxide is the main greenhouse gas emitted into the atmosphere due to human activities. Global CO2 concentration has increased more than ever in the last 20 years as the carbon dioxide amount has grown by 43.5 ppmv, increasing 12 percent. The actual concentration of carbon dioxide will exceed 420 ppmv at the end of 2021. The projected CO2 concentrations in 2100, under a range of emissions scenarios developed for The Intergovernmental Panel on Climate Change (IPCC), vary from 500 ppmv to 1200 ppmv [1]. The critical impacts of projected climate change on plants are considered inevitable [2]. The increase in carbon dioxide emission could lead to more climate change, including different episodes of extreme heat, droughts, or flooding that stress terrestrial vegetation [3]. Plants can respond to rising atmospheric CO2 concentrations by increasing the water-use efficiency and photosynthetic rates [4,5,6]. Free-air CO2 enrichment (FACE) experiments, which use plants grown in open-air environments enriched with carbon dioxide, have been shown to increase the yield of food crops, even compared to chamber experiments [7].
Regarding photosynthetic parameters, increasing carbon dioxide determines an increase in photosynthesis for C3 plants [8,9]. On the other hand, different studies have shown elevated carbon dioxide downregulation of photosynthetic capacity [10]. Such limitation has been found for Quercus ilex L. leaves and has probably been due to the low capacity for ribulose-1,5-bisphosphate regeneration [11]. The net photosynthetic rate dropped for Glycine max (L.) plants grown at elevated carbon dioxide levels due to stomatal traits and mesophyll tissue size changes [12].
The emission of volatile organic compounds (VOC) from plants grown at high carbon dioxide is enhanced compared with plants grown at the actual CO2 concentration (see [13] for a review). For example, the isoprene emission increases in Phragmites australis, Platanus × acerfolia, and Populas nigra × maximowiczii NM6 when grown in high carbon dioxide [14]. The abundance and diversity of plant volatile organic compounds emission from Hordeum vulgare L. seedlings, including aromatics, terpenes, and green leaves volatiles, were also changed by elevated CO2 compared with the actual carbon dioxide concentration [15]. In contrast, foliar VOC concentrations are unaffected by the growth conditions (700 ppmv CO2 compared to 400 ppmv CO2) for Artemisia annua plants [16].
It has been found that elevated CO2 increases the foliar contents of polyphenols of tea seedlings but decreases in free amino acids and caffeine [17]. Carbon dioxide fertilization has not affected the total phenols determined in chickpea leaves [18]. Leaf polyphenol concentrations found in two Cerrado native species, Baccharis dracunculifolia and B. platypoda, grown at 400 ppmv and 800 ppmv carbon dioxide, have not been statistically significant [19].
The concentration of chlorophylls in the leaves of plants grown at elevated carbon dioxide decreases despite the total phenols concentration. The rate of decline in the chlorophyll contents of Oryza sativa L. leaves was faster in plants grown under high carbon dioxide, mainly in the later growth period [20]. Exposing tomato leaves to various CO2 treatments revealed a decrease in chlorophyll a and b [21]. In a recent study with terrestrial plants, it has been shown that chlorophyll fluorescence decreases with an increase in carbon dioxide concentration [22]. In contrast, the total chlorophyll increased in chickpea grown at 700 ppmv CO2 compared to the ambient conditions at the flowering stage. Such behavior could be explained by symbiotic nitrogen fixation, which can fulfill its N requirement through plant N uptake, accelerated under elevated atmospheric CO2 [23]. An increase in chlorophyll content with 33% has been found for pak choi (Brassica rapa ssp. chinensis) plants grown at 800 ppmv carbon dioxide compared to the control [24]. It was also found that elevated carbon dioxide could increase the concentrations of photosynthetic pigments (chlorophylls and carotenoids) in different sorghum genotypes [25].
The synthesis of total flavonoids and monomers in the leaves of Robinia pseudoacacia L. seedlings is positively affected by elevated carbon dioxide, especially for older plants [26]. Elevated CO2 concentration can cause higher chlorogenic acid accumulation in Lactuca sativa L. plants [27], while in barley and maize, high CO2 decreases the total flavonoids and anthocyanins [28]. The summarized data on the effects of elevated carbon dioxide regarding different plant characteristics are presented in Table 1.
The plants from the Brassicaceae family have economic and agricultural importance as they represent an important dietary source of glucosinolates, vitamins, polyphenols, and minerals. The data regarding the influence of elevated carbon dioxide on Brassicaceae plants’ characteristics are scarce. An early study showed that two Brassica rapa cultivars grows at 550 ppmv CO2 showed increased crop productivity, even with the high-end soil nitrogen [34]. An increase in chlorophyll content of 33% has been found for pak choi (Brassica rapa ssp. chinensis) plants grown at 800 ppmv carbon dioxide compared to the control [24]. In Brassica rapa plants that grew at 700 ppmv carbon dioxide, the higher phenolic compounds increased the resistance to herbivore stress [35].
To evaluate the impact of two elevated carbon dioxide concentrations on the different plants, we grew plants at 800 and 1200 ppmv, respectively. Those concentrations could be achieved in the ambient atmosphere in the year 2100, according to the IPPC models [1]. To the authors’ best knowledge, this is the first study that determines the plants’ response regarding secondary and primary metabolites for plants grown at a higher than 1000 ppmv carbon dioxide concentration. This study also aims to determine the photosynthesis parameters, pigments, and secondary metabolites of 13 different Brassicaceae species and/or varieties to characterize plant signaling at elevated carbon dioxide.

2. Results

2.1. The Influence of Elevated Carbon Dioxide on Photosynthetic Parameters

The elevated carbon dioxide upregulated the assimilation rates for all Brassicaceae plants. The highest assimilation rates for plants grown at 1200 ppmv were found in Kale cabbage (Brassica oleracea var. sabellica) at a level of 36.66 ± 0.46 µmol m−2 s−1, while the lowest assimilation rate was found for kohlrabi (B. oleracea var. gongylodes) (Figure 1a). Nonetheless, there are significant differences (one-way ANOVA followed by Tukey’s multiple comparisons post hoc test, p < 0.05) between the assimilation rates for all plants species grown at 400, 800, and 1200 ppmv carbon dioxide, despite the differences in the trend. For example, the most negligible differences in assimilation rates for plants grown at 400 ppmv CO2 compared with the one that was grown at 1200 ppmv CO2 was for B. oleracea var. cymose (14.01 ± 0.19 µmol m−2 s−1 and 21.79 ± 0.20 µmol m−2 s−1, respectively), while the greater values were found for Lepidium sativum (6.69 ± 0.21 µmol m−2 s−1 and 28.08 ± 0.18 µmol m−2 s−1, respectively).
The stomatal conductance to water vapor values is not statistically different (one-way ANOVA followed by Tukey’s multiple comparisons post hoc test, p > 0.05) for plants grown at 400 ppmv and 800 ppmv for all Brassica oleracea varieties (Figure 1b). At the same time, there are statistical differences for Brassica napus, Sinapis alba, and Lepidium sativum. In contrast, there are statistical differences (one-way ANOVA followed by Tukey’s multiple comparisons post hoc test, p < 0.05) between the stomatal conductance to water vapor for plants grown at 1200 ppmv CO2 and those grown at 400 and 800 ppmv CO2. The highest stomatal conductance to water vapor was found for red cabbage (116 ± 5 mmol m−2 s−1), which increased at 1200 ppmv carbon dioxide, while the smallest was registered for cress (30 ± 3 mmol m−2 s−1).

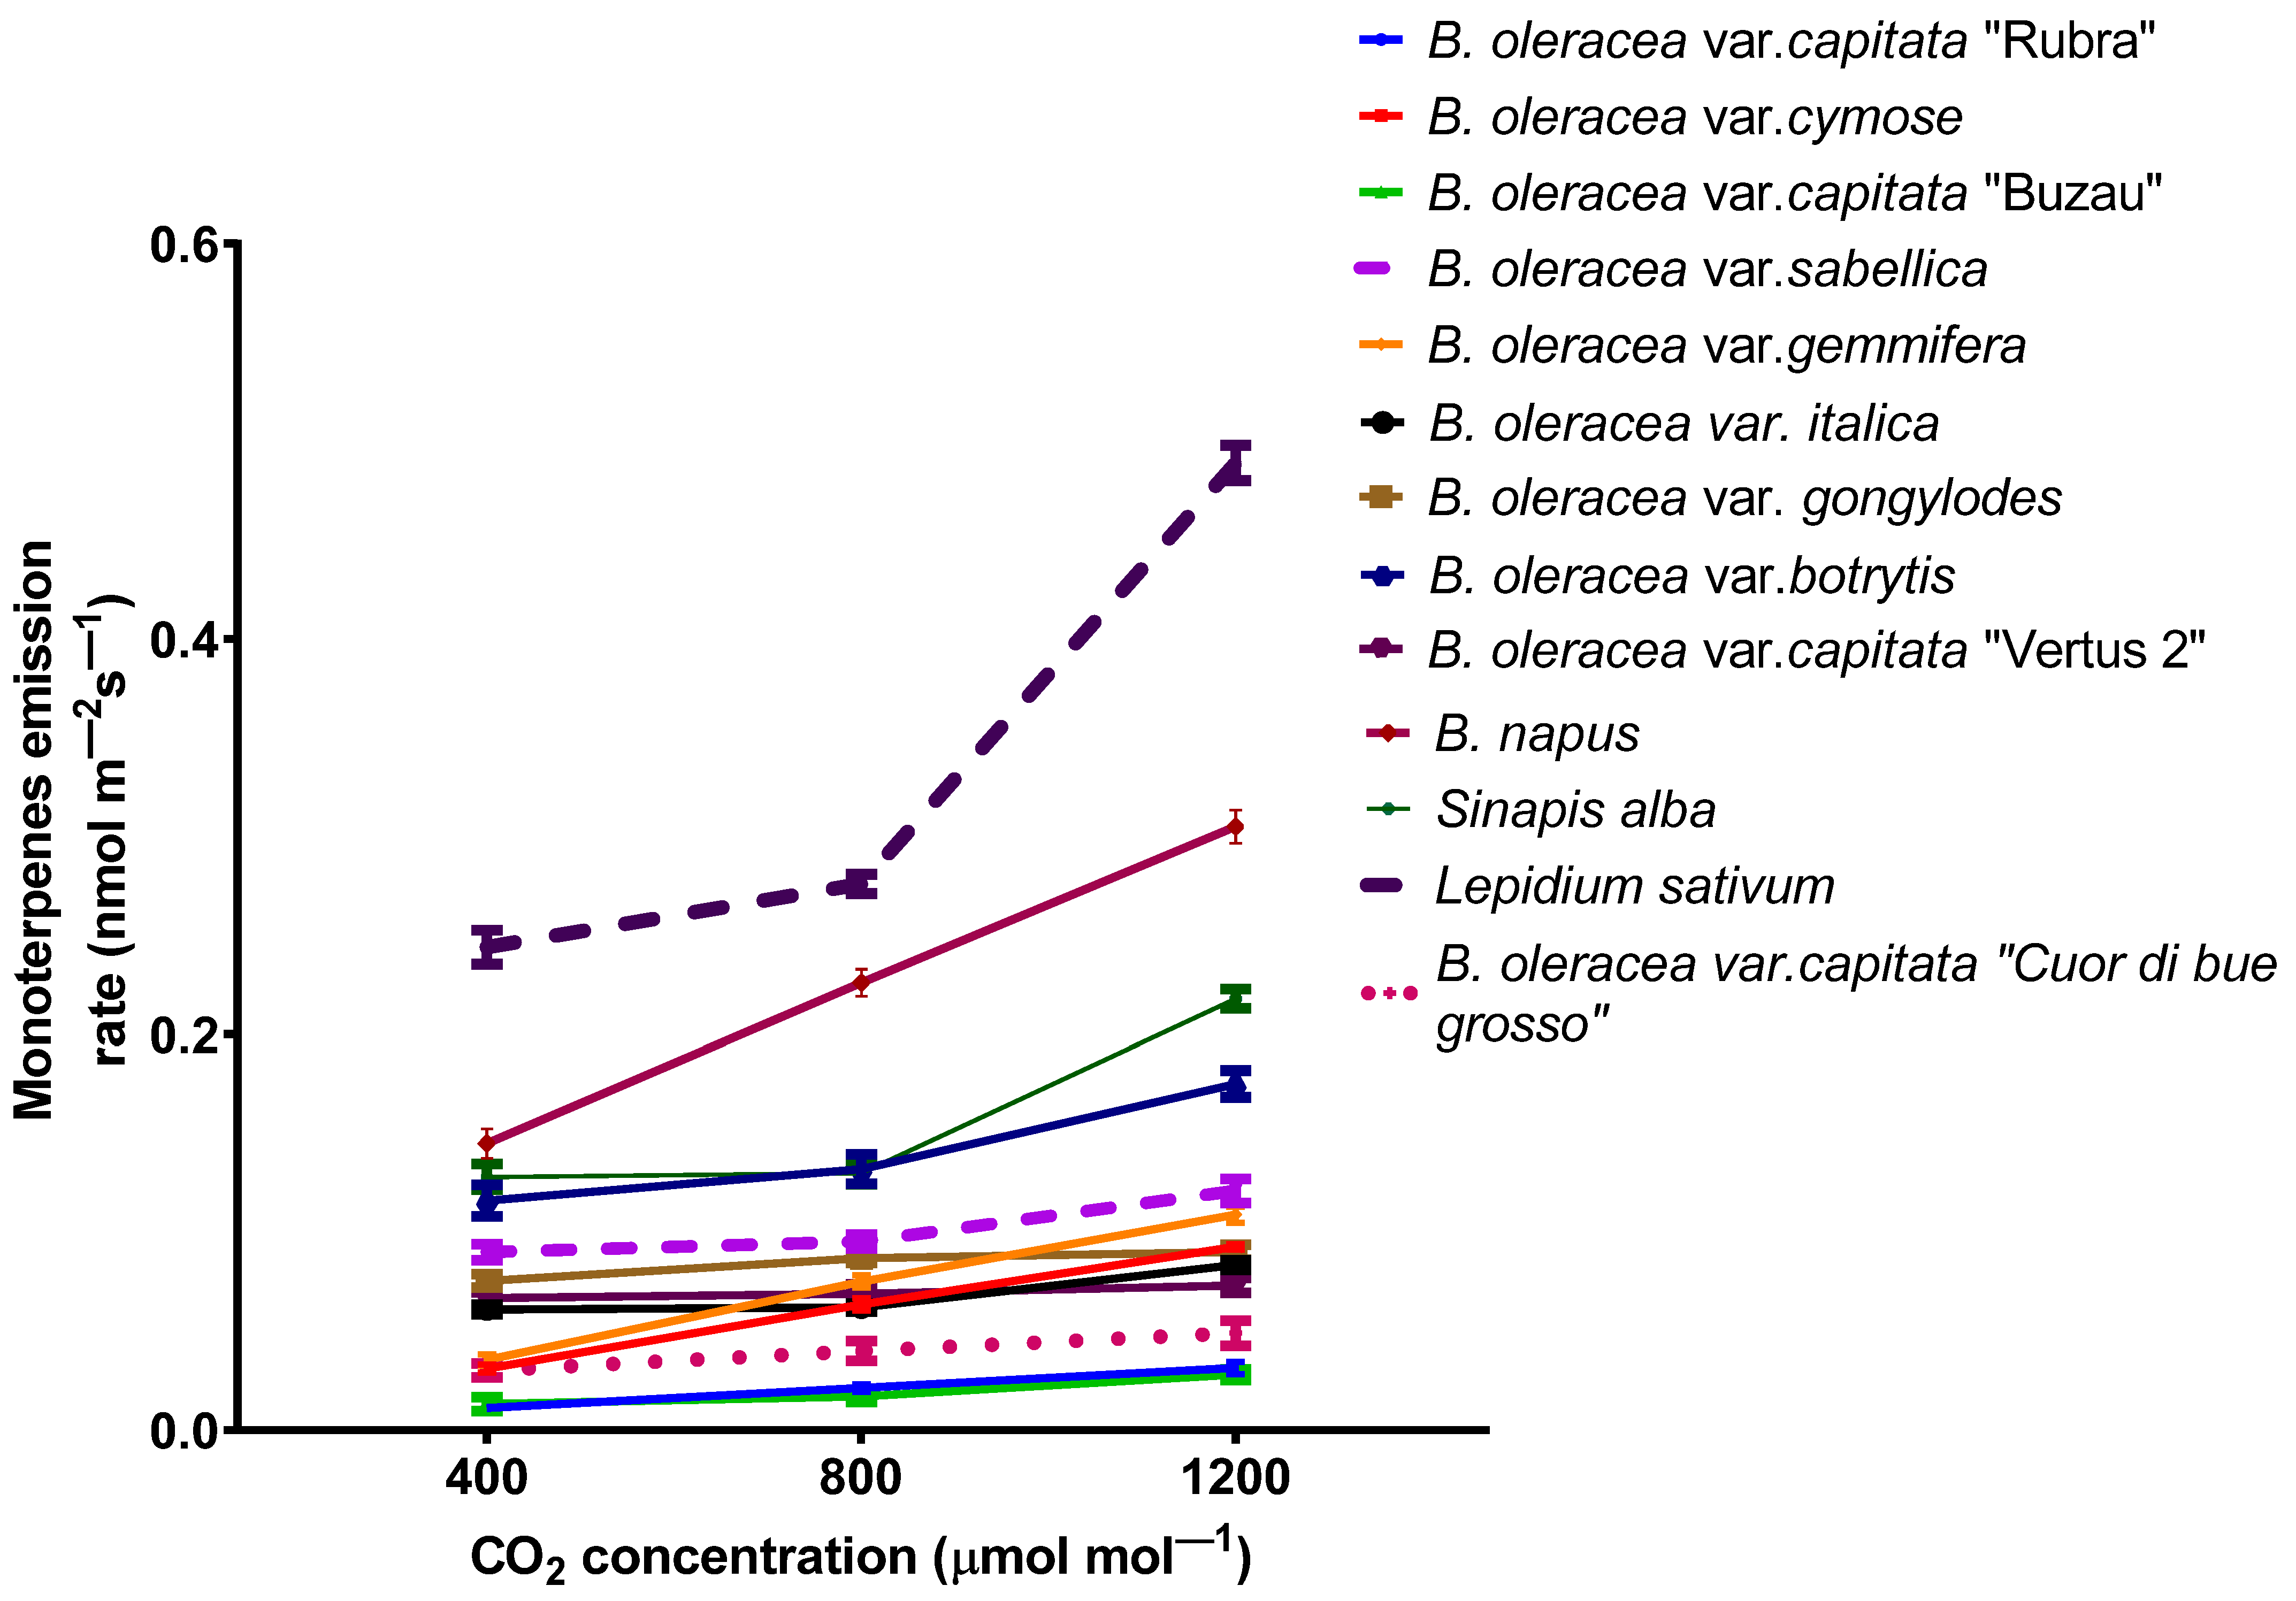
2.2. The Emission of Volatile Organic Compounds from Plants under Elevated Carbon Dioxide

Among the volatiles, six monoterpenes (camphene, β-pinene, 3-carene, D-limonene, para-cymene, and γ-terpinene) were found in the emission of all 13 Brassicaceae plants. The total emission from all different species are pretty low but is increasing for plants grown at a high carbon dioxide concentration (Figure 2). The emission of terpenes was most abundant in cress, rapes, and white mustard, whereas the lowest levels were found in red and white cabbages.
There is only one plant variety (B. oleracea var. capitata “Vertus 2”) with no significant emission differences between all three growing conditions (one-way ANOVA followed by Tukey’s multiple comparisons post hoc test, p > 1). In contrast, in all other 12 Brassicacea varieties, there is an increase in monoterpene emission, at least for plants that grow at 1200 ppmv carbon dioxide. On the other hand, for kale, broccoli, and cabbage (“Cuor di bue grosso”) the emission is not statistically different between plants that grow at 400 ppmv carbon dioxide and plants that grow at 800 ppmv carbon dioxide (one way ANOVA followed by Tukey’s multiple comparisons post hoc test, p < 0.05).

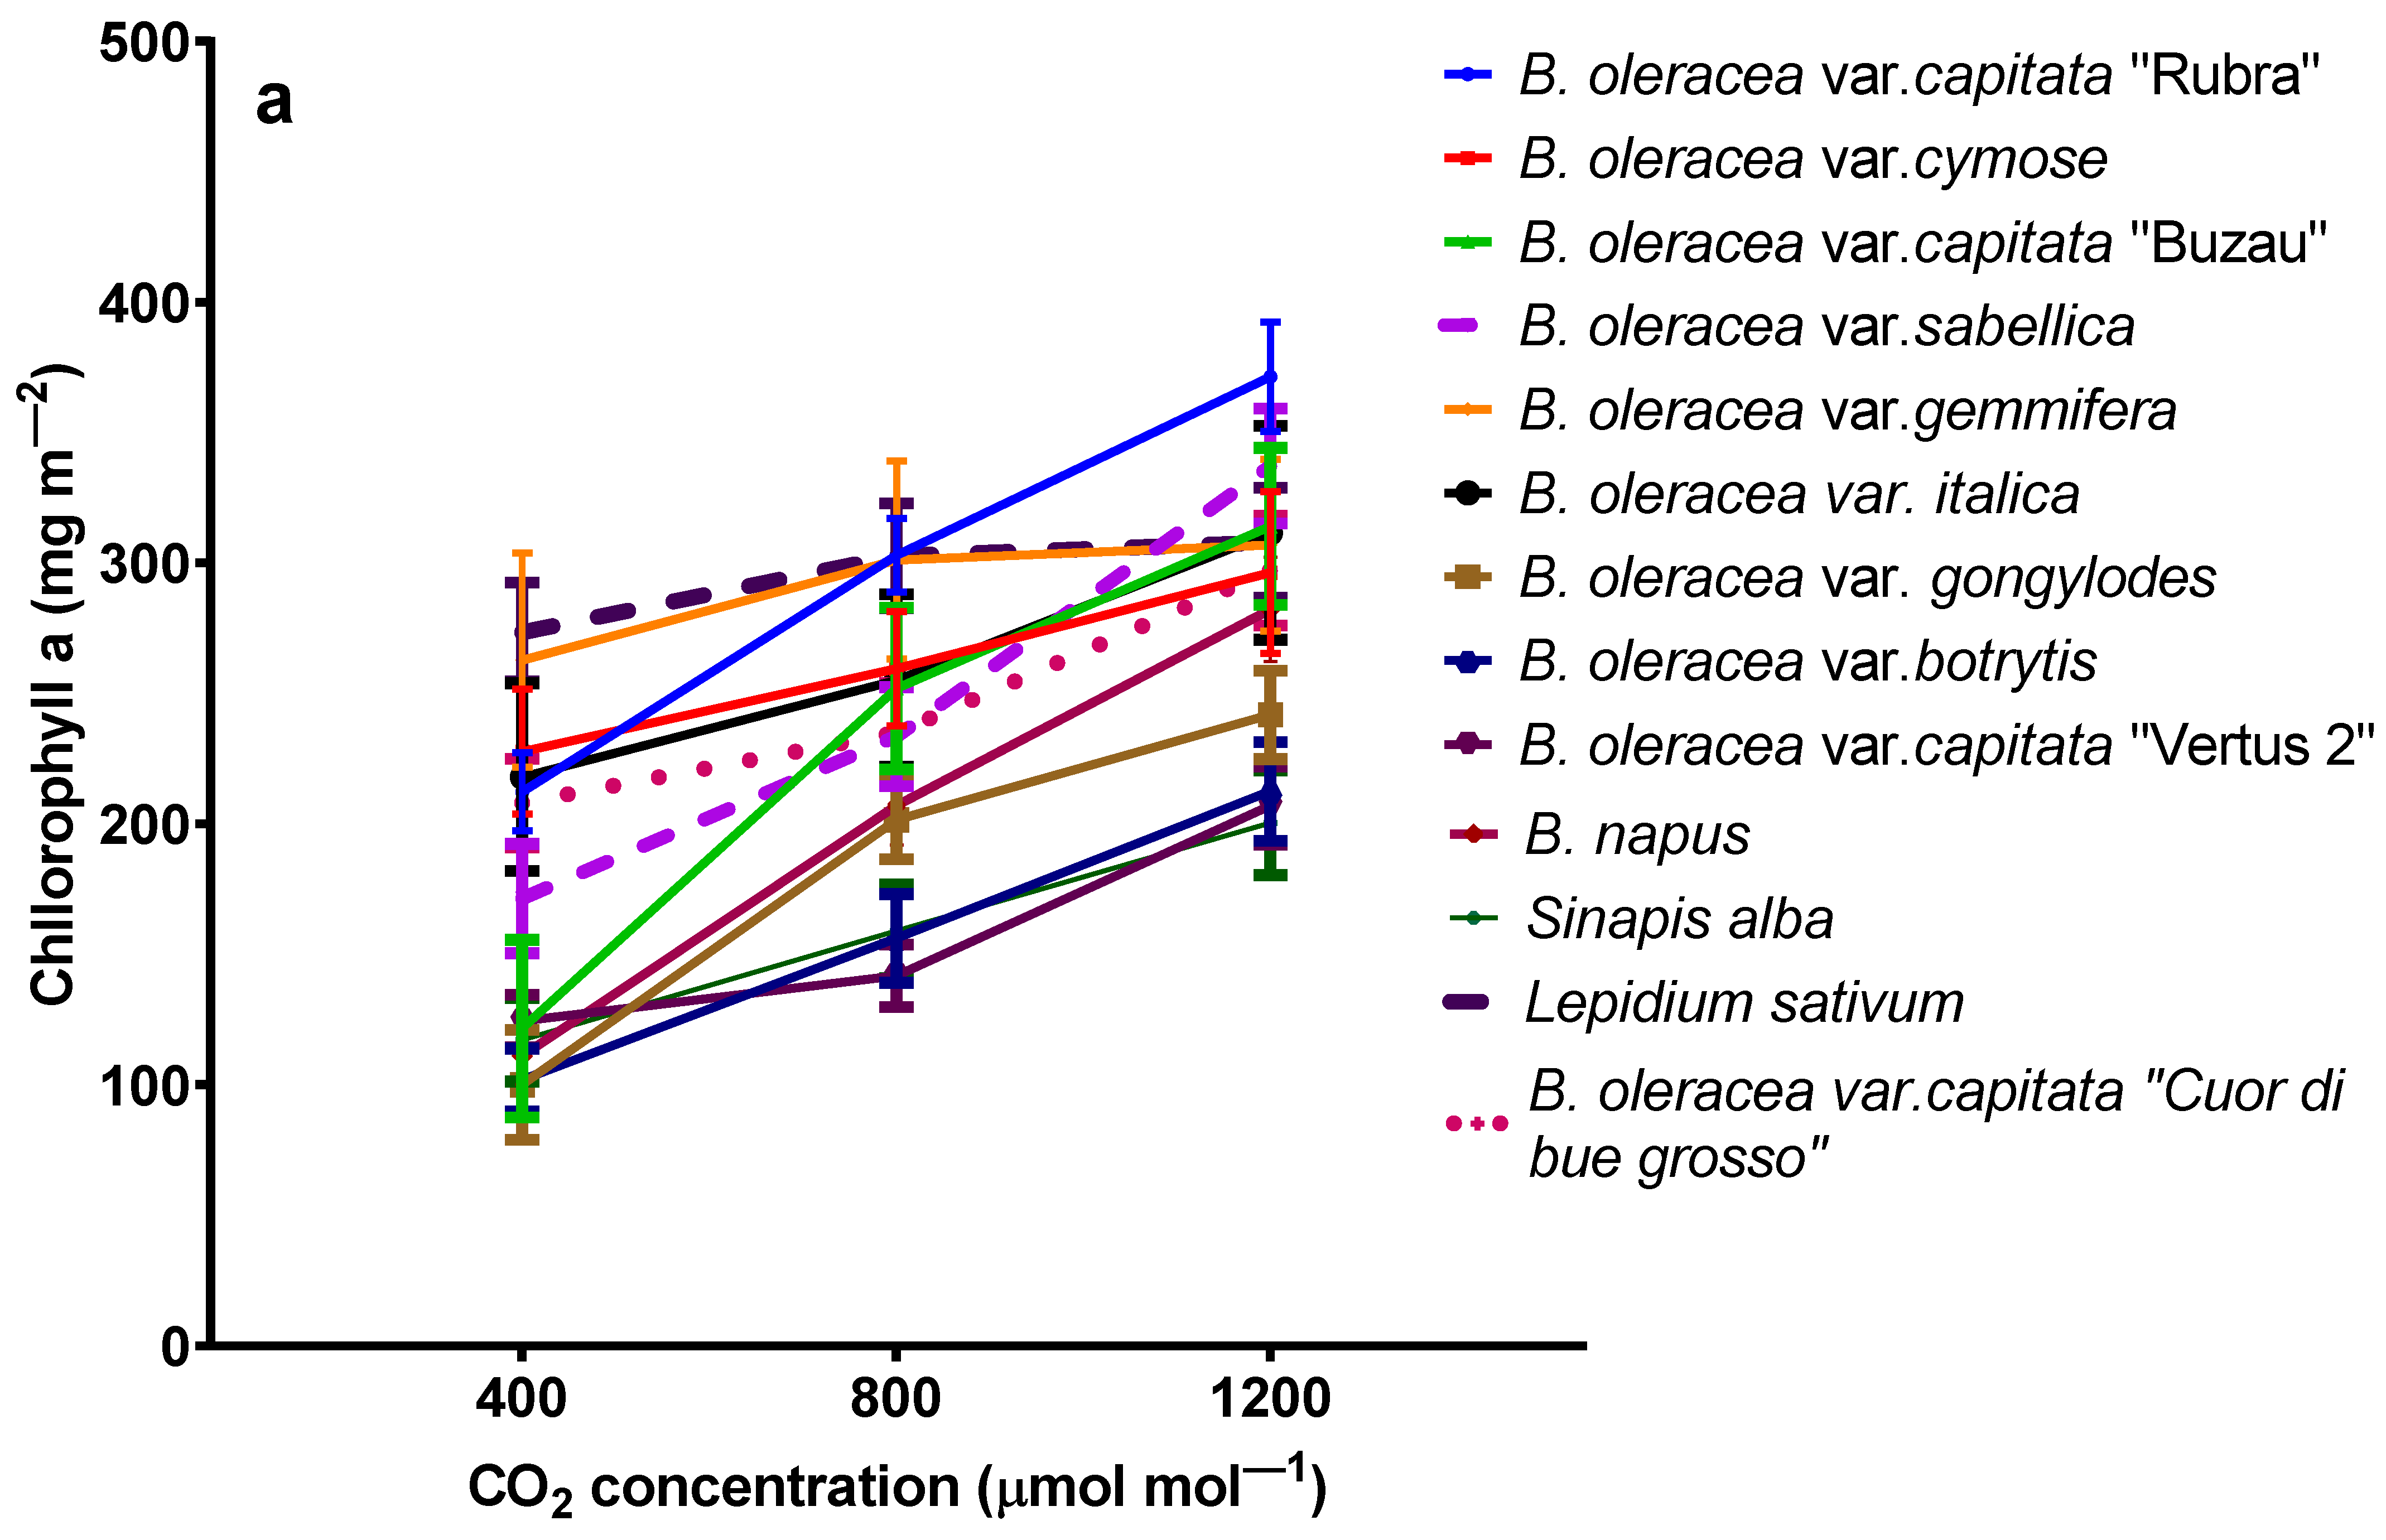
2.3. The Influence of Elevated Carbon Dioxide on Chlorophylls and β-Carotene

The chlorophyll a concentration in leaves of all 13 Brassicaceae varieties increase with the increase in carbon dioxide concentrations (Figure 3a). The medium chlorophyll a concentrations in the leaves of all 13 plants were 173 ± 63 mg m−2 for plants grown at 400 ppmv CO2, 231 ± 56 mg m−2 for plants grown at 800 ppmv CO2, and 283 ± 21 mg m−2 for plants grown at 1200 ppmv CO2, respectively. The chlorophyll a concentration for plants grown at 400 ppmv CO2 varies from 100 ± 21 mg m−2 in B. oleracea var. gongylodes to 273 ± 19 mg m−2 in Lipidium sativum, while from plants grown at 1200 ppmv CO2 vary from 200 ± 20 mg m−2 in Sinapis alba to 371 ± 21 mg m−2 in B. oleracea var. capitata “Rubra”.
The chlorophyll b concentrations generally increase for plants grown at high carbon dioxide concentrations, but it is not general for all varieties (Figure 3b). The medium chlorophyll b concentrations in the leaves of all 13 plants were 97 ± 40 mg m−2 for plants grown at 400 ppmv CO2, 132 ± 35 mg m−2 for plants grown at 800 ppmv CO2, and 160 ± 33 mg m−2 for plants grown at 1200 ppmv CO2, respectively.
The β-carotene concentration does not depend on the carbon dioxide growing conditions except for red cabbage (Figure 3c).
The medium β-carotene concentrations in the leaves of all 13 plants were 24 ± 6 mg m−2 for plants grown at 400 ppmv CO2, 29 ± 7 mg m−2 for plants grown at 800 ppmv CO2, and 35 ± 9 mg m−2 for plants grown at 1200 ppmv CO2, respectively. There are only statistical differences between plants grown at 1200 ppmv and 400 ppmv CO2 (one-way ANOVA followed by Tukey’s multiple comparisons post hoc test, p < 0.01).

2.4. The Change in Total Phenol Concentration for Plants Grown at Different Carbon Dioxide Concentration

Elevated carbon dioxide does not affect the total phenols concentration for some varieties but decreases for others (Figure 4). The most pronounced decrease in total phenols concentration was found in Lepidium sativum plants (227 ± 7 mg Eg gallic acid/L for plants grown at 400 ppmv compared with 145 ± 5 mg Eg ac gallic/L for plants grown at 1200 ppmv).

2.5. The Influence of Elevated Carbon Dioxide on Flavonoids Content in the Leaves of Brasicacea Plants

The total flavonoid contents in leaves generally decrease for plants grown at elevated carbon dioxide, but there is no clear trend (Figure 5). There are some species (such as Sinapis alba) in which the concentration decrease significantly (one way ANOVA followed by Tukey’s multiple comparisons post hoc test, p < 0.001) for plants grown at elevated carbon dioxide, while in others the concentration of flavonoids is not affected (as in B. oleracea var. gemmifera).
The medium total flavonoids concentrations in the leaves of all 13 plants were 0.054 ± 0.030 mg rutin equivalents/mL for plants grown at 400 ppmv CO2, 0.043 ± 0.018 mg rutin equivalents/mL for plants grown at 800 ppmv CO2, and 0.041 ± 0.0016 mg/mL for plants grown at 1200 ppmv CO2, respectively. There are no statistical differences between plants grown at different CO2 concentrations (one-way ANOVA followed by Tukey’s multiple comparisons post hoc test, p > 0.1).

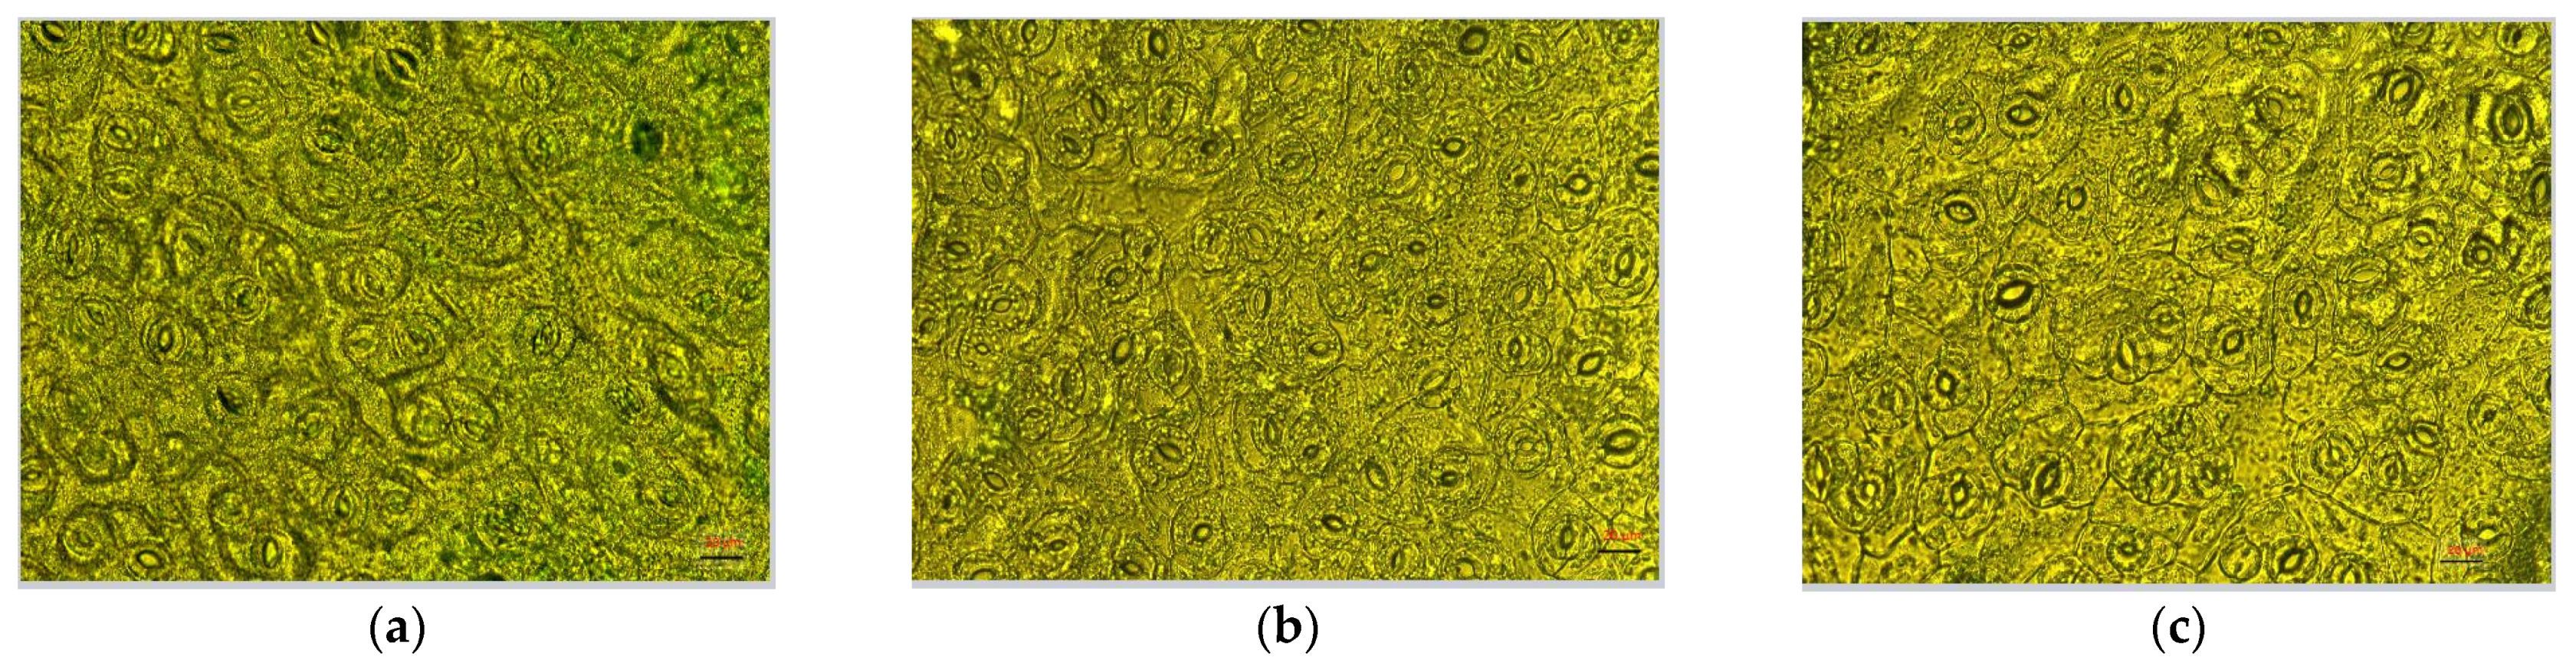
2.6. Microscopic Analyses

Stomatal characteristics did not differ between plants from different treatment groups (Figure 6). The stomata length among the three treatments are 26.37 ± 3.09 µm for 400 ppmv CO2, 24.35 ± 1.84 µm for 800 ppmv CO2, and 26.73 ± 1.71 µm for 1200 ppmv CO2, which are not statistically different among treatments (one way ANOVA followed by Tukey’s multiple comparisons post hoc test, p = 0.7356).
The pore apertures of plants grown at lower concentrations of CO2 remained larger than those of other plant groups. Stoma pore length slightly decreased from 14.65 ± 2.88 µm at 400 ppmv CO2 to 13.57 ± 1.93 µm at 800 ppmv CO2, but only became statistically different at 1200 ppmv CO2 (8.01 ± 0.88 µm, one way ANOVA followed by Tukey’s multiple comparisons post hoc test, p < 0.05).

3. Discussion

As expected, assimilation rates increased with the carbon dioxide concentrations for all species. The same results have been obtained from extensive experiments (FACE) in which legumes showed a 21% increase in saturated assimilation rates with growth at elevated CO2 (see [29] for a review). Carbon dioxide is collected in the substomatal cavities, which could determine the carbon dioxide fixation due to the reaction with RuBP in the presence of the RuBisCo enzyme [36]. Moreover, it has been shown that increasing CO2 in all species determines the decreasing percentage of leaf nitrogen allocated to RuBisCo, which suggests the acclimation of photosynthesis to elevated carbon dioxide [37]. Indeed, many studies have shown that elevated carbon dioxide increases the assimilation rates for C3 plants but decreases their nitrogen content, which is essential for vegetables [38,39].
Generally, under elevated carbon dioxide, stomata close due to higher depolarization of the guard cells [40,41]. The stomata closer to elevated carbon dioxide are induced by enhancing anion channel activity in guard cells [42]. Despite other experiments (in which stomatal conductance decreased on average by 20% in high carbon dioxide [43]), the stomatal conductance to water vapor is not affected by mildly increasing the carbon dioxide concentration. Such behavior has been found for Cajanus cajan L. during vegetative and reproductive growth phases [44] and could be due to altered guard cell signaling patterns. In Arabidopsis mutants with impaired Ca2+ priming sensors and HT1 protein kinase, the increase in carbon dioxide provoking stomatal conductance increased [45]. In our experiment, the stomatal conductance increases significantly only for plants grown at the highest carbon dioxide concentrations (1200 ppmv), which agrees with the results from previous papers [44,45].
The emission of terpenes from plants could be done from specialized secretory organs such as resin ducts, glandular trichomes, oil cavities, or de novo biosynthesis [46,47]. The monoterpenes emitted from plants in the atmosphere participates in secondary aerosol formations and could be implicated in different photochemical reactions. Generally, the emission of terpenes is decreasing for plants grown at elevated carbon dioxide concentrations [48]. Contradictory results have been found for the emission of volatiles from Brassicaceae. On the one hand, it has been shown that the emission of terpenes from Brassica oleracea ssp. capitata decrease for plants grown at high carbon dioxide [49] and, on the other hand, the emission of different volatile organic compounds from Brassica napus ssp. oleifera increase for plants grown at elevated carbon dioxide [50]. In our experiment, the monoterpene emission increased significantly (as in Lepidium sativium). In contrast, elevated carbon dioxide does not affect the emission for other species, as in the case of B. oleracea var. sabellica. Such data suggest that the monoterpene emission capacity of plants grown at elevated carbon dioxide is not affected by carbon accumulation in the leaf tissues [51]. As one of the most abundant terpenes in the emission blend for all species was limonene, the total enhancement in the emission at high carbon dioxide could be explained by increased activity of limonene synthase [52]. On the other hand, it has been demonstrated that isoprene emission decreases under high carbon dioxide due to either the stimulation of phosphoenolpyruvate carboxylase (PEPC), which competes for the pyruvate required for the MEP pathway, or the reduction in DMADP production [14]. However, in our experiment, the chlorophyll content at elevated carbon dioxide increases, suggesting that the N content in the leaves is not affected [53]. Indeed, the enhancement in soil-nitrogen supply affects the energy cycling between the reaction center and the chlorophyll pool, determining the chlorophyll increase. In contrast, the total phenolic compounds decrease for some species grown at elevated carbon dioxide due to the downregulation of the key enzyme PAL activity on the phenylpropanoid pathway [54]. Nonetheless, for most species, the total phenols are not significantly modified. The flavonoid contents decrease at elevated carbon dioxide for all species, probably due to a downregulation of leaf antioxidant enzymes under elevated carbon dioxide. The same trend has been found in the seedling of Oryza sativa L., while for mature plants, the total phenols and flavonoids concentration increase [55].
The hierarchical model of ANOVA analysis between treatment (different carbon dioxide concentrations) and species/varieties confirms the statistical significance of the differences between species and varieties within treatment (Table 2).
Some structural changes could be seen for plants growing at high carbon dioxide. Such a modification in mitochondria and chloroplast has been shown for plants from different families and could be due to increased cellular energy demands when plants are grown at elevated CO2 [56].

4. Materials and Methods

4.1. Plant Material

The Brassicaceae (Cruciferae or mustard) family includes many species distributed worldwide (except Antarctica) and encloses approximately 338 genera and 3709 species.
Plants of 13 species from the Brassicaceae family were grown from the seeds as follows: Red cabbage (Brassica oleracea var. capitata, Langedijker Herfst (Sem-Luca, Timisoara, Romania)), Broccoli (Brassica oleracea var. cymose, Calabrese (Agrosel, Campia-Turzii, Romania)), Green Cabbage (Brassica oleracea var. capitata, Varza de buzau (Sem-Luca, Timisoara, Romania); Vertus 2, (Legutko, Jutrosin, Poland), Cuor de Bue Grosso, (Legutko, Jutrosin, Poland)), Kale (Brassica oleracea var. sabellica, Black magic (Sem-Luca, Timisoara, Romania)), Broccoli (Brassica oleracea var. italica, Early Purple (Legutko, Jutrosin, Poland)), Brussels sprout (Brassica oleracea var. gemmifera, Groninger (Sem-Luca, Timisoara, Romania)), Kohlrabi (Brassica oleracea var. gongyloides, Gongylodes (Agrosel, Campia-Turzii, Romania)), Cauliflower (Brassica oleracea var. botrytis, Moldovita F1 (Agrosel, Campia-Turzii, Romania)), Cress (Lepidium sativum, Common (Legutko, Jutrosin, Poland)), Rapeseed (Brassica napus subsp. napus, Pioneer PT275, Pioneer Hi-Bred, România), and White Mustard (Sinapis alba L., Franchi Sementini, Bergamo, Italy).
The seeds were sown in 0.8 L plastic pots filled with a mixture of commercial garden soil and quartz sand. The plants have been fertilized with fertilizers for foliar (Bionat Plus, Panetone SRL, Timisoara, Romania) and radicular (Cropcare 11-11-21, YaraMila, Oslo, Norway). Day length was 12 h, and the light intensity at plant level of 800 μmol m−2 s−1 was provided by led lamps (Hoff, Nürnberg, Germany). Day/night temperatures were maintained at 25/22 °C and a relative humidity of 65%. The plants were watered every day to soil field capacity. Seven-week-old non-bolted plants with at least three fully developed leaves were used in the experiments. We used the fully expanded leaves with the same development stage for all measurements. The plants were randomized to ensure that all plants grow in the same light. The leaves used for photosynthetic and volatile organic compounds measurements were used for the biochemical analysis.

4.2. Photosynthetic Measurements

A portable gas exchange system (GFS-3000, Waltz, Effeltrich, Germany) was used to determine the photosynthetic parameters, as reported earlier in [57,58]. The calculation of the steady-state values of net assimilation (A) and stomatal conductance to water vapor (gs) was performed as was depicted in [58].

4.3. Volatile Sampling and GC–MS Analyses

Volatile organic compounds (VOC) were sampled (by a flow air sample pump 210-1003 MTX (SKC Inc., Houston, TX, USA)) and analyzed (by a Shimadzu TD20 automated cartridge desorber coupled with a Shimadzu 2010 Plus GC–MS equipment (Shimadzu Corporation, Kyoto, Japan)), as earlier reported in [59].

4.4. Chromatographic Analysis of Photosynthetic Pigments

The pigments (chlorophyll a, chlorophyll b, and β-carotene) were extracted in acetone as described before [60], and the quantitative analyses were performed using the UHPLC-DAD apparatus (NEXERA 8030, Shimadzu, Kyoto, Japan) following the same method earlier published [57]. The concentration of chlorophyll a, chlorophyll b, and β-carotene was calculated using the pure chromatographic standards (Merck, Darmstadt, Germany).

4.5. Flavonoid Content Analysis

The total flavonoid content was determined using the spectrophotometric method [59]. A reaction mixture of aluminum chloride, sodium acetate, and sample was measured at 434 nm, and the results were expressed in mg rutin equivalents/mL.

4.6. Total Phenolic Content—Folin–Ciocalteu Method

Total phenolic content was determined according to the Folin–Ciocalteu, method as described in [59,61], and the results were expressed in mg gallic acid equivalents/mL.

4.7. Microscopy Analyses

The surfaces of leaves were examined by using a Zeiss Scope.A1 microscope equipped with the AxioCam MRc 5 camera and ZEN lite 2012 software (Carl Zeiss MicroImaging GmbH, Jena, Germany). The samples preparation was done by following the next steps: peel the epidermis from the backside of the leaf, mount the sample on a glass slide in distilled water, fix with a coverslip, and observe under the microscope at 40× magnification. For scanning electron microscopy (SEM), leaves were mounted on stubs using carbon double-sided adhesive tape without any treatment. The samples were examined and photographed using LYRA3 scanning electron microscope (LYRA3 XMU, Tescan, Brno, CzechRepublic) with Low Vacuum Secondary Electron Tescan Detector (LVSTD), at 15 kV and magnification 800×.

4.8. Statistical Analysis and Data Handling

One-way ANOVA, Tukey’s multiple comparisons test, and two-way ANOVA were done using GraphPad Prism version 9.3.0 for Windows (GraphPad Software, San Diego, Ca, USA, www.graphpad.com (accessed on 30 January 2022)). Results were considered significantly different at p-values < 0.05.

5. Conclusions

In this study, we have shown that elevated carbon dioxide increases the photosynthetic activities and emission of volatile organic compounds. On the other hand, plants that grow at a high concentration of CO2 exhibit downregulation of polyphenols and flavonoids, which could become a significant problem in light of future climate change conditions. The results revealed that different species/varieties from the Brassicaceae family respond differently to increases in carbon dioxide concentration. Generally, all plants increase their assimilation rates, monoterpene emission, and chlorophylls and decrease their flavonoids and polyphenols content.

Author Contributions

Conceptualization, L.C.; methodology, A.L., C.M., S.G., M.D., D.C., V.C. and D.M.C.; software, A.L., C.M., M.D. and D.M.C.; validation, A.L, C.M., D.C., D.M.C. and L.C.; formal analysis, A.L., C.M., S.G., M.D., D.C., V.C. and D.M.C.; investigation, A.L., C.M., S.G., M.D., D.C., V.C. and D.M.C.; data curation, A.L., C.M., M.D. and D.M.C.; writing—original draft preparation, A.L., D.M.C. and L.C.; writing—review and editing, A.L., D.M.C. and L.C.; supervision, L.C.; project administration, L.C.; funding acquisition, L.C. All authors have read and agreed to the published version of the manuscript.

Funding

This research was funded by CNFIS-UEFISCDI, project number PN-III-P4-ID-PCE-2020-0410.

Data Availability Statement

The data presented in this study are available in the article.

Acknowledgments

The authors thank Brenda Crystal Svinti for the professional editing of this paper.

Conflicts of Interest

The authors declare no conflict of interest.

References

  1. IPCC. Climate Change 2014: Impacts, Adaptation, and Vulnerability. Part A: Global and Sectoral Aspects; Cambridge University Press: Cambridge, UK; New York, NY, USA, 2014; p. 1132. [Google Scholar]
  2. Ishigooka, Y.; Hasegawa, T.; Kuwagata, T.; Nishimori, M.; Wakatsuki, H. Revision of estimates of climate change impacts on rice yield and quality in Japan by considering the combined effects of temperature and CO2 concentration. J. Agric. Meteorol. 2021, 77, 139–149. [Google Scholar] [CrossRef]
  3. Reyer, C.P.O.; Leuzinger, S.; Rammig, A.; Wolf, A.; Bartholomeus, R.P.; Bonfante, A.; de Lorenzi, F.; Dury, M.; Gloning, P.; Abou Jaoudé, R.; et al. A plant’s perspective of extremes: Terrestrial plant responses to changing climatic variability. Glob. Change Biol. 2013, 19, 75–89. [Google Scholar] [CrossRef]
  4. Medlyn, B.E.; Barton, C.V.M.; Broadmeadow, M.S.J.; Ceulemans, R.; De Angelis, P.; Forstreuter, M.; Freeman, M.; Jackson, S.B.; Kellomäki, S.; Laitat, E.; et al. Stomatal conductance of forest species after long-term exposure to elevated CO2 concentration: A synthesis. New Phytol. 2001, 149, 247–264. [Google Scholar] [CrossRef]
  5. Drake, B.G.; Gonzàlez-Meler, M.A.; Long, S.P. More efficient plants: A Consequence of Rising Atmospheric CO2? Annu. Rev. Plant Biol. 1997, 48, 609–639. [Google Scholar] [CrossRef] [PubMed] [Green Version]
  6. Cernusak, L.A.; Haverd, V.; Brendel, O.; Le Thiec, D.; Guehl, J.M.; Cuntz, M. Robust response of terrestrial plants to rising CO2. Trends Plant Sci. 2019, 24, 578–586. [Google Scholar] [CrossRef] [PubMed]
  7. Ainsworth, E.A.; Leakey, A.D.B.; Ort, D.R.; Long, S.P. FACE-ing the facts: Inconsistencies and interdependence among field, chamber and modeling studies of elevated [CO2] impacts on crop yield and food supply. New Phytol. 2008, 179, 5–9. [Google Scholar] [CrossRef] [PubMed]
  8. Wang, D.; Heckathorn, S.A.; Wang, X.; Philpott, S.M. A meta-analysis of plant physiological and growth responses to temperature and elevated CO2. Oecologia 2012, 169, 1–13. [Google Scholar] [CrossRef]
  9. Ainsworth, E.A.; Rogers, A.; Blum, H.; Nösberger, J.; Long, S.P. Variation in acclimation of photosynthesis in Trifolium repens after eight years of exposure to Free Air CO2 Enrichment (FACE). J. Exp. Bot. 2003, 54, 2769–2774. [Google Scholar] [CrossRef]
  10. Rogers, A.; Humphries, S.W. A mechanistic evaluation of photosynthetic acclimation at elevated CO2. Glob. Change Biol. 2000, 6, 1005–1011. [Google Scholar] [CrossRef] [Green Version]
  11. Peña-Rojas, K.; Aranda, X.; Fleck, I. Stomatal limitation to CO2 assimilation and down-regulation of photosynthesis in Quercus ilex resprouts in response to slowly imposed drought. Tree Physiol. 2004, 24, 813–822. [Google Scholar] [CrossRef]
  12. Zheng, Y.; Li, F.; Hao, L.; Yu, J.; Guo, L.; Zhou, H.; Ma, C.; Zhang, X.; Xu, M. Elevated CO2 concentration induces photosynthetic down-regulation with changes in leaf structure, non-structural carbohydrates and nitrogen content of soybean. BMC Plant Biol. 2019, 19, 255. [Google Scholar] [CrossRef]
  13. Copolovici, L.; Popitanu, A.C.; Copolovici, D.-M. Volatile organic compound emission and residual substances from plants in light of the globally increasing CO2 level. Curr. Opin. Environ. Sci. Health 2021, 19, 100216. [Google Scholar] [CrossRef]
  14. Lantz, A.T.; Solomon, C.; Gog, L.; McClain, A.M.; Weraduwage, S.M.; Cruz, J.A.; Sharkey, T.D. Isoprene suppression by CO2 is not due to triose phosphate utilization (TPU) limitation. Front. For. Glob. Change 2019, 2, 8. [Google Scholar] [CrossRef]
  15. Chen, Y.; Martin, C.; Fingu Mabola, J.C.; Verheggen, F.; Wang, Z.; He, K.; Francis, F. Effects of host plants reared under elevated CO2 concentrations on the foraging behavior of different stages of corn leaf aphids Rhopalosiphum maidis. Insects 2019, 10, 182. [Google Scholar] [CrossRef] [PubMed] [Green Version]
  16. Daussy, J.; Staudt, M. Do future climate conditions change volatile organic compound emissions from Artemisia annua? Elevated CO2 and temperature modulate actual VOC emission rate but not its emission capacity. Atmos. Environ. X 2020, 7, 100082. [Google Scholar] [CrossRef]
  17. Li, L.; Wang, M.; Pokharel, S.S.; Li, C.; Parajulee, M.N.; Chen, F.; Fang, W. Effects of elevated CO2 on foliar soluble nutrients and functional components of tea, and population dynamics of tea aphid, Toxoptera aurantii. Plant Physiol. Biochem. 2019, 145, 84–94. [Google Scholar] [CrossRef]
  18. Sharma, H.C.; War, A.R.; Pathania, M.; Sharma, S.P.; Akbar, S.M.; Munghate, R.S. Elevated CO2 influences host plant defense response in chickpea against Helicoverpa armigera. Arthropod-Plant Interact. 2016, 10, 171–181. [Google Scholar] [CrossRef]
  19. Oki, Y.; Arantes-Garcia, L.; Costa, M.; Nunes, B.; Rúbia, B.; Gélvez-Zúñiga, I.; Franco, A.; Fernandes, G. CO2 fertilizer effect on growth, polyphenols, and endophytes in two Baccharis species. Braz. Arch. Biol. Technol. 2020, 63, e20190302. [Google Scholar] [CrossRef]
  20. Moynul Haque, M.; Hamid, A.; Khanam, M.; Biswas, D.K.; Karim, M.A.; Khaliq, Q.A.; Hossain, M.A.; Uprety, D.C. The effect of elevated CO2 concentration on leaf chlorophyll and nitrogen contents in rice during post-flowering phases. Biol. Plant. 2006, 50, 69–73. [Google Scholar] [CrossRef]
  21. Lanoue, J.; Leonardos, E.D.; Khosla, S.; Hao, X.; Grodzinski, B. Effect of elevated CO2 and spectral quality on whole plant gas exchange patterns in tomatoes. PLoS ONE 2018, 13, e0205861. [Google Scholar] [CrossRef]
  22. Huang, M.-Y.; Wong, S.-L.; Weng, J.-H. Rapid light-response curve of chlorophyll fluorescence in terrestrial plants: Relationship to CO2 exchange among five woody and four fern species adapted to different light and water regimes. Plants 2021, 10, 445. [Google Scholar] [CrossRef] [PubMed]
  23. Bhatia, A.; Mina, U.; Kumar, V.; Tomer, R.; Kumar, A.; Chakrabarti, B.; Singh, R.N.; Singh, B. Effect of elevated ozone and carbon dioxide interaction on growth, yield, nutrient content and wilt disease severity in chickpea grown in Northern India. Heliyon 2021, 7, e06049. [Google Scholar] [CrossRef] [PubMed]
  24. Hou, L.; Shang, M.; Chen, Y.; Zhang, J.; Xu, X.; Song, H.; Zheng, S.; Li, M.; Xing, G. Physiological and molecular mechanisms of elevated CO2 in promoting the growth of pak choi (Brassica rapa ssp. chinensis). Sci. Hortic. 2021, 288, 110318. [Google Scholar] [CrossRef]
  25. Keramat, S.; Eshghizadeh, H.R.; Zahedi, M.; Nematpour, A. Growth and biochemical changes of sorghum genotypes in response to carbon dioxide and salinity interactions. Cereal Res. Commun. 2020, 48, 325–332. [Google Scholar] [CrossRef]
  26. Zhang, C.; Jia, X.; Zhao, Y.; Wang, L.; Cao, K.; Zhang, N.; Gao, Y.; Wang, Z. The combined effects of elevated atmospheric CO2 and cadmium exposure on flavonoids in the leaves of Robinia pseudoacacia L. seedlings. Ecotoxicol. Environ. Saf. 2021, 210, 111878. [Google Scholar] [CrossRef]
  27. Shimomura, M.; Yoshida, H.; Fujiuchi, N.; Ariizumi, T.; Ezura, H.; Fukuda, N. Continuous blue lighting and elevated carbon dioxide concentration rapidly increase chlorogenic acid content in young lettuce plants. Sci. Hortic. 2020, 272, 109550. [Google Scholar] [CrossRef]
  28. Selim, S.; Abuelsoud, W.; Al-Sanea, M.M.; AbdElgawad, H. Elevated CO2 differently suppresses the arsenic oxide nanoparticles-induced stress in C3 (Hordeum vulgare) and C4 (Zea maize) plants via altered homeostasis in metabolites specifically proline and anthocyanin metabolism. Plant Physiol. Biochem. 2021, 166, 235–245. [Google Scholar] [CrossRef]
  29. Ainsworth, E.A.; Long, S.P. What have we learned from 15 years of free-air CO2 enrichment (FACE)? A meta-analytic review of the responses of photosynthesis, canopy properties and plant production to rising CO2. New Phytol. 2005, 165, 351–372. [Google Scholar] [CrossRef]
  30. Jalal, S.; Jellings, A.; Fuller, M. Positive effects of elevated CO2 and its interaction with nitrogen on safflower physiology and growth. Agron. Sustain. Dev. 2013, 33, 497–505. [Google Scholar] [CrossRef] [Green Version]
  31. Radoglou, K.M.; Aphalo, P.; Jarvis, P.G. Response of photosynthesis, stomatal conductance and water use efficiency to elevated CO2 and nutrient supply in acclimated seedlings of Phaseolus vulgaris L. Ann. Bot. 1992, 70, 257–264. [Google Scholar] [CrossRef] [Green Version]
  32. Centritto, M.; Nascetti, P.; Petrilli, L.; Raschi, A.; Loreto, F. Profiles of isoprene emission and photosynthetic parameters in hybrid poplars exposed to free air CO2 enrichmen. Plant Cell Environ. 2004, 27, 403–412. [Google Scholar] [CrossRef]
  33. Sun, Z.; Hüve, K.; Vislap, V.; Niinemets, Ü. Elevated CO2 magnifies isoprene emissions under heat and improves thermal resistance in hybrid aspen. J. Exp. Bot. 2013, 64, 5509–5523. [Google Scholar] [CrossRef] [PubMed] [Green Version]
  34. Thomson, G.; Mollah, M.R.; Partington, D.L.; Jones, R.; Argall, R.; Tregenza, J.; Fitzgerald, G.J. Effects of elevated carbon dioxide and soil nitrogen on growth of two leafy Brassica vegetables. N. Z. J. Crop Hortic. Sci. 2013, 41, 69–77. [Google Scholar] [CrossRef]
  35. Karowe, D.N.; Grubb, C. Elevated CO2 increases constitutive phenolics and trichomes, but decreases inducibility of phenolics in Brassica rapa (Brassicaceae). J. Chem. Ecol. 2011, 37, 1332–1340. [Google Scholar] [CrossRef]
  36. Zhu, X.-G.; Long, S.P.; Ort, D.R. Improving photosynthetic efficiency for greater yield. Annu. Rev. Plant Biol. 2010, 61, 235–261. [Google Scholar] [CrossRef] [Green Version]
  37. Hirose, T.; Ackerly, D.D.; Traw, M.B.; Bazzaz, F.A. Effects of CO2 elevation on canopy development in the stands of two co-occurring annuals. Oecologia 1996, 108, 215–223. [Google Scholar] [CrossRef]
  38. Baligar, V.C.; Elson, M.K.; Almeida, A.-A.F.; de Araujo, Q.R.; Ahnert, D.; He, Z. The Impact of carbon dioxide concentrations and low to adequate photosynthetic photon flux density on growth, physiology and nutrient use efficiency of juvenile cacao genotypes. Agronomy 2021, 11, 397. [Google Scholar] [CrossRef]
  39. Dong, J.; Gruda, N.; Lam, S.K.; Li, X.; Duan, Z. Effects of elevated CO2 on nutritional quality of vegetables: A review. Front. Plant Sci. 2018, 9, 924. [Google Scholar] [CrossRef]
  40. Xu, Z.; Jiang, Y.; Jia, B.; Zhou, G. Elevated-CO2 response of stomata and its dependence on environmental factors. Front. Plant Sci. 2016, 7, 657. [Google Scholar] [CrossRef] [Green Version]
  41. Negi, J.; Hashimoto-Sugimoto, M.; Kusumi, K.; Iba, K. New approaches to the biology of stomatal guard cells. Plant Cell Physiol. 2013, 55, 241–250. [Google Scholar] [CrossRef] [Green Version]
  42. Yamamoto, Y.; Negi, J.; Wang, C.; Isogai, Y.; Schroeder, J.I.; Iba, K. The transmembrane region of guard cell SLAC1 channels perceives CO2 signals via an ABA-independent pathway in Arabidopsis. Plant Cell 2016, 28, 557–567. [Google Scholar] [CrossRef] [PubMed] [Green Version]
  43. Wand, S.J.E.; Midgley, G.F.; Jones, M.H.; Curtis, P.S. Responses of wild C4 and C3 grass (Poaceae) species to elevated atmospheric CO2 concentration: A meta-analytic test of current theories and perceptions. Glob. Change Biol. 1999, 5, 723–741. [Google Scholar] [CrossRef] [Green Version]
  44. Sreeharsha, R.V.; Sekhar, K.M.; Reddy, A.R. Delayed flowering is associated with lack of photosynthetic acclimation in Pigeon pea (Cajanus cajan L.) grown under elevated CO2. Plant Sci. 2015, 231, 82–93. [Google Scholar] [CrossRef]
  45. Hashimoto, M.; Negi, J.; Young, J.; Israelsson, M.; Schroeder, J.I.; Iba, K. Arabidopsis HT1 kinase controls stomatal movements in response to CO2. Nat. Cell Biol. 2006, 8, 391–397. [Google Scholar] [CrossRef]
  46. Yang, W.; Cao, J.; Wu, Y.; Kong, F.; Li, L. Review on plant terpenoid emissions worldwide and in China. Sci. Total Environ. 2021, 787, 147454. [Google Scholar] [CrossRef]
  47. Popitanu, C.; Lupitu, A.; Copolovici, L.; Bungău, S.; Niinemets, Ü.; Copolovici, D.M. Induced volatile emissions, photosynthetic characteristics, and pigment content in Juglans regia leaves infected with the Erineum-forming mite Aceria erinea. Forests 2021, 12, 920. [Google Scholar] [CrossRef]
  48. Peñuelas, J.; Staudt, M. BVOCs and global change. Trends Plant Sci. 2010, 15, 133–144. [Google Scholar] [CrossRef]
  49. Vuorinen, T.; Reddy, G.V.P.; Nerg, A.-M.; Holopainen, J.K. Monoterpene and herbivore-induced emissions from cabbage plants grown at elevated atmospheric CO2 concentration. Atmos. Environ. 2004, 38, 675–682. [Google Scholar] [CrossRef]
  50. Himanen, S.J.; Nerg, A.-M.; Nissinen, A.I.; Pinto, D.M.L.; Stewart, C.N.; Poppy, G.M.; Holopainen, J.K. Effects of elevated carbon dioxide and ozone on volatile terpenoid emissions and multitrophic communication of transgenic insecticidal oilseed rape (Brassica napus). New Phytol. 2009, 181, 174–186. [Google Scholar] [CrossRef]
  51. Staudt, M.; Joffre, R.; Rambal, S.; Kesselmeier, J. Effect of elevated CO2 on monoterpene emission of young Quercus ilex trees and its relation to structural and ecophysiological parameters. Tree Physiol. 2001, 21, 437–445. [Google Scholar] [CrossRef] [Green Version]
  52. Loreto, F.; Fischbach, R.J.; Schnitzler, J.-P.; Ciccioli, P.; Brancaleoni, E.; Calfapietra, C.; Seufert, G. Monoterpene emission and monoterpene synthase activities in the Mediterranean evergreen oak Quercus ilex L. grown at elevated CO2 concentrations. Glob. Change Biol. 2001, 7, 709–717. [Google Scholar] [CrossRef]
  53. Uprety, D.C.; Mahalaxmi, V. Effect of elevated CO2 and nitrogen nutrition on photosynthesis, growth and carbon-nitrogen balance in Brassica juncea. J. Agron. Crop Sci. 2000, 184, 271–276. [Google Scholar] [CrossRef]
  54. Mattson, W.J.; Julkunen-Tiitto, R.; Herms, D.A. CO2 enrichment and carbon partitioning to phenolics: Do plant responses accord better with the protein competition or the growth differentiation balance models? Oikos 2005, 111, 337–347. [Google Scholar] [CrossRef]
  55. Goufo, P.; Pereira, J.; Moutinho-Pereira, J.; Correia, C.M.; Figueiredo, N.; Carranca, C.; Rosa, E.A.S.; Trindade, H. Rice (Oryza sativa L.) phenolic compounds under elevated carbon dioxide (CO2) concentration. Environ. Exp. Bot. 2014, 99, 28–37. [Google Scholar] [CrossRef]
  56. Griffin, K.L.; Anderson, O.R.; Gastrich, M.D.; Lewis, J.D.; Lin, G.; Schuster, W.; Seemann, J.R.; Tissue, D.T.; Turnbull, M.H.; Whitehead, D. Plant growth in elevated CO2 alters mitochondrial number and chloroplast fine structure. Proc. Natl. Acad. Sci. USA 2001, 98, 2473–2478. [Google Scholar] [CrossRef] [Green Version]
  57. Copolovici, L.; Pag, A.; Kännaste, A.; Bodescu, A.; Tomescu, D.; Copolovici, D.; Soran, M.-L.; Niinemets, Ü. Disproportionate photosynthetic decline and inverse relationship between constitutive and induced volatile emissions upon feeding of Quercus robur leaves by large larvae of gypsy moth (Lymantria dispar). Environ. Exp. Bot. 2017, 138, 184–192. [Google Scholar] [CrossRef] [Green Version]
  58. Niinemets, Ü.; Copolovici, L.; Hüve, K. High within-canopy variation in isoprene emission potentials in temperate trees: Implications for predicting canopy-scale isoprene fluxes. J. Geophys. Res.-Biogeosci. 2010, 115, G04029. [Google Scholar] [CrossRef] [Green Version]
  59. Copolovici, L.; Lupitu, A.; Moisa, C.; Taschina, M.; Copolovici, D.M. The effect of antagonist abiotic stress on bioactive compounds from basil (Ocimum basilicum). Appl. Sci. 2021, 11, 9282. [Google Scholar] [CrossRef]
  60. Opriş, O.; Copaciu, F.; Soran, M.L.; Ristoiu, D.; Niinemets, Ü.; Copolovici, L. Influence of nine antibiotics on key secondary metabolites and physiological characteristics in Triticum aestivum: Leaf volatiles as a promising new tool to assess toxicity. Ecotoxicol. Environ. Saf. 2013, 87, 70–79. [Google Scholar] [CrossRef]
  61. Moisa, C.; Copolovici, L.; Pop, G.; Imbrea, I.; Lupitu, A.; Nemeth, S.; Copolovici, D. Wastes resulting from aromatic plants distillation-bio-sources of antioxidants and phenolic compounds with biological active principles. Farmacia 2018, 66, 289–295. [Google Scholar]
Figure 1. The assimilation rate (a) and stomatal conductance to water vapor (b) from Brassicaceae plants grown at three carbon dioxide concentrations. The values are averages of three independent measurements.
Plants 11 00973 g001
Figure 2. The emission rate of monoterpenes from Brassicaceae plants grown at three carbon dioxide concentrations. The values are averages of three independent measurements.
Plants 11 00973 g002
Figure 3. Chlorophyll a (a), Chlorophyll b (b) and β-carotene (c) concentrations from Brassicaceae plants grown at three carbon dioxide concentrations. The values are averages of three independent measurements.
Plants 11 00973 g003aPlants 11 00973 g003b
Figure 4. Total phenols concentration from Brassicaceae plants grown at three carbon dioxide concentrations. The values are averages of three independent measurements.
Plants 11 00973 g004
Figure 5. Total flavonoids content from Brassicaceae plants grown at three carbon dioxide concentrations. The values are averages of three independent measurements.
Plants 11 00973 g005
Figure 6. Microscopy images that present the stomatal pattern of leaf surfaces of Brassica oleracea italic recorded with an optical microscope ((ac), with the scale bar 20 μm) and SEM micrographs ((df), magnification 800×) for leaf plants grown at 400 (a,d), 800 (b,e), and 1200 (c,f) ppmv CO2.
Plants 11 00973 g006aPlants 11 00973 g006b
Table 1. Examples of the effect of increased CO2 concentrations on the photosynthetic characteristics, secondary metabolites, and pigment content of different plant species.
Plant CharacteristicEffect *SpeciesElevated Carbon Dioxide Concentration (ppmv)Reference
Assimilation rateTrifolium repens600[9]
Triticum aestivum583[7]
Oryza sativa475–600[29]
Glycine max475–600[29]
Carthamus tinctorius1000[30]
Phaseolus vulgaris L.700[31]
Populus × euroamericana550[32]
Camellia sinensis770[17]
Oryza sativa L.570[20]
Isoprene emissionPhragmites australis800[14]
Platanus × acerfolia800[14]
Populas nigra × maximowiczii NM6800[14]
Populus × euroamericana550[32]
Populus tremula × Populus tremuloides780[33]
Total phenolsCamellia sinensis770[17]
Cicer arietinum750[18]
Baccharis dracunculifolia750–800[19]
Baccharis platypoda750–800[19]
Chlorophylls concentrationOryza sativa L.570[20]
Solanum lycopersicum1000[21]
Cicer arietinum700[23]
Brassica rapa800[24]
Sorghum bicolor700[25]
Carthamus tinctorius1000[30]
Total flavonoidsRobinia pseudoacacia L.750[26]
Hordeum vulgare620[28]
Zea maize620[28]
* Effect: unchanged: ↔; increase: ↑; decrease: ↓.
Table 2. The hierarchical model of ANOVA analysis between treatment (different carbon dioxide concentrations) and species/varieties.
Source of VariationAssimilation RateStomata ConductanceMonoterpene EmissionChlorophyll aChlorophyll bβ-caroteneFlavonoidsPolyphenols
df, MS, F, p Valuedf, MS, F, p Valuedf, MS, F, p Valuedf, MS, F, p Valuedf, MS, F, p Valuedf, MS, F, p Valuedf, MS, F, p Valuedf, MS, F, p Value
Carbon dioxide2, 3182, 2849, <0.00012, 4907, 97.81, <0.00012, 0.0406, 1671, <0.00012, 119,198, 214.2, <0.00012, 39,098, 130.2, <0.00012, 1127, 44.26, <0.00012, 0.00333, 265.4, <0.00012, 2573, 5178, <0.0001
Species/varieties12, 313.2, 280.4, <0.000112, 7206, 143.6, <0.000112, 0.0724, 2979, <0.000112, 25,178, 45.24, <0.000112, 10,211, 34.01, <0.000112, 389.9, 15.31, <0.000112, 0.00629, 501.0, <0.000112, 22,126, 44,530, <0.0001
Error174.278270.00189543,40623,41619860.00195838.76
Publisher’s Note: MDPI stays neutral with regard to jurisdictional claims in published maps and institutional affiliations.

