Article

Niche Variation in Endemic Lilium pomponium on a Wide Altitudinal Gradient in the Maritime Alps

1
Centre d’Ecologie Fonctionnelle et Evolutive (CEFE), University of Montpellier, CNRS, EPHE, IRD, 34293 Montpellier, France
2
Dipartimento di Scienze della Terra dell’Ambiente e della Vita (DISTAV), University of Genoa, Corso Europa 26, 16132 Genoa, Italy
*
Author to whom correspondence should be addressed.
Plants 2022, 11(6), 833; https://doi.org/10.3390/plants11060833
Submission received: 16 February 2022 / Revised: 14 March 2022 / Accepted: 16 March 2022 / Published: 21 March 2022

Abstract

:
The relationship between altitudinal and ecological gradients has long been a dominant theme in plant ecology; moreover, how species respond to climate change has renewed this interest. Mediterranean mountains are often hotspots of endemism, and some endemic species have local distributions that span different climatic belts; hence, local variations in topography and fine-scaled niche conditions may play crucial roles in their persistence along such gradients. Studies of the fine-scaled niche are, however, very rare; most studies involve broad-scale variations in climatic parameters. The Turban lily, Lilium pomponium L. is endemic to the Maritime and Ligurian Alps, where it occurs across a wide altitudinal gradient. Previous work has shown no link between climatic marginality and geographic range limits on morphological traits and genetic variability; however, possible variations of local topographic and ecological parameters have not yet been examined. The objective of this paper is to characterise local ecological niche conditions of L. pomponium populations in the different bioclimatic zones it occupies along the altitudinal gradient. The species occurs in four main types of microecological niches. One of these niche types, with a high mineral cover, is the most abundant—type 2: it was detected in 39% of sampled quadrats and occurs across the whole bioclimatic gradient. Other niche types are more limited to subsections of the gradient: type 3 (in 19% of sampled quadrats) is restricted to high-altitude sites (>1070 m.a.s.l.) and is characterised by high vegetation and litter cover; type 4 (26%) corresponds to more forested habitats on substrates with low water retention capacities, in more inland zones close to the centre of L. pomponium distribution and across a range of altitudes; and type 1 (16% of quadrat) only occurs in the Mediterranean part of the gradient, close to distribution limits in pockets of soil among large blocks of rocks, mainly found at mid-altitudes. Despite heterogeneity in the spatial locations of niche types, there is no correspondence between ecological gradients and the distribution limits of this species. Knowledge of the fine-scaled ecological conditions that determine niche types is thus essential for conservation management of the habitats of this species and for the exploration of its possible response to ongoing climate change.

1. Introduction

Ecological gradients in relation to altitude have long been a dominant theme in plant ecology. As a result, we now benefit from a wealth of studies detailing patterns in the proportion of endemic species and species diversity [1,2,3,4], associations among species [5], pollination strategies [6,7,8], reproductive traits [9,10,11], and potential variation in functional traits [12,13,14] along altitudinal gradients. In more recent years, the observation of changes in species distribution and their colonisation of higher latitudes and altitudes in relation to warming climates [15,16,17], have renewed interest in the understanding of the ecological interactions that govern distribution patterns in mountain plants. In addition, the observation of rapid genetically based adaptation to relaxed selection pressures on micro-environmental gradients that incur milder winters [18] indicates how changes in distribution patterns may be linked to localised topographic and ecological niche conditions that interact with climate change.
Mediterranean mountains have attracted much attention in this respect. The comparison of conjoint variation in temperature and drought with elevation has allowed vegetation communities to be classified into seven different bioclimatic elevation belts [19,20,21], three of which are representative of truly Mediterranean conditions, and four others represent transitional environments towards mountain and alpine vegetations. Along these gradients, species diversity and the proportion of endemic plants in the local flora show striking patterns, and some endemic species occur on wide altitudinal gradients, a distribution pattern that may be intimately linked to historical periods of climate change [2]. What may be crucial here is how such species show variation in their fine-scaled multi-dimensional ecological niche in different climatic belts and broad habitat types. Indeed, several recent studies illustrate the importance of quantifying multiple dimensions of the ecological niche (species composition and richness of functional types, the proportion of mineral elements and other biotic cover variables, and soil chemistry) on a highly localised scale, for our understanding of differences in species range sizes and limits, and the presence in different broad habitat types [22,23,24,25].
The Turban lily, Lilium pomponium L. is endemic to the Maritime and Ligurian Alps (Figure 1) and occupies a wide altitudinal gradient [26]. There is no apparent link between gradients of climatic conditions and trait variation other than a shift towards smaller flowers at high elevation [27]. In a study of genetic variability, Casazza et al. [28] found no decline in genetic variability in peripheral populations of this species relative to those in the centre of its distribution, as would be predicted by the so-called centre–periphery hypothesis [29]. Climatic and/or ecological conditions may in fact have a mosaic distribution in the area of presence of L. pomponium, where mixed alpine and Mediterranean influences may interact along localised topographic gradients at different distances from the Mediterranean Sea. Hence, there is a clear need for a detailed study of localised ecological niche conditions across the range of altitude and different bio-climatic zones where this species is present, in order to understand the causes of its presence in different belts.
The objective of this study was to examine whether the characteristics of the local scale ecological niche of endemic Lilium pomponium have a specific distribution in relation to either (or both) an altitudinal gradient or a spatial, geographic gradient from the centre to the periphery of the species’ distribution. The aim here was to test whether fine-scaled ecological niche parameters (topographic, edaphic and biotic parameters) vary towards the limits of these two macroecological gradients. To do so we examined three main issues. First, we tested whether the species showed variations in its topographic niche in relation to altitudinal variations that may have indicated its precise relation to climatic parameters along this gradient. Second, we explored variations in fine-scaled ecological niche parameters in a stratified sample of populations along the altitudinal gradient in order to test for variations that facilitated the presence of this species along the gradient. Third, we examined the hypothesis that populations show variations in their ecological niches at the limits of the distribution of this species, both in terms of an ecological gradient of altitude and spatial geographic range limits. To assess any variability in performance along the altitudinal and geographic gradients, we also quantified phenotypic traits and local abundance.

2. Results

2.1. Local Topography

Lilium pomponium occurs across a wide altitudinal gradient from 61 to 2033 m.a.s.l. with a major part of known locations (90%) between 455 and 1651 m (Figure 2). Northing is the only topographic parameter that significantly changes along the altitudinal gradient (p-value < 0.001, adjusted-R2 = 0.126). Although slopes vary from 1° to 80°, there is no significant linear relationship between altitude and easting (p-value = 0.879), nor between altitude and topographic position index (TPI) (p-value = 0.180). The relationship between altitude and slope is significant but weak (p-value = 0.007 but adjusted-R2 = 0.006). Sites of L. pomponium present in mid-altitudes are exposed in all directions whereas high-altitude locations are less exposed to the north and low-altitude sites are less exposed to the south (Figure 3).

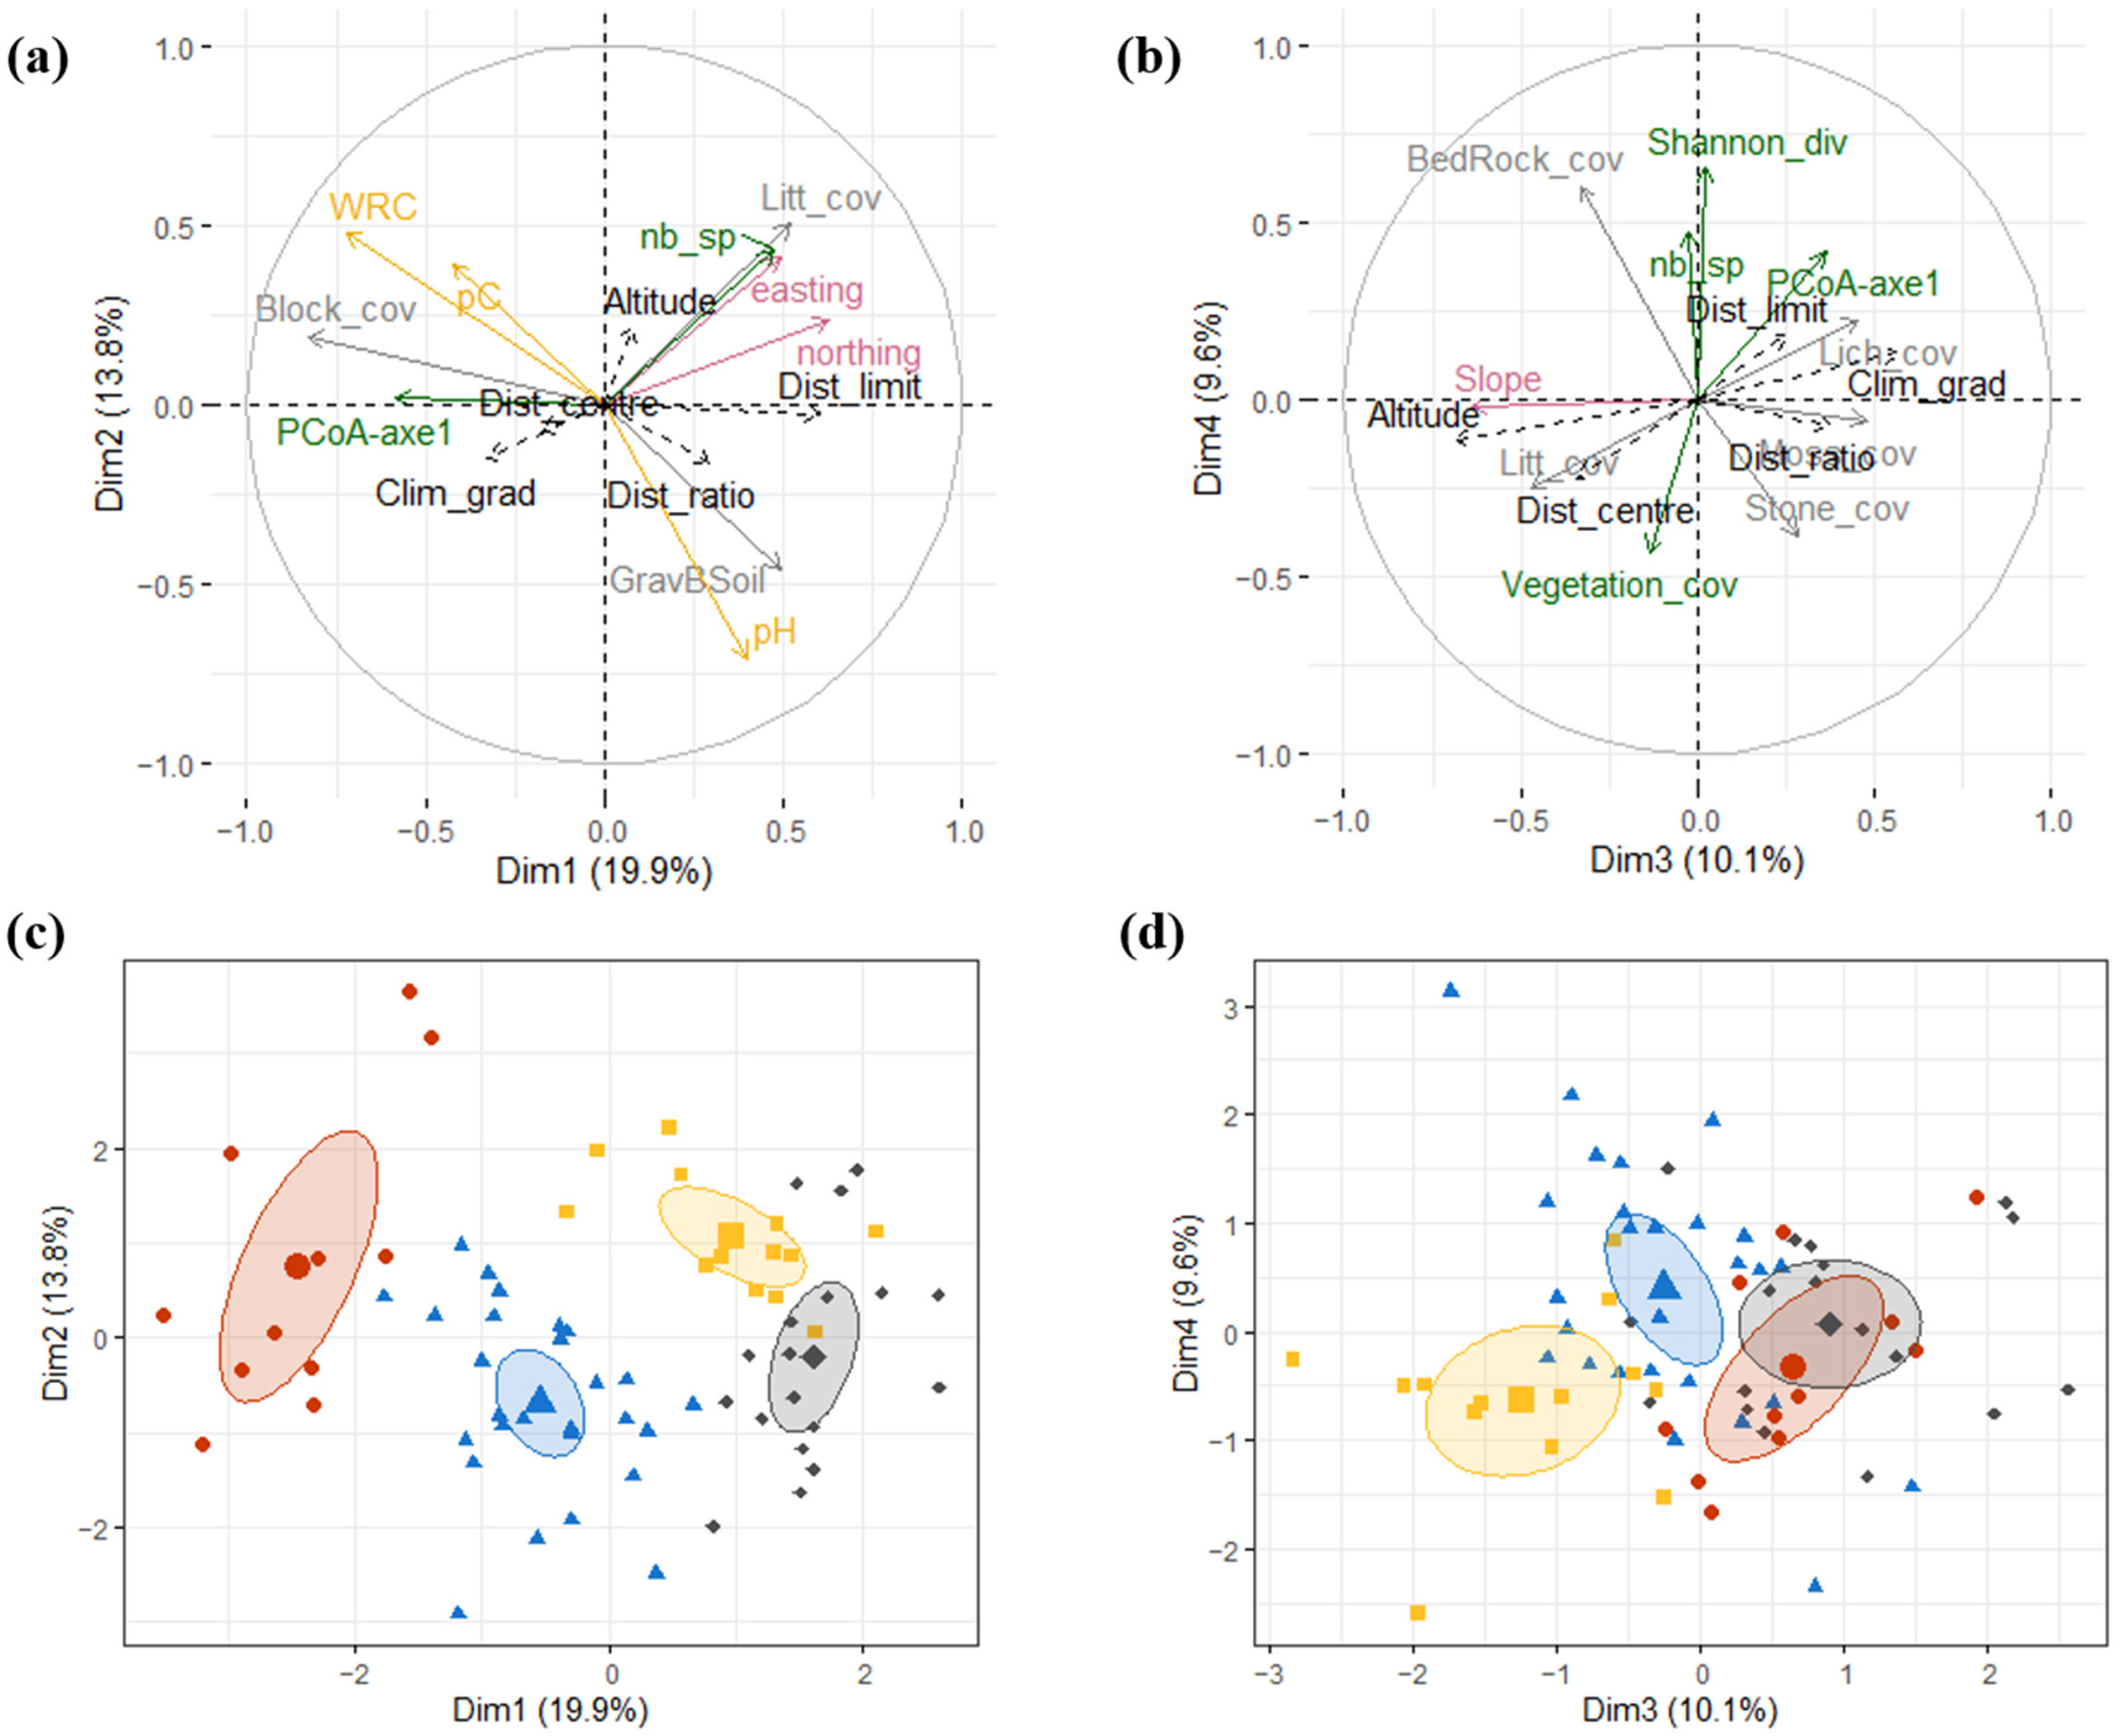
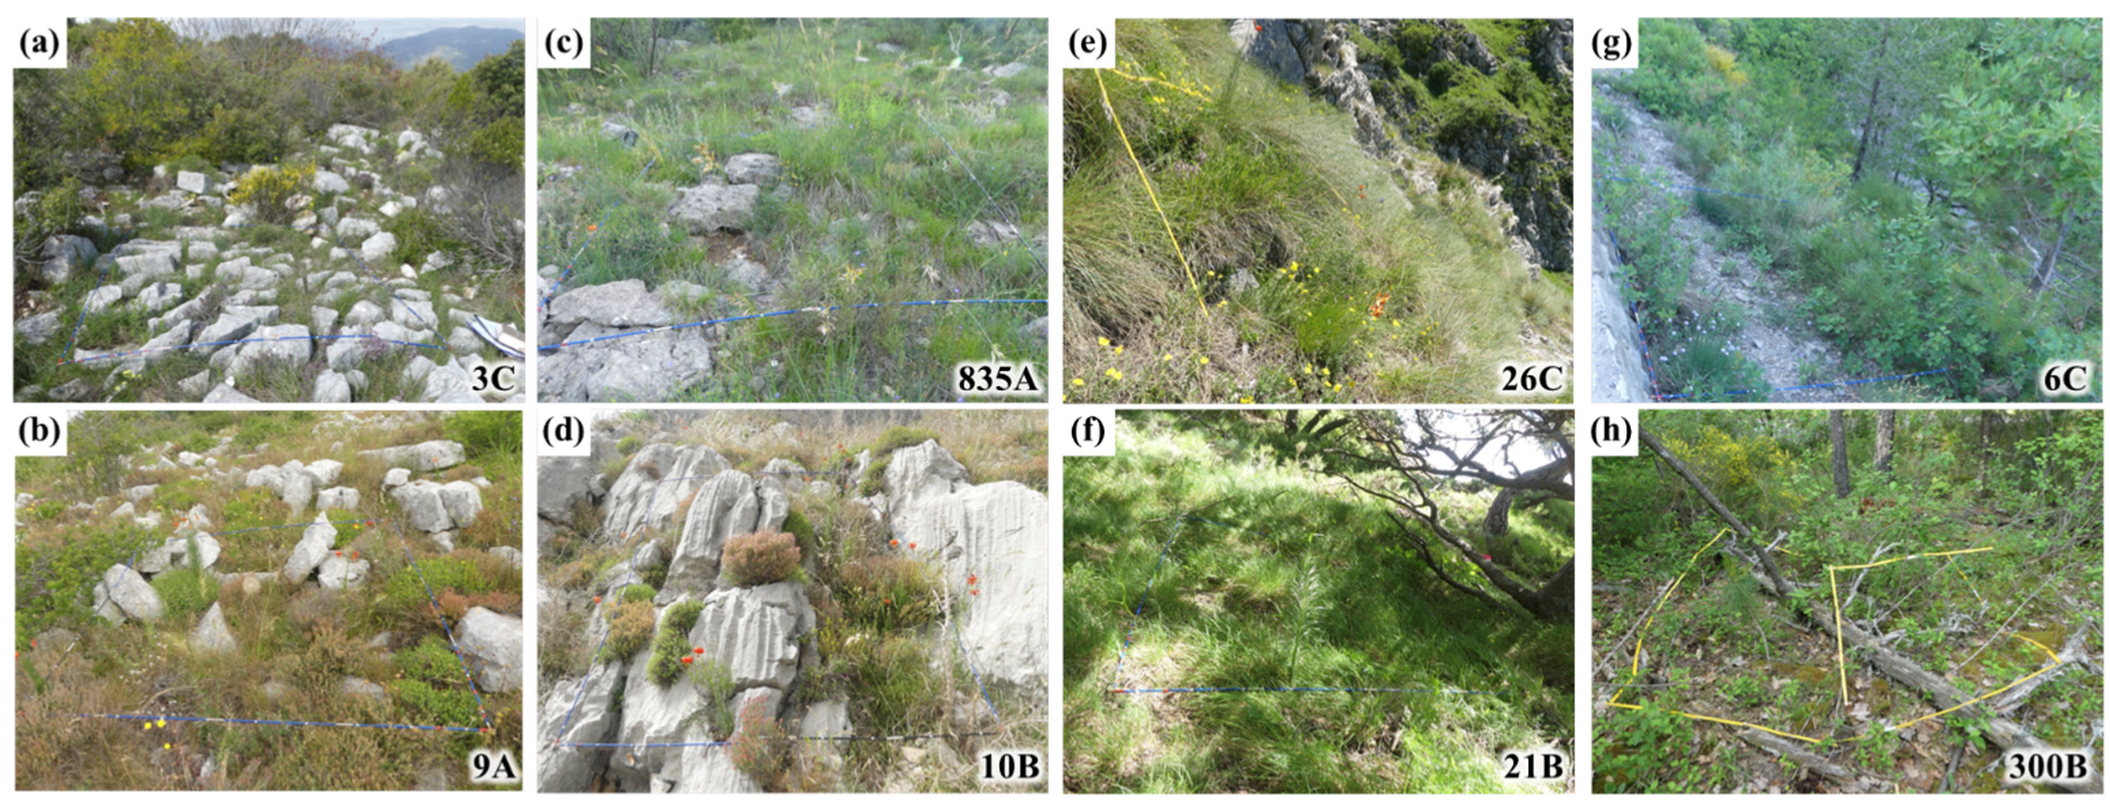
2.2. Micro-Niche Diversity

Four main dimensions revealed by the multiple factor analysis (MFA) describe 53.3% of the micro-niche space occupied by L. pomponium populations. A group of abiotic variables represent major contributions to distinguish clusters of quadrats in the first two dimensions, and a group of biotic variables differentiate quadrat clusters for dimensions 3 and 4. Four main types of micro-niche are identified by hierarchical clustering on principal components (HCPC) applied to these data (Figure 4). A narrative of their main characteristics (Table 1, Figure 5) is as follows.
In micro-niche type 1, L. pomponium occurs in pockets of soil with a high water retention capacity between large blocks of rocks that are stabilised in fairly flat areas with abundant low woody shrubs (Thymus vulgaris, Euphorbia spinosa) and low species diversity typical of Mediterranean scrublands. Eleven quadrats are assigned to this micro-niche type that is almost exclusively present (10 quadrats) in a mid-altitude zone (from 543 to 934 m.a.s.l.).
Micro-niche type 2 is characterised by its mineral nature with a high cover of bedrock and stones. This type of local niche is the most abundant and widely distributed with quadrats that occur across the whole altitudinal gradient, in both Mediterranean zones (to the south) and more temperate mountain zones (north).
Micro-niche type 3 is characterised by high vegetation and litter cover with two abundant grass species, Sesleria caerulea and Helictotrichon sempervirens, which are typical of high-altitude communities [30]. All quadrats that correspond to this type of niche occur at higher altitudes (>1070 m.a.s.l.) in both temperate mountain and Mediterranean zones.
Micro-niche type 4 corresponds to more forested habitats on substrates with variable amounts of gravel, moss, and bare soil with a low water retention capacity. This type of niche does not occur in the two (mid- and high-altitude) Mediterranean bio-climate zones, all 18 quadrats occur in the three more continental, inland bioclimatic zones (low altitude, and mid- and high-altitude temperate mountain zones).

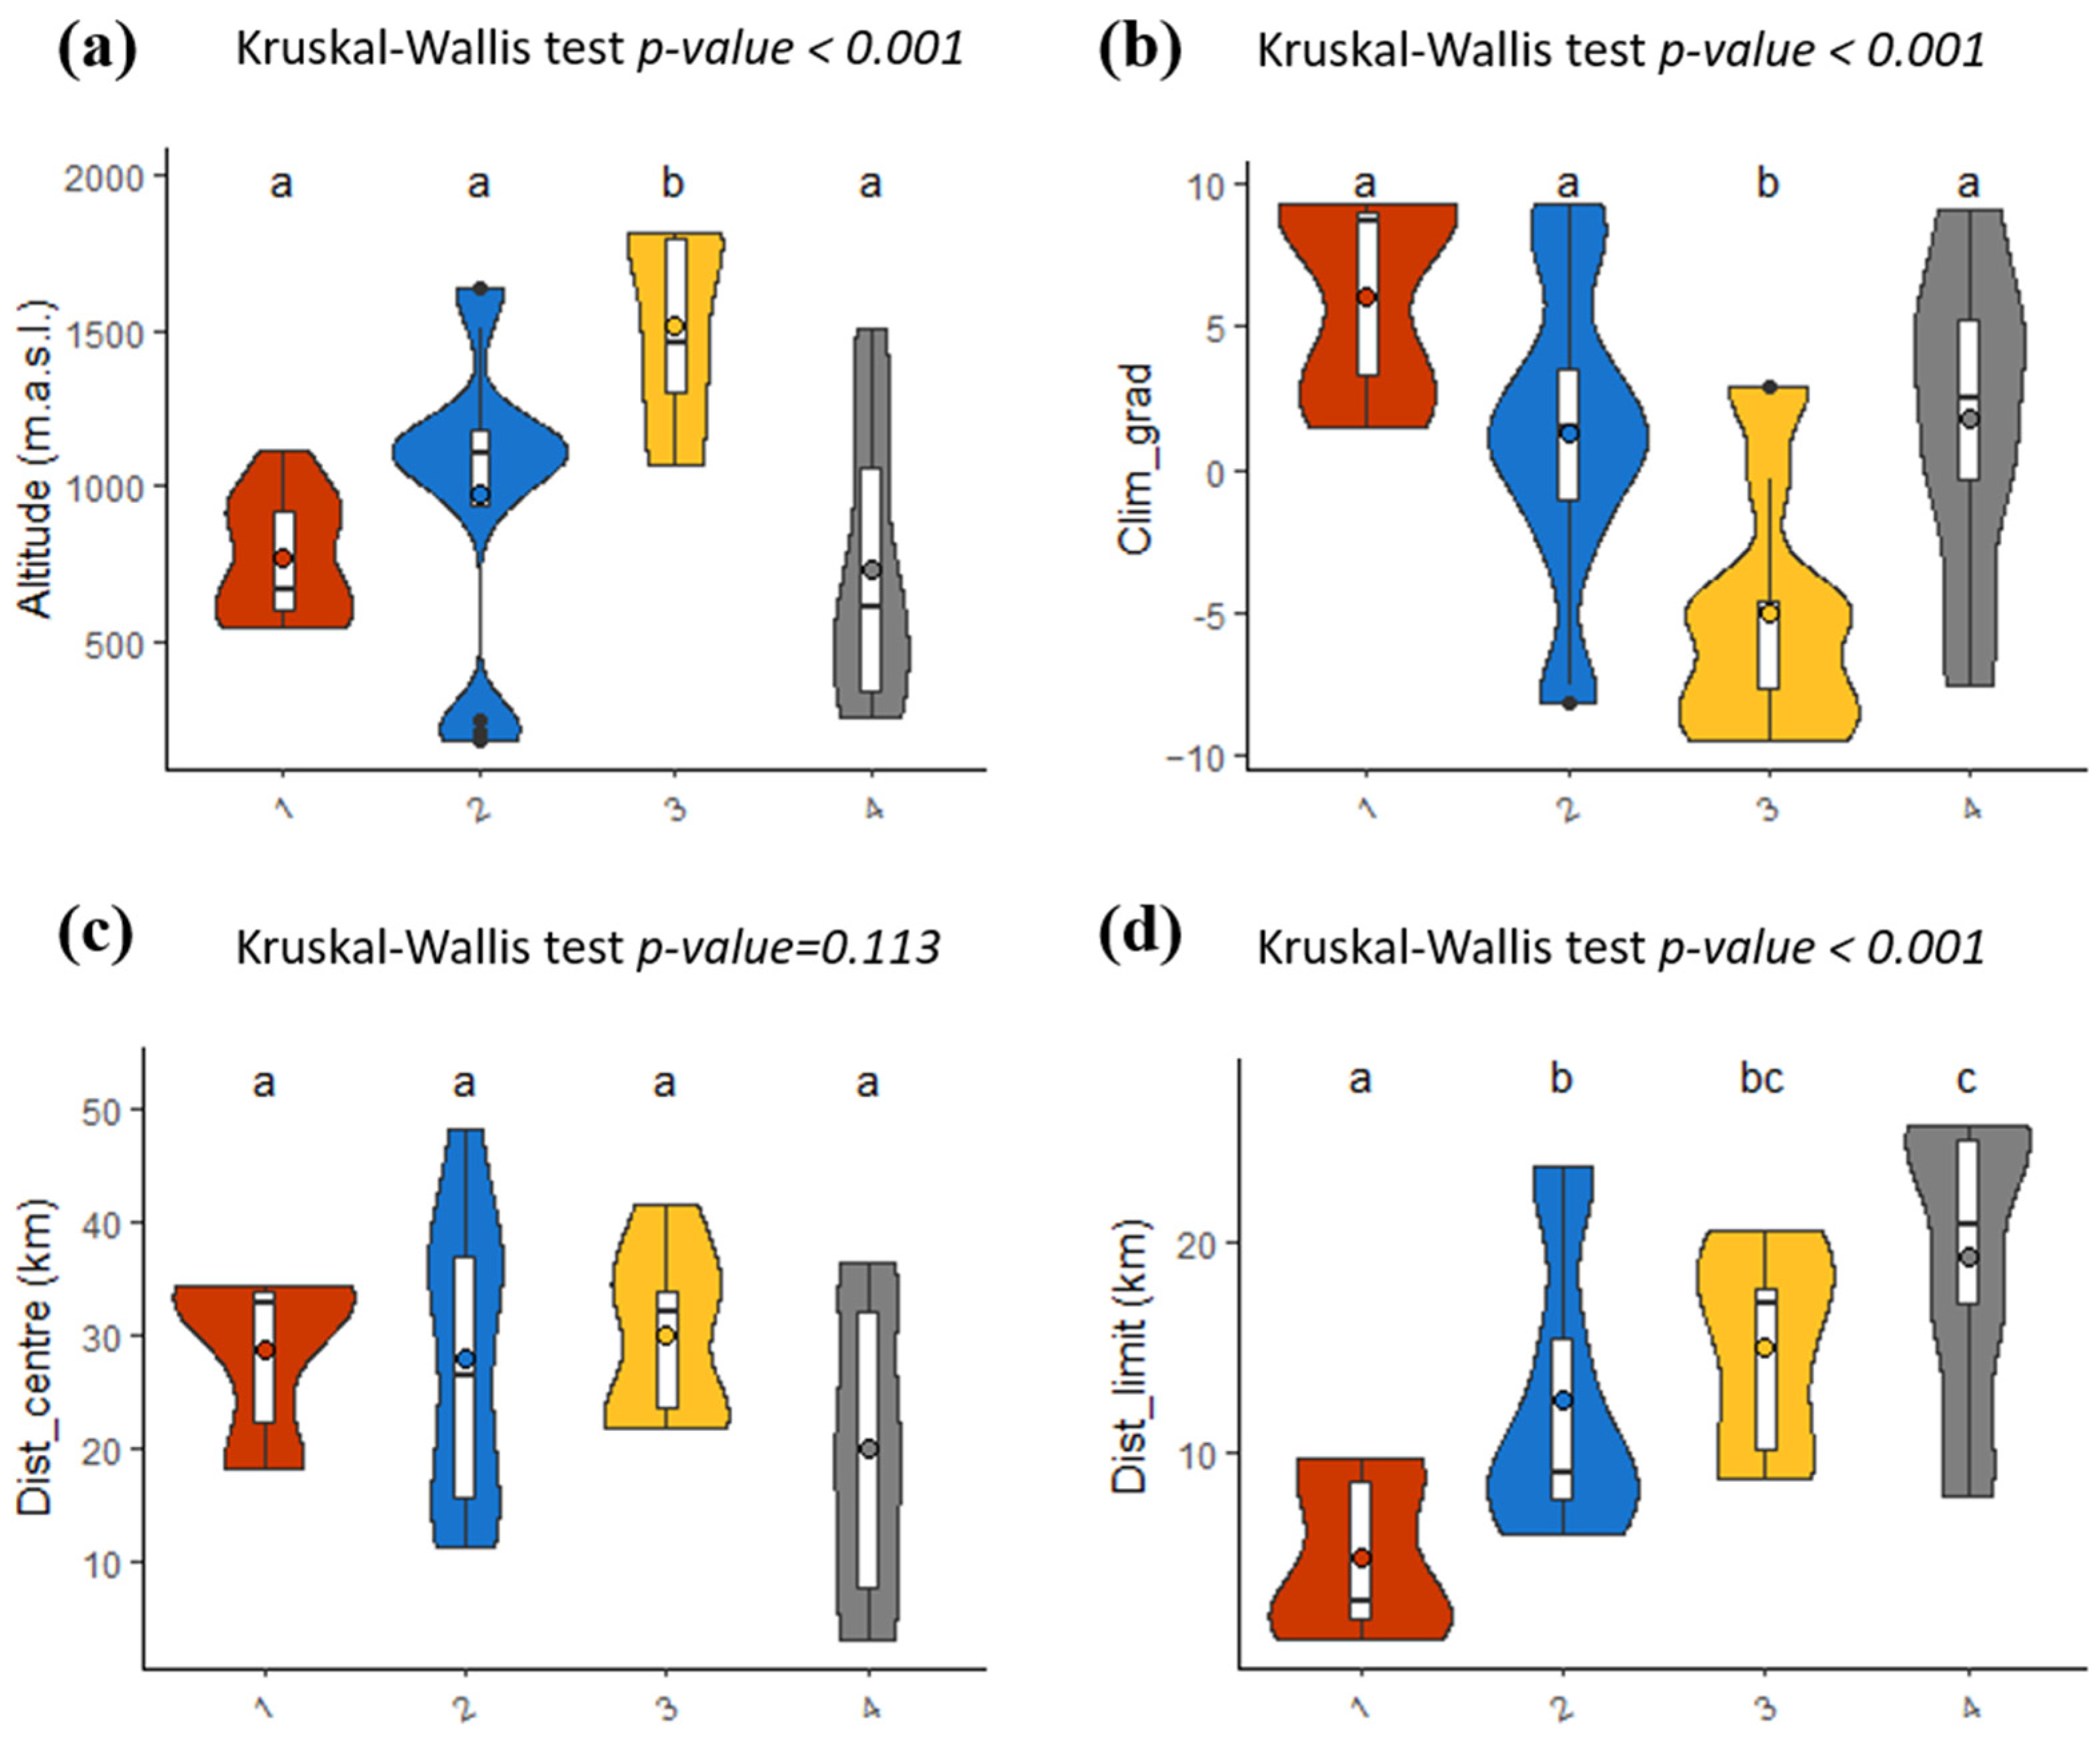
2.3. Marginality and Distribution Limits

The comparison of each of these niche types on climatic and spatial gradients revealed two main results. First, micro-niche type 3 is significantly different in terms of position along ecological gradients compared to other niche types (Figure 6a,b), due to its limitation to high-altitude sites that have a higher amount of winter precipitation and lower maximal temperatures during spring and summer. Second, the four micro-niche types show significant differences in their spatial location in relation to the limits of the species distribution (Figure 6d), a difference that is not however shown in relation to the centre of the distribution (Figure 6c), probably because of the east–west elongated shape of L. pomponium distribution (Figure 1). Niche type 1 is significantly closer to the limits of L. pomponium distribution in the north-west of the study area than the other niche types, and niche type 4 is significantly further away from the distribution limits than all other niche types (Figure 6d). Niche types 2 and 3 have a more overlapping geographic distribution that is spatially intermediate between niche types 1 and 4. It seems that micro-niche diversity is higher further from the distribution limits, where niche types 2, 3 and 4 all occur, than closer to the range limits, where only niche type 1 occurs (Figure 6d).

2.4. Abundance and Phenotype

There was no significant variation in the abundance and phenotype of L. pomponium (where it is present) in the different micro-niche types (Kruskal–Wallis test: p-value > 0.01; pair-wise Wilcoxon tests with Bonferroni adjustment: p-value > 0.05—Supplementary Material Figure S2) despite a slight trend towards fewer flowers and individuals in niche types 3 and 4 (Supplementary Material Figure S3).

2.5. Vegetation Structure

At the site scale, site 300 is different from all other sites due to a higher cover of woody vegetation > 5 m high, young trees < 2 m high, and woody litter. This site also had a high cover of artificial elements (access roads) (Supplementary Material Figure S4a). Other sites form two clusters that show significant differences amongst each other in the HCPC analysis. One cluster contains sites with a lower cover of artificial elements and relatively higher cover of herbaceous vegetation (sites 3, 7, 9, 10, 13, 18, 20, 21, 26, 334, 738, 835, 877, 1148, 1208, 1262), the other cluster presents more signs of human disturbance and less herbaceous vegetation cover (sites 2, 4, 6, 11, 16, 208) (p-value = 0.006 and p-value < 0.001, respectively, for Wilcoxon tests between the two groups, for herbaceous and artificial covers, respectively). The latter sites are also characterised by higher number of flowers per scape and higher mean plant height, but less dense populations. Micro-niche types 3 and 4 tend to have more woody cover than micro-niche 1, as found above (Supplementary Material Figure S4b).

3. Discussion

The results of this study reveal the importance of topographic and fine-scaled niche analyses for our understanding of plant responses to climate variation along altitudinal gradients and provide an empirical illustration of ecological variation on a local scale that is not necessarily linked to distribution limits. Our study aliments perspectives for the conservation management of the study species.

3.1. Climate Change: The Importance of Tracking the Fine-Scaled Niche

Interest in how plants respond to ongoing climatic change has renewed studies of their ecology and evolution along altitudinal gradients. Several studies have already indicated how increasing temperatures may enable the colonisation of higher latitudes and altitudes [15,16,17,31,32,33] or show genetically-based adaptations to relaxed selection pressures (milder winters) on local-environmental gradients [18]. There has, however, been surprisingly little attention paid to the multi-dimensional nature of ecological niche variation along altitudinal gradients. The transition zone between the Mediterranean and Alpine climate regions in the Maritime Alps, with sharp gradients over short distances and a spatial mosaic of local topographic situations [2,20,34,35,36], provides an ideal situation for such studies.
In this region, Lilium pomponium occurs over a wide altitudinal gradient (60–2000 m.a.s.l.) with 90% of known locations between 455 and 1650 m. In terms of altitude, this species is thus primarily a mid-altitude species but with non-negligible numbers of populations at low- and high-altitudes. High- and low-altitude populations may represent relict sites linked to historical climates. This distribution pattern can be observed in many species on different Mediterranean mountain ranges and probably results from repeated phases of migration in relation to climate changes during the glacial and inter-glacial periods of the Pleistocene [2]. Indeed, the Mediterranean region is known to be a micro-refuge of many plant species that often show sharp patterns of genetic differentiation in relation to climate history and local topography [37,38]. The current distribution of L. pomponium may thus be in a state of ongoing change.
An important result of our work is the finding that the mid-altitude sites, where L. pomponium is present, are exposed in all directions, whereas at a high altitude, locations are less often exposed to the north, and at low-altitude sites, rarely exposed to the south. This pattern suggests that L. pomponium is more selective in terms of its local topographic niche at each end of the altitudinal gradient and is rarely found on more north-facing aspects at high altitudes and more south-facing slopes at low altitudes. If this species is to respond to ongoing climate change, one would expect that its colonisation of high-altitude sites will initially favour more southerly (east and west) exposures, and then in later years to colonise sites at high elevation with a more northerly exposure with climate warming. At low altitudes, a trend in migration towards more northerly sites may already be operating, as our data suggest.
The study of fine-scaled ecological requirements revealed the presence of L. pomponium in four main micro-niche types, some of them with specific locations. The presence of L. pomponium, in particular niche types, indicates that it is fundamental to question how altitudinal gradients may interact with local ecological conditions and micro-topography to affect future dispersal and colonisation of mountain habitats, as reported by Mursal et al. [33]. These authors showed that the orchid Platanthera chlorantha occurs on an altitudinal gradient from 588 to 1043 (or more rarely 1300) m.a.s.l. in diverse forest types, where the most favourable conditions for P. chlorantha are temperate, warm, and humid climates, and mountain brownish soils. Niche availability may thus favour response to climate change. In our study, a response to climate change is likely to occur by the species tracking the common niche type 2 that is present across the gradient in altitude, and possible colonisation of the conditions of niche type 3 in high-altitude locations. Niche type 4 may be of less importance in a context of climate change given that it is not currently part of the niche of the study species in the mid- and high-altitude Mediterranean bioclimatic zones, and also the slight trend towards smaller size and abundance of L. pomponium individuals when they are present in this niche type. That said, type 4 is at least as common as, and perhaps more common than, sites of micro-niche type 3 (26% of quadrats for niche type 4 compared to 19% for type 3).
Our results clearly indicate that our study species, and perhaps many other species, will not simply migrate to higher altitude in response to climate change; they will track their localised ecological niche, which remains a rarely studied element of plant responses to changing climates. As Måskiven et al. [4] point out, there may be strong influences of site-specific factors on species presence, which may at least partly over-ride effects from more broad parameters such as altitudinal and environmental variation. Indeed a study of an endemic orchid on the island of La Réunion has reported that diverse local ecological parameters may be at least as important as altitude to explain species presence [39]. In accordance with these authors and others [40], site-specific variation in abiotic factors, such as mineral cover and soil chemistry, as well as local topography and plant community composition interact with more broad-scale climatic gradients to shape species distribution patterns along altitudinal gradients. Our study is in agreement with the findings of these different authors and illustrates that the availability of different niche types occupied by a species may be crucial to their response to ongoing climate change. We thus provide empirical example of one of the findings reported by Grytnes et al. [41], where the habitat preferences of individual species may potentially explain variations in range shifts towards higher elevations with climate warming.

3.2. Ecological and Range Limits, Two Separate Issues

Despite heterogeneity in the spatial location of the four niche types and variations among them in terms of their positions on the altitudinal gradients, there is no correspondence between ecological gradients and the distribution limits of this species. Micro-niche type 1 occurs at mid-altitude and, thus, in relation to the altitude–climate gradient, in macroecologically “central” conditions, but occurs spatially close to the geographic distribution limits of the species in the Maritime Alps. Likewise, micro-niche type 3 occurs primarily at high altitude, closer to the limits of the macroecological gradient (this niche type is also the most distant cluster from all other clusters in the multivariate analysis of microecological variables), but not closer to the distribution limits of the species. Hence, there is no evidence of a correlation between macroecological gradients and geographic range limits.
These results provide a parallel with the previous studies of genetic variability in relation to distribution limits and potential ecologically marginality [27,28]. Casazza et al. [28] insist on the probable effects of local topographic variation that blur any possible relation between genetic variation and distribution limits. They suggest that a decrease of genetic diversity along environmental, but not geographical gradients, may be due to the presence of low-quality habitats in the different parts of the range. This may affect population dynamics and genetics irrespective of distance from the geographical centre of the range. Furthermore, Macrì et al. [27] found no direct relationship between the presence near range limits and phenotypic performance.
In contrast, we found that the diversity of niche types is dramatically less in peripheral populations compared to central populations of L. pomponium. In sites close to the range limits, one primary niche type predominates, whereas further from the distribution limits, three other niche types are more common. Thus, although the trend predicted for genetic diversity to decline towards range limits [29] is not apparent in this species [28], we observed here a decline in the diversity of realised niche conditions near the distribution limits. In addition, one of the niche types is rather unique to peripheral populations, where we have no evidence for poor performance. Papuga et al. [23], in a study of eleven species that had an Ibero-Provençal distribution with central populations in the Iberian Peninsula and peripheral populations in the South of France, reported consistent differences in the fine-scaled niche characteristics (but not the broad habitat type) of the two groups of populations. Despite fine-scaled ecological niche differences in peripheral populations, these authors found no evidence of sub-optimality in these populations. Indeed, the central–peripheral hypothesis (based on a concordance between geographical peripherality and ecological marginality) that environmental conditions become harsher towards the limits of a species distribution is not followed in many cases [29]. These authors, in their review of this subject, thus cast doubt on the pertinence of a main assumption of the centre–periphery hypothesis. For genetic diversity [28] and ecological niche characteristics (this study), Lilium pomponium provides another example that does not support the centre–periphery hypothesis. Localised complex topography in a mosaic physical and biotic landscape may be a major element of these discrepancies.

3.3. Perspectives for Conservation Management

Given that migration to higher altitudes basically means colonizing conditions in a spatially reduced area relative to low altitudes [42], the conservation of high-altitude non-north-facing sites, with one or another of the different niche types detected in this study, will be important for future persistence and colonization of L. pomponium. This is particularly important for this species given that models based uniquely on climatic variables illustrate its relative sensitivity to future projected climate changes [43].
Slight differences in abundance and plant size illustrate that two of the niche types may represent sub-optimal niche conditions (ecological marginality) in relation to local environmental conditions. The sites in question appear to be subject to forest closures in mid- and high-altitude sites less exposed to Mediterranean climate conditions. An important issue here concerns micro-niche type 3, which is the most representative of high-altitude sites and, thus, the destination for population colonization in high elevation locations in a context of climate change. The high-altitude sites also tend to have plants that bear smaller flowers [27] that could also represent a sign of poorer viability. However, L. pomponium densities and the number of flowers per plant tend to be lower in this niche type, probably as a result of forest closure. Hence, colonization potential may in turn be quite low. Loss of potential habitats due to forest closures at high altitudes could reduce the possible response of this species to climate change. A more complete study of the issue of forest closure and its potential impact on the abundance of this species at multiple locations across the gradient is necessary.
In future work, field studies in the Mercantour National Park could be conducted, to assess population status and micro-niche types in the core zone of the park that has a strict regulatory conservation status relative to the non-regulated adhesion area. Such work could identify sites that may require management in terms of forest closure and localised disturbance. In addition, at the regional scale, it will be useful to evaluate the status of populations at the landscape scale, using a threat criteria that assesses the relative percentage of natural habitats or urbanisation, the fragmentation of populations, and the area of a population in a protected area, as conducted for several other species in the South of France [44].

4. Materials and Methods

4.1. Study Species and Area

Lilium pomponium L. (Liliaceae) is a perennial orophyte endemic to the Maritime and Ligurian Alps [26]. Over its range, L. pomponium is quite frequent, but often scattered and dispersed in small populations. The species grows on a calcareous substrate across a wide altitudinal range from 60 to 2000 m.a.s.l. It primarily occurs in garrigues and rocky grasslands in different types of vegetation communities, including the following phytosociological associations: Helianthemo italici–Aphyllanthion monspeliensis, Lavandulo angustifoliae–Genistion cinereae, and Avenion sempervirentis [26].

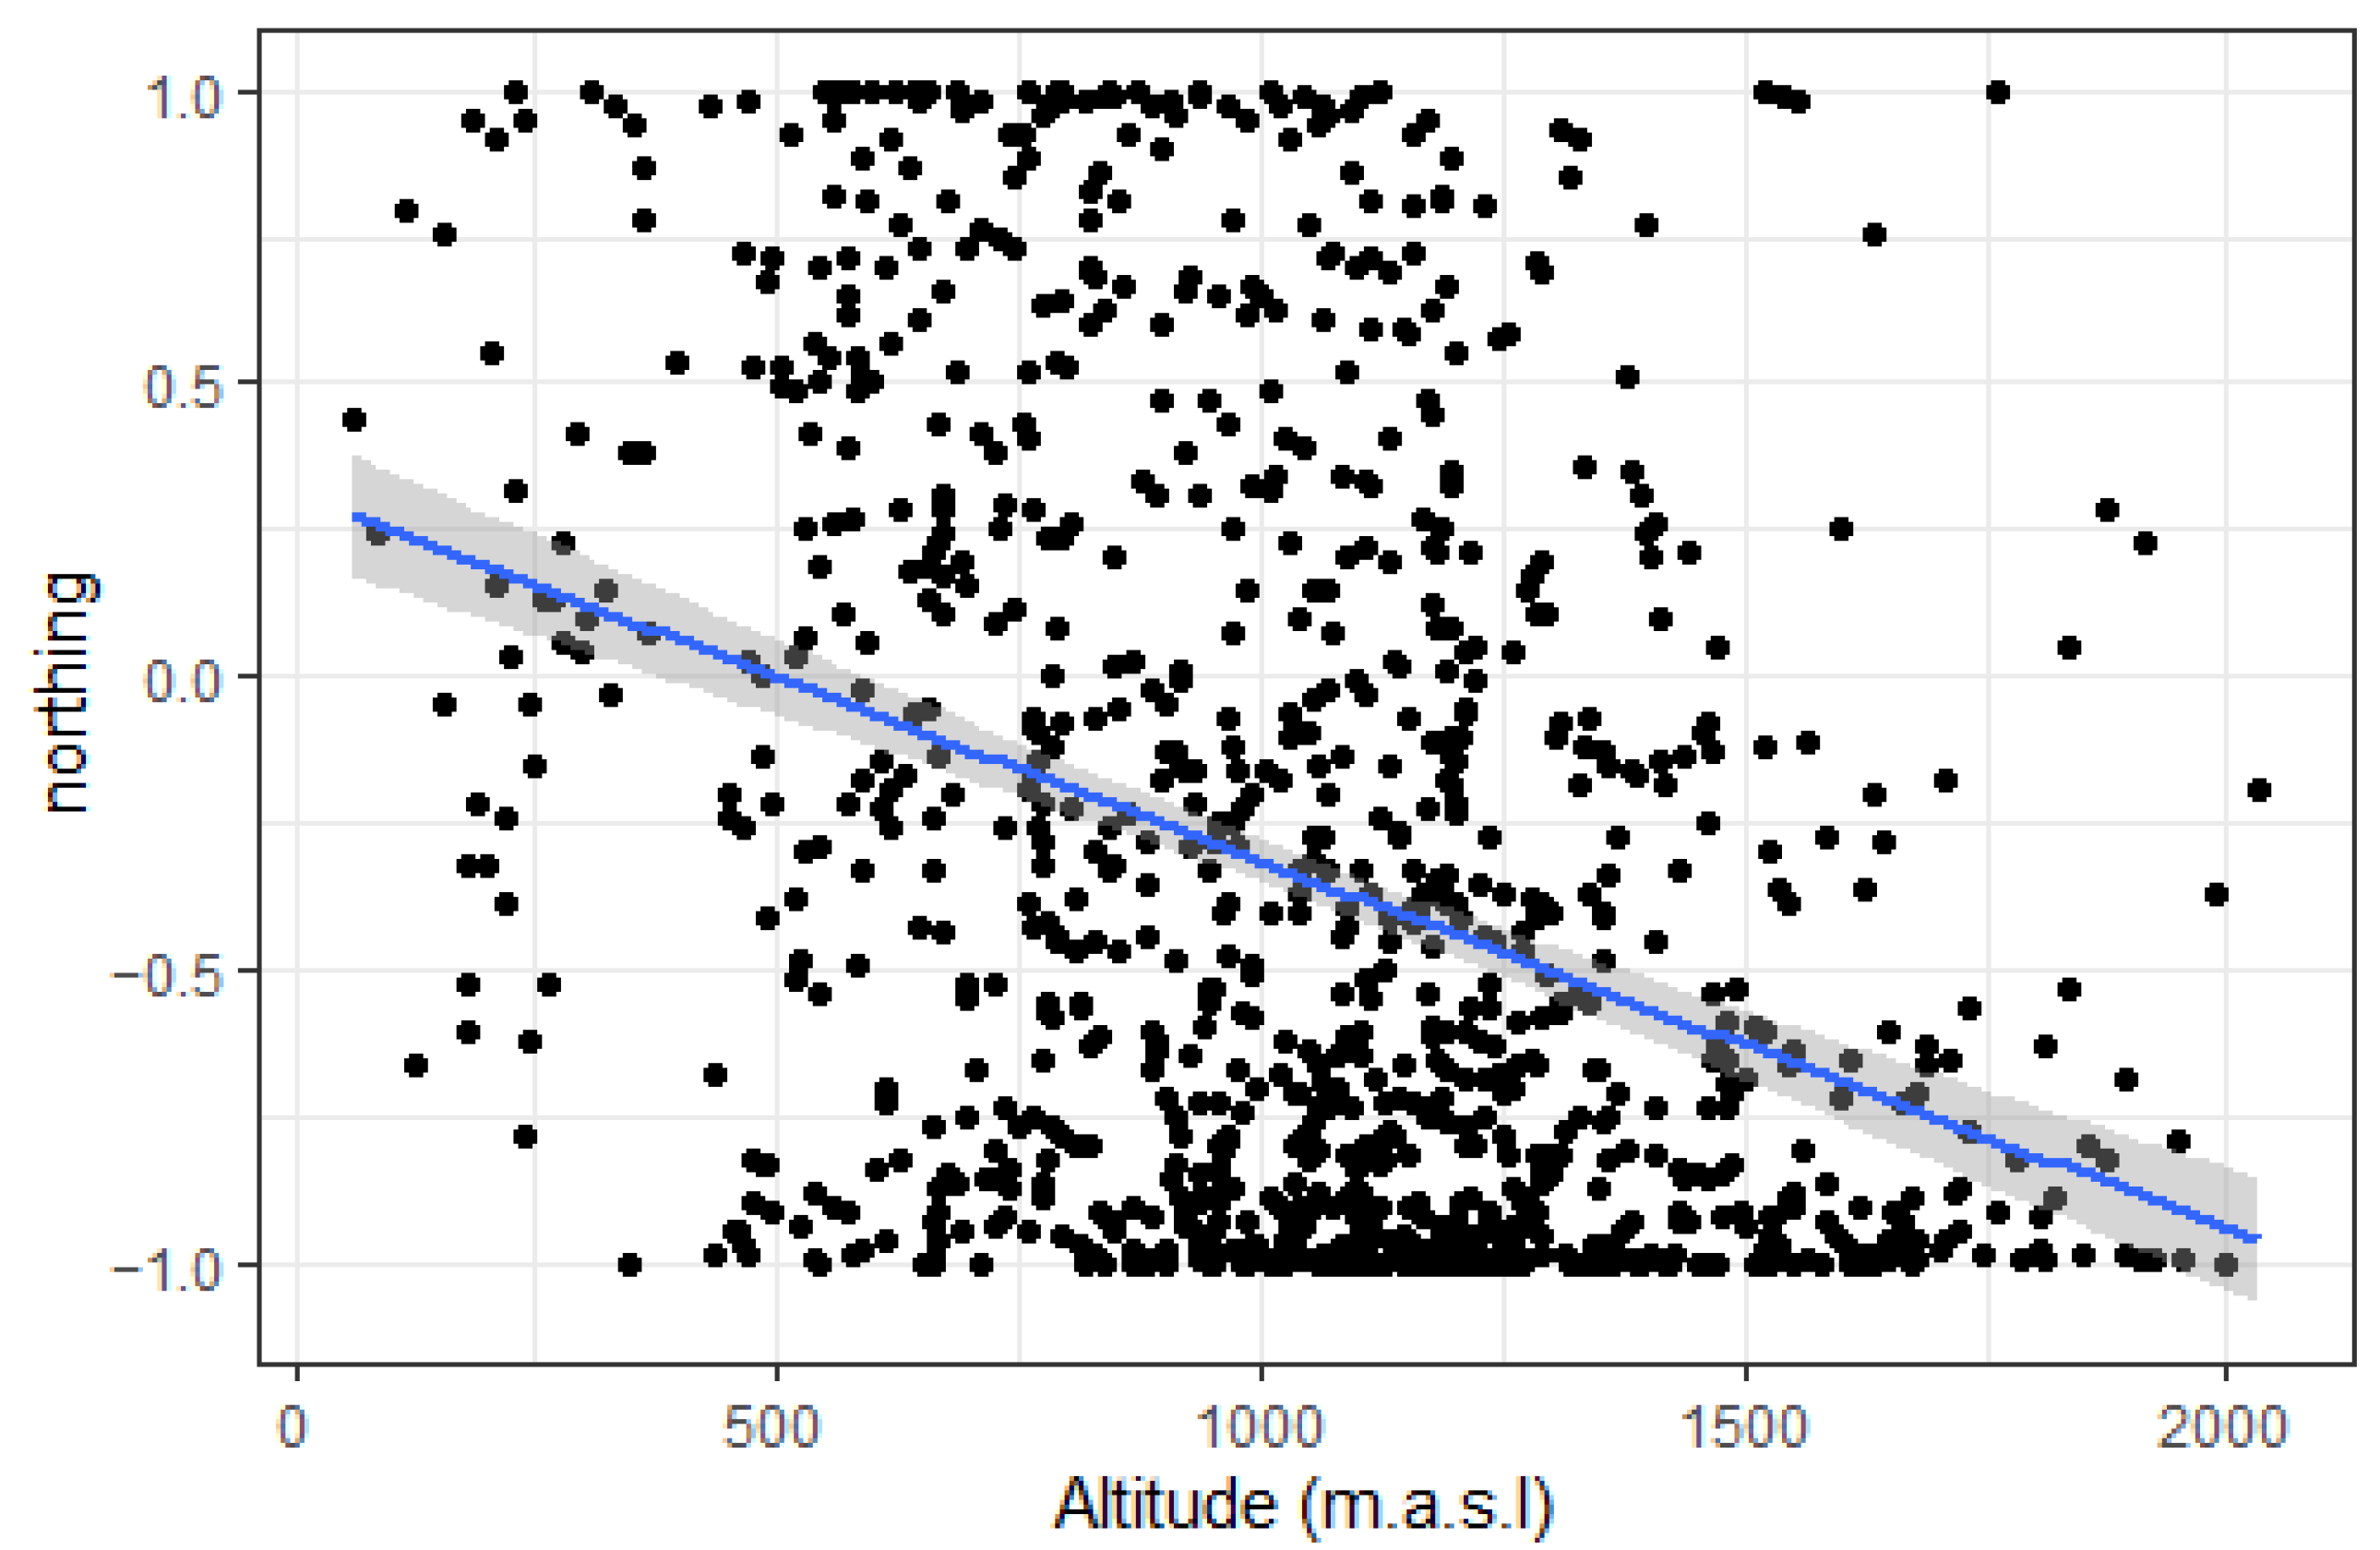
4.2. Altitudinal Variation in Topographic Parameters

Occurrences of all known populations were extracted from the SILENE database of the “conservatoire botanique national méditerranéen de porquerolles” (France) (http://www.silene.eu/index.php?cont=accueil) [45] (accessed on 3 February 2021). Only locations posterior to 1980 were considered, to avoid occurrences not collected from a GPS or potentially extinct populations. Some locations were added from previous studies on this species [27,28]. The database used here contained 1026 occurrences.
Topographic parameters were derived from a digital elevation model (DEM) (RGE Alti ® version 2.0 IGN https://geoservices.ign.fr/documentation/diffusion/telechargement-donnees-libres.html) [46] (accessed on 5 September 2020). A spatial resolution of 5 m appeared as a best compromise. This scale is precise enough to study fine-scale niche variations compared to a 25 m resolution, and at the same time incorporate the lack of precision of geo-localization data for sites of presence in the SILENE database. Altitude, aspect, slope, and a standardised topographic position index (TPI) were extracted or calculated for all of the L. pomponium locations in the database using the “terrain” function in the R package Raster [47]. Easting and northing were calculated as sin(aspect) and cos(aspect), respectively.
We examined the relationship between altitude and topographic parameters (slope, easting, northing, standardised topographic position index) for all known L. pomponium locations, with simple linear models using the R function lm() from the package stats [48].

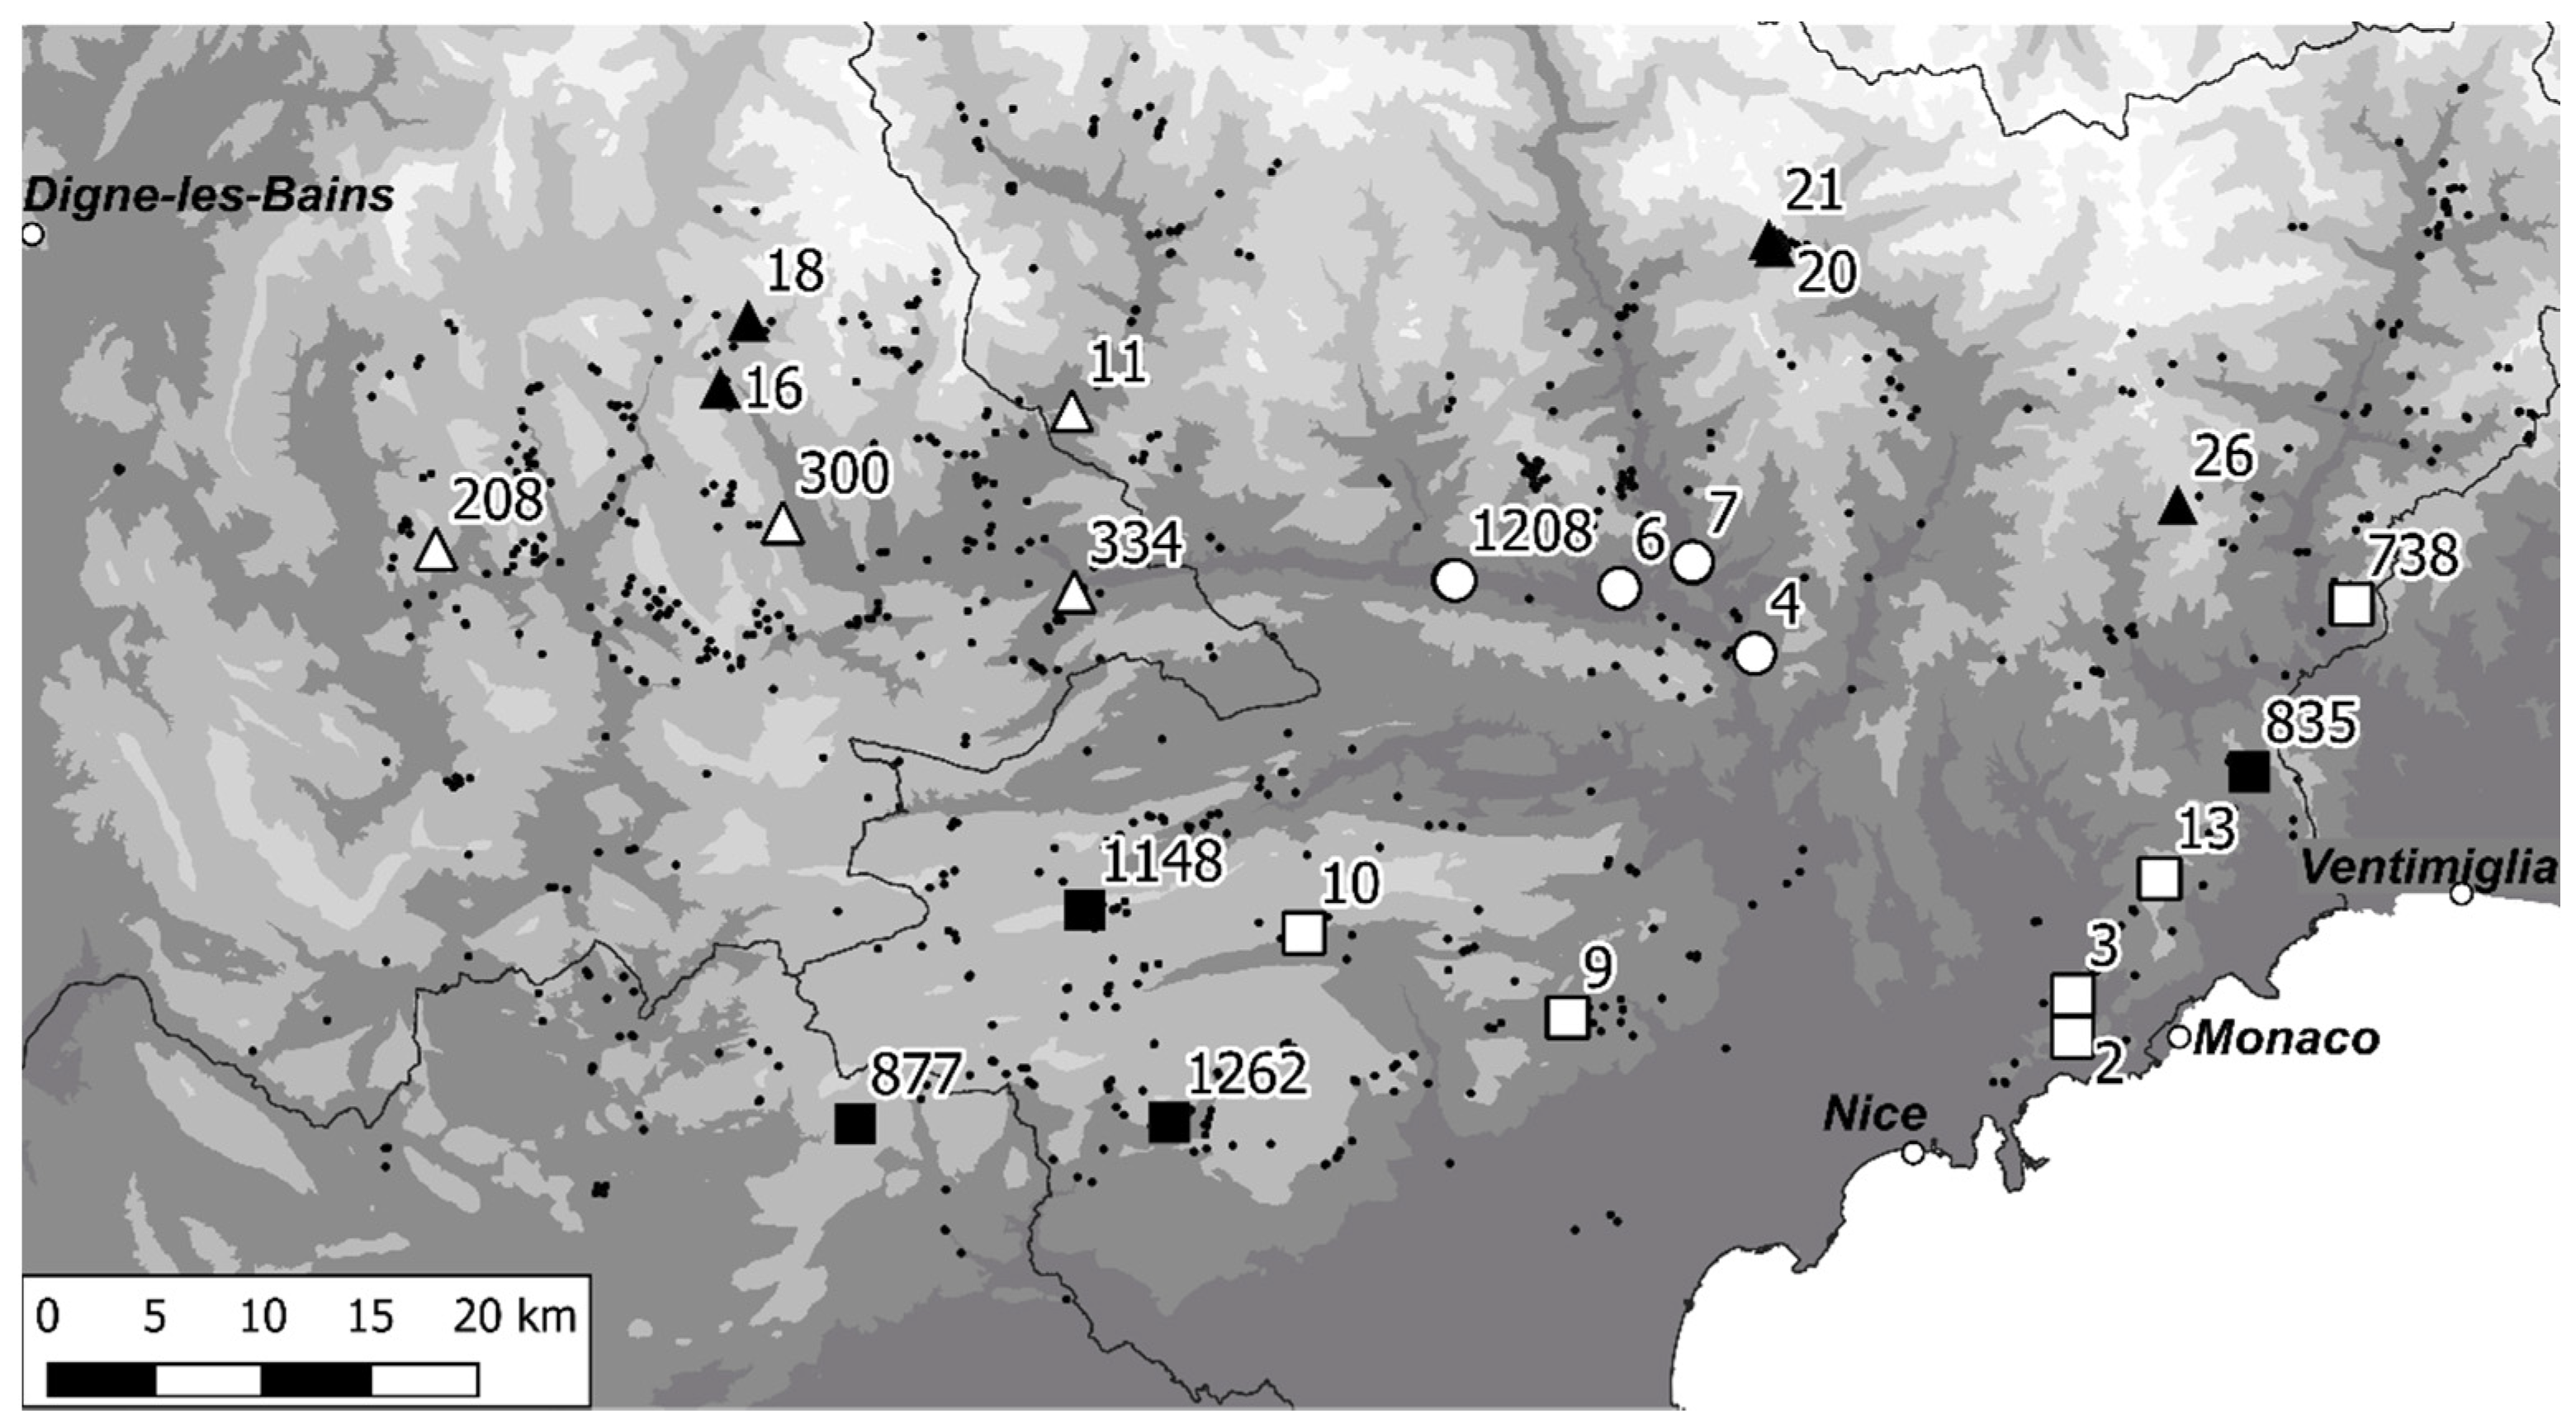
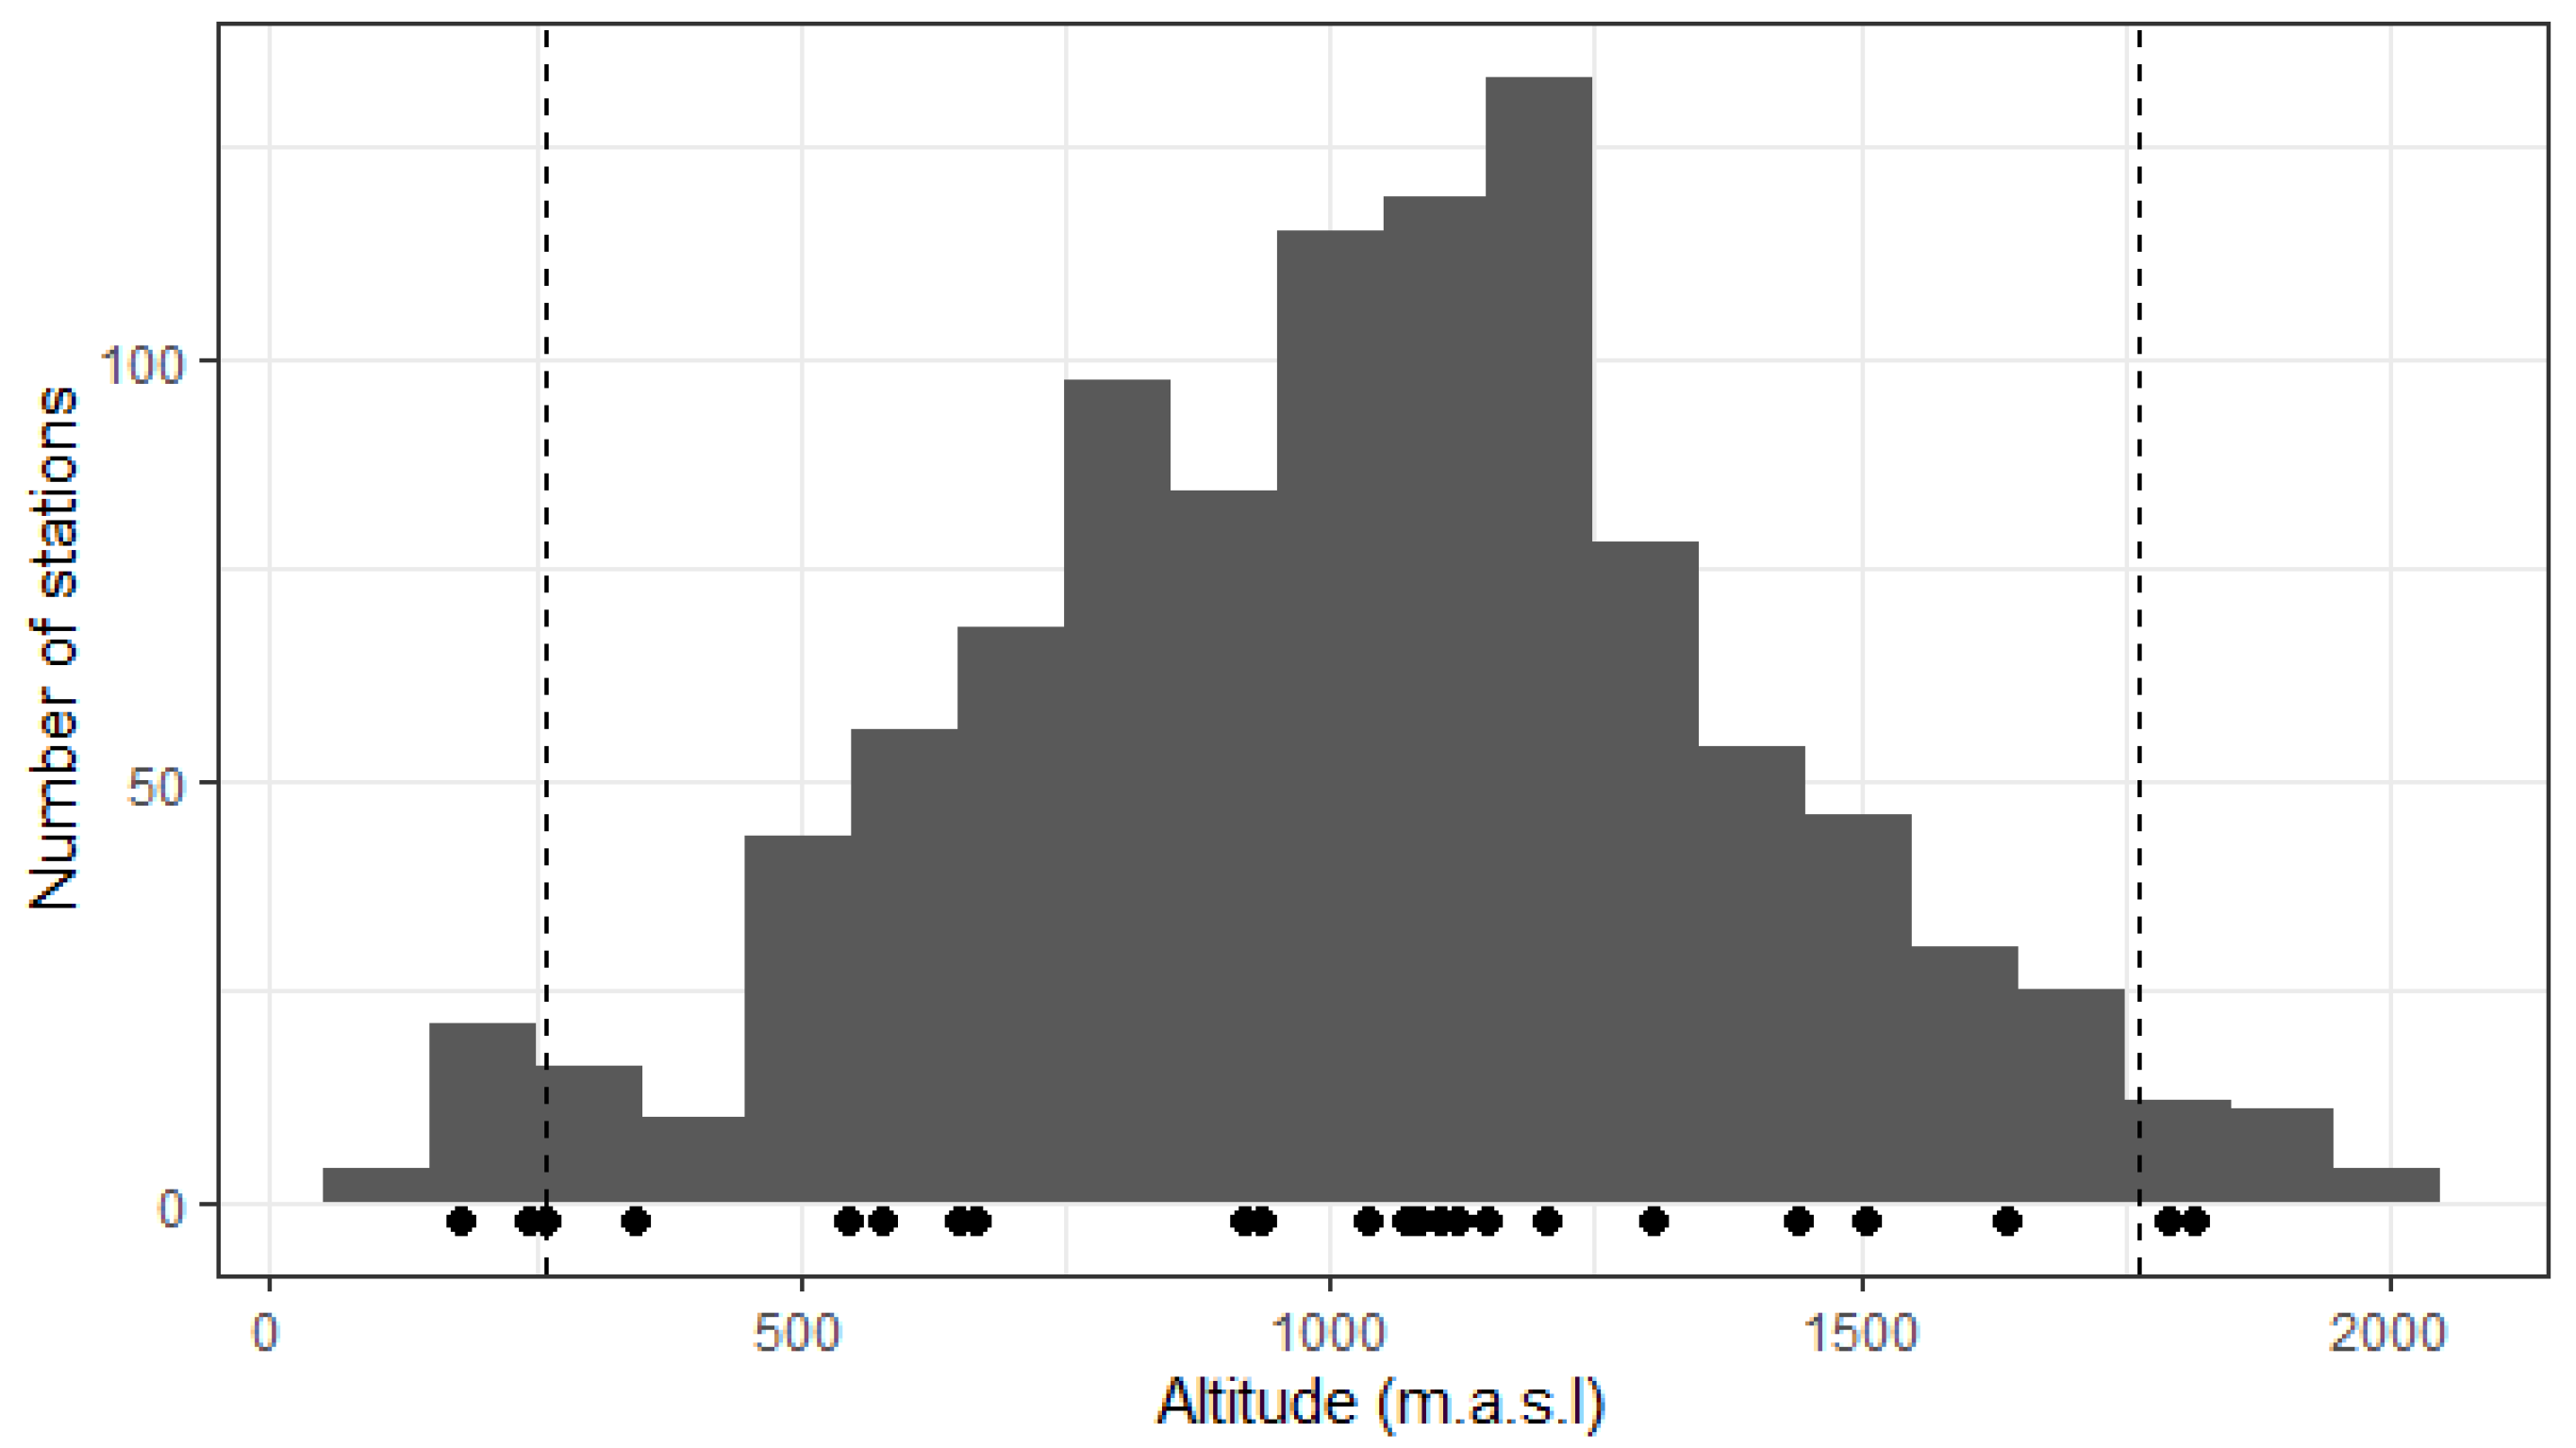
4.3. Population Sampling along Altitudinal and Bioclimatic Gradients

To construct a bioclimatic zonation of the study area in relation to the altitudinal gradient, we obtained temperature and precipitation data for the twenty-five weather stations that exist across the distribution of the study species. Nineteen bioclimatic variables were computed with the R function biovars from the package dismo [49], and meteorological stations were assigned a bioclimatic position within one of five major clusters (Supplementary Material Figure S1, Table 2) using the hierarchical clustering on principal components (HCPC) function in the R package FactoMineR [50]. The geographical position of the twenty-five meteorological stations and their altitudes revealed two major altitudinal gradients in the study region. Both gradients have common existence in the low-altitude situation of cluster 5 (<350 m). From this cluster, one gradient includes clusters 3 (350–1100 m) and 1 (>1100 m) that occurs primarily in the more temperate northern and western parts of the study area. The second gradient includes clusters 4 (350–1100 m) and 2 (>890 m), encompassing weather stations that are almost exclusively in the southern (and eastern) parts of the study area, closer to the Mediterranean Sea. These two altitudinal trends differ primarily in relation to precipitation (Supplementary Material Table S1). There are thus two main bioclimatic gradients, one in the southern and eastern area of the species’ distribution that is mainly under a Mediterranean climate influence, and a second altitudinal gradient in the northern and western sector, under a more temperate mountain influence. We used the five clusters as a proxy for bioclimatic zones in the study area to which the known locations of L. pomponium were assigned: low altitude (<350 m), mid-altitude Mediterranean (350–1100 m), and high-altitude Mediterranean (>1100 m) zones in the south and east of the region, and mid-altitude temperate mountain (350–1100 m) and high-altitude temperate mountain (>1100 m) zones in the west and north of the study species’ distribution.
These groups of populations were used to stratify site selection to study the ecological niche. Five locations of L. pomponium in each of the five bioclimatic groups were randomly selected, favouring locations used in previous studies [27,28]. Locations highly isolated from other sites were not considered in the selection, to allow us to rapidly select a replacement site if the randomly selected site could not be sampled due to site destruction, too few individuals, or simply inaccessibility. The 25 selected locations were visited during spring 2021, from mid-May to the 30 June, depending on population phenology. Data were collected at 23 of these sites: two were abandoned due to problems of access and population size (Table 2, Figure 1).

4.4. Micro-Niche Characterization

Three 4 m2 quadrats were randomly selected in high density patches of the study species in each site. The three quadrats were at least 5 m apart in an area with a maximum radius of 20 m. Following previous studies [23], we measured the slope and exposure, and determined the identity of all species present. We then quantified the cover of ecological parameters using contact point data obtained for a grid of 100 contact points in each 4 m2 quadrat, i.e., one contact point every 20 cm. The following elements were assessed: bedrock, blocks (>25 cm), stones (2.5–25 cm), gravel (0.5–2.5 cm), bare soil, lichen, moss, herbaceous, and woody litter, and living plants. Each contacted plant species was identified.
A soil sample (<10 cm) was obtained for each quadrat. Soils were transferred to the laboratory in paper bags and dried at 40 °C for at least 48 h, sieved through a 2 mm grill, and stored in a cool room prior to analysis. Conductivity (conduc), expressed in milli-siemens per centimetre) and pH (pH) were measured using a Thermo Scientific Gallery discrete analyser with electrochemical units. After mixing 15 g of dry soil with 30 mL of water, we blended the solution during a 30 min period, then separated phases using a centrifuge (15 min), and measured values in the supernatant at room temperature (circa 20 °C). Water retention potential (WRP) is the percentage of water lost after drying wet soil for 48 h at 40 °C. Water retention capacity (WRC) was then calculated as the percentage of water remaining in this previously 40 °C-dried soil by a repeated drying of the sample at 105 °C for 5 h. Organic matter (OM) was estimated as the percentage of matter lost after burning a dried sample at 500 °C during 5 h. The percentages of carbon (pC) and nitrogen (pN) were determined using a Thermo Finnigan Flash EA 1112 series on 50 mg samples grinded with a crusher (3 min, frequency p 30). C:N ratio was calculated with these values.
Micro-niche characteristics were combined in a data-frame of quadrat x variables. Variables were structured in four groups: topographic, edaphic, abiotic/soil cover, and biotic characteristics (Supplementary Material Table S2), and analysed through multiple factor analysis (MFA) by using the R package Ade4 [51]. Different types of micro-niches were defined using the clusters identified by the HCPC analysis mentioned above.

4.5. Ecological Gradients and Distribution Limits

Two metrics were used to assess the central/marginal positions of sites on ecological gradients: altitude and climate (combination of monthly precipitation and minimal and maximal temperature). The two parameters are correlated (correlation coefficient = −0.9), but the second is the more informative. The climatic gradient (Clim_grad) is the main axis of a principal component analysis of the monthly meteorological data, computed from the model developed by Martin, Carrega, Adnes [52], using the two metrics.
To assess niche differences in relation to possible variations between geographically central and peripheral populations of L. pomponium, three metrics were used: Euclidian distance to the centre of the distribution (Dist_centre), Euclidian distance to the limit of the distribution (Dist_limit), and the ratio of these two distances (Dist_ratio) [28].

4.6. Phenotypic Traits

To assess phenotypic variations among populations, three traits were measured on twenty individuals in each site (four individuals randomly selected in each quadrat, and eight additional individuals outside the quadrats in the same site): vegetative height (Hveg), total height (Htot), and number of flowers (Nflo). We calculated the mean and standard variations for each trait in each quadrat and site.

4.7. Local Abundance

At the micro-niche scale (i.e., 4 m2 quadrats), the local abundance of L. pomponium was quantified by its frequency of presence in the 100 20 × 20 cm cells of each quadrat. At the site scale, we quantified the presence/absence of individuals in forty 1 m2 quadrats in the immediate area of the three micro-niche quadrats. These 1 m2 quadrats were placed every 2 m on four 20 m long transects extending north, south, east, and west from the barycentre of the three micro-niche quadrats. The 1 m2 quadrats were used to assess the degree of artificialization and colonisation by woody plants. To do so, we assessed the percentage cover of each woody strata in the site by the presence/absence in the forty 1 m2 quadrats of artificial elements, woody litter, herbaceous vegetation, woody vegetation <2 m high (making a distinction between young trees and other woody species), woody vegetation 2–5 m high, and woody vegetation >5 m high.
All statistical analyses were conducted with R 4.1.1. [48], using packages cited in the text above.

Supplementary Materials

The following supporting information can be downloaded at: https://www.mdpi.com/article/10.3390/plants11060833/s1. Table S1: Spatial coordinates and altitude of the 25 meteorological stations used to define bioclimatic zones for stratified sampling. Figure S1: Multivariate analysis of 19 bioclimatic variables from 25 meteorological stations (PCA–2 main axes), and clustering of the stations from HCPC. Table S2: Studied gradients and micro-niche characteristics. Figure S2: Local abundance and mean phenotype for each quadrat depending on its micro-niche type. Figure S3: Local abundance and mean number of flowers for each quadrat depending on its micro-niche type. Figure S4: Vegetation structure and artificialization level for sampled locations of L. pomponium, evaluated at the site scale.

Author Contributions

Conceptualization, N.F., G.C. and J.D.T.; data curation, N.F. and P.G.; formal analysis, N.F. and P.G.; funding acquisition, P.G. and J.D.T.; methodology, N.F. and P.G.; supervision, P.G. and J.D.T.; writing–original draft, N.F. and J.D.T.; writing—review and editing, N.F., P.G., G.C. and J.D.T. All authors have read and agreed to the published version of the manuscript.

Funding

This work is part of the programme TRANECOL Transitions écologiques et flore protégée: la gestion conservatoire à l’échelle de la niche, funded by the Office Français pour la Biodiversité & the CeMEB (Montpellier).

Institutional Review Board Statement

Not applicable.

Informed Consent Statement

Not applicable.

Data Availability Statement

Not applicable.

Acknowledgments

We thank the “conservatoire botanique national méditerranéen” for access to data; Katia Diadema for advice on population sampling; the technical staff of the Plateforme d’Analyse Chimique en Ecologie du CeMEB based at the CEFE; Cyllène Chatellier, Raphaëlle Leclerc, and Virginie Pons for the technical support; and Guillaume Papuga and Fréderic Médail for the helpful discussions of the study in general.

Conflicts of Interest

The authors declare no conflict of interest.

References

  1. Kessler, M. Elevational Gradients in Species Richness and Endemism of Selected Plant Groups in the Central Bolivian Andes. Plant Ecol. 2000, 149, 181–193. [Google Scholar] [CrossRef]
  2. Thompson, J.D. Plant Evolution in the Mediterranean: Insights for Conservation, 2nd ed.; Oxford University Press: New York, NY, USA, 2020; ISBN 978-0-19-883514-1. [Google Scholar]
  3. Di Biase, L.; Pace, L.; Mantoni, C.; Fattorini, S. Variations in Plant Richness, Biogeographical Composition, and Life Forms along an Elevational Gradient in a Mediterranean Mountain. Plants 2021, 10, 2090. [Google Scholar] [CrossRef] [PubMed]
  4. Måsviken, J.; Dalerum, F.; Cousins, S.A.O. Contrasting Altitudinal Variation of Alpine Plant Communities along the Swedish Mountains. Ecol. Evol. 2020, 10, 4838–4853. [Google Scholar] [CrossRef] [PubMed]
  5. Thompson, J.D.; Hutchinson, I. Cohabitation of Species in an Artificial Grass-Legume Community on Ski-Slopes on Whistler Mountain, British Columbia, Canada. J. Appl. Ecol. 1986, 23, 239–250. [Google Scholar] [CrossRef]
  6. Gómez, J.M.; Zamora, R. Generalization vs. Specialization in the Pollination System of Hormathophylla Spinosa (Cruciferae). Ecology 1999, 80, 796–805. [Google Scholar] [CrossRef]
  7. Black, H.N.; Harrison, J.D.G.; Cron, G.V. Do Breeding System and Pollen Limitation Vary with Altitude in the Widespread Herb, Cineraria erodioides (Asteraceae)? S. Afr. J. Bot. 2019, 121, 377–385. [Google Scholar] [CrossRef]
  8. Totland, Ø. Environment-Dependent Pollen Limitation and Selection on Floral Traits in an Alpine Species. Ecology 2001, 82, 2233–2244. [Google Scholar] [CrossRef]
  9. Pailler, T.; Humeau, L.; Figier, J.; Thompson, J.D. Reproductive Trait Variation in the Functionally Dioecious and Morphologically Heterostylous Island Endemic Chassalia corallioides (Rubiaceae). Biol. J. Linn. Soc. 1998, 64, 297–313. [Google Scholar] [CrossRef]
  10. Alonso, C. Pollination Success across an Elevation and Sex Ratio Gradient in Gynodioecious Daphne laureola. Am. J. Bot. 2005, 92, 1264–1269. [Google Scholar] [CrossRef] [Green Version]
  11. Wagner, J.; Lechleitner, M.; Hosp, D. Pollen Limitation Is Not the Rule in Nival Plants: A Study from the European Central Alps. Am. J. Bot. 2016, 103, 375–387. [Google Scholar] [CrossRef] [PubMed] [Green Version]
  12. Vitousek, P.M.; Matson, P.A.; Turner, D.R. Elevational and Age Gradients in Hawaiian Montane Rainforest: Foliar and Soil Nutrients. Oecologia 1988, 77, 565–570. [Google Scholar] [CrossRef]
  13. Todorović, B.; Stevanović, B. Adaptive Characteristics of the Endemic Species Satureja horvatii Šilić (Lamiaceae) in Mountain-Mediterranean and Mediterranean Habitats. Bot. J. Linn. Soc. 1994, 114, 367–376. [Google Scholar] [CrossRef]
  14. Liu, W.; Zheng, L.; Qi, D. Variation in Leaf Traits at Different Altitudes Reflects the Adaptive Strategy of Plants to Environmental Changes. Ecol. Evol. 2020, 10, 8166–8175. [Google Scholar] [CrossRef] [PubMed]
  15. Walther, G.-R.; Beißner, S.; Burga, C.A. Trends in the Upward Shift of Alpine Plants. J. Veg. Sci. 2005, 16, 541–548. [Google Scholar] [CrossRef]
  16. Walther, G.-R.; Post, E.; Convey, P.; Menzel, A.; Parmesan, C.; Beebee, T.J.C.; Fromentin, J.-M.; Hoegh-Guldberg, O.; Bairlein, F. Ecological Responses to Recent Climate Change. Nature 2002, 416, 389–395. [Google Scholar] [CrossRef] [PubMed]
  17. Kelly, A.E.; Goulden, M.L. Rapid Shifts in Plant Distribution with Recent Climate Change. Proc. Natl. Acad. Sci. USA 2008, 105, 11823–11826. [Google Scholar] [CrossRef] [PubMed] [Green Version]
  18. Thompson, J.; Charpentier, A.; Bouguet, G.; Charmasson, F.; Roset, S.; Buatois, B.; Vernet, P.; Gouyon, P.-H. Evolution of a Genetic Polymorphism with Climate Change in a Mediterranean Landscape. Proc. Natl. Acad. Sci. USA 2013, 110, 2893–2897. [Google Scholar] [CrossRef] [Green Version]
  19. Emberger, L. La Végétation de La Région Méditerranéenne Essai d’une Classification Des Groupements Végétaux. Rev. Générale Bot. 1930, 42, 641–662. [Google Scholar]
  20. Ozenda, P. Les Limites de La Végétation Méditerranéenne Dans Les Alpes Maritimes. Bull. Société Bot. Fr. 1950, 97, 156–164. [Google Scholar] [CrossRef] [Green Version]
  21. Rivas-Martinez, S. Etages bioclimatiques, secteurs chorologiques et séries de végétation de l’Espagne méditerranéenne. Ecol. Mediterr. 1982, 8, 275–288. [Google Scholar] [CrossRef]
  22. Lavergne, S.; Thompson, J.D.; Garnier, E.; Debussche, M. The Biology and Ecology of Narrow Endemic and Widespread Plants: A Comparative Study of Trait Variation in 20 Congeneric Pairs. Oikos 2004, 107, 505–518. [Google Scholar] [CrossRef]
  23. Papuga, G.; Gauthier, P.; Pons, V.; Farris, E.; Thompson, J.D. Ecological Niche Differentiation in Peripheral Populations: A Comparative Analysis of Eleven Mediterranean Plant Species. Ecography 2018, 41, 1650–1664. [Google Scholar] [CrossRef] [Green Version]
  24. Gazaix, A.; Grillas, P.; Papuga, G.; Fontes, H.; Sabatier, F.; Pons, V.; Gauthier, P.; Thompson, J.D. Ecological Niche Differentiation among Six Annual Lythrum Species in Mediterranean Temporary Pools. Oecologia 2021, 197, 715–727. [Google Scholar] [CrossRef] [PubMed]
  25. Murru, V.; Farris, E.; Santo, A.; Grillo, O.; Piazza, C.; Gaio, A.; Bacchetta, G.; Thompson, J.D. Niche Differentiation at Multiple Spatial Scales on Large and Small Mediterranean Islands for the Endemic Silene velutina Pourr. Ex Loisel. (Caryophyllaceae). Plants 2021, 10, 2298. [Google Scholar] [CrossRef] [PubMed]
  26. Noble, V.; Diadema, K. La Flore des Alpes-Maritimes et de la Principauté de Monaco: Originalité et Diversité; Conservatoires Botaniques Nationaux Alpin et Méditerranéen; Naturalia Publications Conservatoire Botanique National Méditerranéen: Rouen, France, 2011; ISBN 978-2-909717-75-3. [Google Scholar]
  27. Macrì, C.; Dagnino, D.; Guerrina, M.; Médail, F.; Minuto, L.; Thompson, J.D.; Casazza, G. Effects of Environmental Heterogeneity on Phenotypic Variation of the Endemic Plant Lilium pomponium in the Maritime and Ligurian Alps. Oecologia 2020, 195, 93–103. [Google Scholar] [CrossRef]
  28. Casazza, G.; Macrì, C.; Dagnino, D.; Guerrina, M.; Juin, M.; Minuto, L.; Thompson, J.D.; Baumel, A.; Médail, F. When Ecological Marginality Is Not Geographically Peripheral: Exploring Genetic Predictions of the Centre-Periphery Hypothesis in the Endemic Plant Lilium pomponium. PeerJ 2021, 9, e11039. [Google Scholar] [CrossRef]
  29. Pironon, S.; Papuga, G.; Villellas, J.; Angert, A.L.; García, M.B.; Thompson, J.D. Geographic Variation in Genetic and Demographic Performance: New Insights from an Old Biogeographical Paradigm. Biol. Rev. Camb. Philos. Soc. 2017, 92, 1877–1909. [Google Scholar] [CrossRef]
  30. Rameau, J.C.; Mansion, D.; Dumé, G.; Gauberville, C. Flore Forestière Française: Guide Écologique Illustré. Région Méditerranéenne Volume 3 de Flore Forestière Française. In Forêt Privée Française; IDF: Paris, France, 2008; ISBN 978-2-904740-16-9. [Google Scholar]
  31. Kirillova, I.A.; Kirillov, D.V. Impact of Weather Conditions on Seasonal Development, Population Structure and Reproductive Success on Dactylorhiza traunsteineri (Orchidaceae) in the Komi Republic (Russia). Nat. Conserv. Res. 2020, 5, 77–89. [Google Scholar] [CrossRef] [Green Version]
  32. Sletvold, N.; Ågren, J. Climate-Dependent Costs of Reproduction: Survival and Fecundity Costs Decline with Length of the Growing Season and Summer Temperature. Ecol. Lett. 2015, 18, 357–364. [Google Scholar] [CrossRef]
  33. Mursal, N.; Mehdiyeva, N.P.; Ibrahimova, A.G. Population Status and Ecology of Platanthera chlorantha (Orchidaceae) in the Greater Caucasus (Azerbaijan). Nat. Conserv. Res. 2020, 5, 114–124. [Google Scholar] [CrossRef]
  34. Barbero, M. Les remontées méditerranéennes sur le versant italien des Alpes. Ecol. Mediterr. 1978, 4, 109–132. [Google Scholar] [CrossRef]
  35. Barbero, M.; Bono, G.; Ozenda, P. Sur Les Groupements Végétaux En Limite d’aire Dans Les Alpes Maritimes et Ligures. Bull. Société Bot. Fr. 1970, 117, 593–607. [Google Scholar] [CrossRef] [Green Version]
  36. Casazza, G.; Zappa, E.; Mariotti, M.G.; Médail, F.; Minuto, L. Ecological and Historical Factors Affecting Distribution Pattern and Richness of Endemic Plant Species: The Case of the Maritime and Ligurian Alps Hotspot. Divers. Distrib. 2008, 14, 47–58. [Google Scholar] [CrossRef]
  37. Diadema, K.; Bretagnolle, F.; Affre, L.; Yuan, Y.-M.; Médail, F. Geographic Structure of Molecular Variation of Gentiana ligustica (Gentianaceae) in the Maritime and Ligurian Regional Hotspot, Inferred from ITS Sequences. Taxon 2005, 54, 887–894. [Google Scholar] [CrossRef]
  38. Médail, F.; Diadema, K. Glacial Refugia Influence Plant Diversity Patterns in the Mediterranean Basin. J. Biogeogr. 2009, 36, 1333–1345. [Google Scholar] [CrossRef]
  39. Jacquemyn, H.; Honnay, O.; Pailler, T. Range Size Variation, Nestedness and Species Turnover of Orchid Species along an Altitudinal Gradient on Réunion Island: Implications for Conservation. Biol. Conserv. 2007, 136, 388–397. [Google Scholar] [CrossRef]
  40. Rydin, H.; Snoeijs, P.; Diekmann, M.; Van der Maarel, E. (Eds.) Acta phytogeographica Suecica. In Swedish Plant Geography; Svenska Växtgeografiska Sällskapet: Uppsala, Sweden, 1999; ISBN 978-91-7210-484-6. [Google Scholar]
  41. Grytnes, J.; Kapfer, J.; Jurasinski, G.; Birks, H.H.; Henriksen, H.; Klanderud, K.; Odland, A.; Ohlson, M.; Wipf, S.; Birks, H.J.B. Identifying the Driving Factors behind Observed Elevational Range Shifts on European Mountains. Glob. Ecol. Biogeogr. 2014, 23, 876–884. [Google Scholar] [CrossRef] [Green Version]
  42. Körner, C. The Use of “altitude” in Ecological Research. Trends Ecol. Evol. 2007, 22, 569–574. [Google Scholar] [CrossRef]
  43. Casazza, G.; Giordani, P.; Benesperi, R.; Foggi, B.; Viciani, D.; Filigheddu, R.; Farris, E.; Bagella, S.; Pisanu, S.; Mariotti, M.G. Climate Change Hastens the Urgency of Conservation for Range-Restricted Plant Species in the Central-Northern Mediterranean Region. Biol. Conserv. 2014, 179, 129–138. [Google Scholar] [CrossRef]
  44. Gauthier, P.; Bernard, C.; Thompson, J.D. Exploring Vulnerability of Listed Mediterranean Plants in Relation to Risks of Population Loss. J. Nat. Conserv. 2019, 51, 125736. [Google Scholar] [CrossRef]
  45. SILENE. Available online: http://www.silene.eu/index.php?cont=accueil (accessed on 23 February 2021).
  46. IGN RGE ALTI®. Version 2.0. Descriptif de Contenu. 2013. Available online: https://geoservices.ign.fr/sites/default/files/2021-07/DC_RGEALTI_2-0.pdf (accessed on 15 February 2022).
  47. Hijmans, R.J.; van Etten, J.; Sumner, M.; Cheng, J.; Bevan, A.; Bivand, R.; Busetto, L.; Canty, M.; Forrest, D.; Ghosh, A.; et al. Raster: Geographic Data Analysis and Modeling. R Package Version 3.1-5. 2020. Available online: https://cran.r-project.org/web/packages/raster/index.html (accessed on 15 February 2022).
  48. R Development Core Team. R: A Language and Environment for Statistical Computing: Reference Index; R Foundation for Statistical Computing: Vienna, Austria, 2010; ISBN 978-3-900051-07-5. [Google Scholar]
  49. Hijmans, R.; Phillips, S.; Leathwick, J.; Elith, J. Dismo: Species Distribution Modeling. R Package Version 1.3-5. 2017. Available online: https://rspatial.org/raster/sdm/ (accessed on 15 February 2022).
  50. Husson, F.; Josse, J.; Le, S.; Mazet, J.; FactoMineR: Multivariate Exploratory Data Analysis and Data Mining. R Package Version 1.42. 2019. Available online: https://cran.r-project.org/web/packages/FactoMineR/index.html (accessed on 15 February 2022).
  51. Dray, S.; Dufour, A.; Thioulouse, J.; Jombart, T.; Pavoine, S.; Lobry, J.R.; Ollier, S.; Borcard, D.; Legendre, P.; Bougeard, S.; et al. Ade4: Analysis of Ecological Data: Exploratory and Euclidean Methods in Environmental Sciences. R Package Version 1.7-13. 2018. Available online: https://cran.r-project.org/web/packages/ade4/ade4.pdf (accessed on 15 February 2022).
  52. Martin, N.; Carrega, P.; Adnes, C. Downscaling à Fine Résolution Spatiale Des Températures Actuelles et Futures Par Modélisation Statistique Des Sorties ALADIN-Climat Sur Les Alpes-Maritimes (France). Climatologie 2013, 10, 51–72. [Google Scholar] [CrossRef] [Green Version]
Figure 1. Location of the sampled sites (large symbols) in the distribution of Lilium pomponium (small black circles). Open circles—low-altitude stations, open squares—mid-altitude Mediterranean, open triangles—mid-altitude temperate mountain, black squares—high-altitude Mediterranean, black triangles—high-altitude temperate mountain. Black lines are the limits of French departments.
Plants 11 00833 g001
Figure 2. Altitudinal distribution of all known French locations of Lilium pomponium. Binwidth is 100 m. Dashed lines represent quantiles at the 2.5% and 97.5% levels: 95.0% of stations are between 260 and 1762 m. Black dots under the histogram correspond to the locations of the 23 sampled populations.
Plants 11 00833 g002
Figure 3. Linear relationship between northing and altitude for all known French locations of Lilium pomponium (black dots). The blue line corresponds to the linear regression (p-value < 0.001, adjusted-R2 = 0.126) and the grey band is the confidence interval at the 0.95 level.
Plants 11 00833 g003
Figure 4. Illustrations of the four main micro-niche types revealed by MFA and HCPC analyses. (a,b) Positions of parameter variables following MFA for the four main environmental axes. Each colour represents a group of micro-niche characteristics: soil cover (grey), biotic niche (green), topographic niche (pink), edaphic niche (mustard). Only the 10 variables that best represent the plan are plotted (according to their cos2). “Marginality” variables are supplementary variables in the MFA and plotted in black. (c,d) quadrat positions according to the HCPC results. The four HCPC clusters are plotted with different symbols: red circles for micro-niche type 1, blue triangles for type 2, orange squares for type 3, grey diamonds for type 4. Ellipses correspond to confidence interval at the 0.99 level. The first two axes of the MFA are on the left (a,c), while axes 3 and 4 are on the right (b,d).
Plants 11 00833 g004
Figure 5. Illustrations of the four different niche types of Lilium pomponium: (a,b) niche type 1, (c,d) niche type 2, (e,f) niche type 3, (g,h) niche type 4. Upper line (a,c,e,g) corresponds to the typical quadrats closest to the cluster centre in the MFA, lower line (b,d,f,h) to the typical quadrats furthest from other clusters.
Plants 11 00833 g005
Figure 6. Differences in position along ecological gradients and in relation to geographic distribution limits for the four main micro-niche types of Lilium pomponium. Ecological position is expressed in relation to (a) altitude and (b) climatic gradients based on the main axis of principal component analysis (PCA) of monthly meteorological data). Geographic locations of sites represent Euclidian distance to either (c) the centre or (d) distribution limits. Kernel density for each micro-niche type shows quartiles (boxplot) and mean values (coloured circle). Code letters indicate that micro-niche means are significantly (p < 0.05) different in pair-wise Wilcoxon tests with Bonferroni adjustment.
Plants 11 00833 g006
Table 1. Description of the four micro-niche types in relation to parameters analysed by HCPC on MFA, and their position along ecological (climatic) gradients and in relation to geographic distribution limits. Symbols indicate whether the mean value of the niche type is significantly higher+ or lower–than the overall mean. A sign in parenthesis indicates significantly higher standard deviation within a given micro-niche type. Quadrat number is the code for the study site and A, B, and C represent the three quadrats in a given site.
Description of the Micro-Niche Type *QuadratsPercentage of QuadratsPosition along Ecological Gradients **Geographic Limits **
1+ Block cover, water retention capacity, first PCoA *** axis (characterised by E. spinosa and T. vulgaris)
− Slope, Shannon diversity, litter cover, gravel and bare soil cover, number of species
(+) Lichen cover, conductivity
(−) pH, 4th PCoA axis (community characterised by Stipa juncea, Rhamnus alaternus, Smilax aspera, Brachypodium retusum, Ruta angustifolia, Pistacia lentiscus
2 ABC
3 ABC
9 ABC
13 C
1262 B
15.9% Close to the limits of Lilium distribution
2− Easting, northing
(+) Bedrock cover, stone cover
4 ABC
7 ABC
10 ABC
20 ABC
208 ABC
835 ABC
877 ABC
13 AB
18 C
738 A
1262 AC
39.1% Intermediate distance to distribution limits
3+ Litter cover, vegetation cover
− 1st PCoA axis (characterised by high presence of Sesleria caerulea and Helictotrichon sempervirens), easting
21 ABC
26 ABC
1148 ABC
16 A
300 A
738 BC
18.8%High altitude
4+ Northing, easting, pH
− Water retention capacity, conductivity, soil carbon content, block cover
(+) Gravel and bare soil cover, moss cover
6 ABC
11 ABC
334 ABC
1208 ABC
16_BC
18 AB
300_BC
26.1% Close to the distribution centre
* Only characteristics that are significantly different for the micro-niche type are shown. ** Only significant differences are commented. *** PCoA: principal coordinates analysis of species data.
Table 2. Location and characteristics of the sampled sites along the altitudinal gradient. Group codes are: BA: low altitude (<350 m), MA: mid-altitude (350–1100 m), HA: high altitude (>1100 m), med: Mediterranean, mont: subalpine.
Altitude (m)IDSampling GroupLocalityDate Habitat TypeSlope (°)Aspect (°)
1914BAVallon d′Aïga Blanca 06450 Utelle19 May 2021Garrigue, scree slope35250
2447BAM2205 06710 La Tour18 May 2021Garrigue, scree slope40250
2596BAD126 06710 Massoins18 May 2021Mixed woodland3580
3361208BAles Moulières 06710 Touët-sur-Var15 June 2021Shrubland4510
5443MA_medPlateau Tercier 06340 La Trinité4 May 2021Garrigue on karst0-
570334MA_montD610 04320 Entrevaux15 June 2021Rocky grassland2055
64911MA_montpath to l′Aiguille 06470 Daluis15 June 2021Shrubland2570
6652MA_medFort de la Revère 06360 Eze3 May 2021Garrigue, scree slope35180
9189MA_medCol de Vence 06140 Vence19 June 2021Rocky grassland10150
93413MA_medCol de la Madone de Gorbio 06440 Peille16 June 2021Rocky grassland3590
103410MA_medD2 06620 Gréolières19 June 2021Garrigue on karst45170
1065300MA_montVerdre 04240 Annot14 June 2021Forest edge2090
1078738MA_medbelow Mont Tron 06540 Breil-sur-Roya17 June 2021Shrubland30105
1099208MA_montChemin du Jas de Bernard 04170 Moriez14 June 2021Shrubland35180
11181262HA_medForêt domaniale de Nans 06460 Saint-Vallier-de-Thiey20 June 2021Scree slope30195
1142835HA_medbelow Mont Razet 06500 Castillon18 June 2021Shrubland30230
1205877HA_medCombe de la Roque 83840 La Roque-Esclapon21 June 2021Shrubland40235
130516HA_montD908, ravin des Baumettes 04170 Thorame-Haute28 June 2021Forest edge4595
14471148HA_medCol de Bleine 06750 Andon20 June 2021Garrigue on karst3555
150518HA_montPeyresq, ravin de la Fontaine 04170 Thorame-Haute28 June 2021Shrubland40200
164020HA_montl′Adrechas, la Colmiane 06420 Valdeblore29 June 2021Shrubland30205
179121HA_montles Aiguillettes, la Colmiane 06420 Valdeblore29 June 2021Pine forest4095
181626HA_montPointe de Ventabren 06380 Moulinet30 June 2021Montane grassland45130
Publisher’s Note: MDPI stays neutral with regard to jurisdictional claims in published maps and institutional affiliations.

