
Hyperaccumulator Stanleya pinnata: In Situ Fitness in Relation to Tissue Selenium Concentration

 , , and
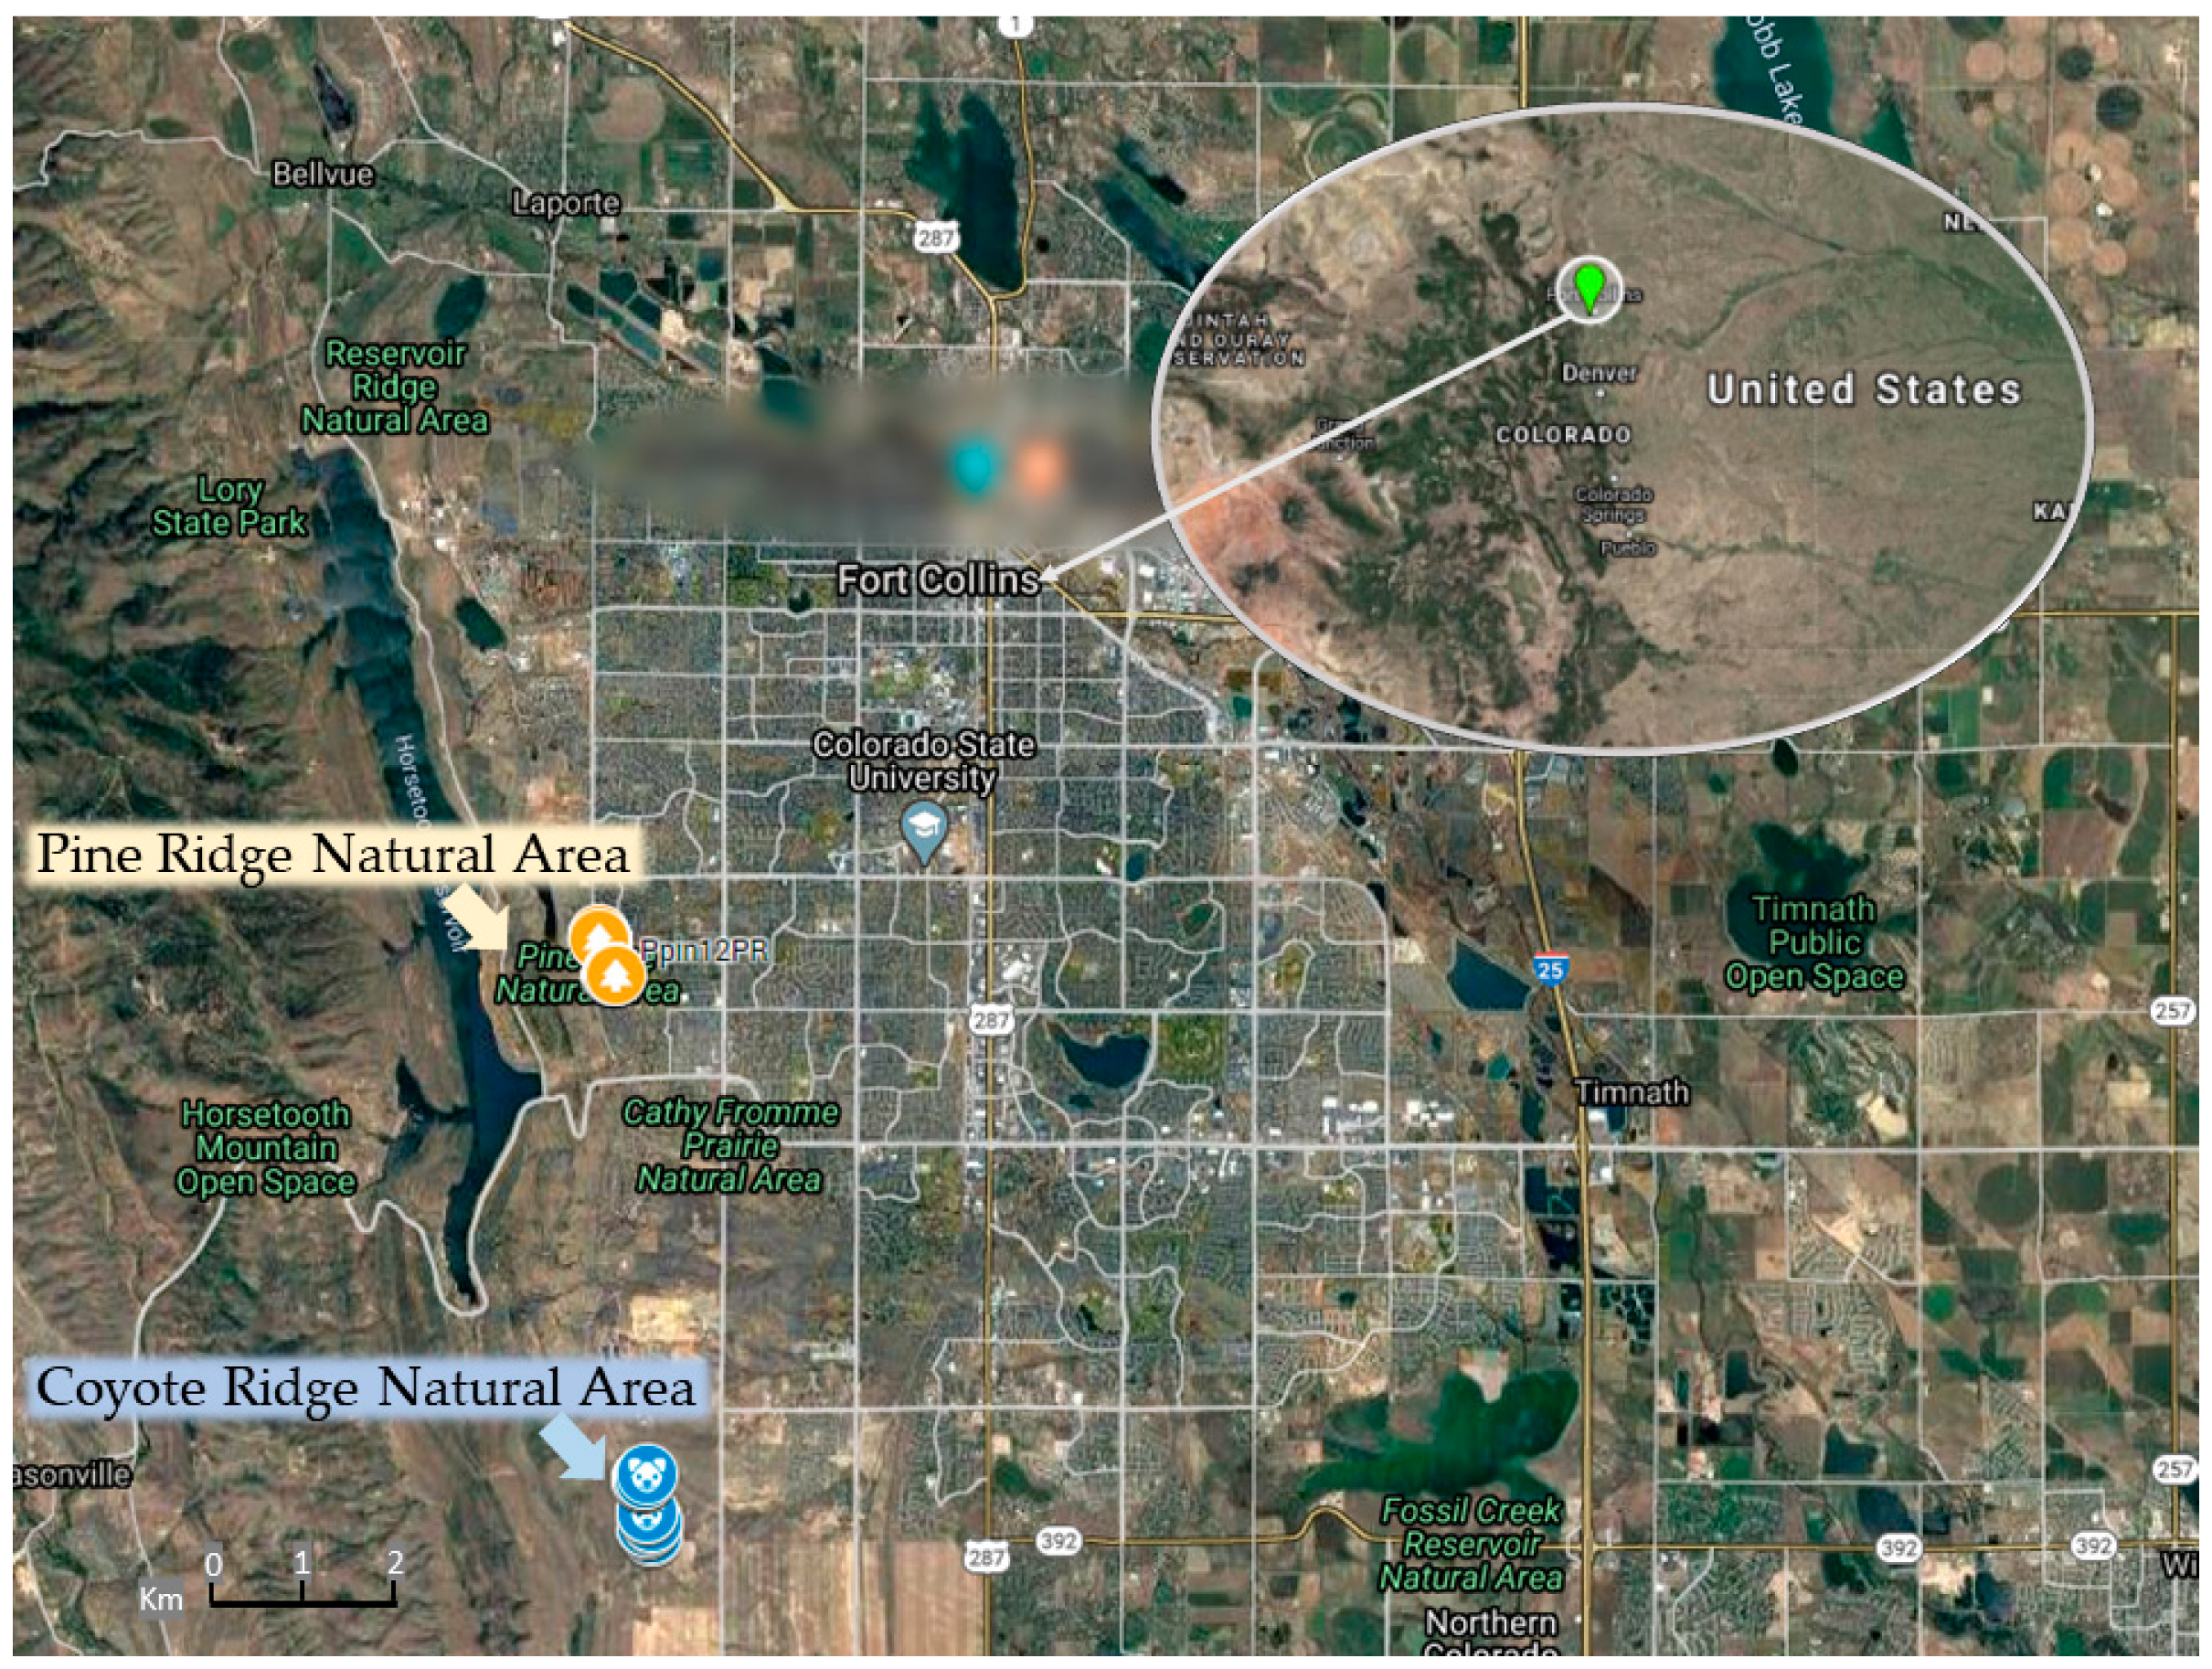
Abstract
:1. Introduction
2. Results
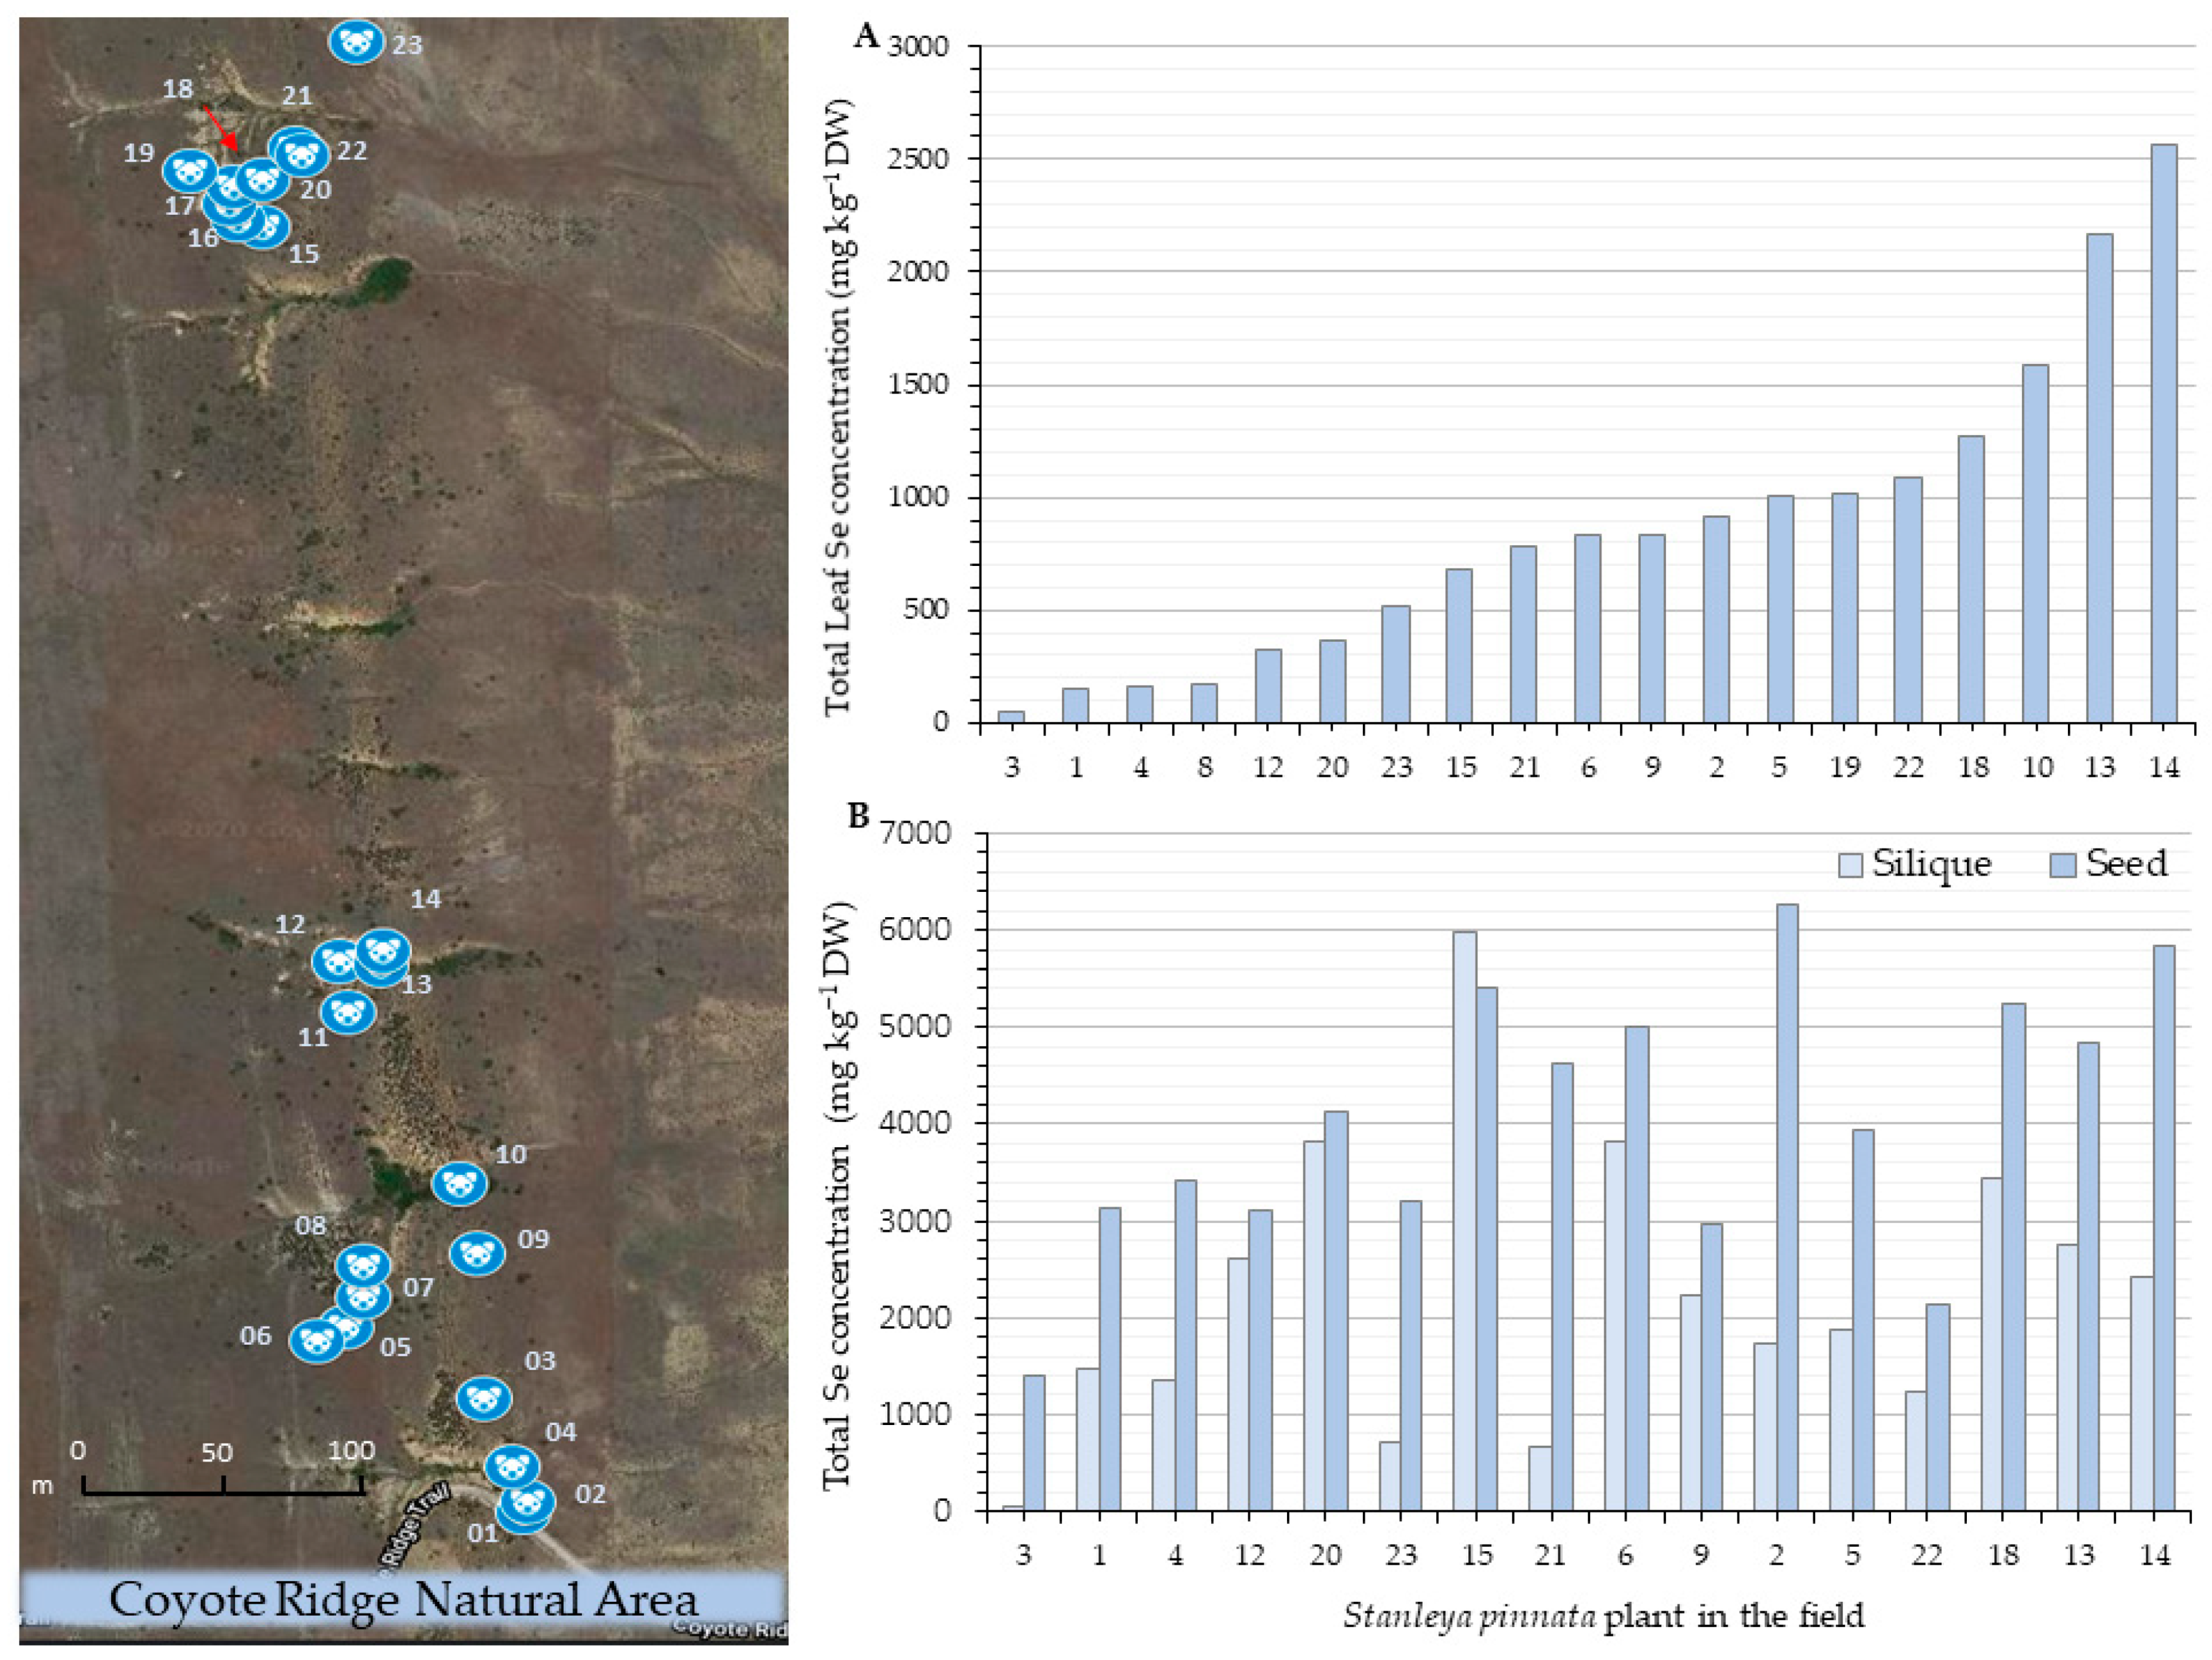
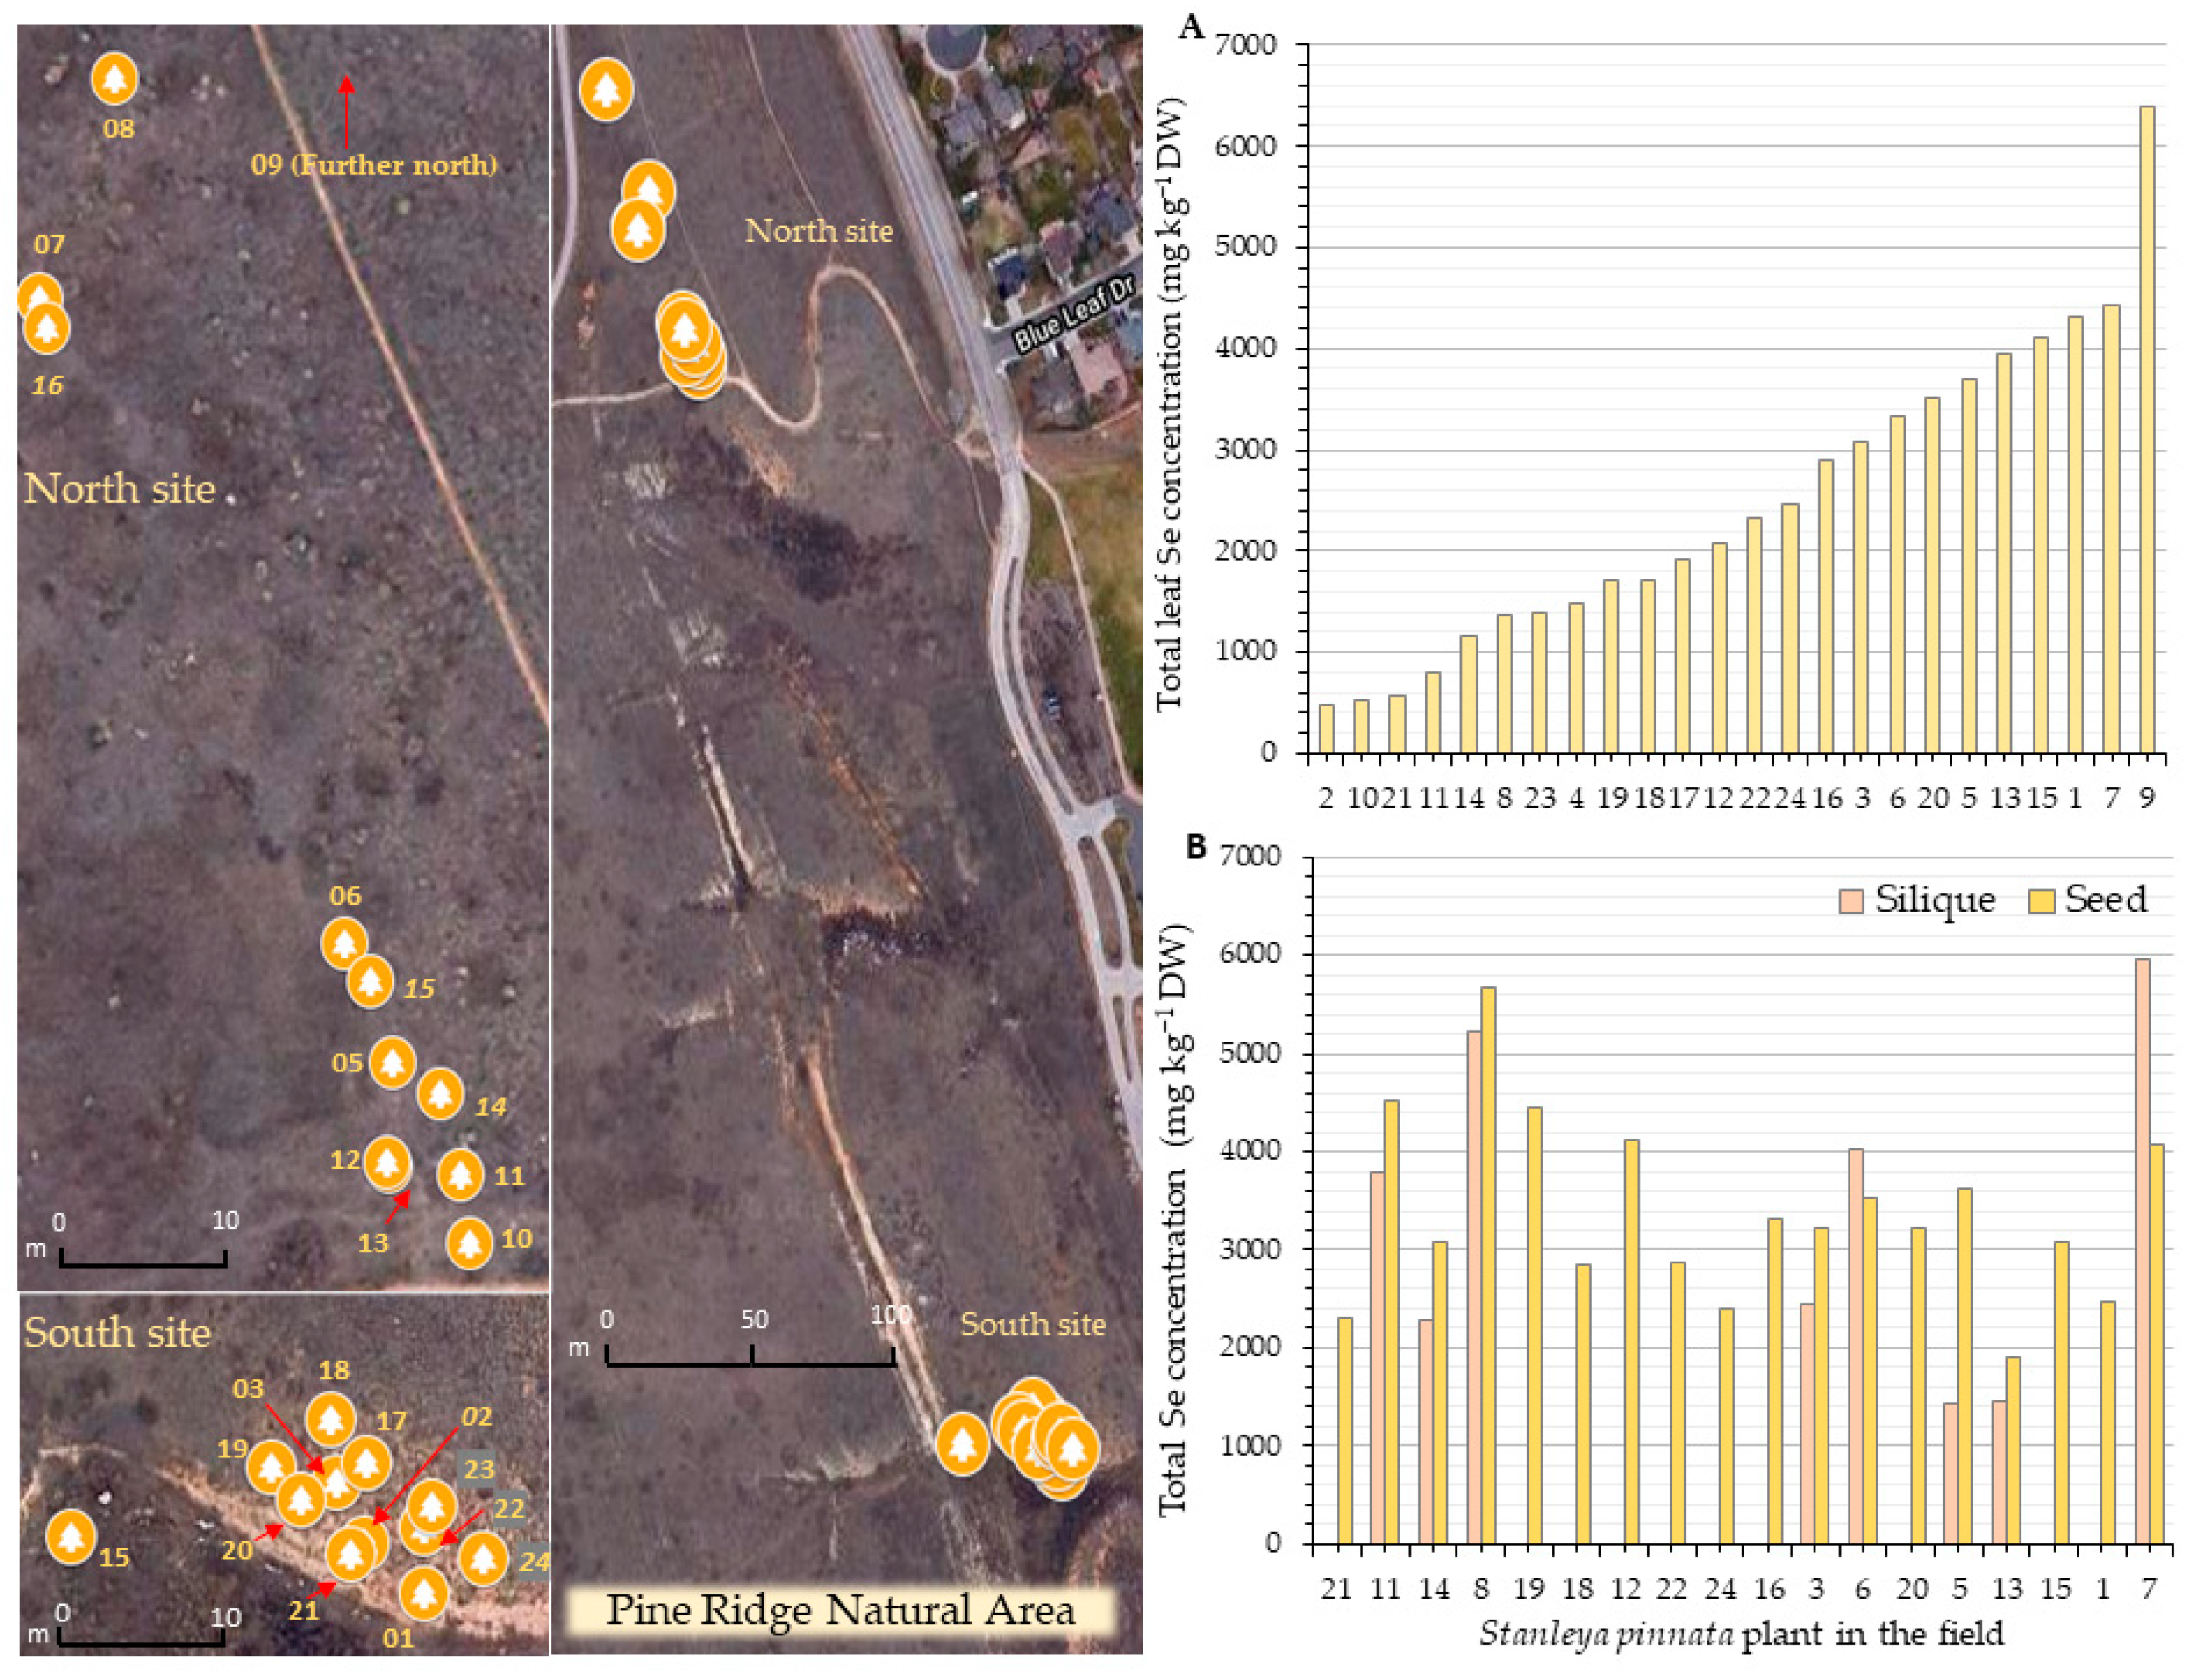
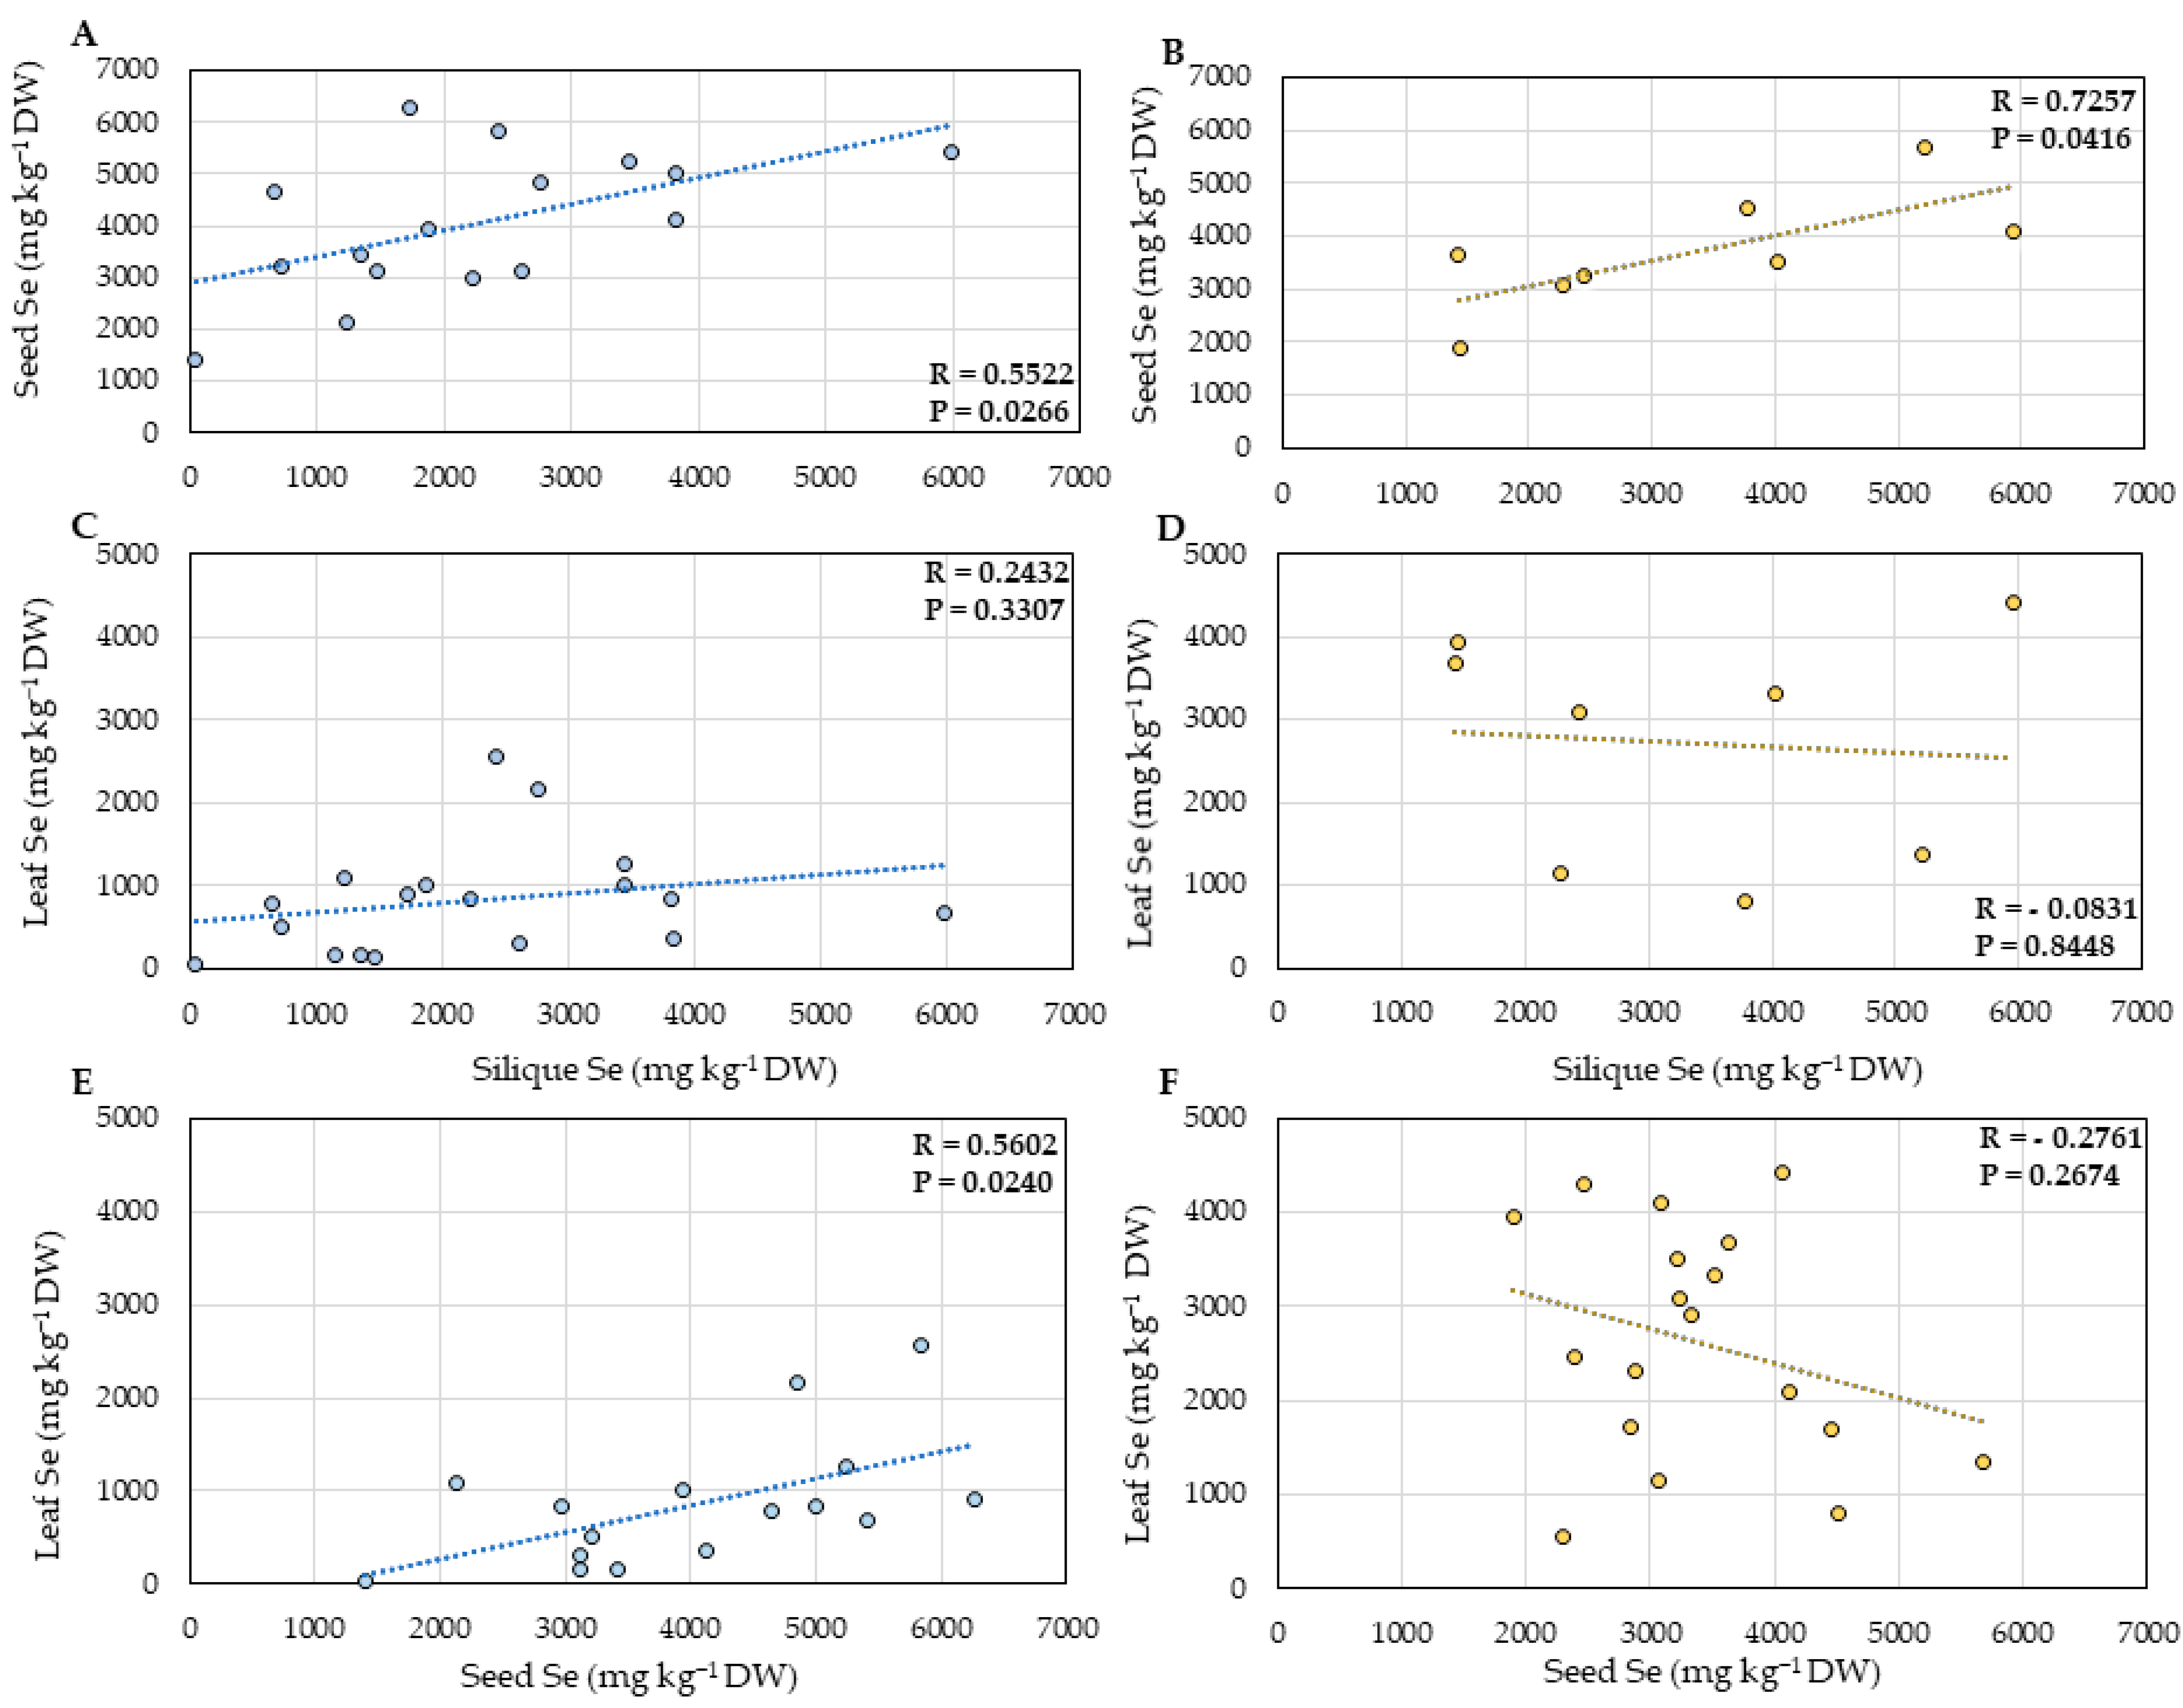
2.1. Selenium Accumulation
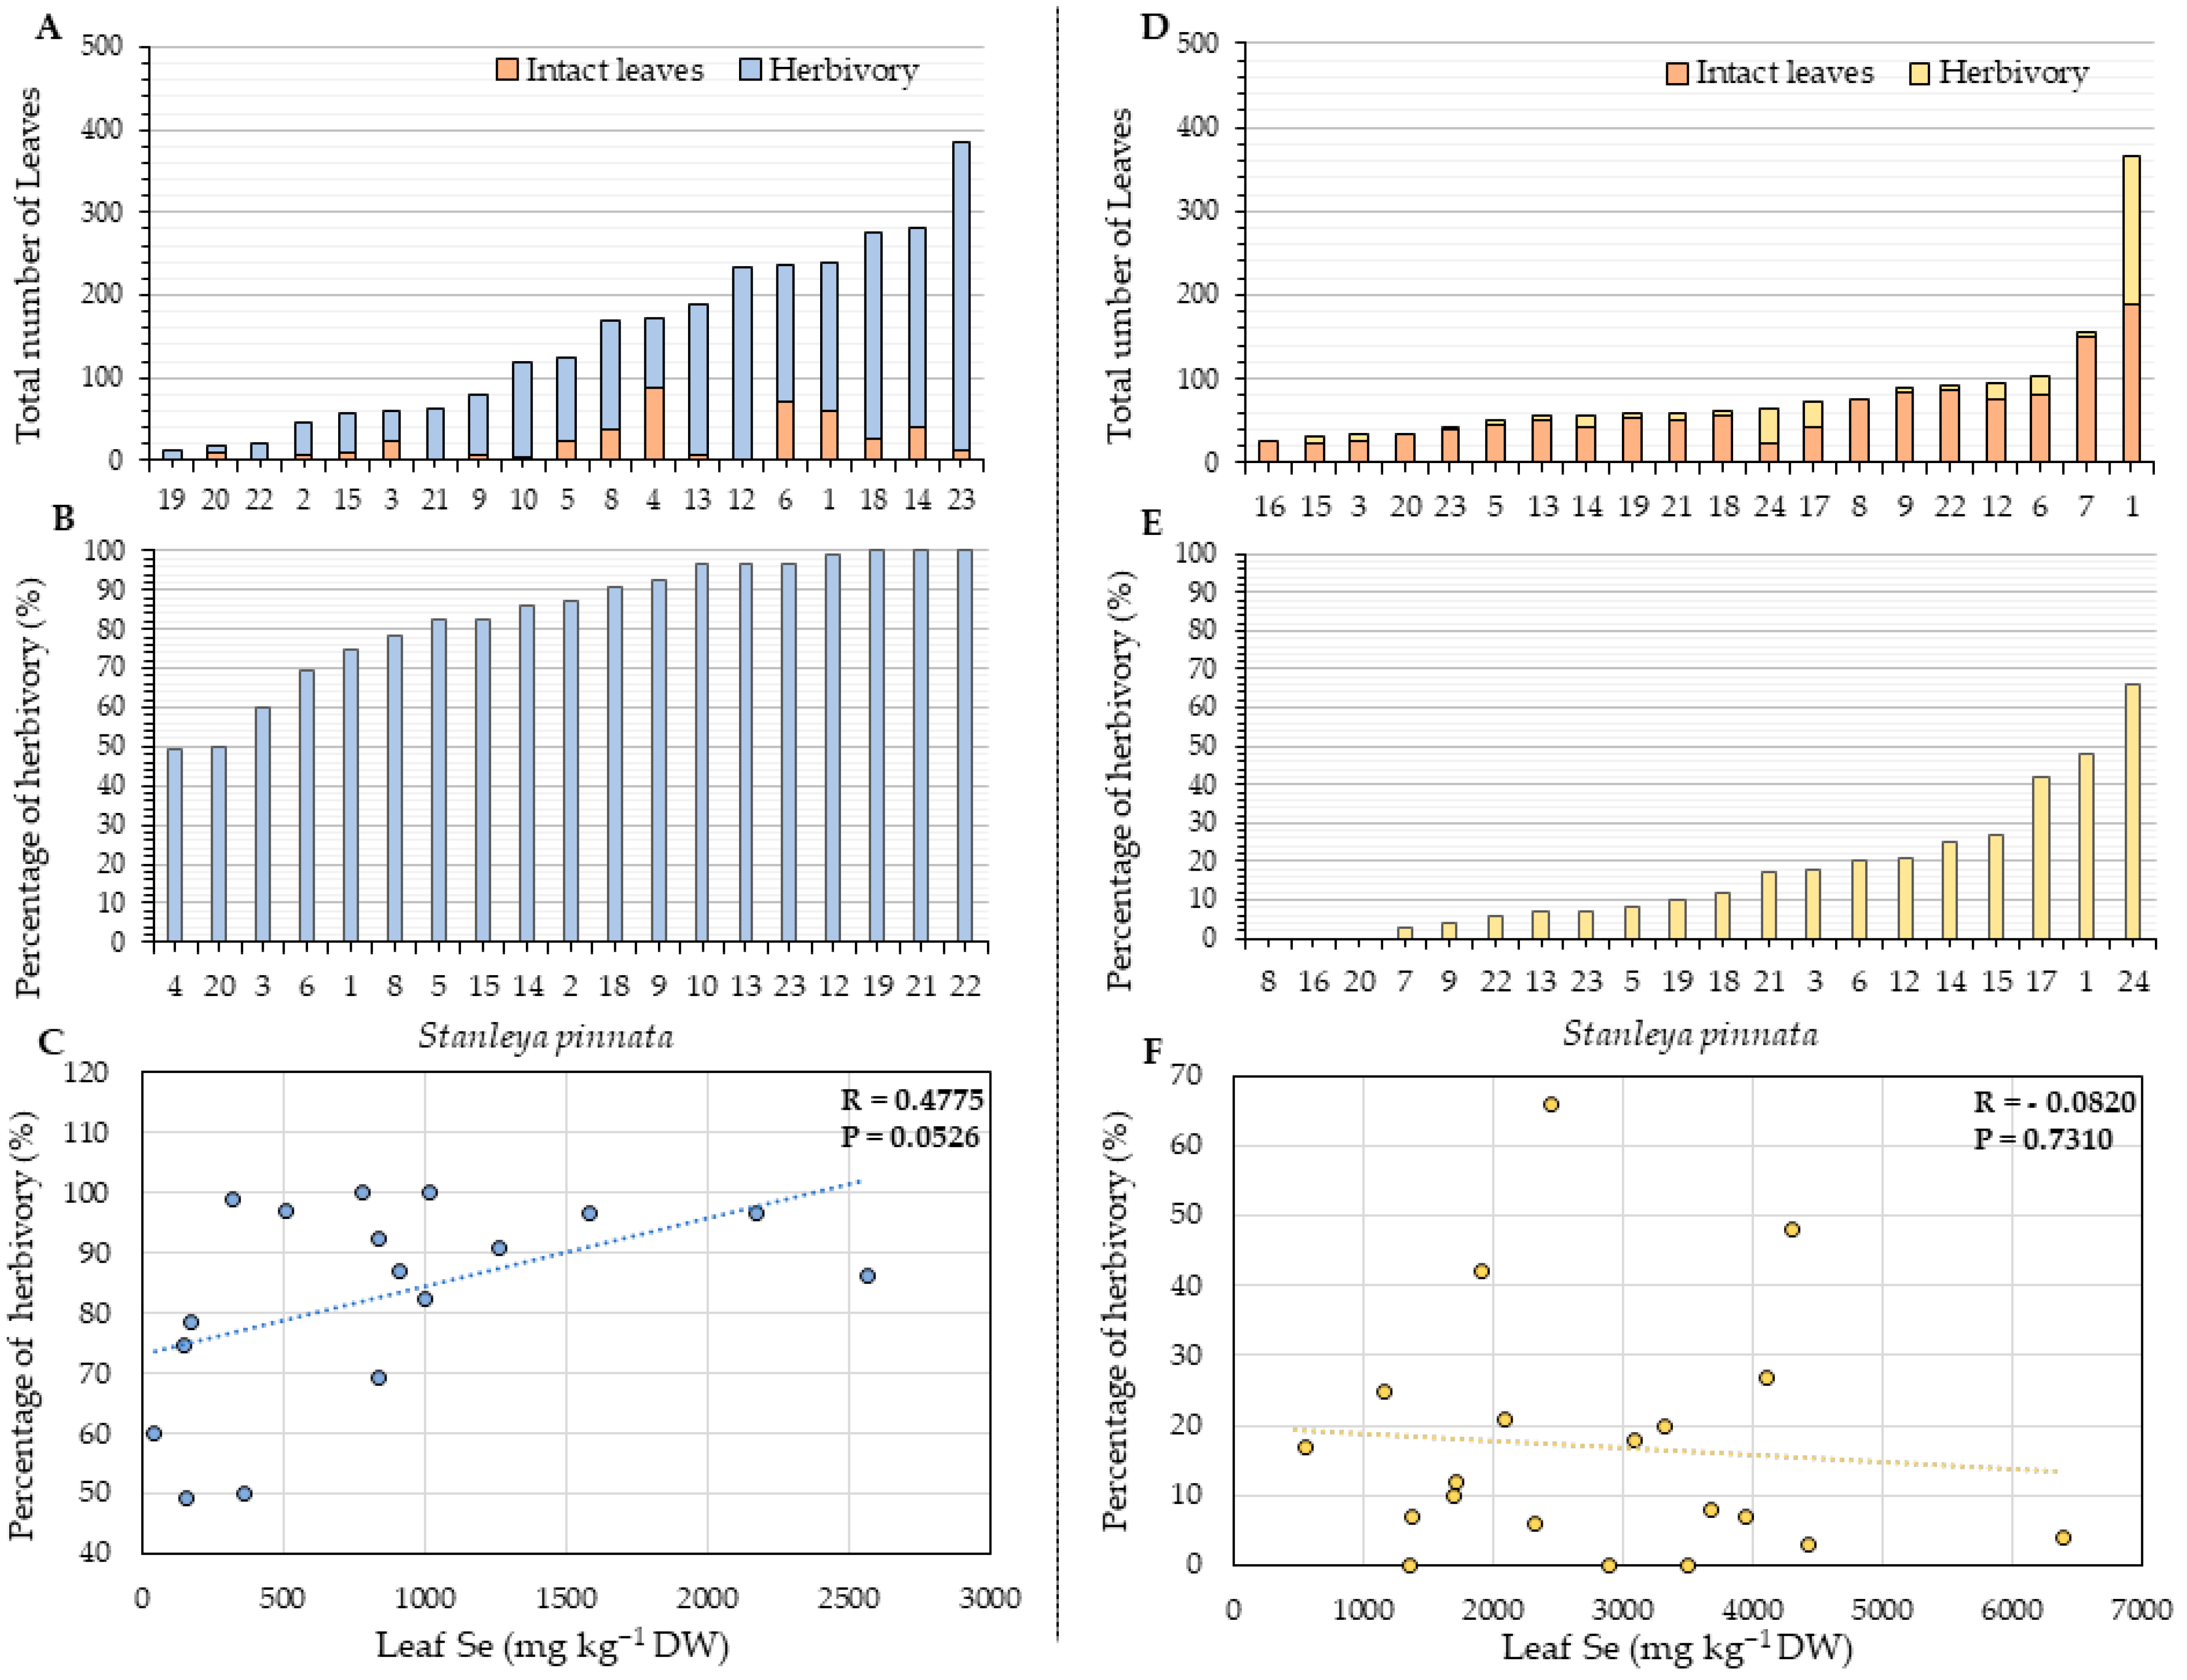
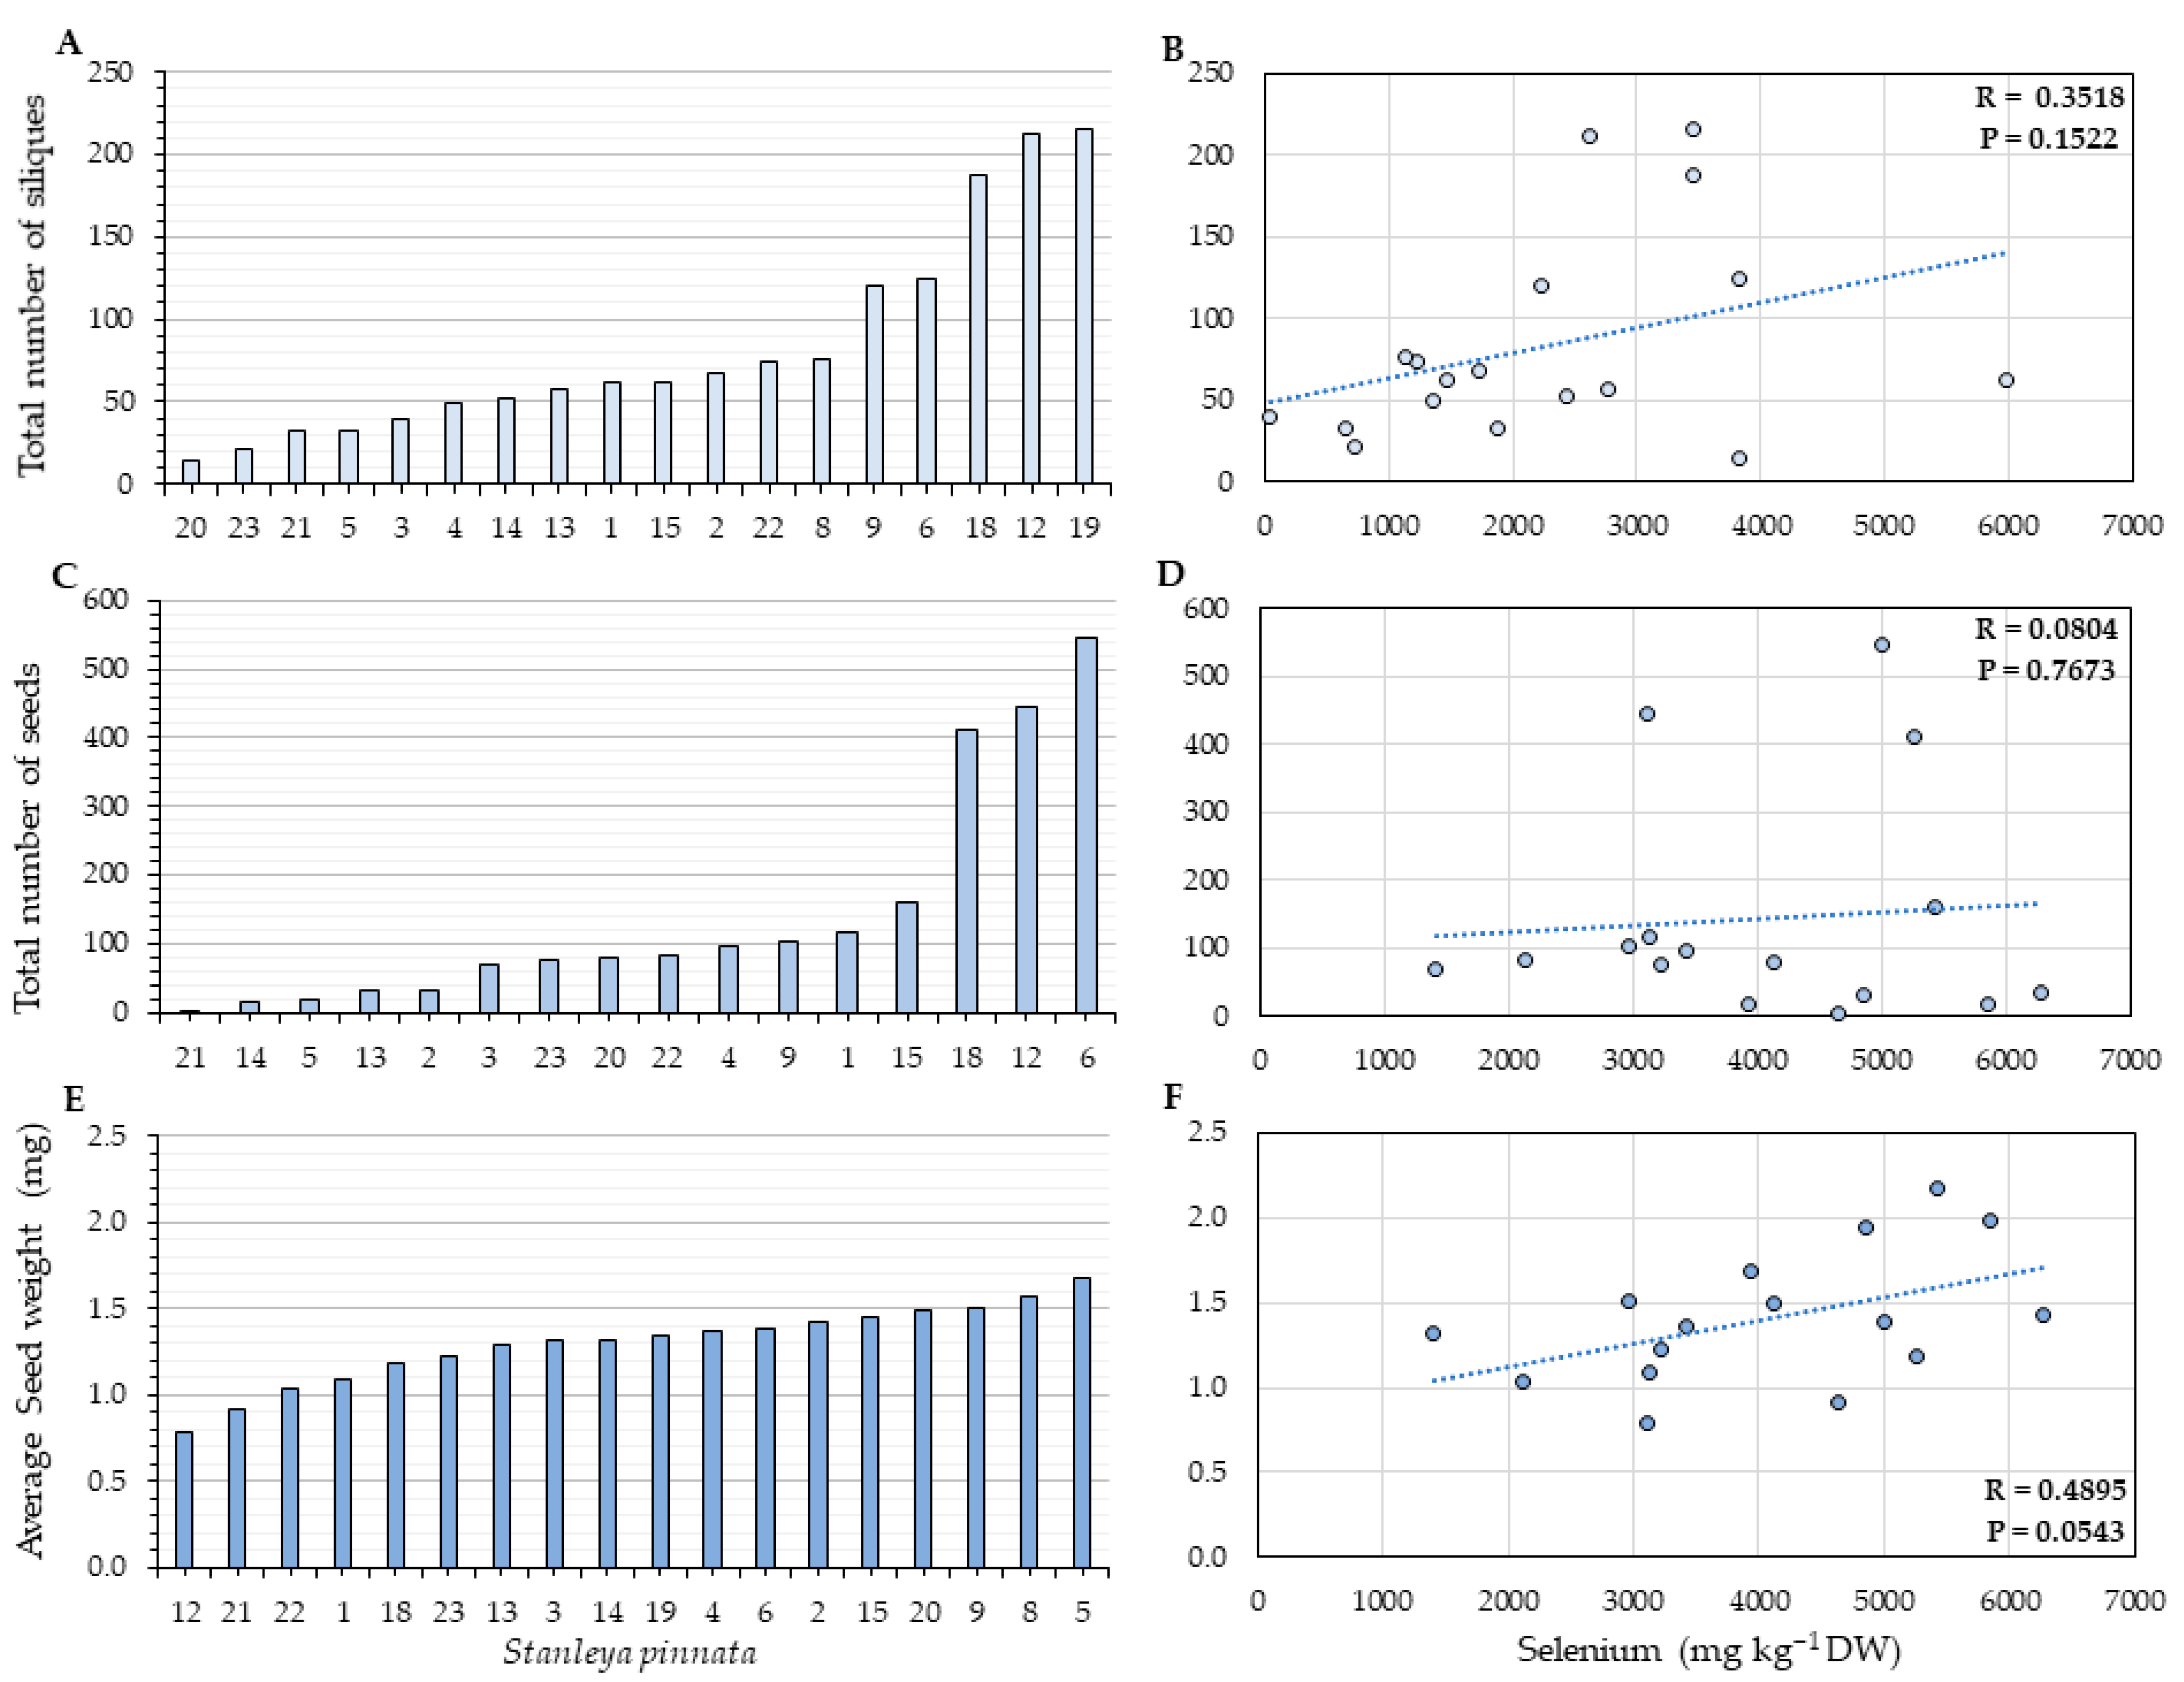
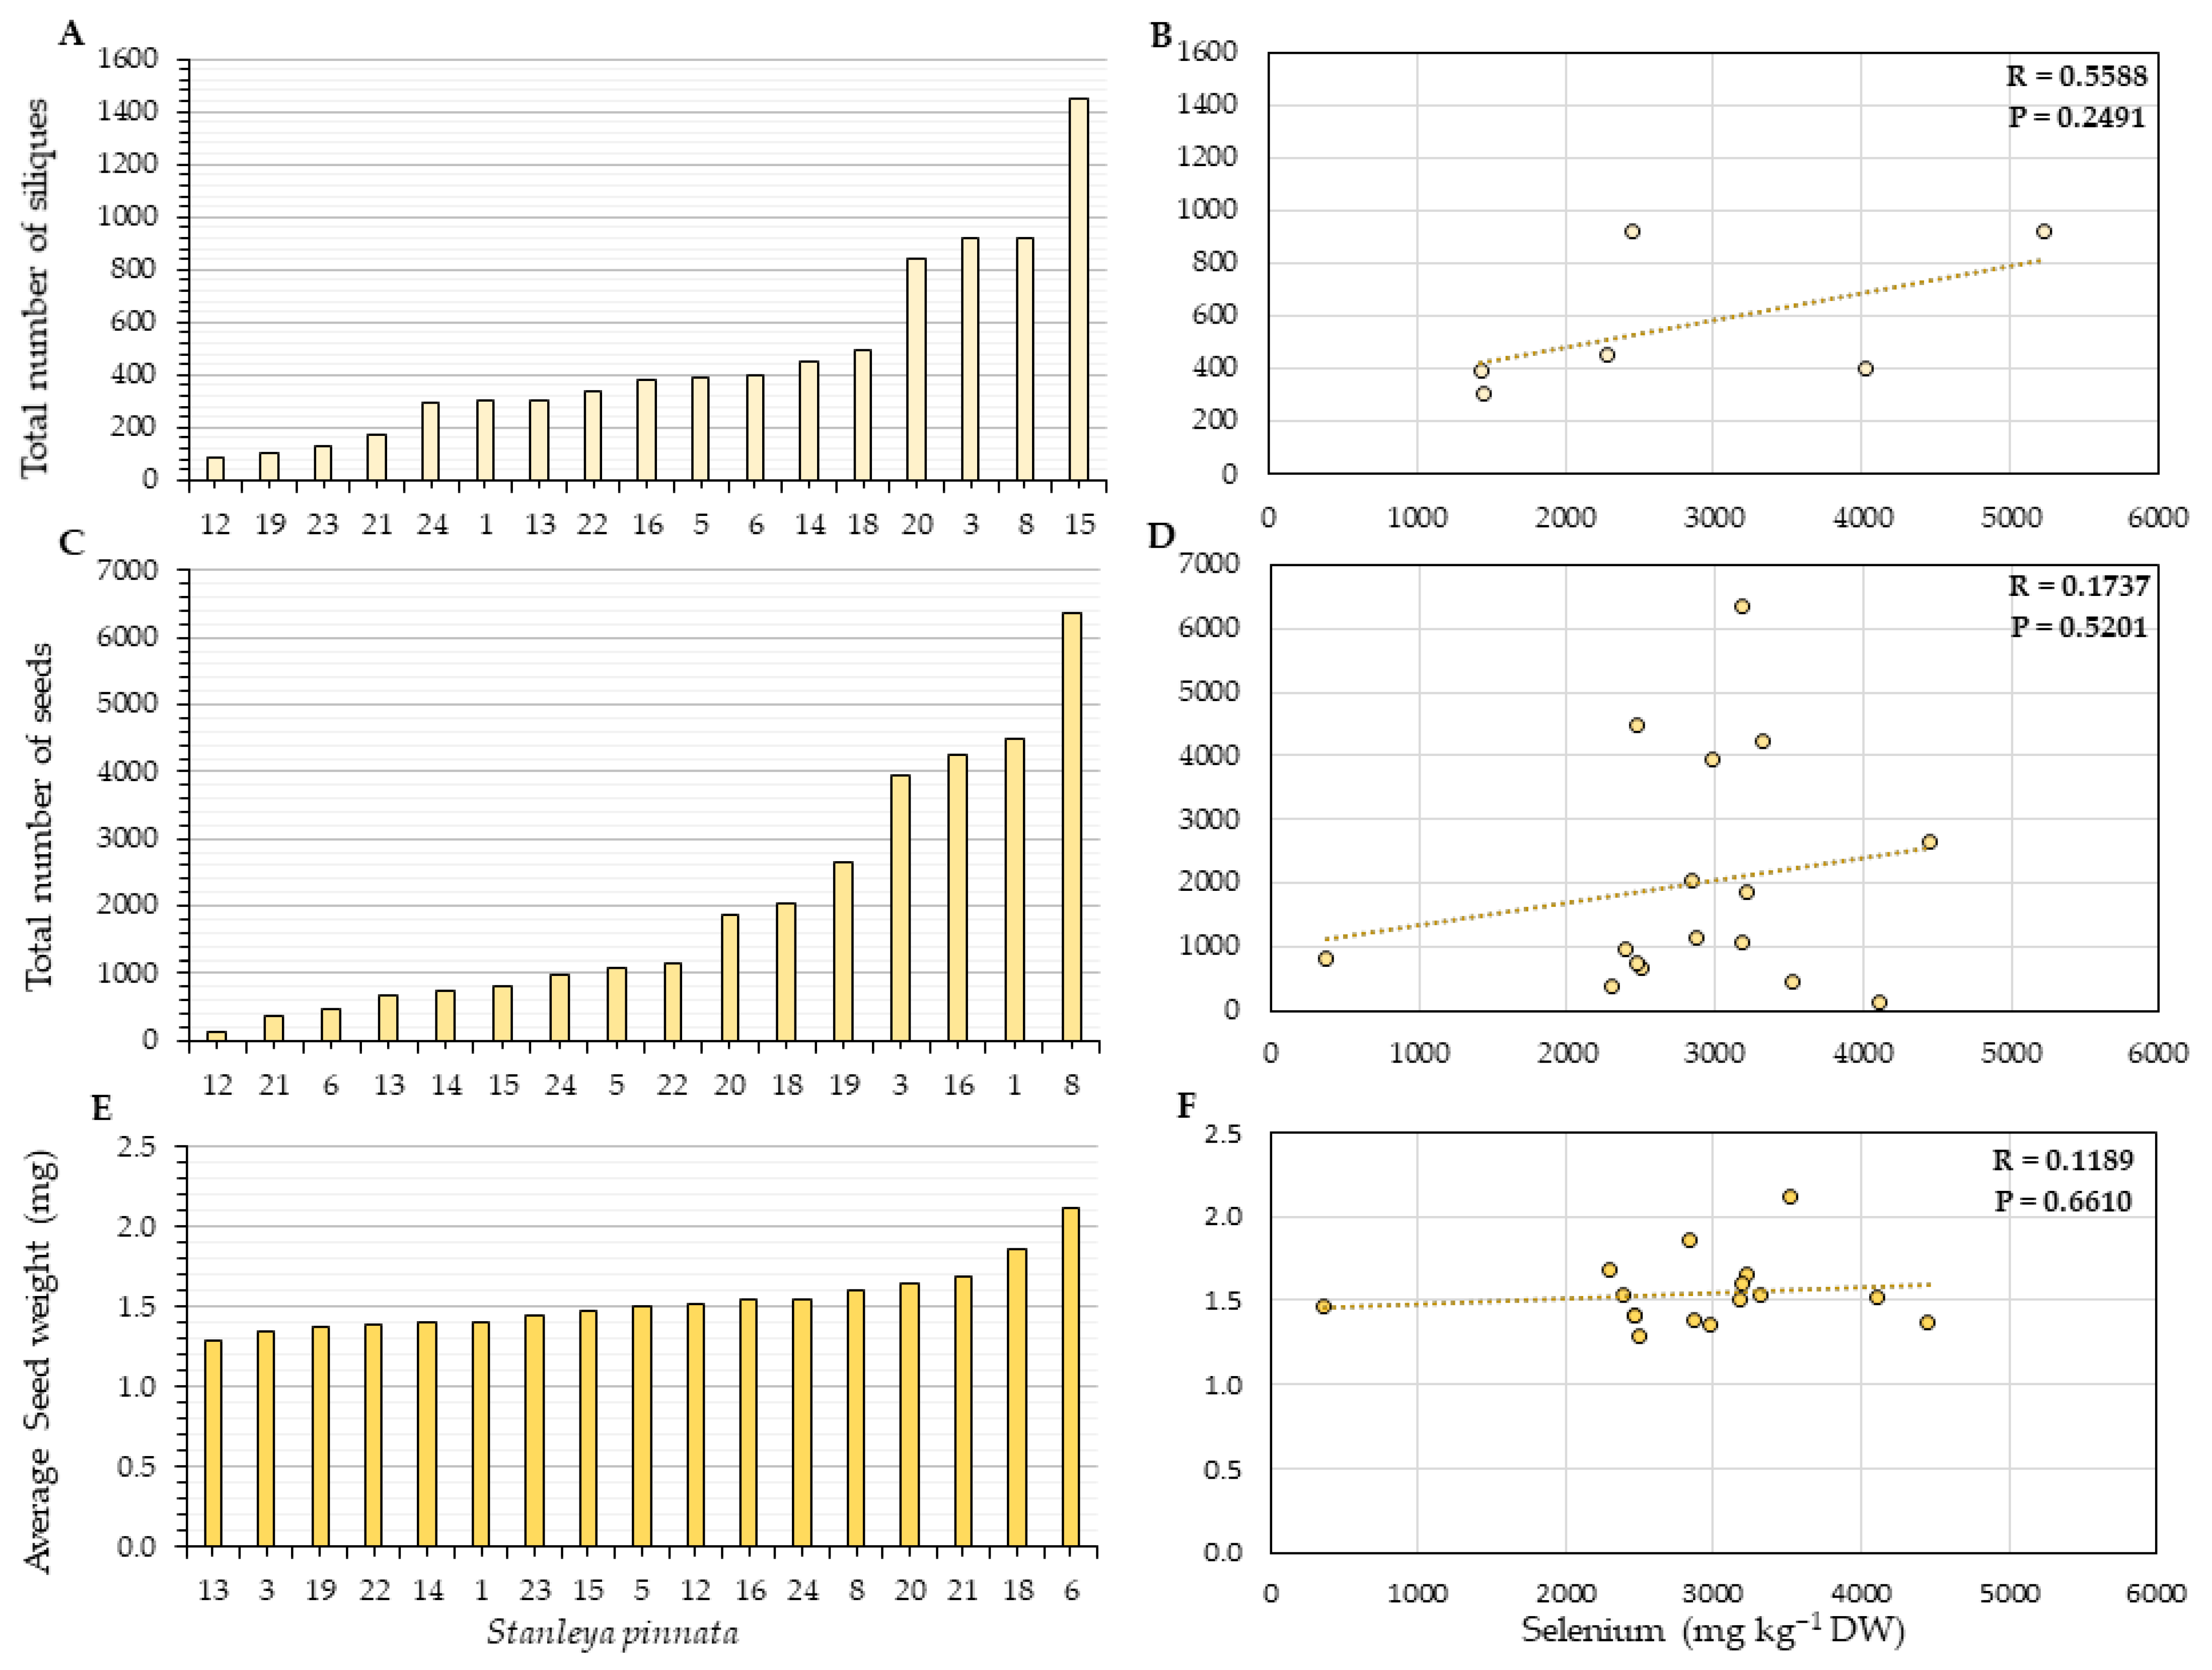
2.2. Herbivory and Fitness Parameters
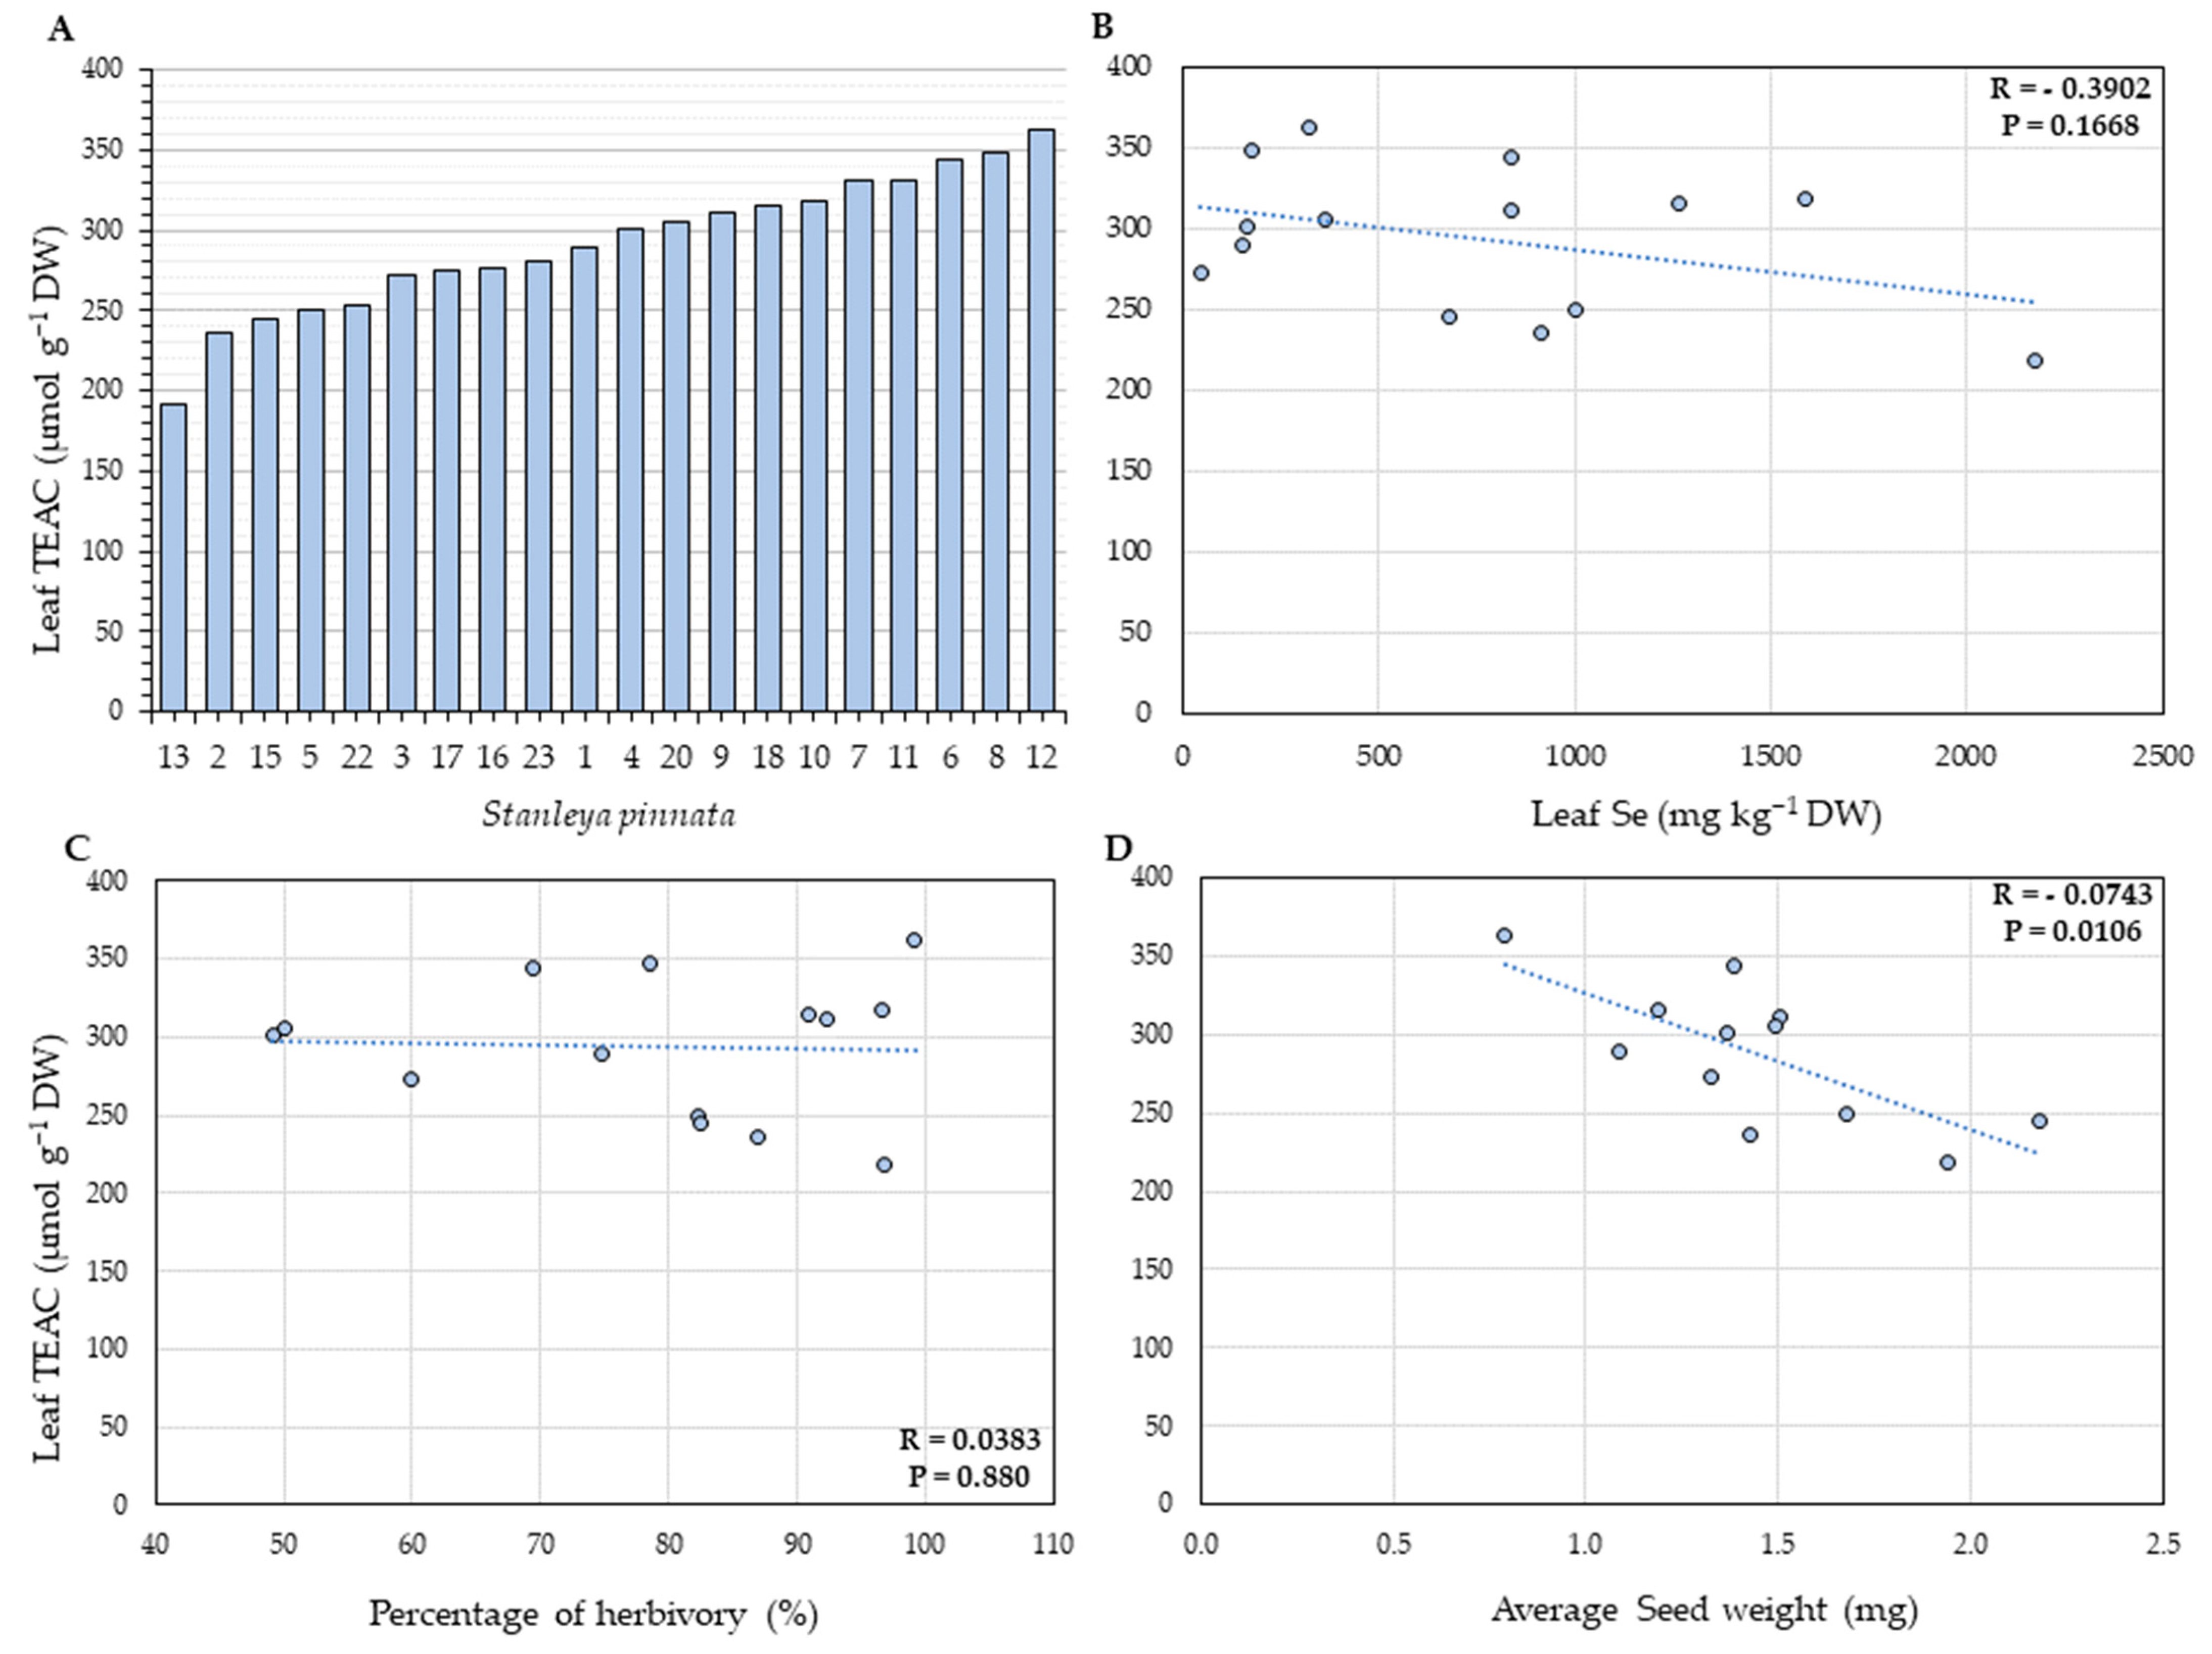
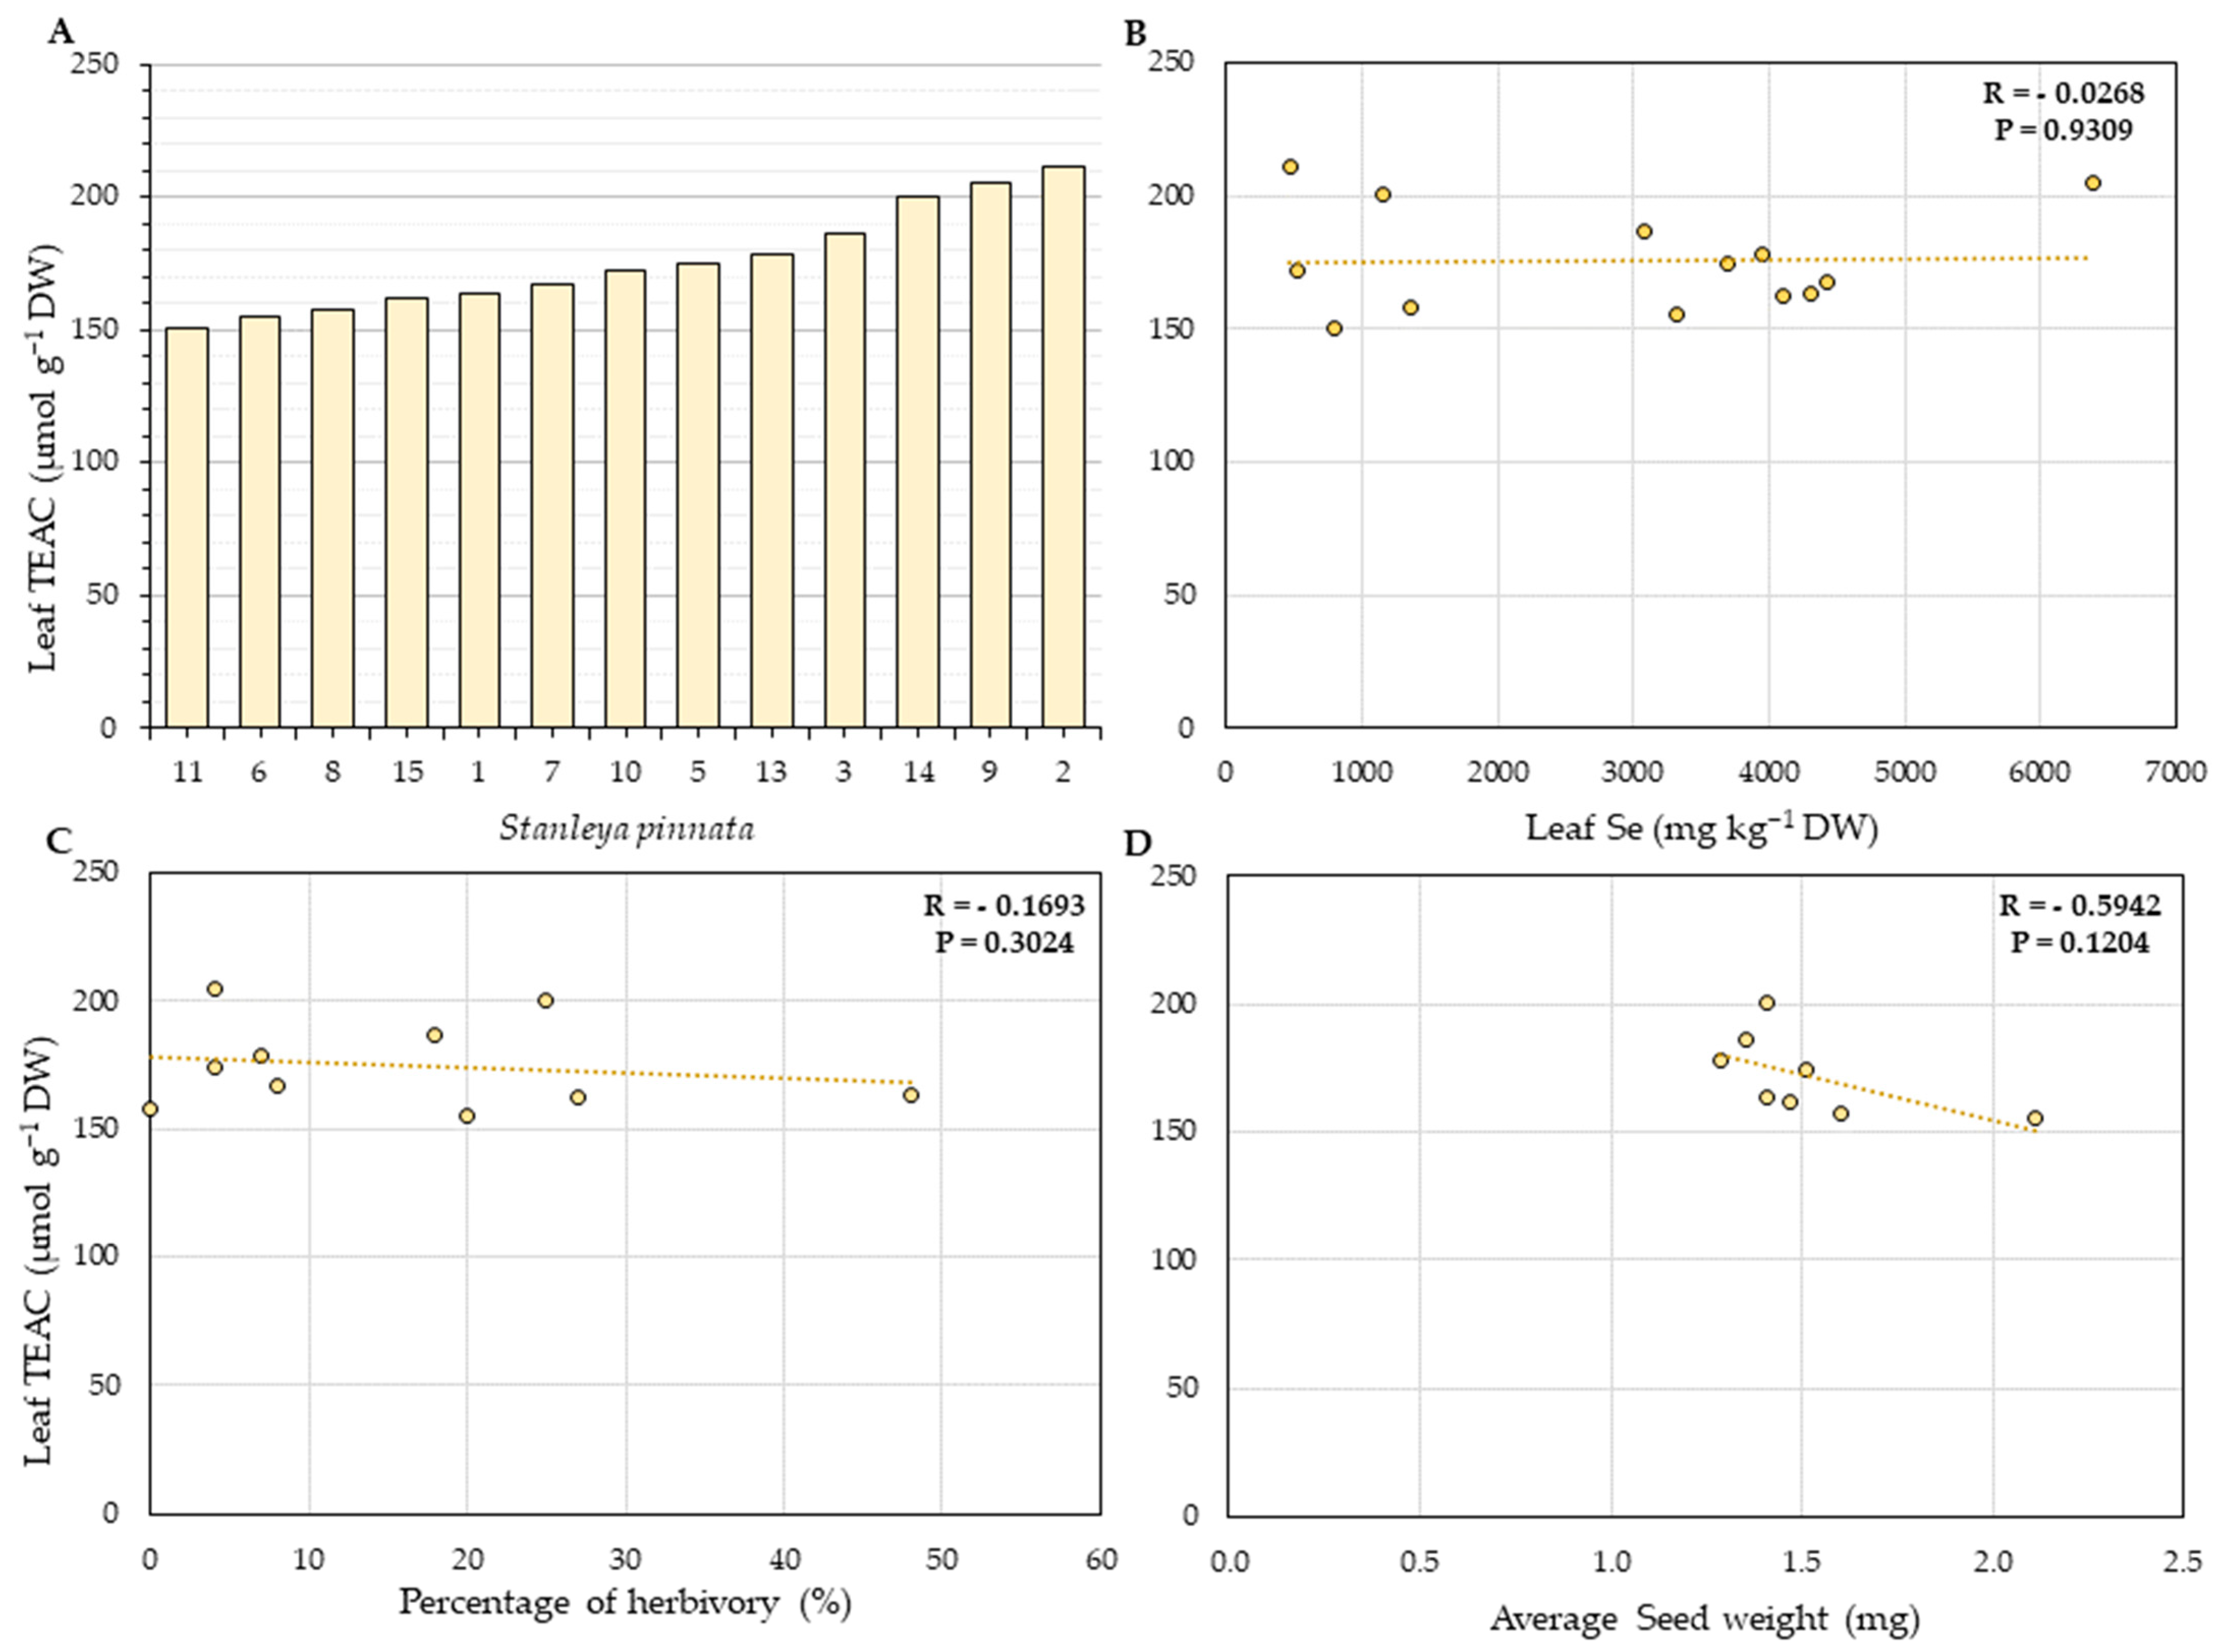
2.3. Total Leaf Phenolics and Antioxidant Capacity
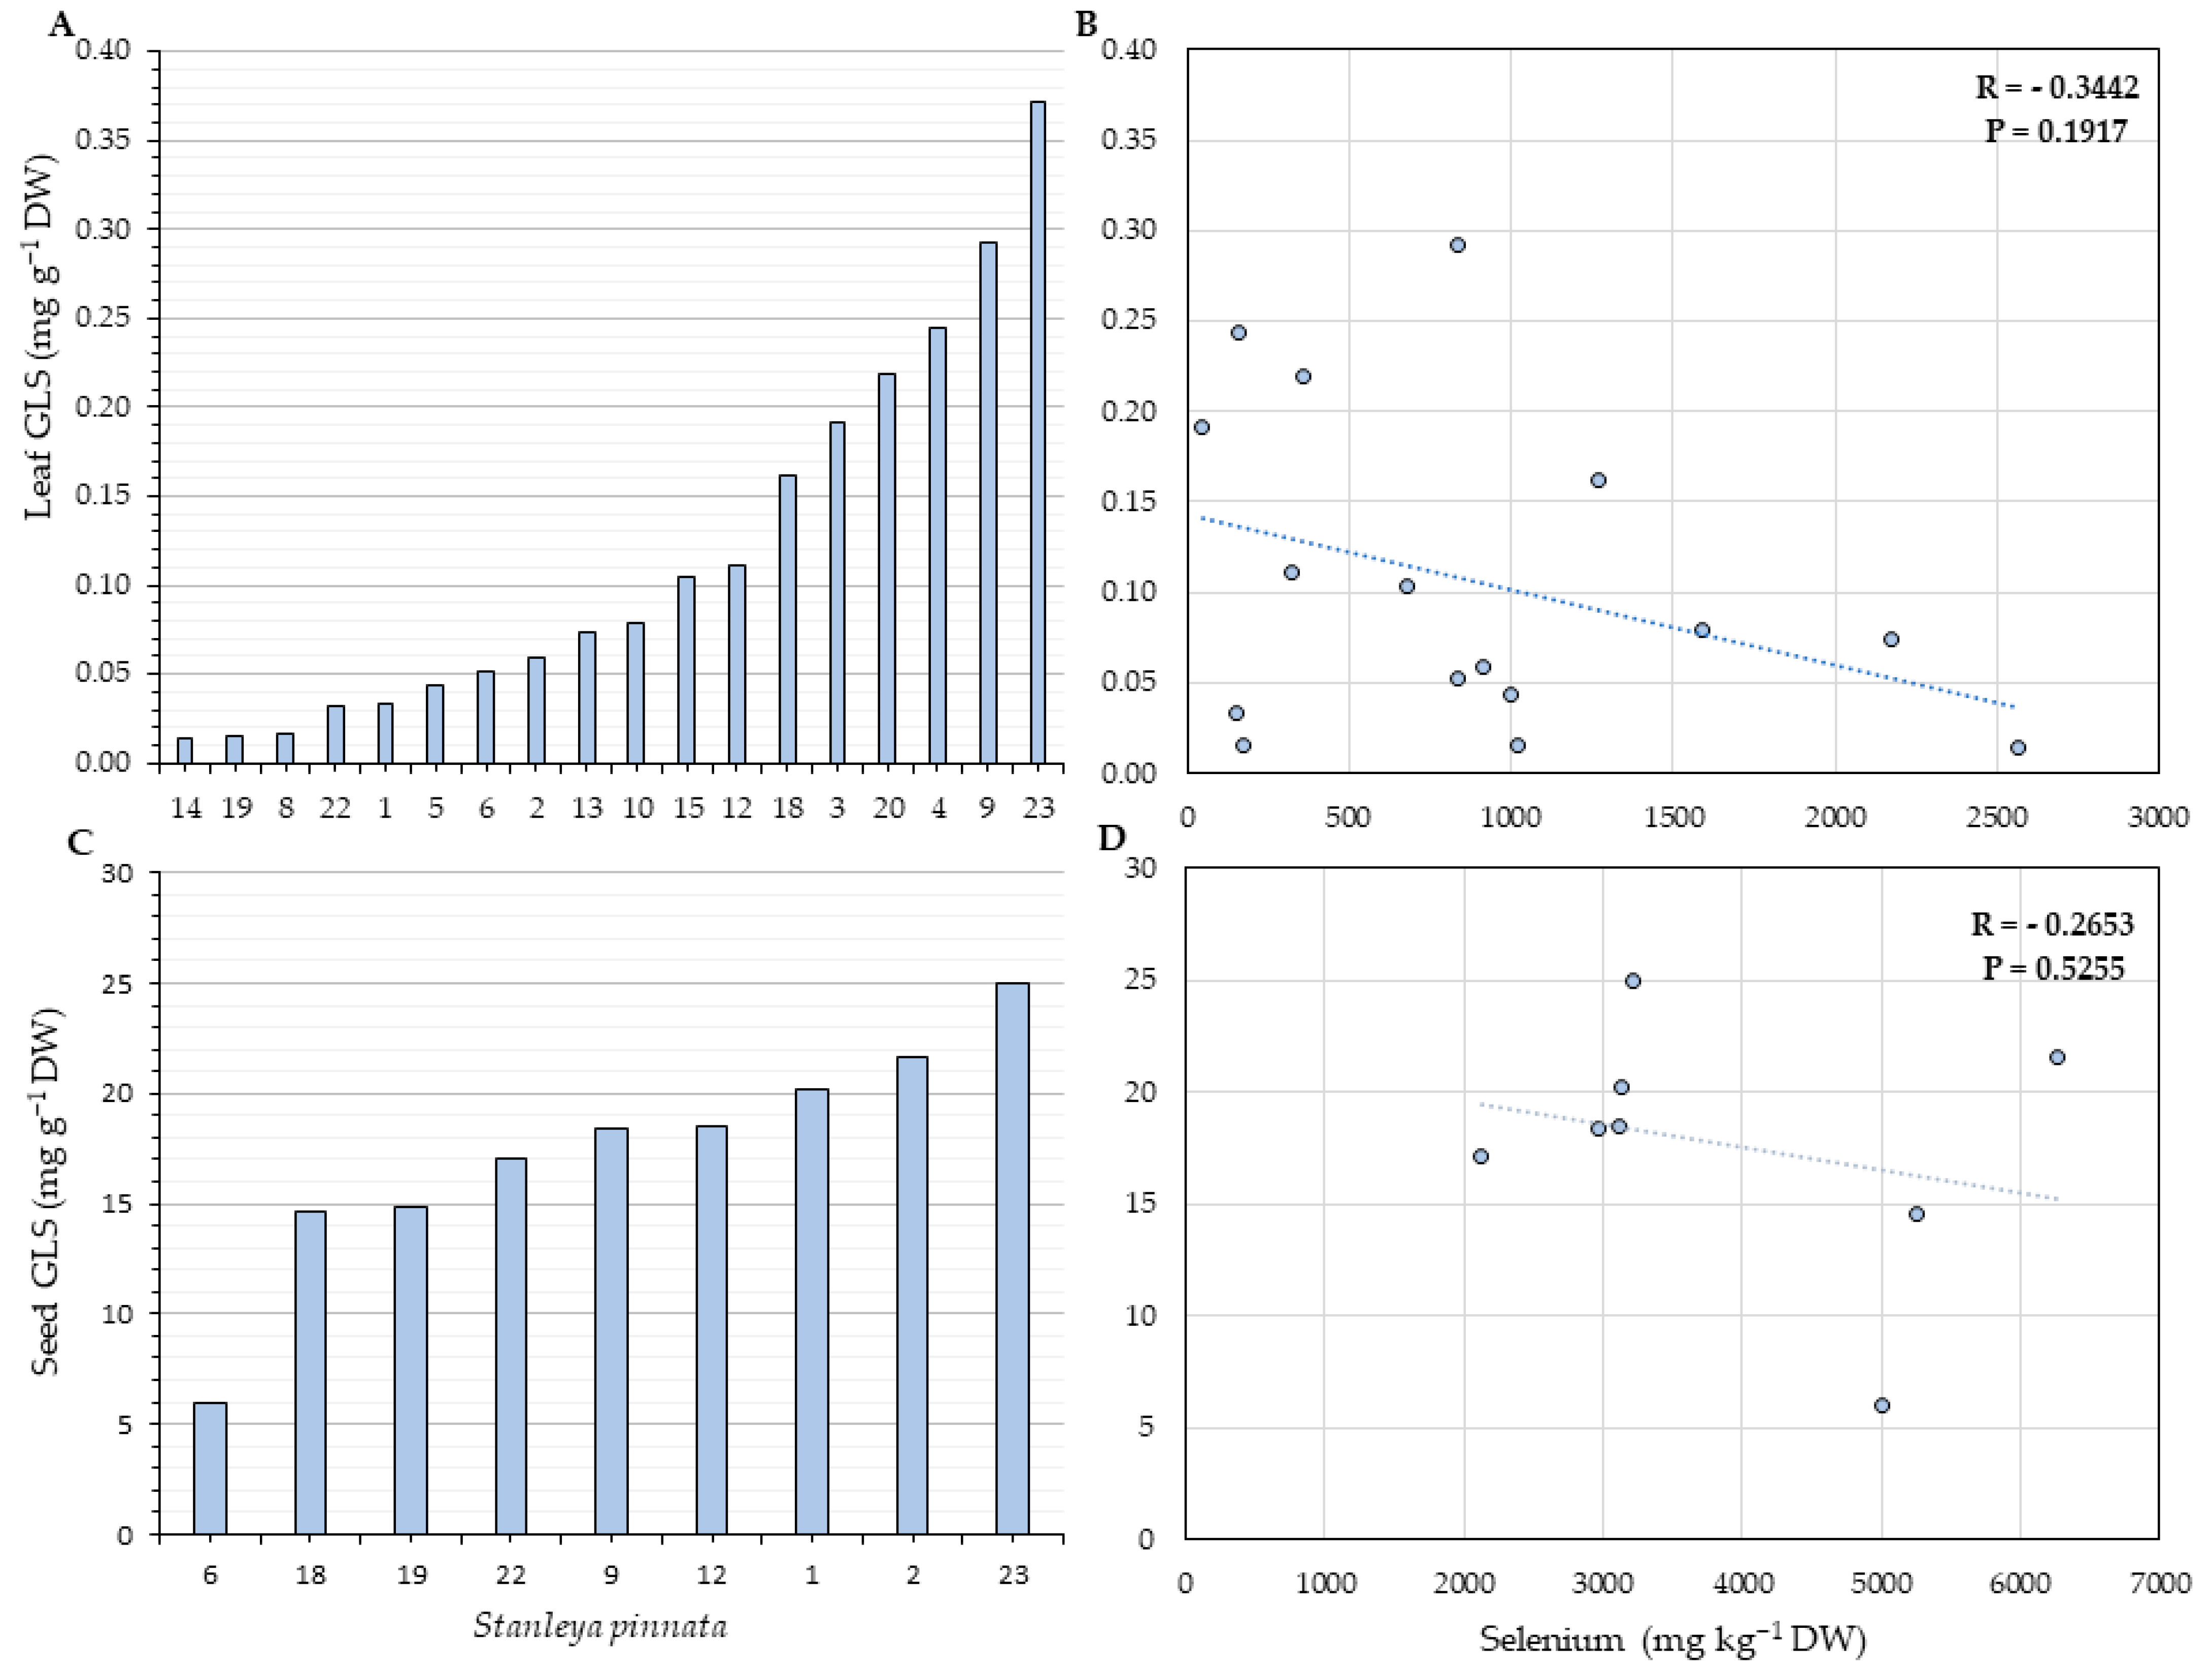
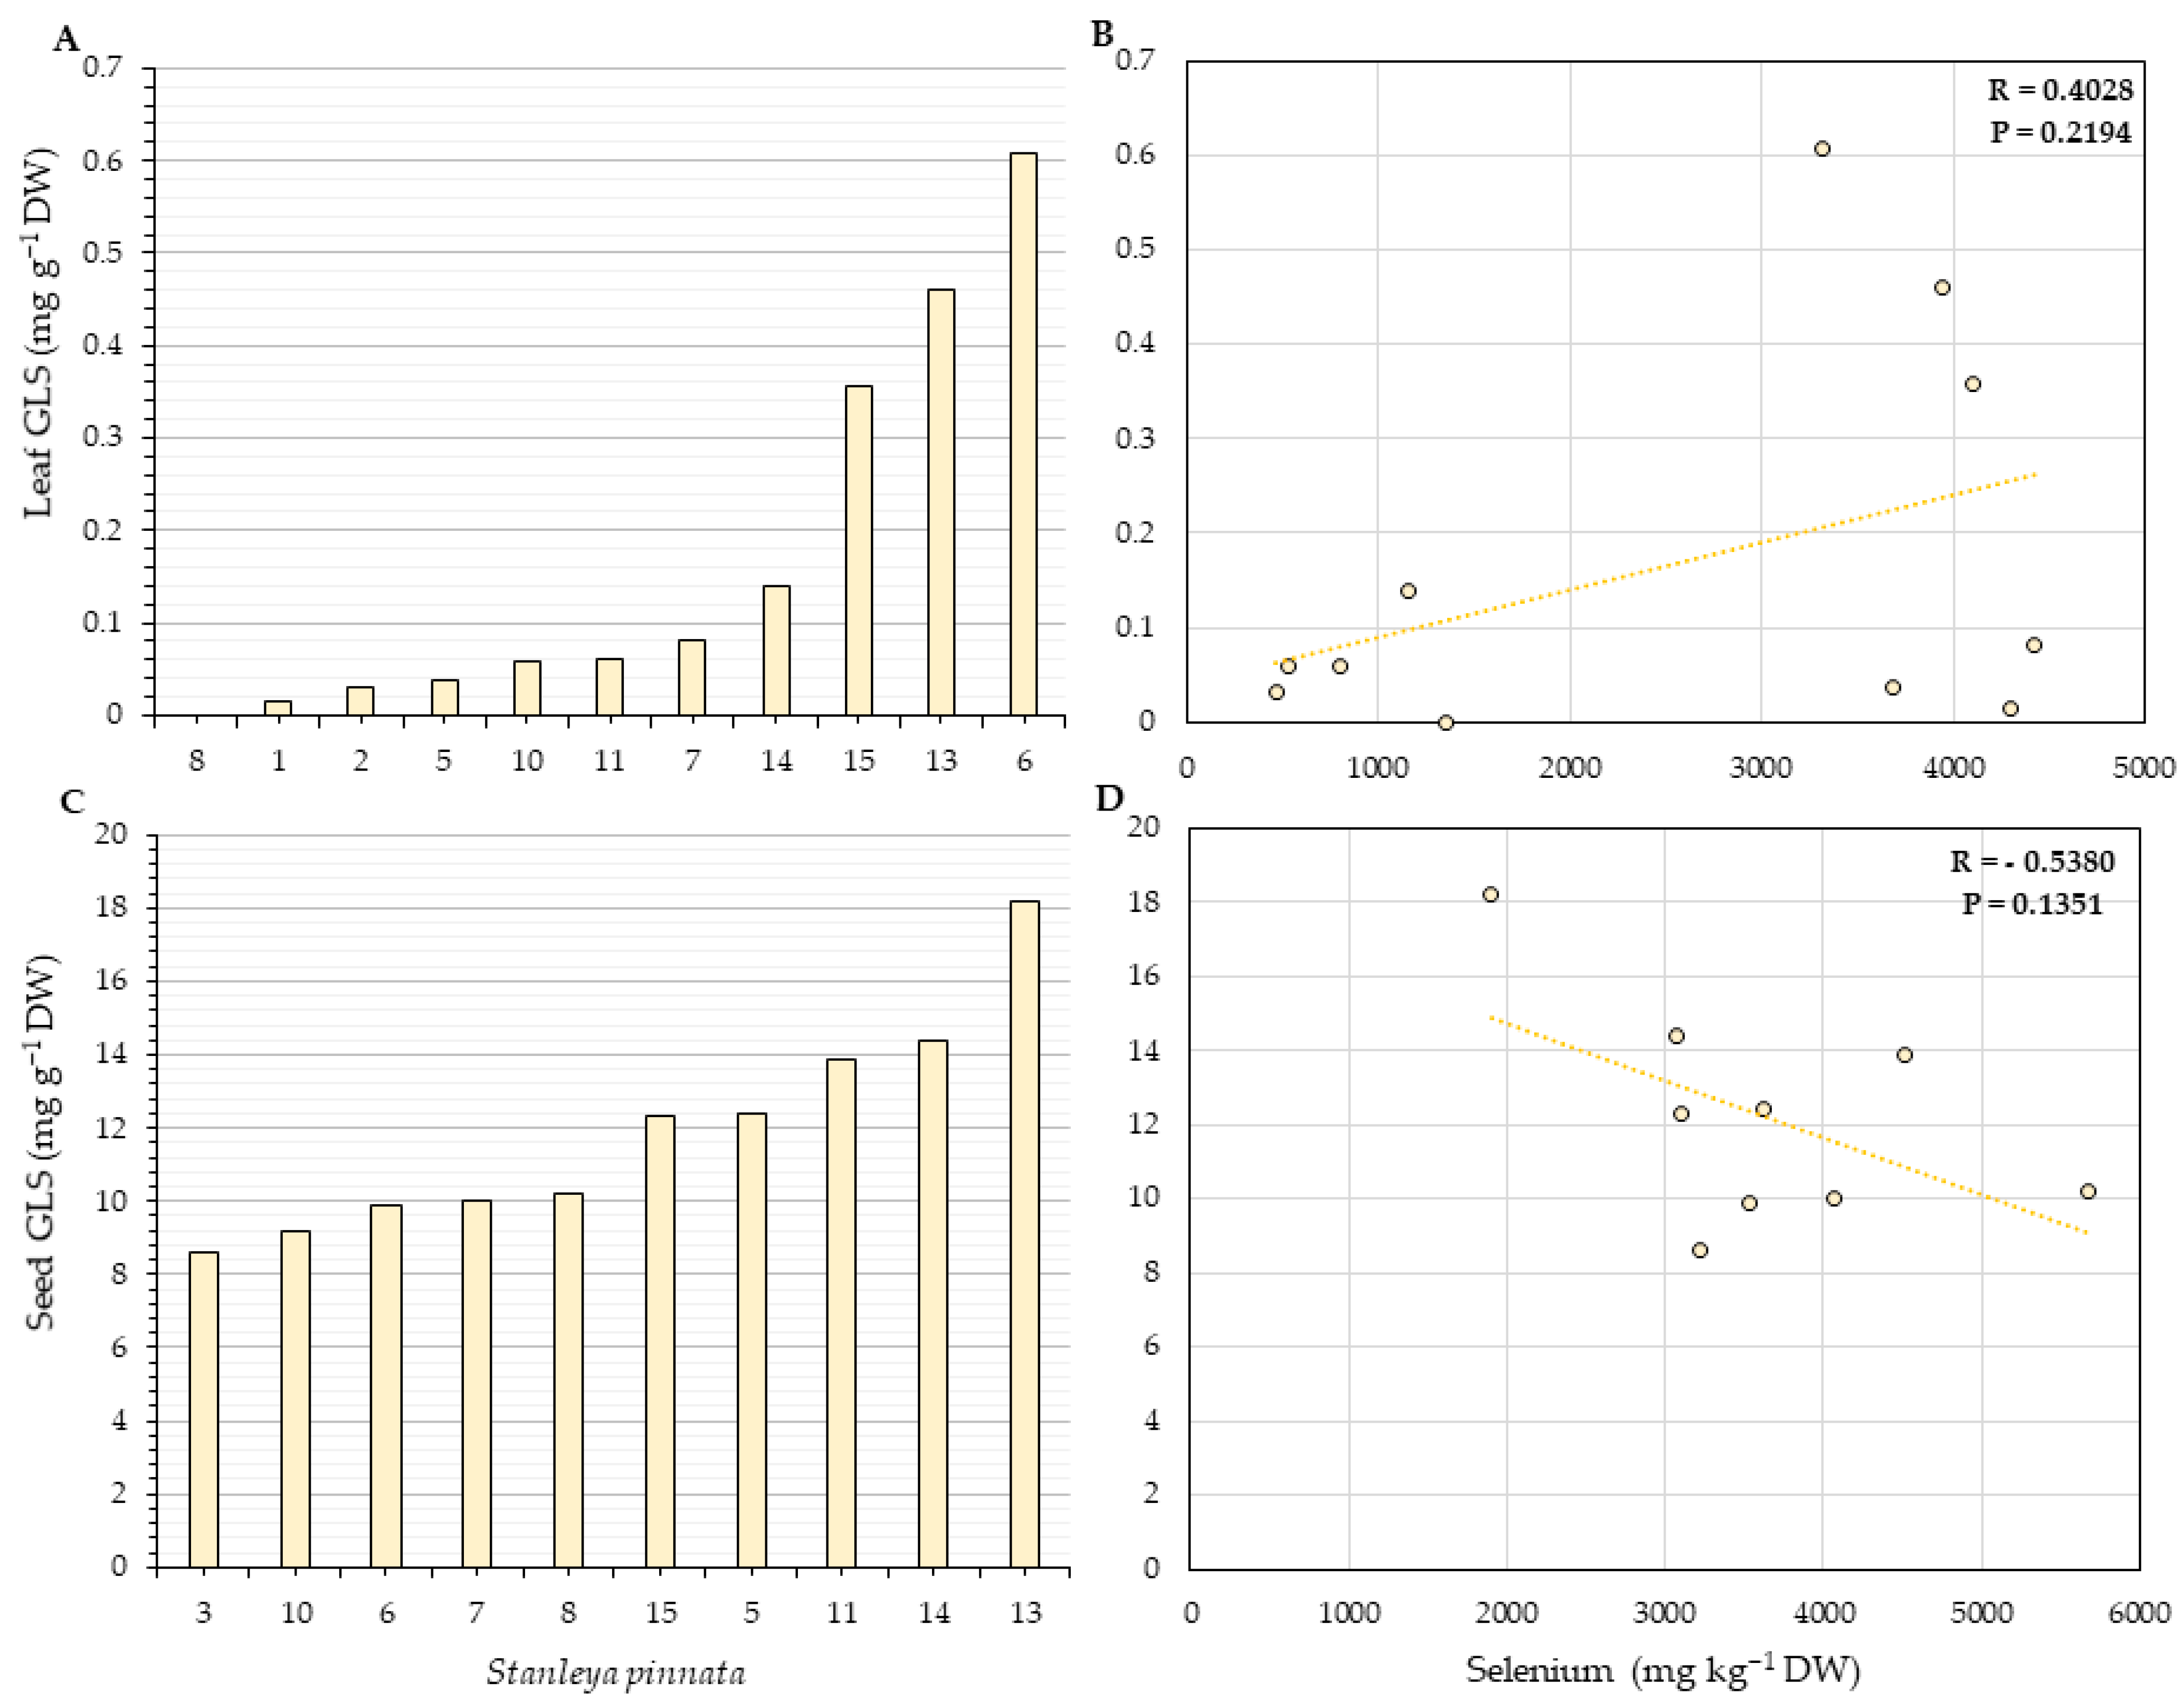
2.4. Glucosinolates Quantification
3. Discussion
4. Materials and Methods
4.1. Plant Material, Study Sites, and GPS Coordinates
4.2. Determination of Selenium Concentration
4.3. Herbivory and Fitness Parameters
4.4. Total Leaf Phenolics and Antioxidant Capacity
4.5. Glucosinolates Extraction and Quantification
4.6. Statistical Analysis
5. Conclusions
Supplementary Materials
Author Contributions
Funding
Institutional Review Board Statement
Informed Consent Statement
Data Availability Statement
Conflicts of Interest
References
- Schiavon, M.; Pilon-Smits, E.A.H. The fascinating facets of plant selenium accumulation—Biochemistry, physiology, evolution, and ecology. New Phytol. 2017, 213, 1582–1596. [Google Scholar] [CrossRef] [PubMed] [Green Version]
- Pilon-Smits, E.A.H.; Quinn, C.F.; Tapken, W.; Malagoli, M.; Schiavon, M. Physiological functions of beneficial elements. Curr. Opin. Plant Biol. 2009, 12, 267–274. [Google Scholar] [CrossRef] [PubMed]
- Feng, R.; Wei, C.; Tu, S. The roles of selenium in protecting plants against abiotic stresses. J. Environ. Exp. Bot. 2013, 87, 58–68. [Google Scholar] [CrossRef]
- Zembala, M.; Filek, M.; Walas, S.; Mrowiec, H.; Kornás, A.; Miszalski, Z.; Hatkainen, H. Effect of Selenium on macro and microelement distribution and physiological parameters of rape and wheat seedlings exposed to cadmium stress. Plant Soil 2010, 329, 457–468. [Google Scholar] [CrossRef]
- Feng, R.W.; Wei, C.Y. Antioxidative mechanisms on selenium accumulation in Pteris vittata L., a potential selenium phytoremediation plant. Plant Soil Environ. 2012, 58, 105–110. [Google Scholar]
- Novoselov, S.V.; Rao, M.; Onoshko, N.V.; Zhi, H.; Kryukov, G.V.; Xiang, Y.; Weeks, D.P.; Hatfield, D.L.; Gladyshev, V.N. Selenoproteins and selenocysteine insertion system in the model plant system, Chlamydomonas reinhardtii. EMBO J. 2002, 21, 3681–3693. [Google Scholar] [CrossRef] [PubMed] [Green Version]
- Lobanov, A.V.; Fomenko, D.E.; Zhang, Y.; Sengupta, A.; Hatfield, D.L.; Gladyshev, V.N. Evolutionary dynamics of eukaryotic selenoproteomes: Large selenoproteomes may associate with aquatic life and small with terrestrial life. Genome Biol. 2007, 8, R198. [Google Scholar] [CrossRef] [Green Version]
- Anderson, J.W. Selenium interactions in Sulfur metabolism. In Sulfur Nutrition and Assimilation in Higher Plants: Regulatory, Agricultural, and Environmental Aspects, 1st ed.; de Kok, L.J., Stulen, I., Rennenberg, H., Brunwold, C., Rauser, W.E., Eds.; SPB Academic Publishing: The Hague, The Netherlands, 1993; pp. 49–60. [Google Scholar]
- Van Hoewyk, D.; Takahashi, H.; Hess, A.; Tamaoki, M.; Pilon-Smits, E.A.H. Transcriptome analyses give insights into selenium-stress responses and selenium tolerance mechanisms in Arabidopsis. Physiol. Plant. 2008, 132, 236–253. [Google Scholar] [CrossRef]
- Van Hoewyk, D. A tale of two toxicities: Malformed selenium proteins and oxidative stress both contribute to selenium stress in plants. Ann. Bot. 2013, 112, 965–972. [Google Scholar] [CrossRef] [Green Version]
- White, P.J. Selenium accumulation by plants. Ann. Bot. 2016, 117, 217–235. [Google Scholar] [CrossRef] [Green Version]
- Winkel, L.H.; Vriens, B.; Jones, G.D.; Schneider, L.S.; Pilon-Smits, E.A.H.; Bañuelos, G.S. Selenium cycling across soil-plant-atmosphere interfaces: A critical review. Nutrients 2015, 7, 4199–4239. [Google Scholar] [CrossRef] [PubMed] [Green Version]
- Reynolds, R.J.B.; Jones, R.R.; Heiner, J.; Crane, K.M.; Pilon-Smits, E.A.H. Effects of selenium hyperaccumulators on soil selenium distribution and vegetation properties. Am. J. Bot. 2020, 107, 970–998. [Google Scholar] [CrossRef] [PubMed]
- Reynolds, R.J.B.; Jones, R.R.; Stonehouse, G.C.; El Mehdawi, A.F.; Lima, L.W.; Fakra, S.C.; Pilon-Smits, E.A.H. Identification and physiological comparison of plant species that show positive or negative co-occurrence with selenium hyperaccumulators. Metallomics 2020, 12, 133–143. [Google Scholar] [CrossRef] [PubMed]
- Banuelos, G.; Arroyo, I.; Pickering, I.J.; Yang, S.I.; Freeman, J.L. Selenium biofortification of broccoli and carrots grown in soil amended with Se-enriched hyperaccumulator Stanleya pinnata. Food Chem. 2015, 166, 603–608. [Google Scholar] [CrossRef]
- Cappa, J.J.; Pilon-Smits, E.A.H. Evolutionary aspects of elemental hyperaccumulation. Planta 2014, 239, 267–275. [Google Scholar] [CrossRef] [Green Version]
- Cappa, J.J.; Cappa, P.J.; El Mehdawi, A.F.; McAleer, J.M.; Simmons, M.P.; Pilon-Smits, E.A.H. Characterization of Selenium and Sulfur accumulation across the genus Stanleya (Brassicaceae): A field survey and common-garden experiment. Am. J. Bot. 2014, 101, 830–839. [Google Scholar] [CrossRef] [Green Version]
- Cappa, J.J.; Yetter, C.; Fakra, S.; Cappa, P.J.; DeTar, R.; Landes, C.; Pilon-Smits, E.A.H.; Simmons, M.P. Evolution of Selenium hyperaccumulation in Stanleya (Brassicaceae) as inferred from phylogeny, physiology, and X-ray microprobe analysis. New Phytol. 2015, 205, 583–595. [Google Scholar] [CrossRef]
- Freeman, J.L.; Tamaoki, M.; Stushnoff, C.; Quinn, C.F.; Cappa, J.J.; Devonshire, J.; Fakra, S.C.; Marcus, M.A.; McGrath, S.P.; Van Hoewyk, D.; et al. Molecular Mechanisms of Selenium Tolerance and Hyperaccumulation in Stanleya pinnata. Plant Phys. 2010, 153, 1630–1652. [Google Scholar] [CrossRef] [Green Version]
- Wang, J.; Cappa, J.J.; Harris, J.P.; Edger, P.P.; Zhou, W.; Pires, J.C.; Adair, M.; Unruh, S.A.; Simmons, M.P.; Schiavon, M.; et al. Transcriptome-wide comparison of selenium hyperaccumulator and nonaccumulator Stanleya species provides new insight into key processes mediating the hyperaccumulation syndrome. Plant. Biotechnol. J. 2018, 16, 1582–1594. [Google Scholar] [CrossRef] [Green Version]
- Gupta, M.; Gupta, S. An overview of Selenium Uptake, Metabolism, and Toxicity in plants. Front. Plant Sci. 2017, 7, 2074. [Google Scholar] [CrossRef] [Green Version]
- Boyd, R.S.; Martens, S.N. The raison d’être for metal hyperaccumulation by plants. In The Vegetation of Ultramafic (Serpentine) Soils, 1st ed.; Baker, A.J.M., Proctor, J., Reeves, R.D., Eds.; Intercept Limited: Andover, UK, 1992; pp. 279–289. [Google Scholar]
- Quinn, C.F.; Freeman, J.L.; Galeas, M.L.; Klamper, E.M.; Pilon-Smits, E.A.H. The role of selenium in protecting plants against prairie dog herbivory: Implications for the evolution of selenium hyperaccumulation. Oecologia 2007, 155, 267–275. [Google Scholar] [CrossRef] [PubMed]
- Quinn, C.F.; Freeman, J.L.; Reynolds, R.J.B.; Cappa, J.J.; Fakra, S.C.; Marcus, M.A.; Lindblom, S.D.; Quinn, E.K.; Bennet, L.E.; Pilon-Smits, E.A.H. Selenium hyperaccumulation offers protection from cell disruptor herbivores. BMC Ecol. 2010, 10, 19. [Google Scholar] [CrossRef] [PubMed] [Green Version]
- Freeman, J.L.; Quinn, C.F.; Lindblom, S.D.; Klamper, E.M.; Pilon-Snits, E.A.H. Selenium protects the hyperaccumulator Stanleya pinnata against black-tailed prairie dog herbivory in native seleniferous habitats1. Am. J. Bot. 2009, 96, 1075–1085. [Google Scholar] [CrossRef] [Green Version]
- Freeman, J.L.; Lindblom, S.D.; Quinn, C.F.; Fakra, S.C.; Marcus, M.A.; Pilon-Snits, E.A.H. Selenium accumulation protects plants from herbivory by Orthoptera via toxicity and deterrence. New Phytol. 2007, 175, 490–500. [Google Scholar] [CrossRef] [PubMed] [Green Version]
- El Mehdawi, A.F.; Quinn, C.F.; Pilon-Smits, E.A.H. Effects of selenium hyperaccumulation on plant–plant interactions: Evidence for elemental allelopathy? New Phytol. 2011, 191, 120–131. [Google Scholar] [CrossRef]
- El Mehdawi, A.F.; Quinn, C.F.; Pilon-Smits, E.A.H. Selenium Hyperaccumulators Facilitate Selenium-Tolerant Neighbors via Phytoenrichment and Reduced Herbivory. Curr. Biol. 2011, 21, 1440–1449. [Google Scholar] [CrossRef] [Green Version]
- El Mehdawi, A.F.; Pilon-Smits, E.A.H. Ecological aspects of plant selenium hyperaccumulation. Plant Biol. 2012, 14, 1–10. [Google Scholar] [CrossRef]
- Galeas, M.L.; Klamper, E.M.; Bennet, L.E.; Kondratieff, B.C.; Quinn, C.; Pilon-Smits, E.A.H. Selenium hyperaccumulation reduces plant arthropod loads in the field. New Phytol. 2007, 177, 715–724. [Google Scholar] [CrossRef]
- El Mehdawi, A.F.; Lindblom, S.D.; Cappa, J.J.; Fakra, S.C.; Pilon-Snits, E.A.H. Do Selenium Hyperaccumulators Affect Selenium Speciation in Neighboring Plants and Soil? An X-ray Microprobe analysis. Int. J. Phytoremediat. 2015, 17, 753–765. [Google Scholar] [CrossRef]
- Freeman, J.L.; Quinn, C.F.; Marcus, M.A.; Fakra, S.C.; Pilon-Snits, E.A.H. Selenium-Tolerant Diamondback Moth Disarms Hyperaccumulator Plant Defense. Curr. Biol. 2006, 16, 2181–2192. [Google Scholar] [CrossRef] [Green Version]
- Freeman, J.L.; Marcus, M.; Fakra, S.C.; Devonshire, J.; McGrath, S.P.; Quinn, C.; Pilon-Smits, E.A.H. Selenium Hyperaccumulator Plants Stanleya pinnata and Astragalus bisulcatus Are Colonized by Se-Resistant, Se-Excluding Wasp and Beetle Seed Herbivores. PLoS ONE 2012, 7, e50516. [Google Scholar] [CrossRef] [PubMed]
- Valdez Barillas, J.R.; Quinn, C.F.; Freeman, J.L.; Lindblom, S.D.; Fakra, S.C.; Marcus, M.A.; Gilligan, T.M.; Alford, E.R.; Wangeline, A.L.; Pilon-Smits, E.A.H. Selenium Distribution, and Speciation in the Hyperaccumulator Astragalus bisulcatus and Associated Ecological Partners. Plant Phys. 2012, 159, 1834–1844. [Google Scholar] [CrossRef] [PubMed] [Green Version]
- Freeman, J.L.; Zhang, L.H.; Marcus, M.A.; Fakra, S.C.; McGrath, S.P.; Pilon-Snits, E.A.H. Spatial Imaging, Speciation, and Quantification of Selenium in the Hyperaccumulator Plants Astragalus bisulcatus and Stanleya pinnata. Plant Phys. 2006, 142, 124–134. [Google Scholar] [CrossRef] [PubMed] [Green Version]
- Quinn, C.F.; Wyant, K.A.; Wangeline, A.L.; Shulman, J.; Galeas, M.L.; Valdez, J.R.; Self, J.R.; Paschke, M.W.; Pilon-Smits, E.A.H. Enhanced decomposition of Se hyperaccumulator litter in a seleniferous habitat-evidence for special decomposers? Plant Soil 2011, 341, 51–61. [Google Scholar] [CrossRef]
- Quinn, C.F.; Prins, C.N.; Freeman, J.L.; Gross, A.M.; Hantzis, L.J.; Reynolds, R.J.B.; Yang, S.; Covey, P.A.; Banuelos, G.S.; Pickering, I.J.; et al. Selenium accumulation in flowers and its effects on pollination. New Phytol. 2011, 192, 727–737. [Google Scholar] [CrossRef]
- Lindblom, S.D.; Fakra, S.C.; Landon, J.; Schulz, P.; Tracy, B.; Pilon-Smits, E.A.H. Inoculation of selenium hyperaccumulator Stanleya pinnata and related non-accumulator Stanleya elata with hyperaccumulator rhizosphere fungi—Investigation of effects on Se accumulation and speciation. SPPS 2014, 150, 107–118. [Google Scholar]
- Cochran, A.T.; Bauer, J.; Metcalf, J.L.; Lovecka, P.; Sura de Jong, M.; Warris, S.; Mooijman, P.J.W.; Van der Meer, I.; Knight, R.; Pilon-Smits, E.A.H. Plant Selenium hyperaccumulation affects rhizosphere: Enhanced species richness and altered species composition. Phytobiomes J. 2018, 2, 88–91. [Google Scholar] [CrossRef]
- Wangeline, A.L.; Valdez, J.R.; Lindblom, S.D.; Bowling, K.L.; Reeves, F.B.; Pilon-Smits, E.A.H. Characterization of rhizosphere fungi from selenium hyperaccumulator and nonhyperaccumulator plants along the eastern rocky mountain front range1. Am. J. Bot. 2011, 98, 1139–1147. [Google Scholar] [CrossRef] [Green Version]
- Galeas, M.L.; Zhang, L.H.; Freeman, J.L.; Wegner, M.; Pilon-Smits, E.A.H. Blackwell Publishing Ltd. Seasonal fluctuations of selenium and sulfur accumulation in selenium hyperaccumulators and related nonaccumulators. New Phytol. 2007, 173, 517–525. [Google Scholar] [CrossRef]
- White, P.J.; Broadley, M.R. Biofortification of crops with seven mineral elements often lacking in human diets—Iron, zin, copper, calcium, magnesium, selenium, and iodine. New Phytol. 2009, 182, 49–84. [Google Scholar] [CrossRef]
- Hanson, B.; Lindblom, S.D.; Loeffler, M.L.; Pilon-Smits, E.A.H. Selenium protects plants from phloem-feeding aphids due to both deterrence and toxicity. New Phytol. 2004, 162, 655–662. [Google Scholar] [CrossRef] [PubMed]
- Hanson, B.; Garifullina, G.F.; Lindblom, S.D.; Wangeline, A.; Ackley, A.; Kramer, K.; Norton, A.; Lawrence, C.; Pilon-Smits, E.A.H. Selenium Accumulation Protects Brassica juncea from invertebrate herbivory and fungal infection. New Phytol. 2003, 159, 461–469. [Google Scholar] [CrossRef] [PubMed] [Green Version]
- Lyons, G.H.; Gene, Y.; Soole, K.; Stangoulis, J.C.R.; Liu, F.; Graham, R.D. Selenium increases seed production in Brassica. Plant Soil 2009, 318, 73–80. [Google Scholar] [CrossRef]
- Ekanayake, L.J.; Thavarajah, D.; Vial, E.; Schatz, B.; McGee, R.; Thavarajah, P. Selenium fertilization on lentil (Lens culinaris Medikus) grain yield, seed selenium concentration, and antioxidant activity. Field Crop. Res. 2015, 177, 9–14. [Google Scholar] [CrossRef]
- Thavarajah, D.; Thavarajah, P.; Vial, E.; Gebhardt, M.; Lacher, C.; Kumar, S.; Combs, G.F. Will selenium increase lentil (Lens culinaris Medikus) yield and seed quality? Front. Plant Sci. 2015, 6, 356. [Google Scholar] [CrossRef] [Green Version]
- Xue, T.L.; Hartikainen, H.; Piironen, V. Antioxidative and growth-promoting effect of selenium on senescing lettuce. Plant Soil 2001, 237, 55–61. [Google Scholar] [CrossRef]
- Cuypers, A.; Plusquin, M.; Remans, T.; Jozefczak, M.; Keunen, E.; Gielen, H.; Opdenakker, K.; Nair, A.R.; Munters, E.; Artois, T.J.; et al. Cadmium stress: An oxidative challenge. Biometals 2010, 23, 927–940. [Google Scholar] [CrossRef]
- Foyer, C.H.; Noctor, G. Managing the cellular redox hub in photosynthetic organisms. Plant Cell Environ. 2012, 35, 199–201. [Google Scholar] [CrossRef]
- Shieber, M.; Chandel, N.S. ROS Function in Redox Signaling and Oxidative stress. Curr. Biol. 2014, 24, R453–R462. [Google Scholar] [CrossRef] [Green Version]
- El-Maarouf-Bouteau, H.; Bailly, C. Oxidative signaling in seed germination and dormancy. Plant Signal. Behav. 2008, 3, 175–182. [Google Scholar] [CrossRef] [Green Version]
- Boyd, R.S. The defense hypothesis of elemental hyperaccumulation: Status, challenges, and new directions. Plant Soil 2007, 293, 153–176. [Google Scholar] [CrossRef]
- Matich, A.J.; McKenzie, M.J.; Lill, R.E.; Brummell, D.A.; McGhie, T.K.; Chen, R.K.Y.; Rowan, D.D. Selenoglucosinolates and their metabolites produced in Brassica spp. fertilized with sodium selenate. Phytochemistry 2012, 75, 140–152. [Google Scholar] [CrossRef] [PubMed]
- Matich, A.J.; McKenzie, M.J.; Lill, R.E.; McGhie, T.K.; Chen, R.K.Y.; Rowan, D.D. Distribution of Selenoglucosinolates and Their Metabolites in Brassica Treated with Sodium Selenate. J. Agric. Food Chem. 2015, 63, 1896–1905. [Google Scholar] [CrossRef] [PubMed]
- Tian, M.; Yang, Y.; Ávila, F.W.; Fish, T.; Yuan, H.; Hui, M.; Pan, S.; Thannhauser, T.W.; Li, L. Effects of Selenium Supplementation on Glucosinolate Biosynthesis in Broccoli. J. Agric. Food Chem. 2018, 66, 8036–8044. [Google Scholar] [CrossRef] [PubMed]
- Toler, H.D.; Charron, C.S.; Sams, C.E. Selenium Increases Sulfur Uptake and Regulates Glucosinolate Metabolism in Rapid-cycling Brassica oleracea. J. Am. Soc. Hortic. Sci. 2007, 132, 14–19. [Google Scholar] [CrossRef] [Green Version]
- Zarcinas, B.; Cartwright, B.; Spouncer, L. Nitric acid digestion and multi-element analysis of plant material by inductively coupled plasma spectrometry. Commun. Soil Sci. Plant Anal. 1987, 18, 131–146. [Google Scholar] [CrossRef]
- Miller, N.J.; Rice-Evans, C.A. Spectrophotometric determination of antioxidant activity. Redox Rep. 1996, 2, 161–171. [Google Scholar] [CrossRef]
- Singleton, V.L.; Rossi, J.A., Jr. Colorimetry of total phenolics with phosphomolybdic-phosphotungstic acid reagents. Am. J. Enol. Vitic. 1965, 18, 144–158. [Google Scholar]
- Argentieri, M.P.; Accogli, R.; Fanizzi, F.P.; Avato, P. Glucosinolates profile of “mugnolo”, a variety of Brassica oleracea L. native to southern Italy (Salento). Planta Med. 2011, 77, 287–292. [Google Scholar] [CrossRef] [Green Version]
- Dall’Acqua, S.; Ertani, A.; Pilon-Smits, E.A.H.; Fabrega-Prats, M.; Schiavon, M. Selenium Biofortification Differentially Affects Sulfur Metabolism and Accumulation of Phytochemicals in Two Rocket Species (Eruca sativa Mill. and Diplotaxis tenuifolia) Grown in Hydroponics. Plants 2019, 8, 68. [Google Scholar] [CrossRef] [Green Version]


Publisher’s Note: MDPI stays neutral with regard to jurisdictional claims in published maps and institutional affiliations. |
© 2022 by the authors. Licensee MDPI, Basel, Switzerland. This article is an open access article distributed under the terms and conditions of the Creative Commons Attribution (CC BY) license (https://creativecommons.org/licenses/by/4.0/).
Share and Cite
Lima, L.W.; Castleberry, M.; Wangeline, A.L.; Aguirre, B.; Dall’Acqua, S.; Pilon-Smits, E.A.H.; Schiavon, M. Hyperaccumulator Stanleya pinnata: In Situ Fitness in Relation to Tissue Selenium Concentration. Plants 2022, 11, 690. https://doi.org/10.3390/plants11050690
Lima LW, Castleberry M, Wangeline AL, Aguirre B, Dall’Acqua S, Pilon-Smits EAH, Schiavon M. Hyperaccumulator Stanleya pinnata: In Situ Fitness in Relation to Tissue Selenium Concentration. Plants. 2022; 11(5):690. https://doi.org/10.3390/plants11050690
Chicago/Turabian StyleLima, Leonardo Warzea, McKenna Castleberry, Ami L. Wangeline, Bernadette Aguirre, Stefano Dall’Acqua, Elizabeth A. H. Pilon-Smits, and Michela Schiavon. 2022. "Hyperaccumulator Stanleya pinnata: In Situ Fitness in Relation to Tissue Selenium Concentration" Plants 11, no. 5: 690. https://doi.org/10.3390/plants11050690