
Flax and Sorghum: Multi-Element Contents and Nutritional Values within 210 Varieties and Potential Selection for Future Climates to Sustain Food Security


Abstract
:1. Introduction
2. Materials and Methods
2.1. Flax and Sorghum Seeds
2.2. Multi-Elemental Seed Analysis
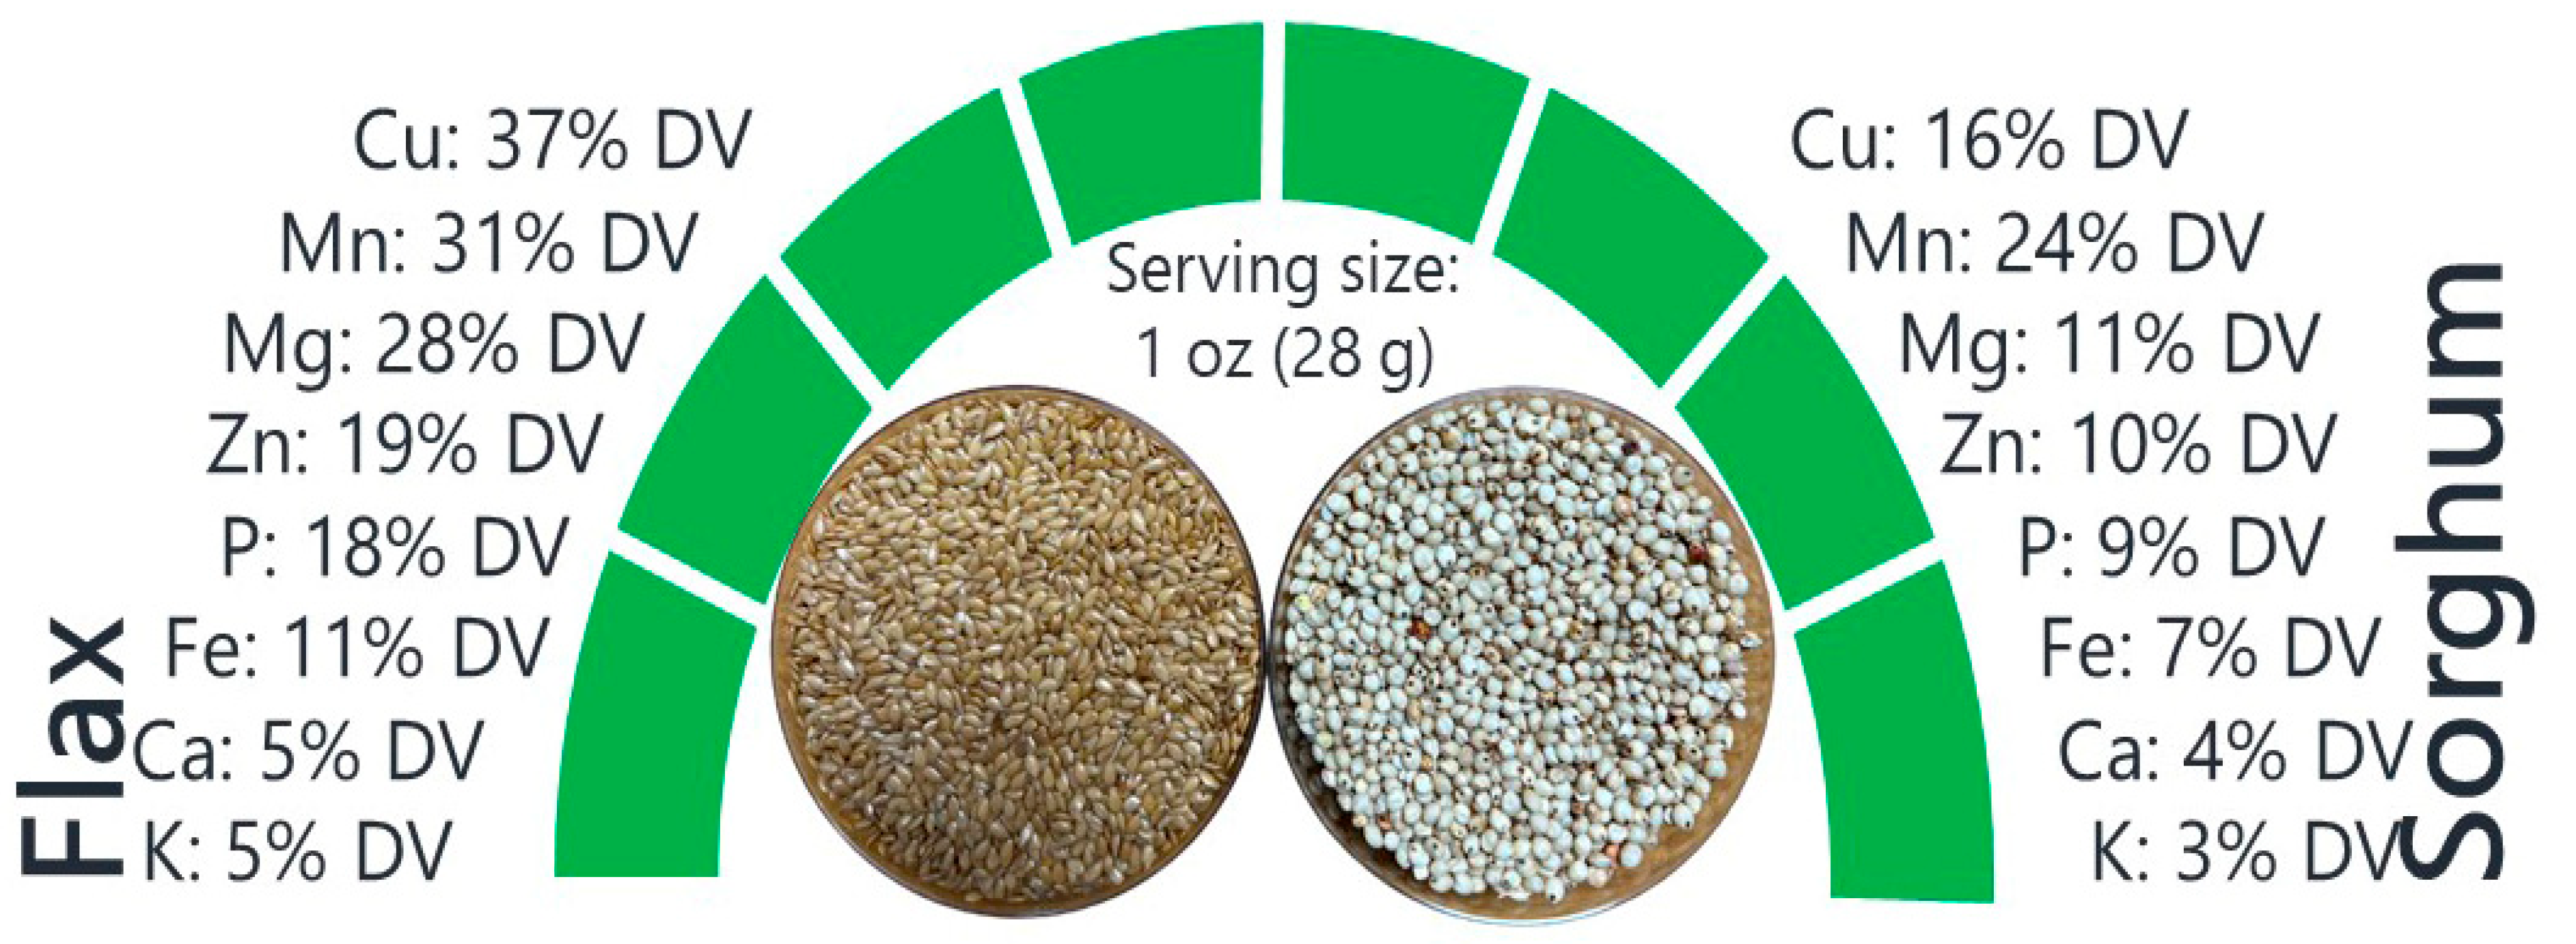
2.3. Estimating Nutritional Value (% DV)
2.4. Data Analysis
3. Results
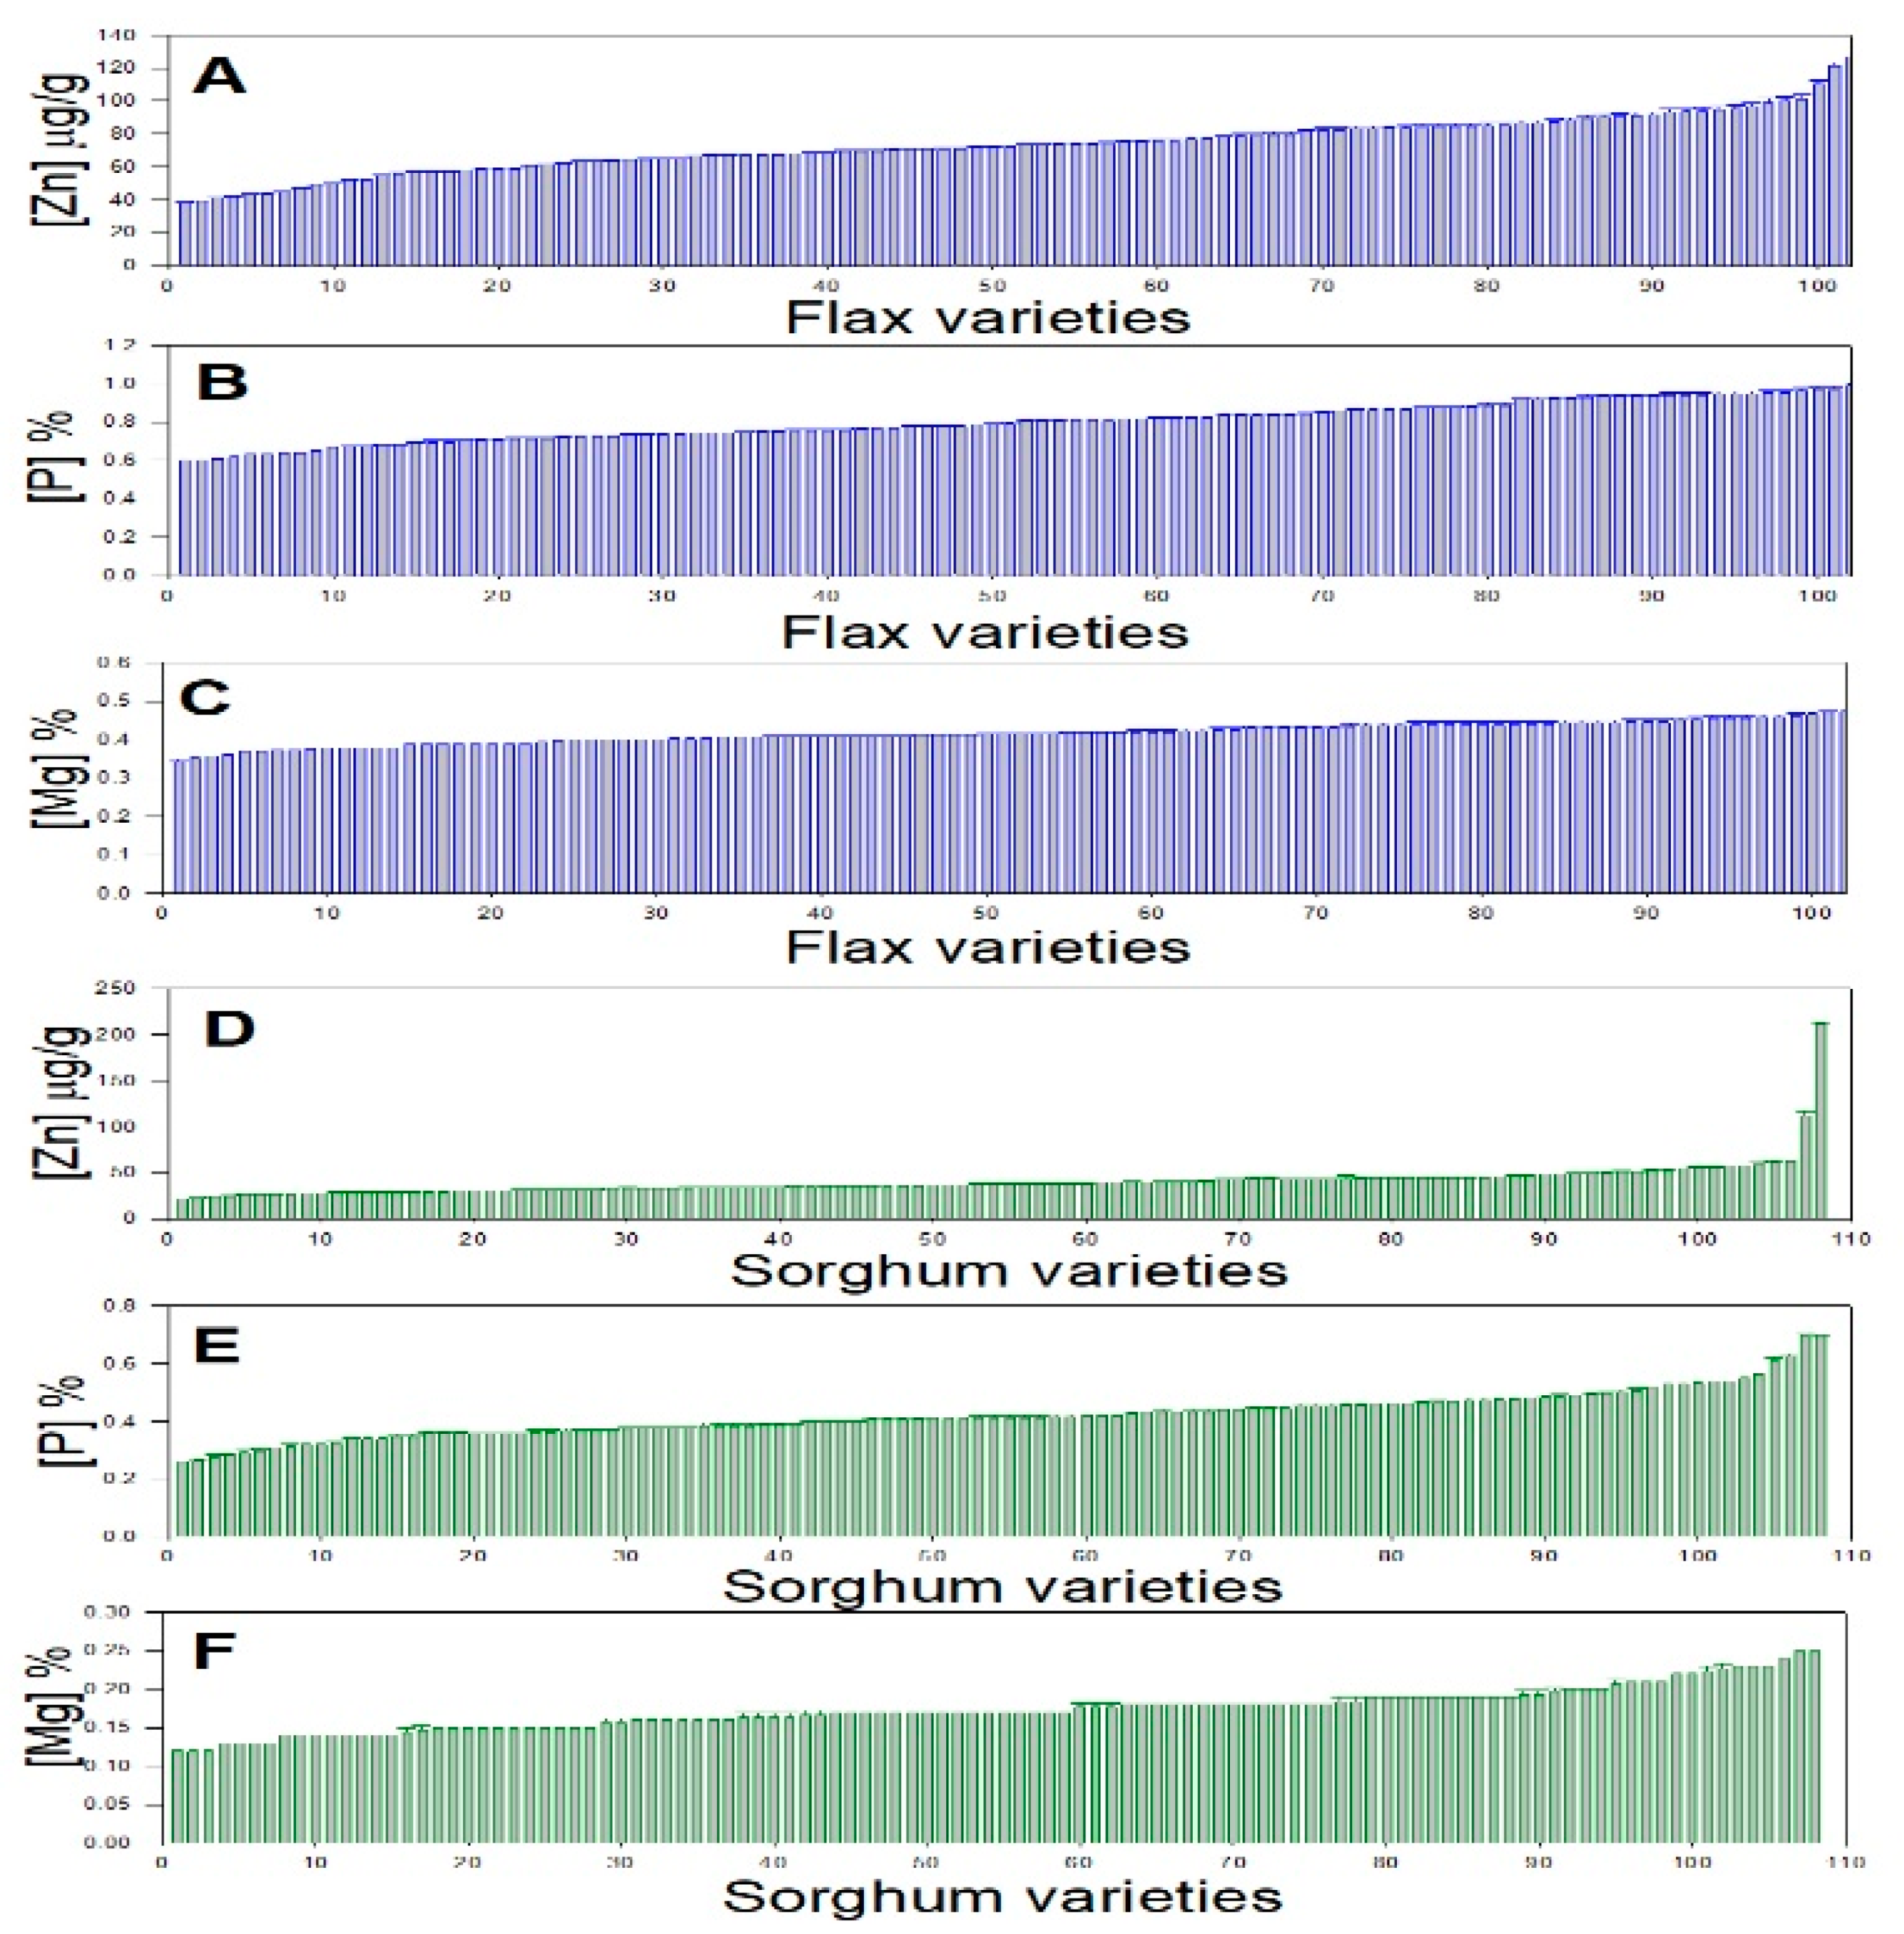
3.1. Variations in Flax and Sorghum Multi-Element Contents

| Flax Variety | N | P | K | Mg | Ca | S | B | Zn | Mn | Fe | Cu | Mo |
|---|---|---|---|---|---|---|---|---|---|---|---|---|
| Ames8040 | 3.36 | 0.82 | 0.75 | 0.46 | 0.23 | 0.27 | 17.7 | 93.5 | 23.8 | 87.4 | 10.4 | 3.06 |
| Ariane | 4.37 | 0.93 | 0.86 | 0.44 | 0.20 | 0.30 | 18.7 | 93.4 | 21.7 | 71.5 | 15.5 | 2.64 |
| Beladiy6903 | 3.82 | 0.81 | 0.78 | 0.44 | 0.21 | 0.29 | 18.5 | 70.4 | 21.1 | 67.1 | 9.53 | 2.91 |
| Benvenotolabrador | 3.91 | 0.76 | 0.73 | 0.45 | 0.22 | 0.27 | 18.0 | 72.1 | 28.9 | 75.0 | 8.38 | 2.85 |
| Charurraolajlen19 | 3.66 | 0.77 | 0.72 | 0.43 | 0.22 | 0.26 | 21.0 | 78.8 | 23.7 | 69.4 | 11.9 | 2.79 |
| Charurraolajlen29 | 3.87 | 0.71 | 0.77 | 0.41 | 0.20 | 0.25 | 15.7 | 70.7 | 20.9 | 67.5 | 7.54 | 3.11 |
| CIli1319 | 3.41 | 0.81 | 0.81 | 0.45 | 0.19 | 0.25 | 15.8 | 67.7 | 19.9 | 62.6 | 8.97 | 2.85 |
| CIli1339 | 4.00 | 0.78 | 0.81 | 0.42 | 0.20 | 0.28 | 14.9 | 49.3 | 21.8 | 65.6 | 12.0 | 2.89 |
| CIli1340 | 3.52 | 0.83 | 0.74 | 0.44 | 0.24 | 0.29 | 20.7 | 71.2 | 26.4 | 71.5 | 14.9 | 2.72 |
| CIli1341 | 4.14 | 0.71 | 0.68 | 0.41 | 0.22 | 0.29 | 20.6 | 64.3 | 20.6 | 65.8 | 9.05 | 2.79 |
| CIli1350 | 3.73 | 0.73 | 0.71 | 0.41 | 0.22 | 0.27 | 15.5 | 38.0 | 20.1 | 67.3 | 9.19 | 2.97 |
| CIli1351 | 4.16 | 0.75 | 0.72 | 0.43 | 0.24 | 0.29 | 18.2 | 64.1 | 21.7 | 71.1 | 8.13 | 2.92 |
| CIli1354 | 4.11 | 0.73 | 0.71 | 0.41 | 0.21 | 0.27 | 15.7 | 41.1 | 21.0 | 65.2 | 9.30 | 3.05 |
| CIli1369 | 4.08 | 0.74 | 0.68 | 0.42 | 0.22 | 0.29 | 20.5 | 73.5 | 19.9 | 62.5 | 14.2 | 2.88 |
| CIli1370 | 3.47 | 0.86 | 1.08 | 0.38 | 0.30 | 0.27 | 12.3 | 75.6 | 24.3 | 81.4 | 12.2 | 2.60 |
| CIli1373 | 3.37 | 0.94 | 1.18 | 0.42 | 0.32 | 0.26 | 10.2 | 56.9 | 23.6 | 83.1 | 11.4 | 3.37 |
| CIli1374 | 3.58 | 0.87 | 0.87 | 0.47 | 0.24 | 0.27 | 17.4 | 60.4 | 38.8 | 64.3 | 12.8 | 3.81 |
| CIli1395 | 3.61 | 0.82 | 0.87 | 0.43 | 0.22 | 0.28 | 16.3 | 43.8 | 19.9 | 64.4 | 8.65 | 3.24 |
| CIli1397 | 3.59 | 0.95 | 1.07 | 0.40 | 0.34 | 0.26 | 9.61 | 52.1 | 28.2 | 74.2 | 10.5 | 3.25 |
| CIli1404 | 3.73 | 0.84 | 0.82 | 0.44 | 0.24 | 0.28 | 20.8 | 63.2 | 23.9 | 54.5 | 15.1 | 2.82 |
| CIli1418 | 4.34 | 0.97 | 0.88 | 0.39 | 0.38 | 0.29 | 11.7 | 95.2 | 30.5 | 95.0 | 16.2 | 3.05 |
| CIli1426 | 4.20 | 0.78 | 0.81 | 0.41 | 0.21 | 0.28 | 16.8 | 43.6 | 21.7 | 59.9 | 8.85 | 3.23 |
| CIli1427 | 3.91 | 0.83 | 0.89 | 0.42 | 0.27 | 0.29 | 11.2 | 63.1 | 18.8 | 71.7 | 8.38 | 3.84 |
| CIli1429 | 3.88 | 0.93 | 1.10 | 0.40 | 0.32 | 0.27 | 11.0 | 83.1 | 26.3 | 84.1 | 14.38 | 2.27 |
| CIli1431 | 4.20 | 0.81 | 0.82 | 0.42 | 0.23 | 0.29 | 15.6 | 44.8 | 21.8 | 65.5 | 9.49 | 2.75 |
| CIli1436 | 4.36 | 0.74 | 0.76 | 0.39 | 0.24 | 0.30 | 25.3 | 81.5 | 28.5 | 74.0 | 15.5 | 2.96 |
| CIli1449 | 3.69 | 0.87 | 0.86 | 0.44 | 0.25 | 0.26 | 15.5 | 54.9 | 21.8 | 43.7 | 12.3 | 2.69 |
| CIli1452 | 4.55 | 0.70 | 0.73 | 0.41 | 0.22 | 0.29 | 20.2 | 63.7 | 22.7 | 73.4 | 9.96 | 3.22 |
| CIli1458 | 3.94 | 0.81 | 0.78 | 0.43 | 0.22 | 0.26 | 17.6 | 52.2 | 22.0 | 49.5 | 12.5 | 3.04 |
| CIli1476 | 4.11 | 0.89 | 0.79 | 0.46 | 0.18 | 0.29 | 16.5 | 86.4 | 23.9 | 81.8 | 9.75 | 2.35 |
| CIli1492 | 3.86 | 0.64 | 0.72 | 0.40 | 0.23 | 0.27 | 19.2 | 39.0 | 17.0 | 48.3 | 10.2 | 2.92 |
| CIli1669 | 4.26 | 0.67 | 0.81 | 0.40 | 0.22 | 0.30 | 23.0 | 57.1 | 28.4 | 70.6 | 6.79 | 2.86 |
| CIli1751 | 3.63 | 0.71 | 0.80 | 0.38 | 0.22 | 0.28 | 22.7 | 84.9 | 28.9 | 64.3 | 15.6 | 3.47 |
| CIli1763 | 4.32 | 0.94 | 0.93 | 0.42 | 0.25 | 0.30 | 16.5 | 87.1 | 27.9 | 68.7 | 9.51 | 2.87 |
| CIli1821 | 3.26 | 0.62 | 0.60 | 0.36 | 0.22 | 0.26 | 40.5 | 78.0 | 30.3 | 54.1 | 24.2 | 3.17 |
| CIli1836 | 3.75 | 0.74 | 0.83 | 0.41 | 0.22 | 0.28 | 18.9 | 47.2 | 23.8 | 51.7 | 10.7 | 2.98 |
| CIli1931 | 3.40 | 0.67 | 0.68 | 0.39 | 0.19 | 0.26 | 34.0 | 79.7 | 25.8 | 67.8 | 17.7 | 3.21 |
| CIli1938 | 3.50 | 0.60 | 0.67 | 0.38 | 0.22 | 0.25 | 32.0 | 74.3 | 30.2 | 63.0 | 14.7 | 3.11 |
| CIli1943 | 3.69 | 0.70 | 0.70 | 0.40 | 0.23 | 0.26 | 31.2 | 83.2 | 30.1 | 62.7 | 15.5 | 3.29 |
| CIli1955 | 3.30 | 0.71 | 0.73 | 0.39 | 0.24 | 0.26 | 31.0 | 86.7 | 31.1 | 62.2 | 16.4 | 3.34 |
| CIli1980 | 3.27 | 0.76 | 0.85 | 0.43 | 0.26 | 0.25 | 27.5 | 68.4 | 24.8 | 61.8 | 12.3 | 2.87 |
| CIli1983 | 3.87 | 0.89 | 1.12 | 0.41 | 0.28 | 0.26 | 21.4 | 91.7 | 21.0 | 76.3 | 5.17 | 3.47 |
| CIli1989 | 3.65 | 0.72 | 0.81 | 0.43 | 0.22 | 0.26 | 22.1 | 69.6 | 24.5 | 63.9 | 10.0 | 3.41 |
| CIli1990 | 3.32 | 0.78 | 0.75 | 0.46 | 0.20 | 0.26 | 23.7 | 76.9 | 23.7 | 71.9 | 9.41 | 2.95 |
| CIli2010 | 3.79 | 0.93 | 0.83 | 0.47 | 0.24 | 0.26 | 14.4 | 73.7 | 27.6 | 65.8 | 12.7 | 3.18 |
| CIli2033 | 3.88 | 0.82 | 0.76 | 0.44 | 0.24 | 0.27 | 20.4 | 67.1 | 34.5 | 196.1 | 14.1 | 3.01 |
| CIli2070 | 3.98 | 0.81 | 0.75 | 0.40 | 0.22 | 0.27 | 14.6 | 71.0 | 19.1 | 70.7 | 12.4 | 3.11 |
| CIli2424 | 4.21 | 0.82 | 0.76 | 0.45 | 0.24 | 0.28 | 18.4 | 75.5 | 22.3 | 72.1 | 8.70 | 2.78 |
| CIli2443 | 4.27 | 0.74 | 0.79 | 0.41 | 0.23 | 0.28 | 18.6 | 58.6 | 21.9 | 61.8 | 8.52 | 3.00 |
| CIli2444 | 3.94 | 0.81 | 0.83 | 0.42 | 0.29 | 0.30 | 22.1 | 82.3 | 26.3 | 84.4 | 15.4 | 2.72 |
| CIli2446 | 4.18 | 0.87 | 0.77 | 0.46 | 0.25 | 0.26 | 14.1 | 55.9 | 24.9 | 69.0 | 8.60 | 2.76 |
| CIli2534 | 4.41 | 0.74 | 0.71 | 0.40 | 0.23 | 0.28 | 15.5 | 67.5 | 19.6 | 77.8 | 11.0 | 2.50 |
| CIli3242 | 4.22 | 0.93 | 0.84 | 0.42 | 0.24 | 0.30 | 17.9 | 93.8 | 31.4 | 89.1 | 11.6 | 2.70 |
| CIli3246 | 4.48 | 0.86 | 0.90 | 0.41 | 0.28 | 0.27 | 15.5 | 73.2 | 31.1 | 57.7 | 7.74 | 2.83 |
| CIli3303 | 3.96 | 0.77 | 0.78 | 0.42 | 0.25 | 0.28 | 21.2 | 79.2 | 32.3 | 76.0 | 8.50 | 2.74 |
| CIli3310 | 4.33 | 0.73 | 0.70 | 0.42 | 0.20 | 0.28 | 17.4 | 49.7 | 21.9 | 56.7 | 12.5 | 3.01 |
| CIli3312 | 3.96 | 0.68 | 0.69 | 0.39 | 0.23 | 0.27 | 21.8 | 70.5 | 27.4 | 71.2 | 8.90 | 2.39 |
| CIli3314 | 4.49 | 0.75 | 0.80 | 0.42 | 0.23 | 0.28 | 20.2 | 69.8 | 29.3 | 70.8 | 10.5 | 2.57 |
| CIli3317 | 4.11 | 0.61 | 0.70 | 0.38 | 0.27 | 0.27 | 19.4 | 73.9 | 19.7 | 61.3 | 11.2 | 3.43 |
| CIli3318 | 4.36 | 0.69 | 0.80 | 0.37 | 0.22 | 0.27 | 27.7 | 79.5 | 21.8 | 75.3 | 11.0 | 3.39 |
| CIli452 | 4.41 | 0.88 | 0.87 | 0.44 | 0.24 | 0.29 | 13.7 | 100.4 | 34.0 | 92.9 | 7.53 | 2.41 |
| CIli641 | 3.87 | 0.97 | 0.88 | 0.46 | 0.22 | 0.28 | 13.7 | 69.6 | 27.3 | 63.1 | 12.9 | 3.30 |
| CIli642 | 4.11 | 0.79 | 0.77 | 0.41 | 0.25 | 0.27 | 13.0 | 61.2 | 23.0 | 53.3 | 12.2 | 3.09 |
| CIli643 | 4.01 | 0.94 | 1.01 | 0.42 | 0.25 | 0.28 | 13.6 | 127.1 | 15.5 | 80.6 | 6.53 | 3.70 |
| Coeruleum | 4.02 | 0.92 | 0.95 | 0.40 | 0.30 | 0.28 | 14.1 | 91.2 | 28.1 | 95.3 | 15.4 | 2.54 |
| CrownCanada | 3.69 | 0.97 | 0.96 | 0.40 | 0.33 | 0.27 | 13.2 | 110.4 | 25.0 | 94.8 | 16.8 | 3.03 |
| Danese129a | 4.08 | 0.71 | 0.73 | 0.39 | 0.21 | 0.28 | 22.9 | 70.1 | 25.6 | 69.6 | 9.65 | 2.75 |
| Dufferin | 4.11 | 0.74 | 0.70 | 0.42 | 0.23 | 0.29 | 19.1 | 75.0 | 26.9 | 79.7 | 13.8 | 2.67 |
| Flanders | 3.72 | 0.72 | 0.67 | 0.41 | 0.23 | 0.27 | 19.0 | 41.8 | 19.4 | 47.4 | 15.1 | 2.91 |
| FP966 | 3.61 | 0.63 | 0.72 | 0.39 | 0.25 | 0.25 | 29.3 | 66.2 | 24.5 | 69.7 | 13.6 | 3.52 |
| Gercello | 4.77 | 0.95 | 0.91 | 0.44 | 0.26 | 0.28 | 16.8 | 62.1 | 28.1 | 69.2 | 14.8 | 3.10 |
| Giza139a | 4.11 | 0.64 | 0.65 | 0.38 | 0.26 | 0.28 | 19.4 | 58.8 | 22.7 | 66.6 | 6.17 | 2.72 |
| Gujrat2 | 2.90 | 0.63 | 0.66 | 0.37 | 0.24 | 0.24 | 29.7 | 77.3 | 37.3 | 57.9 | 15.8 | 3.16 |
| H39seln | 3.97 | 0.70 | 0.68 | 0.39 | 0.25 | 0.28 | 18.9 | 58.7 | 24.8 | 61.9 | 6.13 | 2.44 |
| Hazeldean | 4.44 | 0.95 | 0.81 | 0.44 | 0.21 | 0.28 | 14.8 | 94.7 | 23.2 | 82.7 | 13.1 | 2.93 |
| Jalaun | 3.90 | 0.76 | 1.00 | 0.37 | 0.29 | 0.26 | 15.9 | 67.6 | 21.5 | 59.6 | 5.72 | 2.39 |
| Jalomita | 4.27 | 0.87 | 0.75 | 0.44 | 0.23 | 0.28 | 16.3 | 84.5 | 20.9 | 73.9 | 14.2 | 2.86 |
| Katan92 | 4.22 | 0.77 | 0.67 | 0.43 | 0.21 | 0.27 | 17.8 | 68.0 | 20.1 | 57.4 | 11.0 | 2.96 |
| Katan93 | 3.63 | 0.81 | 0.71 | 0.41 | 0.21 | 0.27 | 17.5 | 83.6 | 24.7 | 67.1 | 12.4 | 3.08 |
| Kenyaci709 | 3.90 | 0.73 | 0.62 | 0.34 | 0.22 | 0.27 | 21.1 | 90.3 | 41.0 | 66.5 | 14.0 | 2.92 |
| Mcduffp900 | 3.58 | 0.65 | 0.66 | 0.38 | 0.28 | 0.27 | 17.4 | 67.5 | 23.2 | 57.7 | 12.0 | 3.39 |
| Moose | 3.97 | 0.93 | 0.87 | 0.46 | 0.24 | 0.28 | 15.1 | 71.6 | 26.3 | 60.5 | 11.9 | 3.26 |
| NP80 | 3.74 | 0.60 | 0.59 | 0.35 | 0.20 | 0.25 | 25.0 | 85.6 | 30.8 | 53.5 | 16.9 | 2.97 |
| NO1040 | 3.73 | 0.81 | 0.74 | 0.47 | 0.23 | 0.28 | 20.1 | 75.0 | 32.4 | 65.7 | 14.3 | 3.05 |
| NO11 | 3.58 | 0.95 | 0.88 | 0.39 | 0.37 | 0.27 | 11.0 | 89.3 | 33.8 | 70.0 | 16.2 | 2.86 |
| NO129 | 4.98 | 0.78 | 0.74 | 0.41 | 0.24 | 0.30 | 19.7 | 57.1 | 21.4 | 65.9 | 7.79 | 3.12 |
| Norland | 4.05 | 0.95 | 0.87 | 0.44 | 0.24 | 0.27 | 16.2 | 101.3 | 20.4 | 81.5 | 13.2 | 2.60 |
| NP121 | 4.32 | 0.91 | 1.11 | 0.40 | 0.25 | 0.27 | 23.9 | 121.1 | 18.9 | 74.8 | 4.21 | 3.58 |
| NP124 | 3.99 | 0.79 | 0.82 | 0.44 | 0.23 | 0.26 | 20.0 | 64.7 | 23.0 | 56.5 | 10.2 | 2.53 |
| Omega | 3.86 | 0.99 | 0.95 | 0.43 | 0.37 | 0.27 | 13.0 | 99.1 | 28.6 | 80.3 | 19.4 | 4.58 |
| Pasrur2 | 2.91 | 0.67 | 0.63 | 0.37 | 0.24 | 0.24 | 26.0 | 84.5 | 34.5 | 65.9 | 16.0 | 3.05 |
| Rembrandt | 3.63 | 0.83 | 0.74 | 0.44 | 0.22 | 0.28 | 19.1 | 90.9 | 23.1 | 78.8 | 12.7 | 2.38 |
| Saidabad | 4.19 | 0.75 | 0.70 | 0.41 | 0.22 | 0.29 | 19.8 | 96.8 | 32.3 | 88.4 | 18.9 | 2.99 |
| Somme | 3.84 | 0.86 | 0.81 | 0.44 | 0.23 | 0.26 | 17.8 | 84.5 | 23.6 | 68.9 | 17.4 | 3.08 |
| SzeepiOlajlen | 4.11 | 0.92 | 0.87 | 0.36 | 0.37 | 0.27 | 11.4 | 73.3 | 25.2 | 70.3 | 13.9 | 2.85 |
| Tomagaon | 3.53 | 0.76 | 0.80 | 0.42 | 0.24 | 0.25 | 11.0 | 66.8 | 20.7 | 59.3 | 7.90 | 2.39 |
| Uruguay | 3.80 | 0.84 | 0.72 | 0.43 | 0.21 | 0.27 | 17.3 | 84.2 | 25.5 | 64.2 | 13.6 | 2.80 |
| Verin | 3.69 | 0.84 | 0.82 | 0.44 | 0.23 | 0.27 | 18.0 | 87.9 | 24.2 | 81.0 | 12.1 | 2.83 |
| Viking | 4.17 | 0.85 | 0.69 | 0.44 | 0.27 | 0.27 | 15.8 | 57.7 | 36.6 | 49.7 | 8.78 | 3.12 |
| Vimy | 4.00 | 0.68 | 0.97 | 0.41 | 0.27 | 0.28 | 23.0 | 64.9 | 35.8 | 76.3 | 9.59 | 2.93 |
| W62611FKA14 | 3.74 | 0.92 | 0.79 | 0.45 | 0.20 | 0.27 | 15.8 | 83.6 | 22.0 | 74.3 | 11.4 | 2.98 |
| WickingHeggenen | 4.15 | 0.87 | 0.71 | 0.45 | 0.25 | 0.27 | 19.0 | 82.5 | 34.4 | 66.3 | 11.5 | 2.96 |
| Sorghum Variety | N | P | K | Mg | Ca | S | B | Zn | Mn | Fe | Cu | Mo |
|---|---|---|---|---|---|---|---|---|---|---|---|---|
| 52 | 2.99 | 0.70 | 0.58 | 0.25 | 0.05 | 0.43 | 10.3 | 43.3 | 50.9 | 91.5 | 11.3 | 2.65 |
| 282 | 2.19 | 0.48 | 0.46 | 0.19 | 0.02 | 0.17 | 5.07 | 47.3 | 25.5 | 267 | 8.41 | 2.32 |
| 434 | 2.28 | 0.70 | 0.54 | 0.25 | 0.05 | 0.39 | 9.97 | 60.9 | 50.2 | 235 | 16.6 | 3.52 |
| 1398 | 2.78 | 0.61 | 0.74 | 0.23 | 0.05 | 0.38 | 13.0 | 59.8 | 61.1 | 643 | 13.4 | 2.62 |
| 1491 | 1.94 | 0.47 | 0.47 | 0.20 | 0.01 | 0.15 | 2.80 | 45.7 | 26.1 | 269 | 3.37 | 2.02 |
| 1728 | 1.80 | 0.46 | 0.60 | 0.16 | 0.02 | 0.14 | 7.27 | 211 | 34.6 | 49.4 | 2.09 | |
| 3967 | 1.51 | 0.41 | 0.47 | 0.18 | 0.01 | 0.14 | 3.05 | 43.3 | 18.1 | 35.6 | 3.83 | 2.10 |
| 4058 | 1.66 | 0.40 | 0.44 | 0.16 | 0.02 | 0.15 | 2.53 | 44.5 | 19.2 | 33.6 | 3.40 | 1.15 |
| 4080 | 2.02 | 0.49 | 0.53 | 0.19 | 0.02 | 0.15 | 3.16 | 36.7 | 20.8 | 32.6 | 3.15 | 1.46 |
| 4116 | 1.80 | 0.36 | 0.37 | 0.14 | 0.02 | 0.15 | 2.94 | 37.5 | 16.6 | 30.6 | 3.23 | 1.79 |
| 93447 | 2.02 | 0.41 | 0.53 | 0.17 | 0.04 | 0.12 | 3.54 | 55.7 | 21.9 | 44.2 | 27.3 | 2.06 |
| 54K94 | 2.21 | 0.63 | 0.72 | 0.21 | 0.02 | 0.16 | 4.69 | 43.4 | 35.1 | 55.3 | 6.37 | 1.81 |
| 88-07095 | 1.51 | 0.34 | 0.47 | 0.12 | 0.01 | 0.11 | 9.37 | 21.8 | 17.4 | 21.8 | 3.41 | 1.47 |
| 88-07105 | 1.60 | 0.26 | 0.37 | 0.12 | 0.02 | 0.14 | 2.40 | 29.7 | 15.6 | 35.8 | 4.92 | 1.34 |
| 88-07108 | 1.78 | 0.32 | 0.40 | 0.16 | 0.02 | 0.14 | 2.91 | 112 | 22.6 | 45.3 | 6.37 | 1.22 |
| 88-07197 | 2.01 | 0.41 | 0.41 | 0.19 | 0.02 | 0.16 | 2.89 | 31.4 | 17.5 | 44.7 | 6.55 | 1.76 |
| 88-07207 | 2.06 | 0.53 | 0.54 | 0.18 | 0.02 | 0.14 | 2.73 | 37.2 | 26.7 | 34.0 | 5.13 | 1.66 |
| 88-07225 | 1.99 | 0.54 | 0.63 | 0.17 | 0.02 | 0.16 | 2.64 | 48.1 | 27.8 | 45.2 | 6.82 | 1.99 |
| A7774 | 2.78 | 0.56 | 0.57 | 0.21 | 0.02 | 0.18 | 3.31 | 63.0 | 18.7 | 53.5 | 4.58 | 2.43 |
| A84 | 1.45 | 0.42 | 0.53 | 0.18 | 0.02 | 0.13 | 4.12 | 37.6 | 15.9 | 37.5 | 3.18 | 2.92 |
| A96 | 2.12 | 0.46 | 0.48 | 0.19 | 0.03 | 0.14 | 3.64 | 35.4 | 18.8 | 42.1 | 4.11 | 2.60 |
| ABTx631 | 1.48 | 0.38 | 0.41 | 0.17 | 0.02 | 0.12 | 3.16 | 30.0 | 15.2 | 29.6 | 4.22 | 2.96 |
| AcchoKaruha | 2.22 | 0.47 | 0.42 | 0.18 | 0.02 | 0.12 | 3.04 | 44.8 | 25.2 | 55.3 | 4.61 | 3.19 |
| AS4055 | 1.49 | 0.37 | 0.49 | 0.15 | 0.01 | 0.12 | 3.11 | 27.3 | 11.7 | 24.9 | 3.31 | 2.17 |
| AS4136 | 1.96 | 0.42 | 0.49 | 0.16 | 0.01 | 0.15 | 2.61 | 44.6 | 20.0 | 34.6 | 4.42 | 3.72 |
| AS5826 | 2.06 | 0.40 | 0.43 | 0.18 | 0.02 | 0.14 | 3.22 | 42.7 | 15.9 | 20.6 | 5.89 | 3.35 |
| Barking119 | 2.01 | 0.44 | 0.53 | 0.18 | 0.01 | 0.13 | 3.23 | 44.6 | 19.0 | 36.6 | 5.22 | 2.38 |
| BE25 | 2.19 | 0.48 | 0.48 | 0.18 | 0.02 | 0.14 | 3.55 | 44.2 | 21.8 | 45.0 | 7.27 | 3.09 |
| Bok11 | 1.68 | 0.43 | 0.44 | 0.19 | 0.02 | 0.15 | 3.60 | 36.0 | 17.2 | 38.0 | 4.00 | 3.91 |
| BrownKaoliang | 2.17 | 0.42 | 0.47 | 0.17 | 0.02 | 0.15 | 5.06 | 43.6 | 16.3 | 51.7 | 5.47 | 2.40 |
| BTx623 | 1.81 | 0.37 | 0.49 | 0.15 | 0.02 | 0.10 | 3.78 | 23.3 | 13.0 | 39.0 | 5.15 | 1.48 |
| ChananSingoo | 1.99 | 0.43 | 0.43 | 0.18 | 0.03 | 0.14 | 3.76 | 51.0 | 20.5 | 33.8 | 6.16 | 3.14 |
| ChineseAmber | 2.63 | 0.53 | 0.45 | 0.23 | 0.02 | 0.17 | 5.76 | 57.1 | 28.6 | 46.1 | 7.17 | 2.94 |
| Collier | 1.73 | 0.41 | 0.39 | 0.17 | 0.01 | 0.17 | 4.04 | 24.2 | 21.1 | 32.3 | 3.97 | 2.23 |
| Cowley | 1.83 | 0.31 | 0.31 | 0.15 | 0.03 | 0.15 | 5.42 | 31.3 | 14.5 | 29.6 | 4.61 | 4.10 |
| DaShanDong | 1.69 | 0.47 | 0.53 | 0.18 | 0.02 | 0.13 | 3.80 | 39.9 | 17.9 | 35.0 | 4.24 | 2.52 |
| Dokhnah | 2.17 | 0.40 | 0.36 | 0.17 | 0.01 | 0.15 | 6.74 | 44.6 | 22.2 | 38.0 | 4.66 | 1.82 |
| Elmota | 1.92 | 0.46 | 0.43 | 0.20 | 0.02 | 0.14 | 5.13 | 43.1 | 18.7 | 38.8 | 6.29 | 2.46 |
| ERJieZi | 1.58 | 0.34 | 0.43 | 0.13 | 0.01 | 0.12 | 3.13 | 33.5 | 18.5 | 29.3 | 3.93 | 1.72 |
| FAO54919 | 2.11 | 0.46 | 0.40 | 0.19 | 0.01 | 0.16 | 2.96 | 43.4 | 18.8 | 33.8 | 4.18 | 2.00 |
| Grif534 | 1.63 | 0.26 | 0.34 | 0.13 | 0.02 | 0.13 | 2.08 | 35.7 | 16.6 | 40.0 | 5.67 | 1.48 |
| Grif539 | 1.87 | 0.30 | 0.32 | 0.14 | 0.03 | 0.14 | 2.52 | 37.4 | 21.5 | 42.0 | 5.75 | 1.55 |
| Grif553 | 1.89 | 0.32 | 0.33 | 0.14 | 0.01 | 0.15 | 2.08 | 28.4 | 19.6 | 35.7 | 5.83 | 1.48 |
| Grif574 | 1.95 | 0.48 | 0.41 | 0.20 | 0.03 | 0.16 | 3.95 | 55.2 | 26.0 | 48.4 | 6.99 | 1.53 |
| Grif604 | 1.74 | 0.29 | 0.28 | 0.14 | 0.02 | 0.14 | 2.28 | 31.2 | 9.7 | 49.9 | 5.02 | 1.61 |
| Grif610 | 1.63 | 0.28 | 0.34 | 0.14 | 0.03 | 0.14 | 2.59 | 48.9 | 15.2 | 57.0 | 7.19 | 1.49 |
| Grif7260 | 1.57 | 0.42 | 0.58 | 0.15 | 0.02 | 0.13 | 4.94 | 30.2 | 15.4 | 33.0 | 3.80 | 2.01 |
| Grif7263 | 1.82 | 0.39 | 0.44 | 0.17 | 0.01 | 0.13 | 2.66 | 33.0 | 13.7 | 38.6 | 5.07 | 2.27 |
| IS1019 | 2.25 | 0.31 | 0.41 | 0.14 | 0.02 | 0.14 | 5.73 | 34.0 | 17.7 | 28.7 | 4.58 | 1.85 |
| IS10931 | 2.31 | 0.46 | 0.44 | 0.18 | 0.02 | 0.17 | 3.02 | 33.2 | 19.1 | 43.2 | 4.32 | 2.91 |
| IS1213C | 1.98 | 0.36 | 0.36 | 0.17 | 0.02 | 0.13 | 4.66 | 29.1 | 20.0 | 35.7 | 4.13 | 2.59 |
| IS12684C | 1.88 | 0.37 | 0.54 | 0.16 | 0.03 | 0.14 | 4.98 | 37.5 | 18.7 | 40.6 | 6.01 | 2.35 |
| IS12845 | 2.06 | 0.44 | 0.44 | 0.19 | 0.04 | 0.13 | 5.76 | 39.2 | 29.2 | 38.6 | 6.52 | 1.43 |
| IS13232 | 1.76 | 0.49 | 0.56 | 0.17 | 0.02 | 0.14 | 3.68 | 30.9 | 24.9 | 42.5 | 4.07 | 2.06 |
| IS13236 | 2.20 | 0.50 | 0.62 | 0.17 | 0.03 | 0.15 | 3.63 | 32.6 | 32.0 | 41.9 | 6.32 | 1.92 |
| IS14098 | 1.67 | 0.36 | 0.43 | 0.15 | 0.03 | 0.13 | 3.48 | 35.0 | 13.3 | 32.8 | 3.80 | 2.02 |
| IS24424 | 2.24 | 0.52 | 0.49 | 0.23 | 0.03 | 0.14 | 4.94 | 47.5 | 25.4 | 47.7 | 4.39 | 1.78 |
| IS24449 | 1.77 | 0.40 | 0.42 | 0.17 | 0.02 | 0.12 | 3.40 | 33.0 | 13.0 | 32.8 | 3.15 | 2.30 |
| IS24451 | 1.97 | 0.41 | 0.34 | 0.19 | 0.01 | 0.14 | 2.68 | 37.4 | 16.3 | 32.8 | 4.20 | 2.27 |
| IS27569 | 1.69 | 0.42 | 0.47 | 0.16 | 0.01 | 0.12 | 2.95 | 36.7 | 15.5 | 48.8 | 4.14 | 2.36 |
| IS27601 | 1.43 | 0.37 | 0.52 | 0.15 | 0.02 | 0.14 | 3.67 | 38.7 | 19.2 | 14.0 | 4.24 | 1.88 |
| IS28214 | 1.76 | 0.43 | 0.54 | 0.16 | 0.02 | 0.13 | 2.92 | 49.6 | 18.8 | 35.4 | 4.02 | 1.98 |
| IS2871C | 2.23 | 0.53 | 0.50 | 0.22 | 0.02 | 0.14 | 5.50 | 52.7 | 17.1 | 42.0 | 5.36 | 2.30 |
| IS2874 | 1.87 | 0.45 | 0.46 | 0.19 | 0.03 | 0.14 | 3.04 | 48.0 | 13.9 | 45.0 | 4.16 | 2.26 |
| IS3098 | 1.43 | 0.38 | 0.47 | 0.15 | 0.02 | 0.12 | 3.37 | 29.6 | 11.5 | 28.5 | 2.32 | 1.83 |
| IS5168C | 2.16 | 0.45 | 0.41 | 0.21 | 0.03 | 0.14 | 4.19 | 51.4 | 22.9 | 38.3 | 5.54 | 2.67 |
| IS6541 | 2.13 | 0.41 | 0.32 | 0.18 | 0.02 | 0.14 | 3.25 | 35.6 | 14.6 | 37.1 | 3.67 | 1.59 |
| IS6733C | 1.79 | 0.37 | 0.47 | 0.15 | 0.01 | 0.13 | 3.50 | 40.4 | 16.2 | 34.5 | 4.03 | 2.58 |
| IS8120C | 1.91 | 0.34 | 0.38 | 0.14 | 0.01 | 0.12 | 2.72 | 22.2 | 12.7 | 19.3 | 3.43 | 2.42 |
| JolaNandyal | 1.72 | 0.36 | 0.41 | 0.13 | 0.02 | 0.12 | 3.63 | 29.1 | 13.4 | 25.2 | 2.71 | 1.78 |
| JowarRedJan | 2.06 | 0.38 | 0.39 | 0.16 | 0.02 | 0.12 | 6.00 | 38.1 | 22.3 | 27.2 | 3.35 | 2.24 |
| KA12Janjari | 1.84 | 0.41 | 0.69 | 0.18 | 0.02 | 0.14 | 5.03 | 32.6 | 15.5 | 28.0 | 5.38 | 2.73 |
| Kabutuwa | 1.96 | 0.51 | 0.56 | 0.21 | 0.03 | 0.14 | 5.24 | 57.6 | 25.2 | 24.4 | 7.93 | 5.12 |
| Kaoliang | 2.05 | 0.41 | 0.46 | 0.16 | 0.02 | 0.13 | 3.70 | 34.2 | 12.8 | 27.4 | 3.90 | 3.10 |
| Kaoliangwx | 1.48 | 0.38 | 0.43 | 0.15 | 0.02 | 0.13 | 3.16 | 35.1 | 13.9 | 34.7 | 4.11 | 3.26 |
| KharuthWara | 2.18 | 0.36 | 0.33 | 0.18 | 0.03 | 0.13 | 4.31 | 41.3 | 15.9 | 42.9 | 3.10 | 2.99 |
| Kulum | 1.61 | 0.38 | 0.45 | 0.14 | 0.02 | 0.12 | 3.27 | 27.1 | 12.9 | 35.1 | 3.61 | 1.75 |
| Kuyuma | 1.94 | 0.35 | 0.43 | 0.13 | 0.01 | 0.11 | 3.41 | 28.2 | 12.4 | 23.2 | 2.92 | 2.35 |
| Leoti | 1.70 | 0.38 | 0.44 | 0.18 | 0.01 | 0.13 | 4.52 | 32.7 | 25.2 | 22.1 | 3.33 | 2.06 |
| LianTouSan | 1.97 | 0.48 | 0.55 | 0.18 | 0.01 | 0.14 | 2.47 | 42.8 | 17.6 | 35.0 | 5.31 | 2.15 |
| Lula | 1.61 | 0.38 | 0.39 | 0.17 | 0.02 | 0.13 | 3.60 | 38.8 | 18.5 | 30.2 | 4.69 | 3.03 |
| M35-1 | 1.68 | 0.32 | 0.36 | 0.16 | 0.01 | 0.12 | 3.42 | 26.7 | 10.5 | 24.9 | 2.19 | 2.24 |
| ManfrediMinu | 1.99 | 0.43 | 0.45 | 0.18 | 0.02 | 0.15 | 4.62 | 30.0 | 42.3 | 36.7 | 5.43 | 1.38 |
| Marupantse | 1.68 | 0.41 | 0.46 | 0.16 | 0.02 | 0.14 | 3.09 | 33.6 | 20.5 | 35.4 | 4.98 | 2.58 |
| Mashica | 1.97 | 0.43 | 0.52 | 0.17 | 0.02 | 0.13 | 3.75 | 34.1 | 14.9 | 26.5 | 2.51 | 2.79 |
| MN1592 | 1.67 | 0.36 | 0.41 | 0.17 | 0.02 | 0.14 | 3.46 | 33.8 | 18.5 | 33.5 | 3.54 | 3.91 |
| MN4315 | 2.41 | 0.54 | 0.44 | 0.23 | 0.02 | 0.16 | 7.76 | 44.8 | 22.5 | 42.3 | 6.86 | 2.08 |
| MN586 | 1.73 | 0.41 | 0.46 | 0.17 | 0.01 | 0.17 | 5.47 | 38.2 | 16.6 | 34.5 | 6.12 | 3.03 |
| MN707 | 1.93 | 0.41 | 0.48 | 0.15 | 0.02 | 0.14 | 3.28 | 26.5 | 20.3 | 21.1 | 4.27 | 3.82 |
| MsumbjiSB117 | 2.07 | 0.47 | 0.41 | 0.18 | 0.02 | 0.14 | 2.62 | 43.5 | 32.7 | 39.0 | 4.56 | 1.62 |
| N290b | 1.71 | 0.36 | 0.47 | 0.16 | 0.02 | 0.12 | 2.63 | 28.5 | 14.0 | 29.7 | 4.06 | 2.86 |
| OrangeNo1 | 2.16 | 0.28 | 0.31 | 0.12 | 0.02 | 0.14 | 2.53 | 28.4 | 20.7 | 22.6 | 4.27 | 3.92 |
| P9517 | 1.83 | 0.39 | 0.42 | 0.17 | 0.02 | 0.14 | 2.03 | 35.9 | 19.5 | 37.1 | 6.55 | 2.33 |
| R3 | 1.95 | 0.45 | 0.43 | 0.18 | 0.02 | 0.15 | 2.83 | 40.8 | 19.7 | 32.2 | 5.42 | 3.51 |
| S1049 | 2.66 | 0.46 | 0.43 | 0.19 | 0.03 | 0.16 | 1.96 | 49.9 | 19.3 | 36.2 | 6.07 | 2.20 |
| S24 | 2.85 | 0.50 | 0.44 | 0.22 | 0.02 | 0.15 | 4.66 | 43.2 | 21.3 | 37.7 | 9.02 | 1.93 |
| SAP155 | 1.82 | 0.35 | 0.36 | 0.15 | 0.01 | 0.11 | 2.51 | 35.8 | 15.9 | 33.3 | 4.06 | 1.60 |
| SAP157 | 1.55 | 0.36 | 0.38 | 0.17 | 0.02 | 0.12 | 3.74 | 26.3 | 16.1 | 24.6 | 4.32 | 2.37 |
| SAP158 | 1.72 | 0.36 | 0.54 | 0.15 | 0.03 | 0.12 | 2.69 | 27.5 | 17.3 | 27.8 | 3.34 | 2.30 |
| SAP172 | 1.80 | 0.43 | 0.42 | 0.18 | 0.02 | 0.13 | 2.25 | 37.2 | 14.7 | 36.7 | 4.46 | 2.82 |
| SDSL87046T | 1.52 | 0.38 | 0.41 | 0.16 | 0.02 | 0.11 | 2.71 | 31.0 | 15.1 | 29.2 | 4.59 | 1.75 |
| Shangani9356 | 1.65 | 0.39 | 0.47 | 0.14 | 0.02 | 0.13 | 2.37 | 30.5 | 16.8 | 31.4 | 2.91 | 1.84 |
| SO85 | 1.96 | 0.49 | 0.47 | 0.19 | 0.02 | 0.15 | 2.75 | 52.5 | 20.1 | 18.5 | 7.41 | 3.78 |
| StFederita | 2.22 | 0.45 | 0.43 | 0.17 | 0.03 | 0.13 | 3.64 | 29.3 | 22.3 | 27.2 | 6.49 | 1.72 |
| Takanda | 2.37 | 0.55 | 0.47 | 0.24 | 0.02 | 0.14 | 3.33 | 39.1 | 24.3 | 50.1 | 5.50 | 1.90 |
| Texas660 | 1.93 | 0.44 | 0.35 | 0.20 | 0.02 | 0.14 | 2.05 | 44.0 | 15.9 | 42.1 | 5.54 | 2.52 |
| UI4822 | 1.99 | 0.44 | 0.49 | 0.19 | 0.01 | 0.16 | 2.47 | 56.1 | 15.0 | 47.4 | 4.62 | 2.37 |
| Wray | 1.78 | 0.41 | 0.35 | 0.22 | 0.01 | 0.13 | 5.62 | 36.1 | 15.0 | 29.8 | 4.03 | 3.17 |
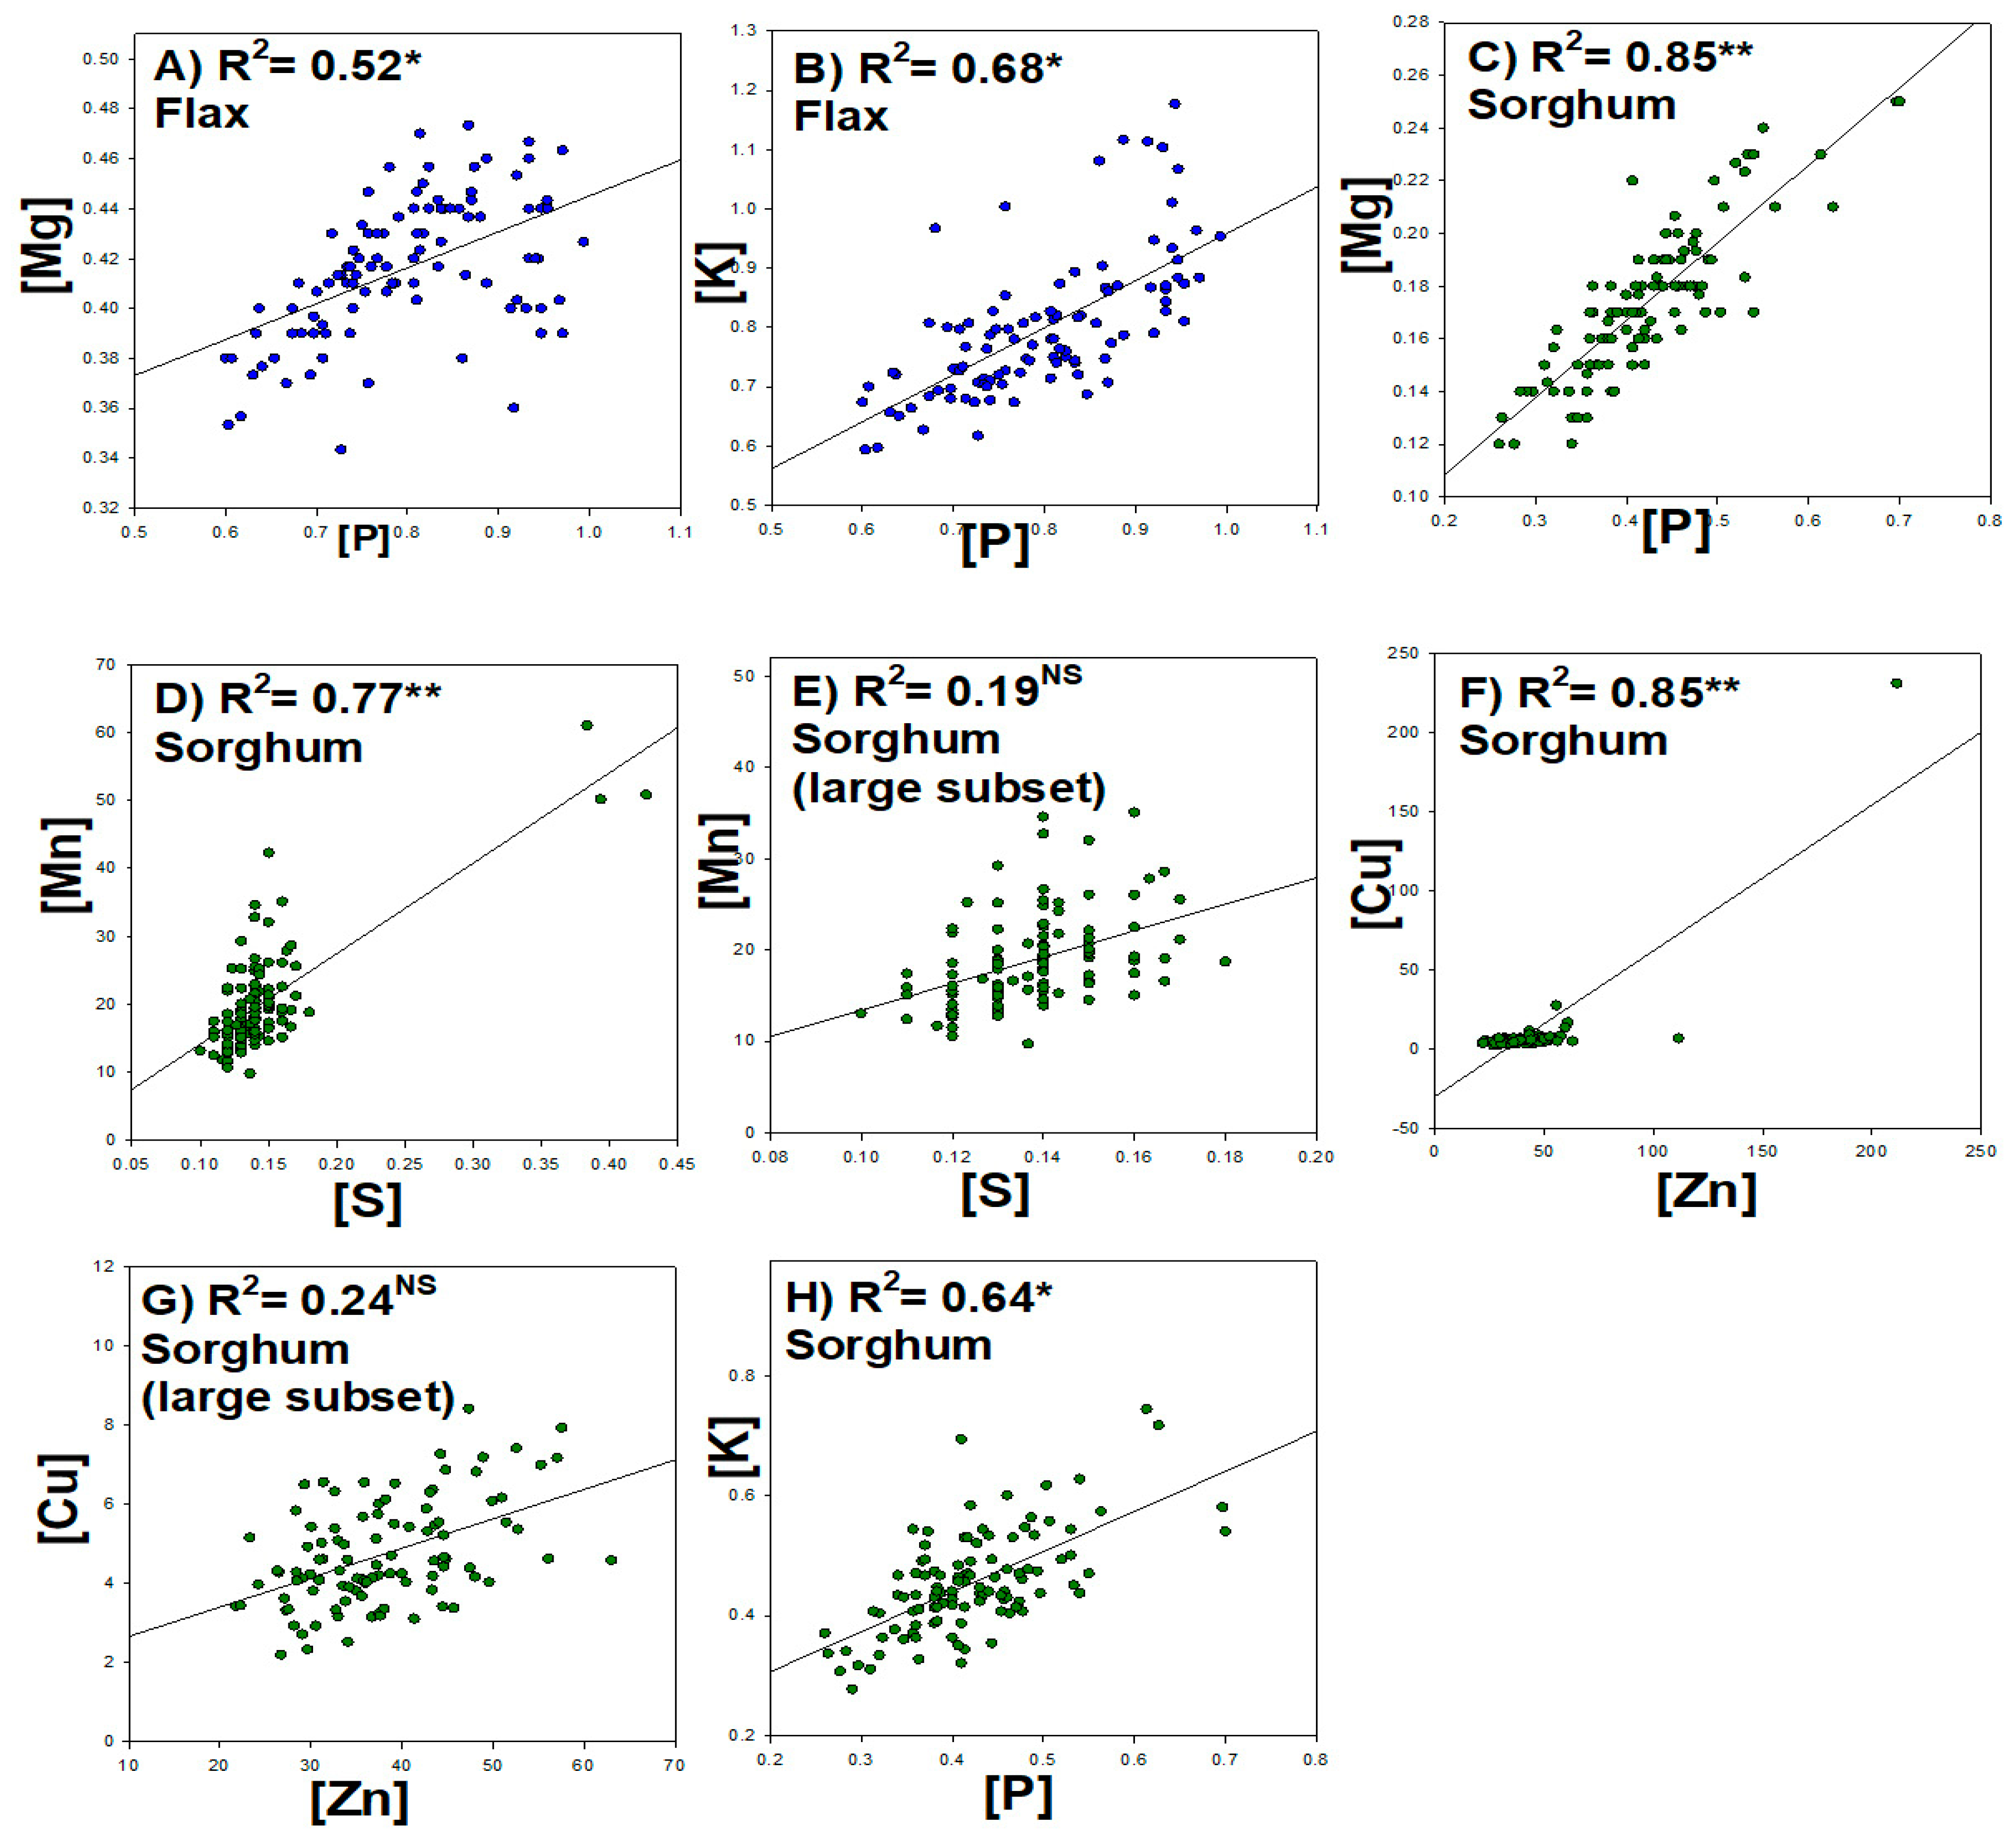
3.2. Elemental Correlations among Nutrients in Seeds
3.3. Nutritional Value of Flax and Sorghum
3.4. Identification of Promising Top Flax and Sorghum Varieties
4. Discussion
5. Conclusions
Author Contributions
Funding
Data Availability Statement
Acknowledgments
Conflicts of Interest
References
- FAOSTAT. FAO Statistical Databases. Food and Agriculture Organization of the United Nations, Rome. Available online: http://www.fao.org/faostat (accessed on 13 December 2021).
- Muir, A.D.; Westcott, N.D. Flax: The Genius Linum; CRC Press: Boca Raton, FL, USA, 2003. [Google Scholar]
- Awika, J.M. Sorghum: Its Unique Nutritional and Health-Promoting Attributes; Woodhead Publishing: Cambridge, MA, USA, 2017. [Google Scholar]
- Salt, D.E.; Baxter, I.; Lahner, B. Ionomics and the study of the plant ionome. Annu. Rev. Plant Biol. 2008, 59, 709–733. [Google Scholar] [CrossRef] [PubMed] [Green Version]
- Baxter, I.R.; Gustin, J.L.; Settles, A.M.; Hoekenga, O.A. Ionomic characterization of maize kernels in the intermated B73 x Mo17 population. Crop Sci. 2013, 53, 208–210. [Google Scholar] [CrossRef] [Green Version]
- Hacisalihoglu, G.; Kochian, L.V.; Vallejos, E. Distribution of Seed Mineral Nutrients and Their Correlation in P. vulgaris. Proc. Fla. State Hort. Soc. 2005, 118, 102–105. [Google Scholar]
- Hacisalihoglu, G.; Settles, A.M. Natural Variation of Seed Composition of 91 Common Bean Genotypes and Their Possible Assoc with Seed Coat Color. J. Plant Nutr. 2013, 36, 772–780. [Google Scholar] [CrossRef]
- Hacisalihoglu, G.; Gustin, J.; Louisma, J.; Armstrong, P.; Peter, G.; Settles, A.M. Enhanced Single Seed Trait Predictions in Soybean and Robust Calibration Model Transfer. J. Agric. Food Chem. 2016, 64, 1079–1086. [Google Scholar] [CrossRef] [PubMed]
- Hacisalihoglu, G.; Settles, A.M. Quantification of Seed Ionome Variation in 90 Diverse Soybean (Glycine max) Lines. J. Plant Nutr. 2017, 40, 2808–2817. [Google Scholar] [CrossRef]
- Hacisalihoglu, G.; Kantanka, S.; Miller, N.; Gustin, J.L.; Settles, A.M. Modulation of early maize seedling performance via priming under sub-optimal temperatures. PLoS ONE 2018, 13, e0206861. [Google Scholar] [CrossRef] [PubMed]
- Hacisalihoglu, G.; Burton, A.L.; Gustin, J.; Eker, S.; Asikli, S.; Heybet, E.; Ozturk, L.; Cakmak, I.; Yazici, A.; Burkey, K.O.; et al. Quantitative trait loci associated with soybean seed weight and composition under different phosphorus levels. J. Integ. Plant Bio. 2018, 60, 232–241. [Google Scholar] [CrossRef] [PubMed] [Green Version]
- Hacisalihoglu, G. Zinc (Zn): The Last Nutrient in the Alphabet and Shedding Light on Zn Efficiency for Future of Crop Production under Suboptimal Zn. Plants 2020, 9, 1471. [Google Scholar] [CrossRef] [PubMed]
- Hacisalihoglu, G.; Beisel, N.; Settles, A.M. Characterization of pea seed nutritional value within a diverse population of Pisum sativum. PLoS ONE 2021, 16, e0259565. [Google Scholar] [CrossRef] [PubMed]
- IPCC. Intergovernmental Panel on Climate Change. Climate Change 2021: The Physical Science Basis. Available online: https://www.ipcc.ch/report/ar6/wg1/#FullReport (accessed on 13 December 2021).
- Zheng, G.; Chen, J.; Li, W. Impacts of CO2 elevation on physiology and seed quality of soybean. Plant Div. 2020, 42, 44–51. [Google Scholar] [CrossRef] [PubMed]
- Jablonski, L.M.; Wang, X.; Curtis, P.S. Plant reproduction under elevated CO2 conditions: A meta-analysis of reports 79 crop and wild species. New Phytol. 2002, 156, 9–26. [Google Scholar] [CrossRef]
- USDA. Dietary Guidelines for Americans. Available online: www.dietaryguidelines.gov (accessed on 13 December 2021).
- FDA. U.S. Food and Drug Administration: Nutrient Content Claims for “Good Source,” “High,” “More,” and “High Potency” Code of Federal Regulations. 2014, Subpart D, Title 21, 101.54. Available online: https://www.accessdata.fda.gov/scripts/cdrh/cfdocs/cfcfr/cfrsearch.cfm?fr=101.54 (accessed on 13 December 2021).
- Govindaraj, M.; Rai, K.N.; Kanatti, A.; Upadhyaya, H.D.; Shivade, H.; Rao, A.S. Exploring the genetic variability and diversity of pearl millet core collection germplasm for grain nutritional traits improvement. Sci. Rep. 2020, 10, 21177. [Google Scholar] [CrossRef] [PubMed]
- Tumwegamire, S.; Kapinga, R.; Rubaihayo, P.R.; Labonte, D.R.; Grüneberg, W.J.; Burgos, G.; Zum Felde, T.; Caprio, R.; Pawelzik, E.; Mwanga, R.O.M. Evaluation of dry matter, protein, starch, sucrose, β-carotene, iron, zinc, calcium, and magnesium in East African sweetpotato [Ipomoea batatas] germplasm. HortScience 2011, 46, 348–357. [Google Scholar] [CrossRef]


| Flax Variety | Performance |
| Omega | Highest: P; Mo. High: Ca, Zn, Cu, Ni |
| Clli1374 | Highest: Mg. High: Mn, Mo |
| Clli1418 | Highest: Ca. High: Ni, Fe, P |
| Clli1821 | Highest: B, Cu |
| Clli643 | Highest: Zn. High: Mo, K |
| Clli2033 | Highest: Fe, High: Ni, Mn |
| Sorghum Variety | Performance |
| PI520799 | Highest: P. High: Mg, Ca, S, B, Zn, Mn, Fe, Zn, Cu, Mo |
| PI365024 | Highest: K, B, Mn, Fe. High: Mg, Ca, S, Zn, Cu |
| PI185574 | Highest: Mg, Ca, S, Ni. High: P, K, B, Mn, Fe, Cu |
| PI266958 | Highest: Zn. High: K, B, Mn, Ni |
| PI534144 | Highest: Mo. High: Zn, Cu, P |
| PI550850 | Highest: Cu, High: Ca |
| Macronutrients | |||||||
| N | P | K | Ca | Mg | S | ||
| % | % | % | % | % | % | ||
| Flax | Avg. | 3.92 | 0.80 | 0.80 | 0.24 | 0.42 | 0.27 |
| SD | 0.37 | 0.10 | 0.12 | 0.04 | 0.03 | 0.01 | |
| Min | 2.90 | 0.60 | 0.59 | 0.18 | 0.34 | 0.24 | |
| Max | 4.98 | 0.99 | 1.18 | 0.38 | 0.47 | 0.30 | |
| Sorghum | Avg. | 1.93 | 0.42 | 0.45 | 0.02 | 0.17 | 0.15 |
| SD | 0.32 | 0.08 | 0.09 | 0.01 | 0.03 | 0.05 | |
| Min | 1.35 | 0.26 | 0.28 | 0.01 | 0.12 | 0.10 | |
| Max | 2.99 | 0.70 | 0.74 | 0.05 | 0.25 | 0.43 | |
| Micronutrients (Trace elements) | |||||||
| Zn | Fe | Cu | B | Mn | Mo | ||
| µg/g | µg/g | µg/g | µg/g | µg/g | µg/g | ||
| Flax | Avg. | 73.40 | 70.10 | 11.80 | 18.80 | 25.50 | 2.98 |
| SD | 16.90 | 16.50 | 3.45 | 5.36 | 5.11 | 0.35 | |
| Min | 38.00 | 43.70 | 4.21 | 9.61 | 15.50 | 2.27 | |
| Max | 127.00 | 196.00 | 24.20 | 40.50 | 41.00 | 4.58 | |
| Sorghum | Avg. | 40.80 | 48.10 | 5.25 | 3.89 | 20.10 | 2.35 |
| SD | 20.1 | 69.10 | 2.96 | 1.79 | 7.98 | 0.73 | |
| Min | 21.80 | 14.00 | 2.19 | 1.96 | 9.70 | 1.15 | |
| Max | 211 | 643 | 27.0 | 13.0 | 61.1 | 5.12 | |
Publisher’s Note: MDPI stays neutral with regard to jurisdictional claims in published maps and institutional affiliations. |
© 2022 by the authors. Licensee MDPI, Basel, Switzerland. This article is an open access article distributed under the terms and conditions of the Creative Commons Attribution (CC BY) license (https://creativecommons.org/licenses/by/4.0/).
Share and Cite
Hacisalihoglu, G.; Armstrong, P.R. Flax and Sorghum: Multi-Element Contents and Nutritional Values within 210 Varieties and Potential Selection for Future Climates to Sustain Food Security. Plants 2022, 11, 451. https://doi.org/10.3390/plants11030451
Hacisalihoglu G, Armstrong PR. Flax and Sorghum: Multi-Element Contents and Nutritional Values within 210 Varieties and Potential Selection for Future Climates to Sustain Food Security. Plants. 2022; 11(3):451. https://doi.org/10.3390/plants11030451
Chicago/Turabian StyleHacisalihoglu, Gokhan, and Paul R. Armstrong. 2022. "Flax and Sorghum: Multi-Element Contents and Nutritional Values within 210 Varieties and Potential Selection for Future Climates to Sustain Food Security" Plants 11, no. 3: 451. https://doi.org/10.3390/plants11030451