

Application of Magnesium and Calcium Sulfate on Growth and Physiology of Forage Crops under Long-Term Salinity Stress


Abstract
:1. Introduction
2. Results
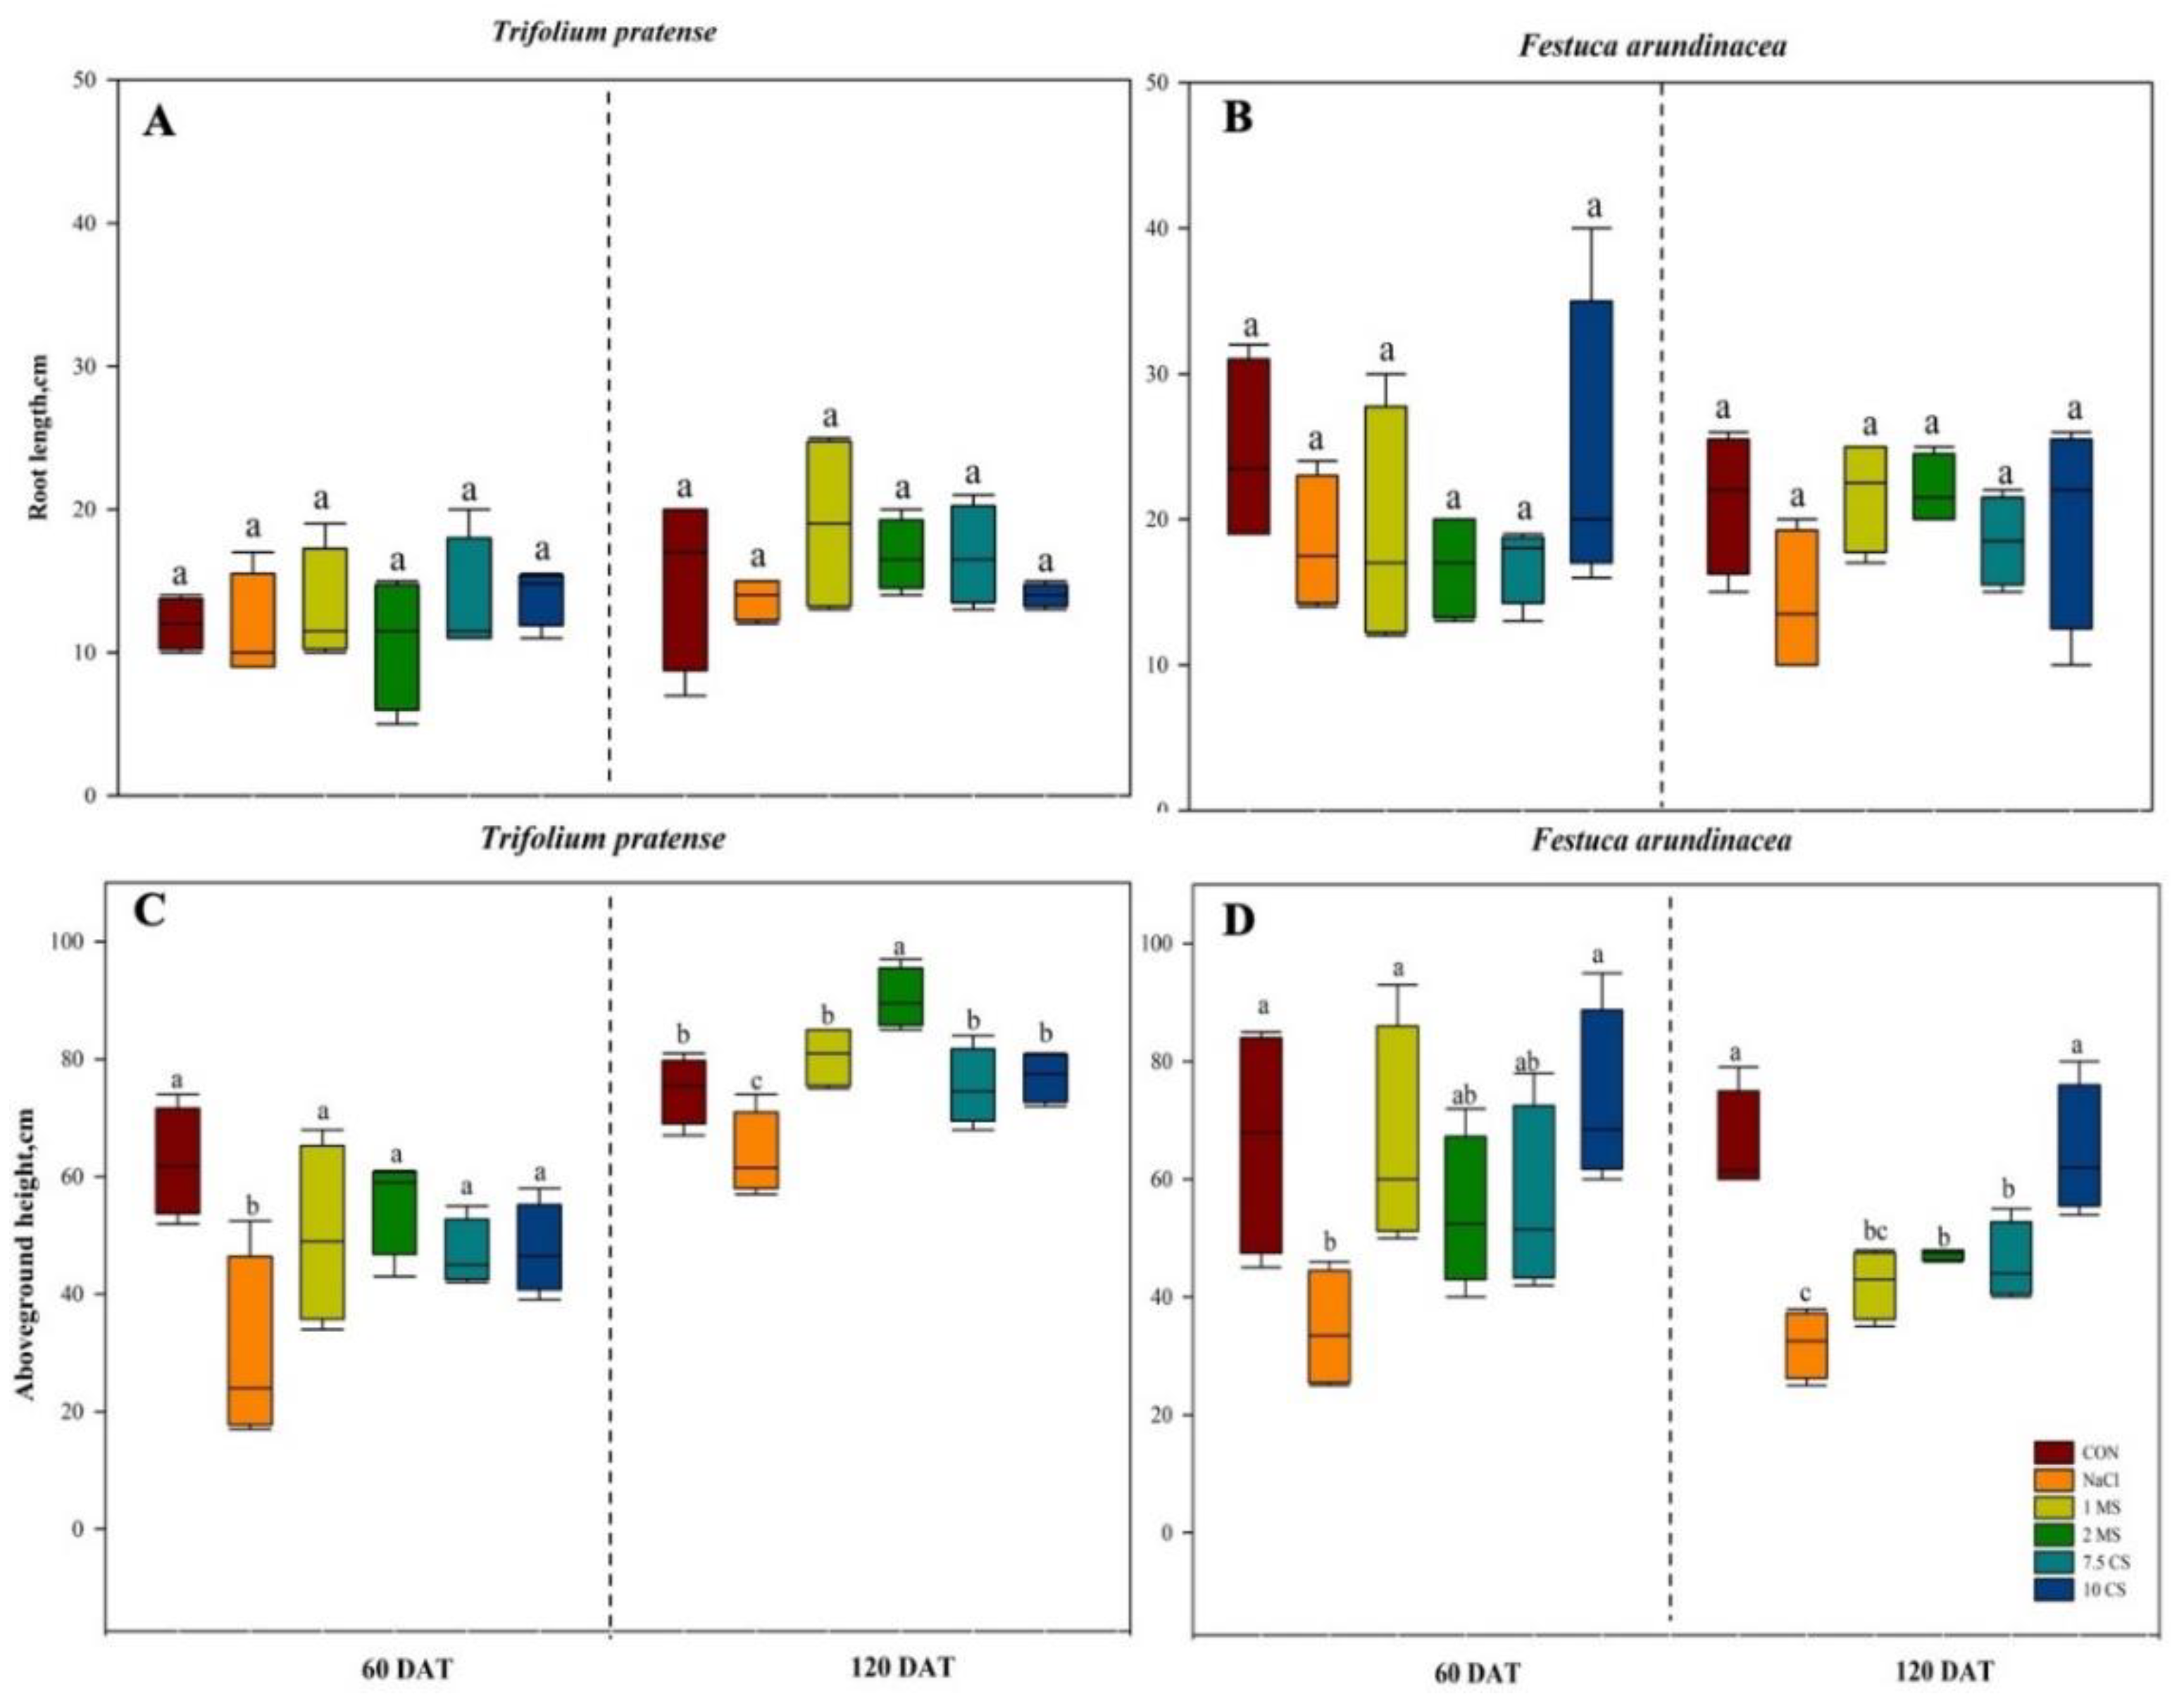
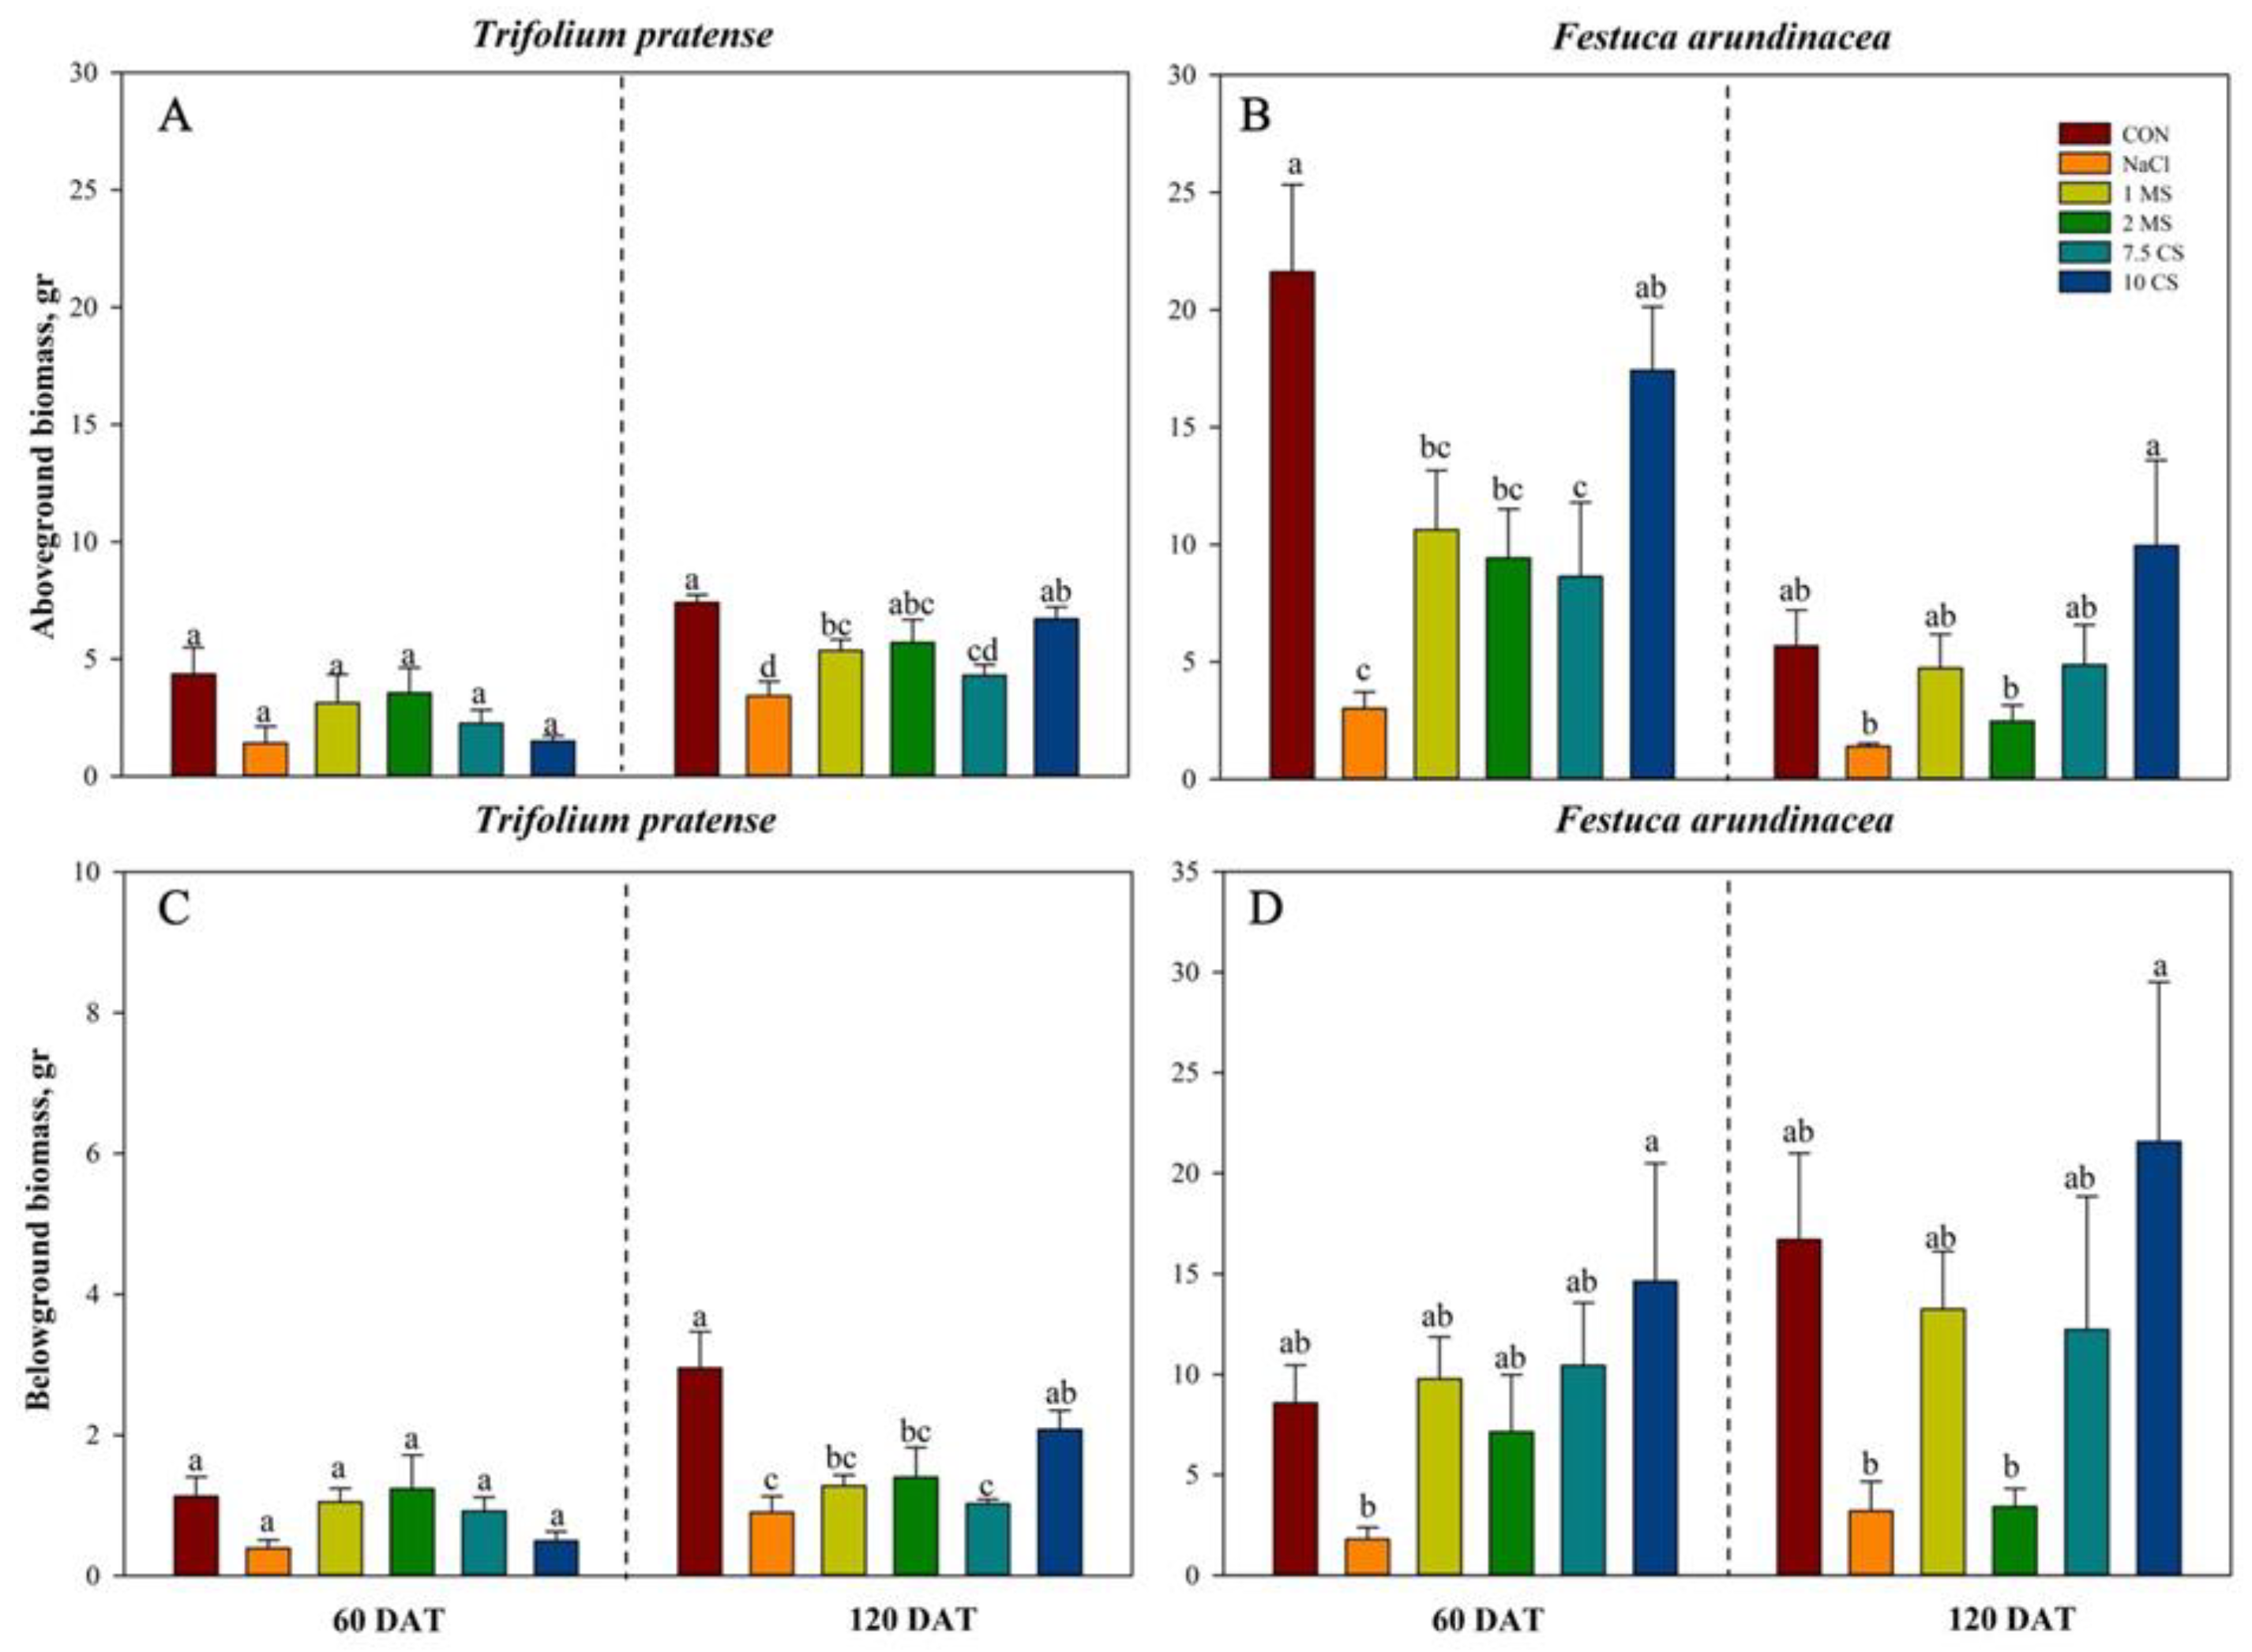
2.1. Biomass
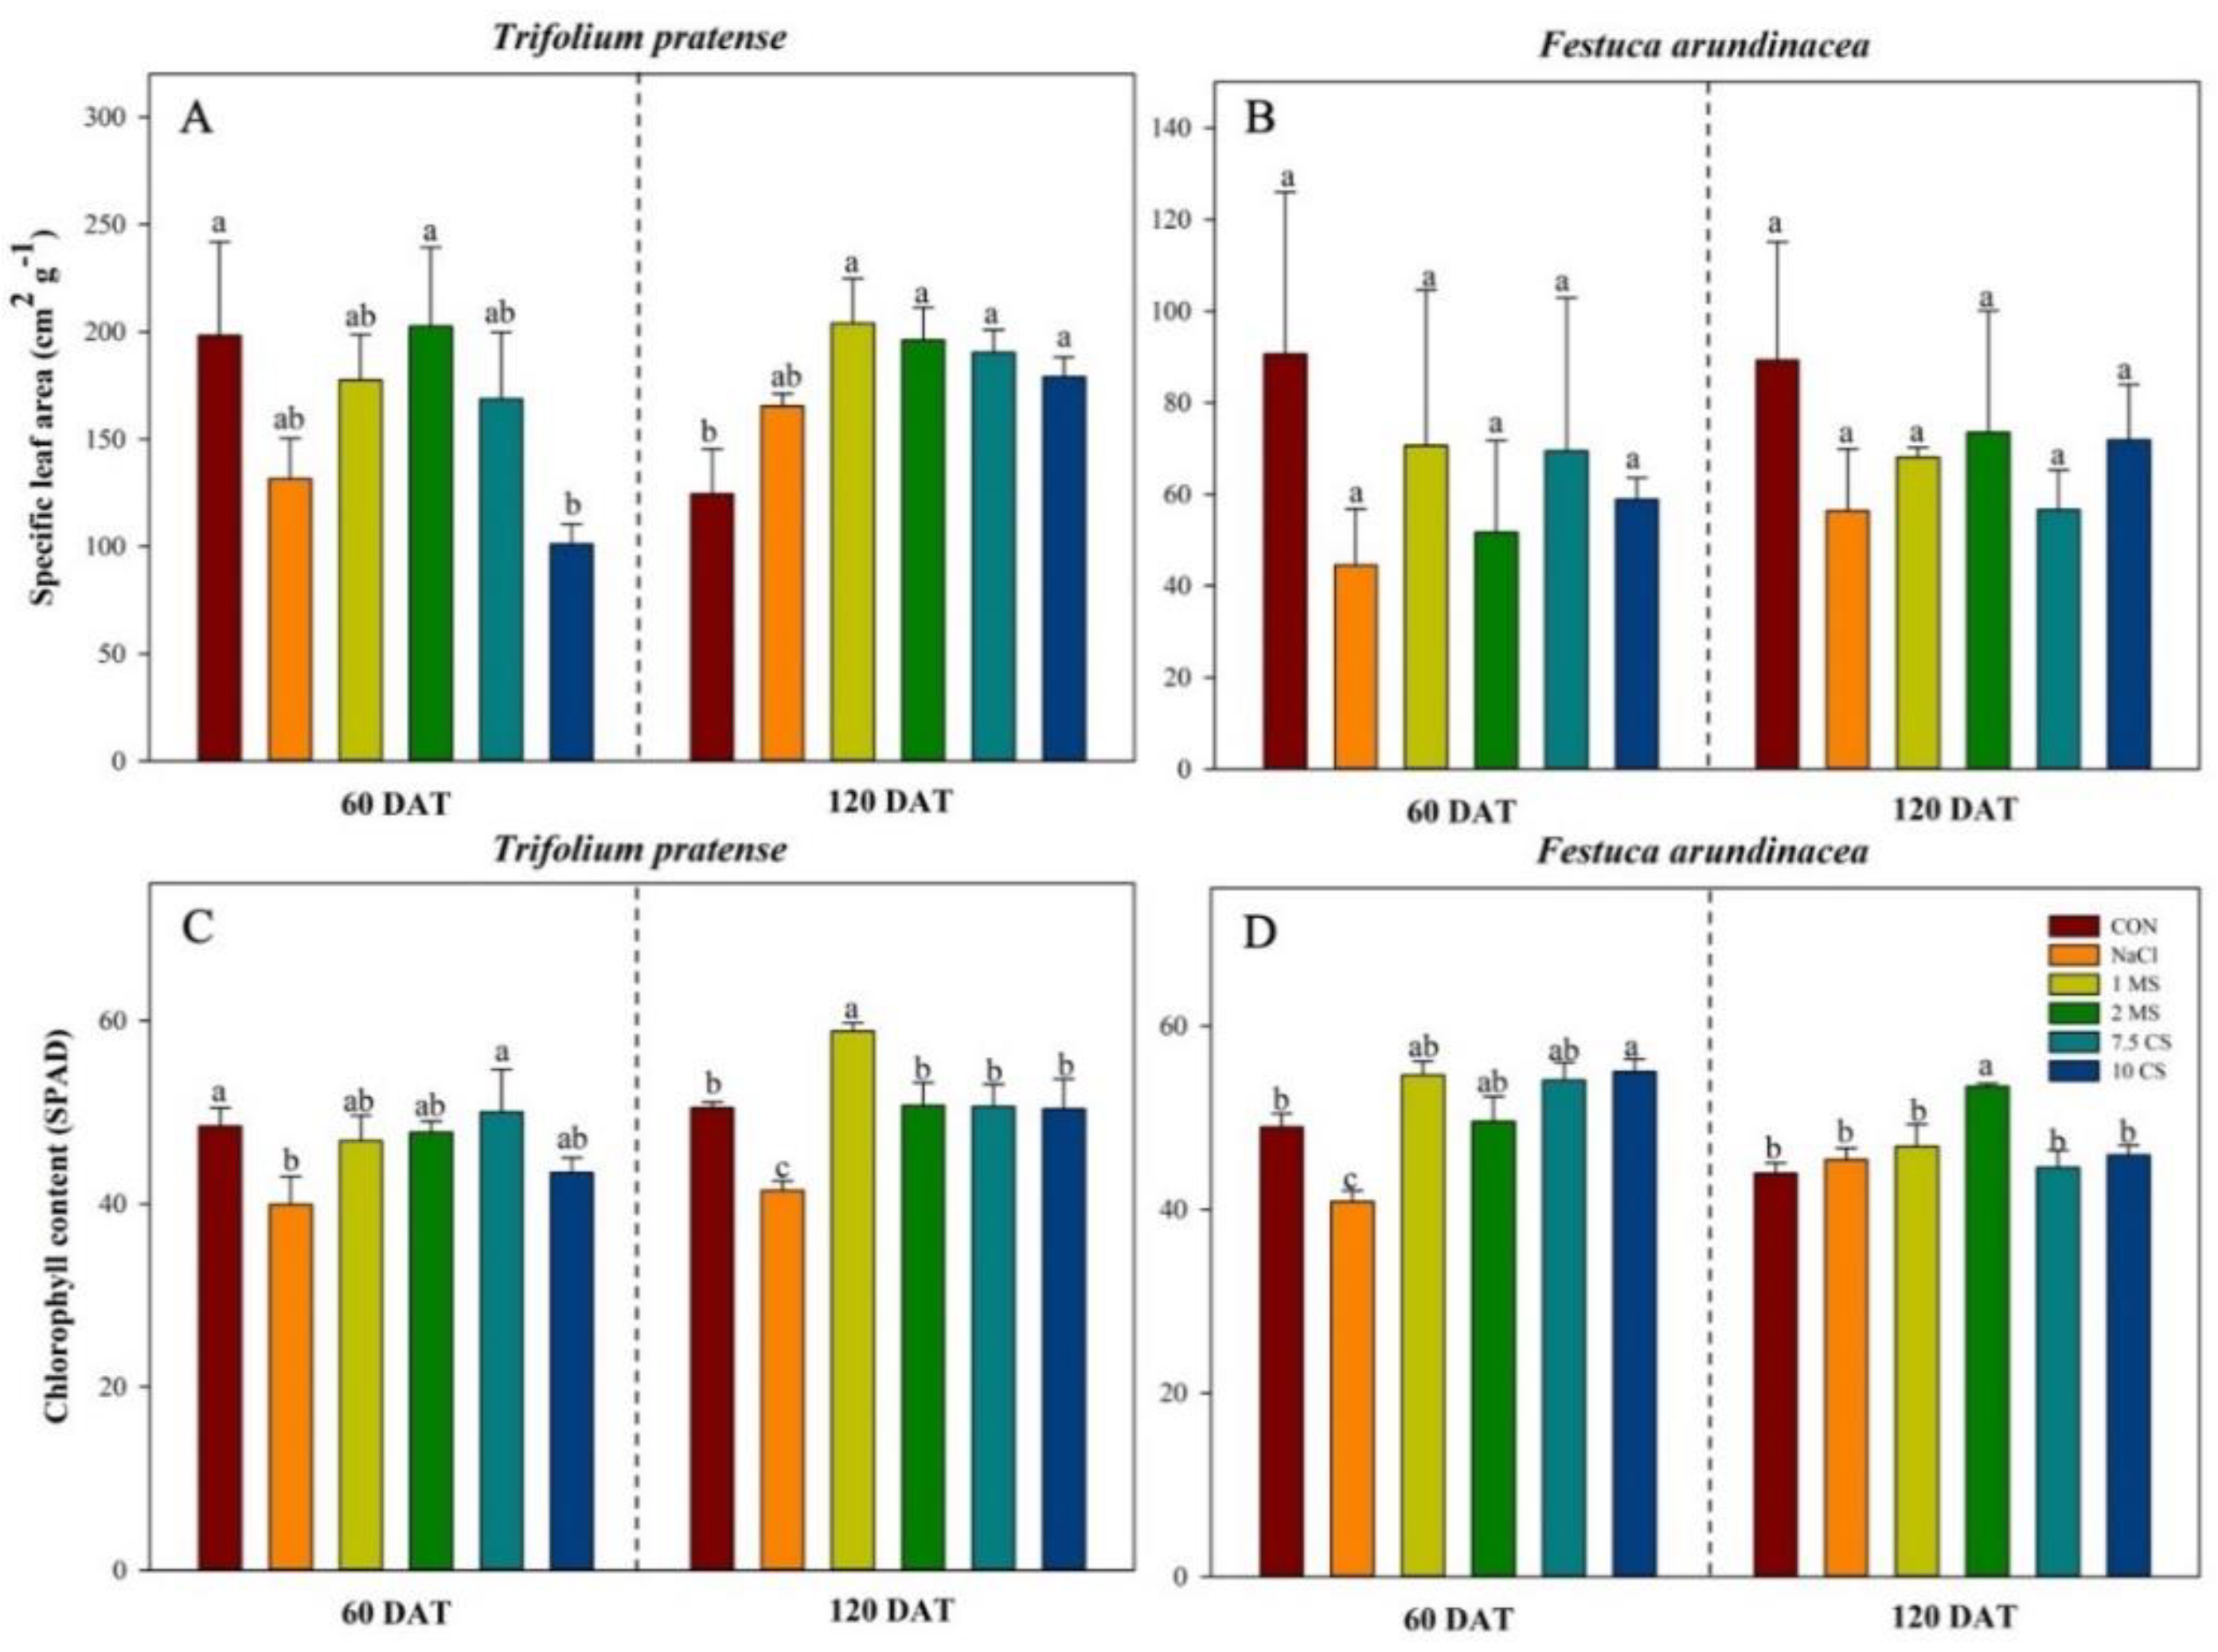
2.2. Specific Leaf Area (SLA) Measurements and SPAD
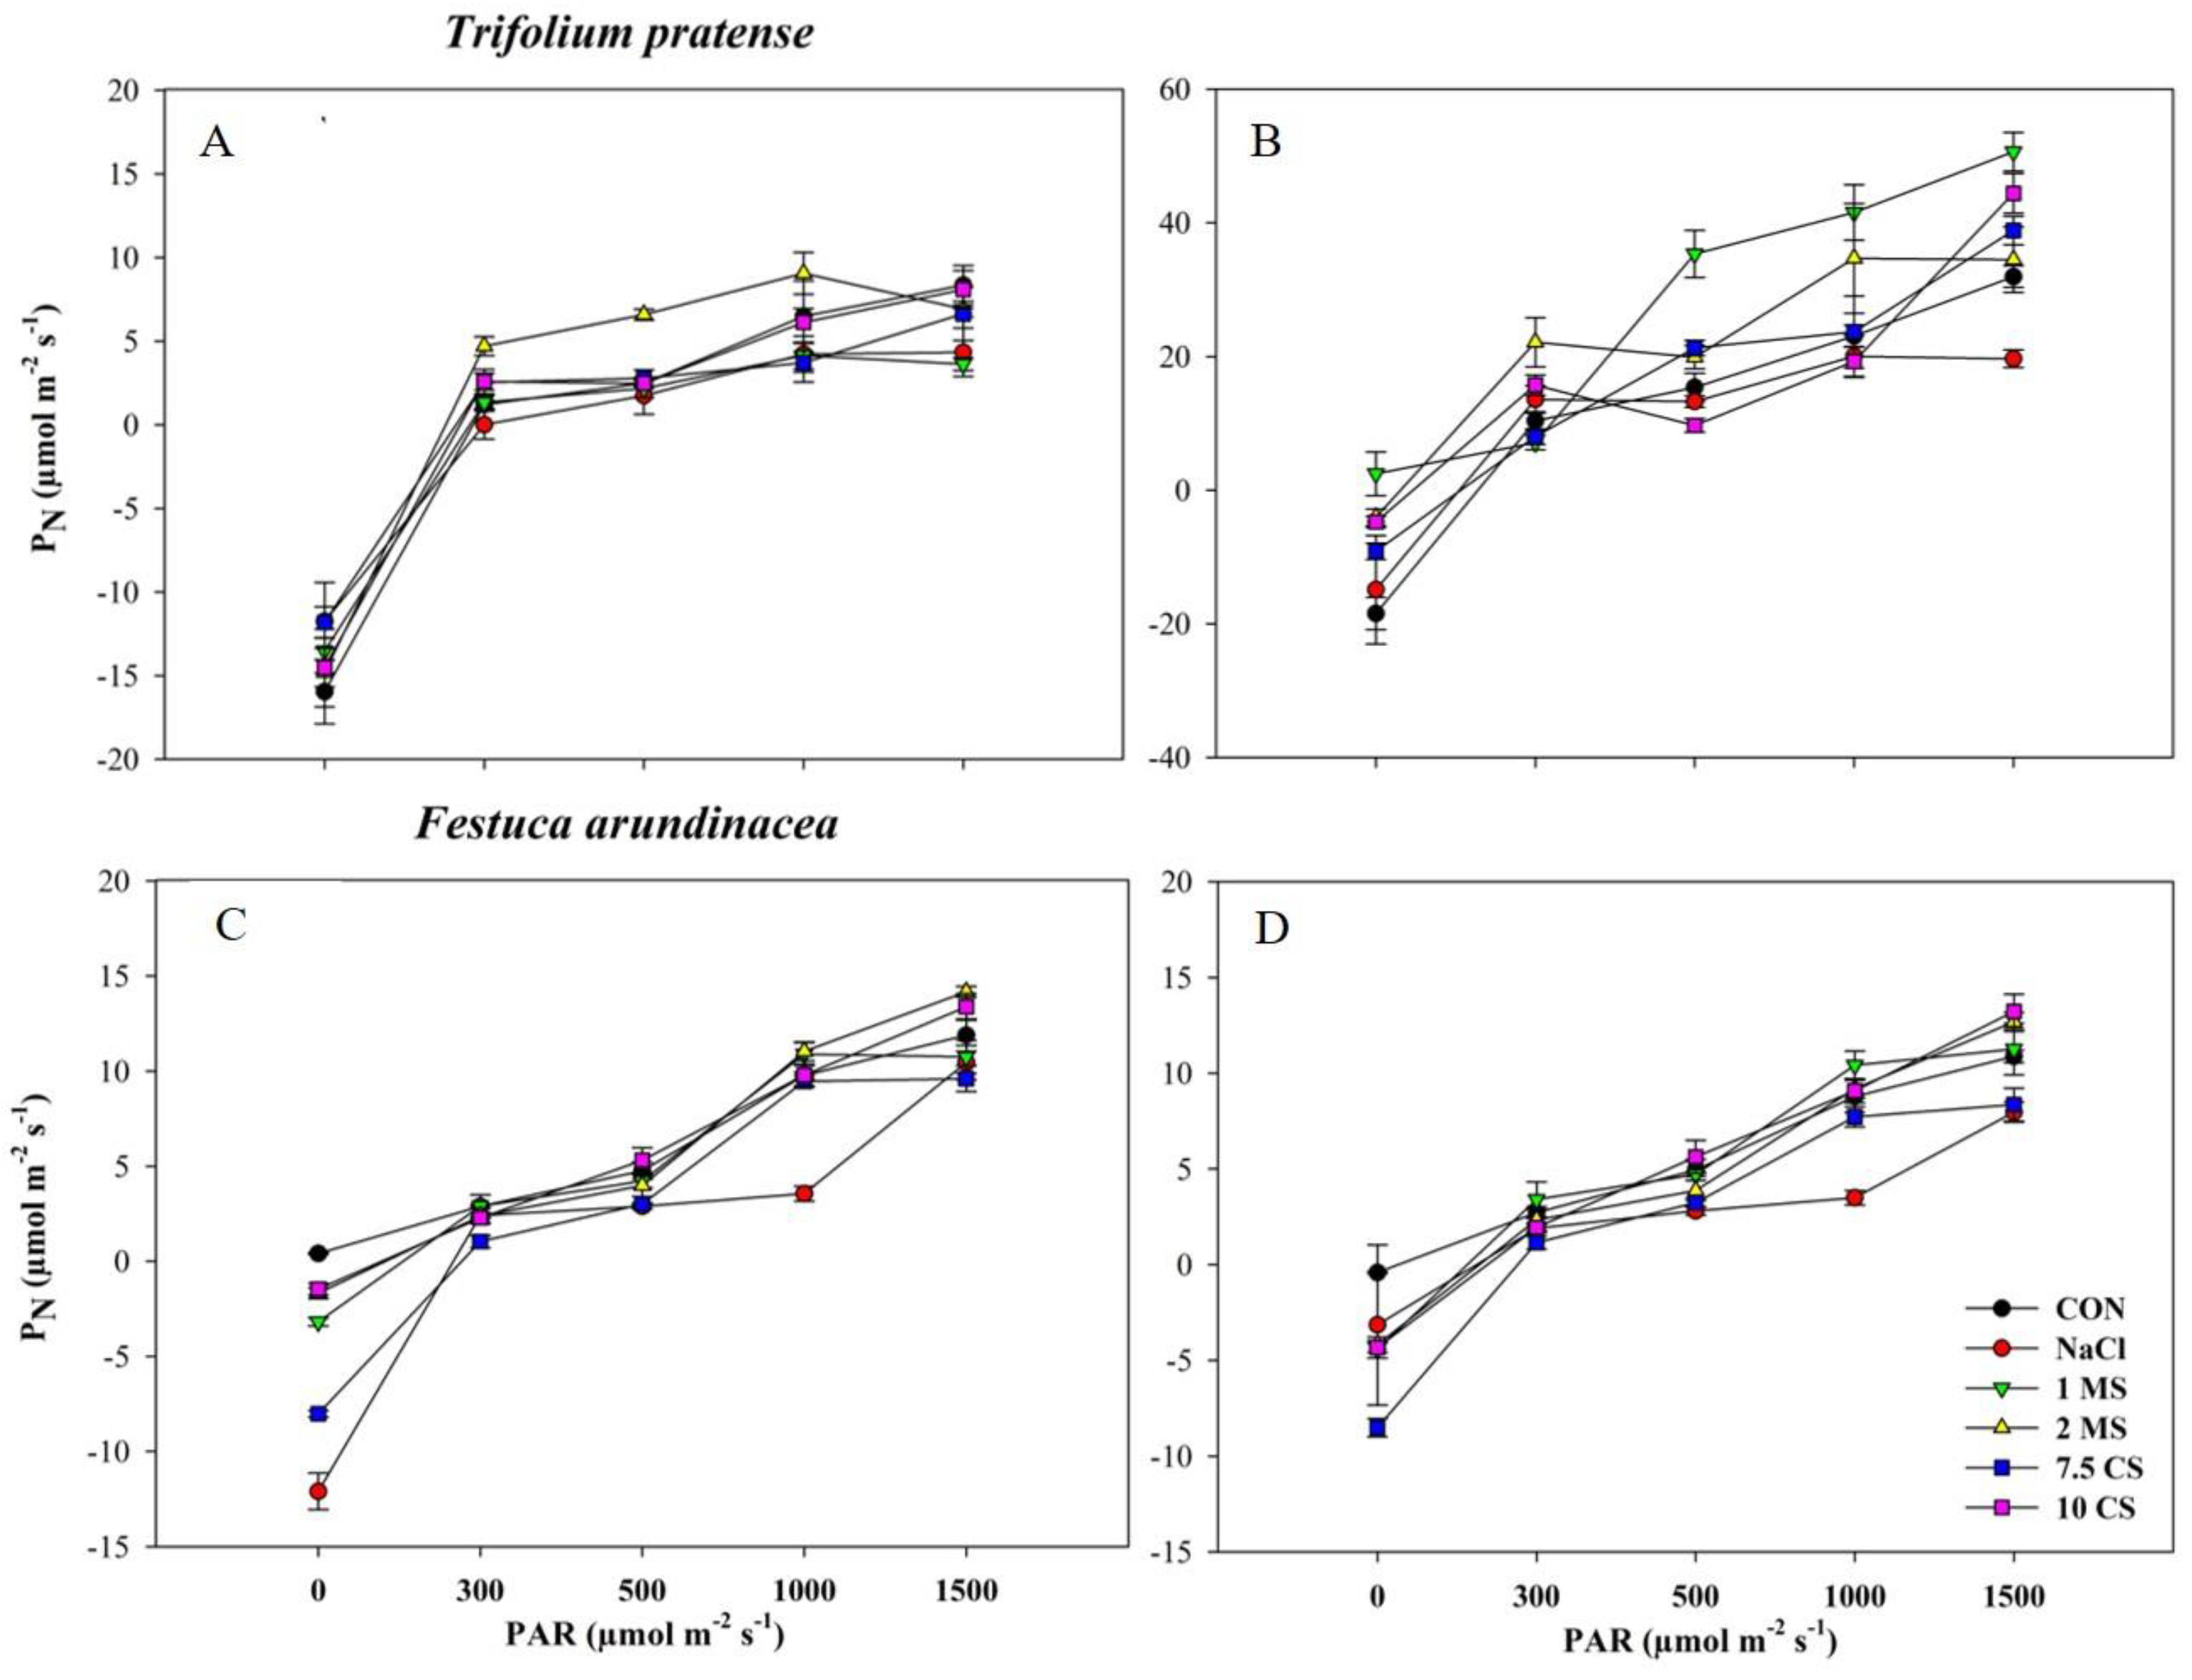
2.3. Photosynthesis Rate
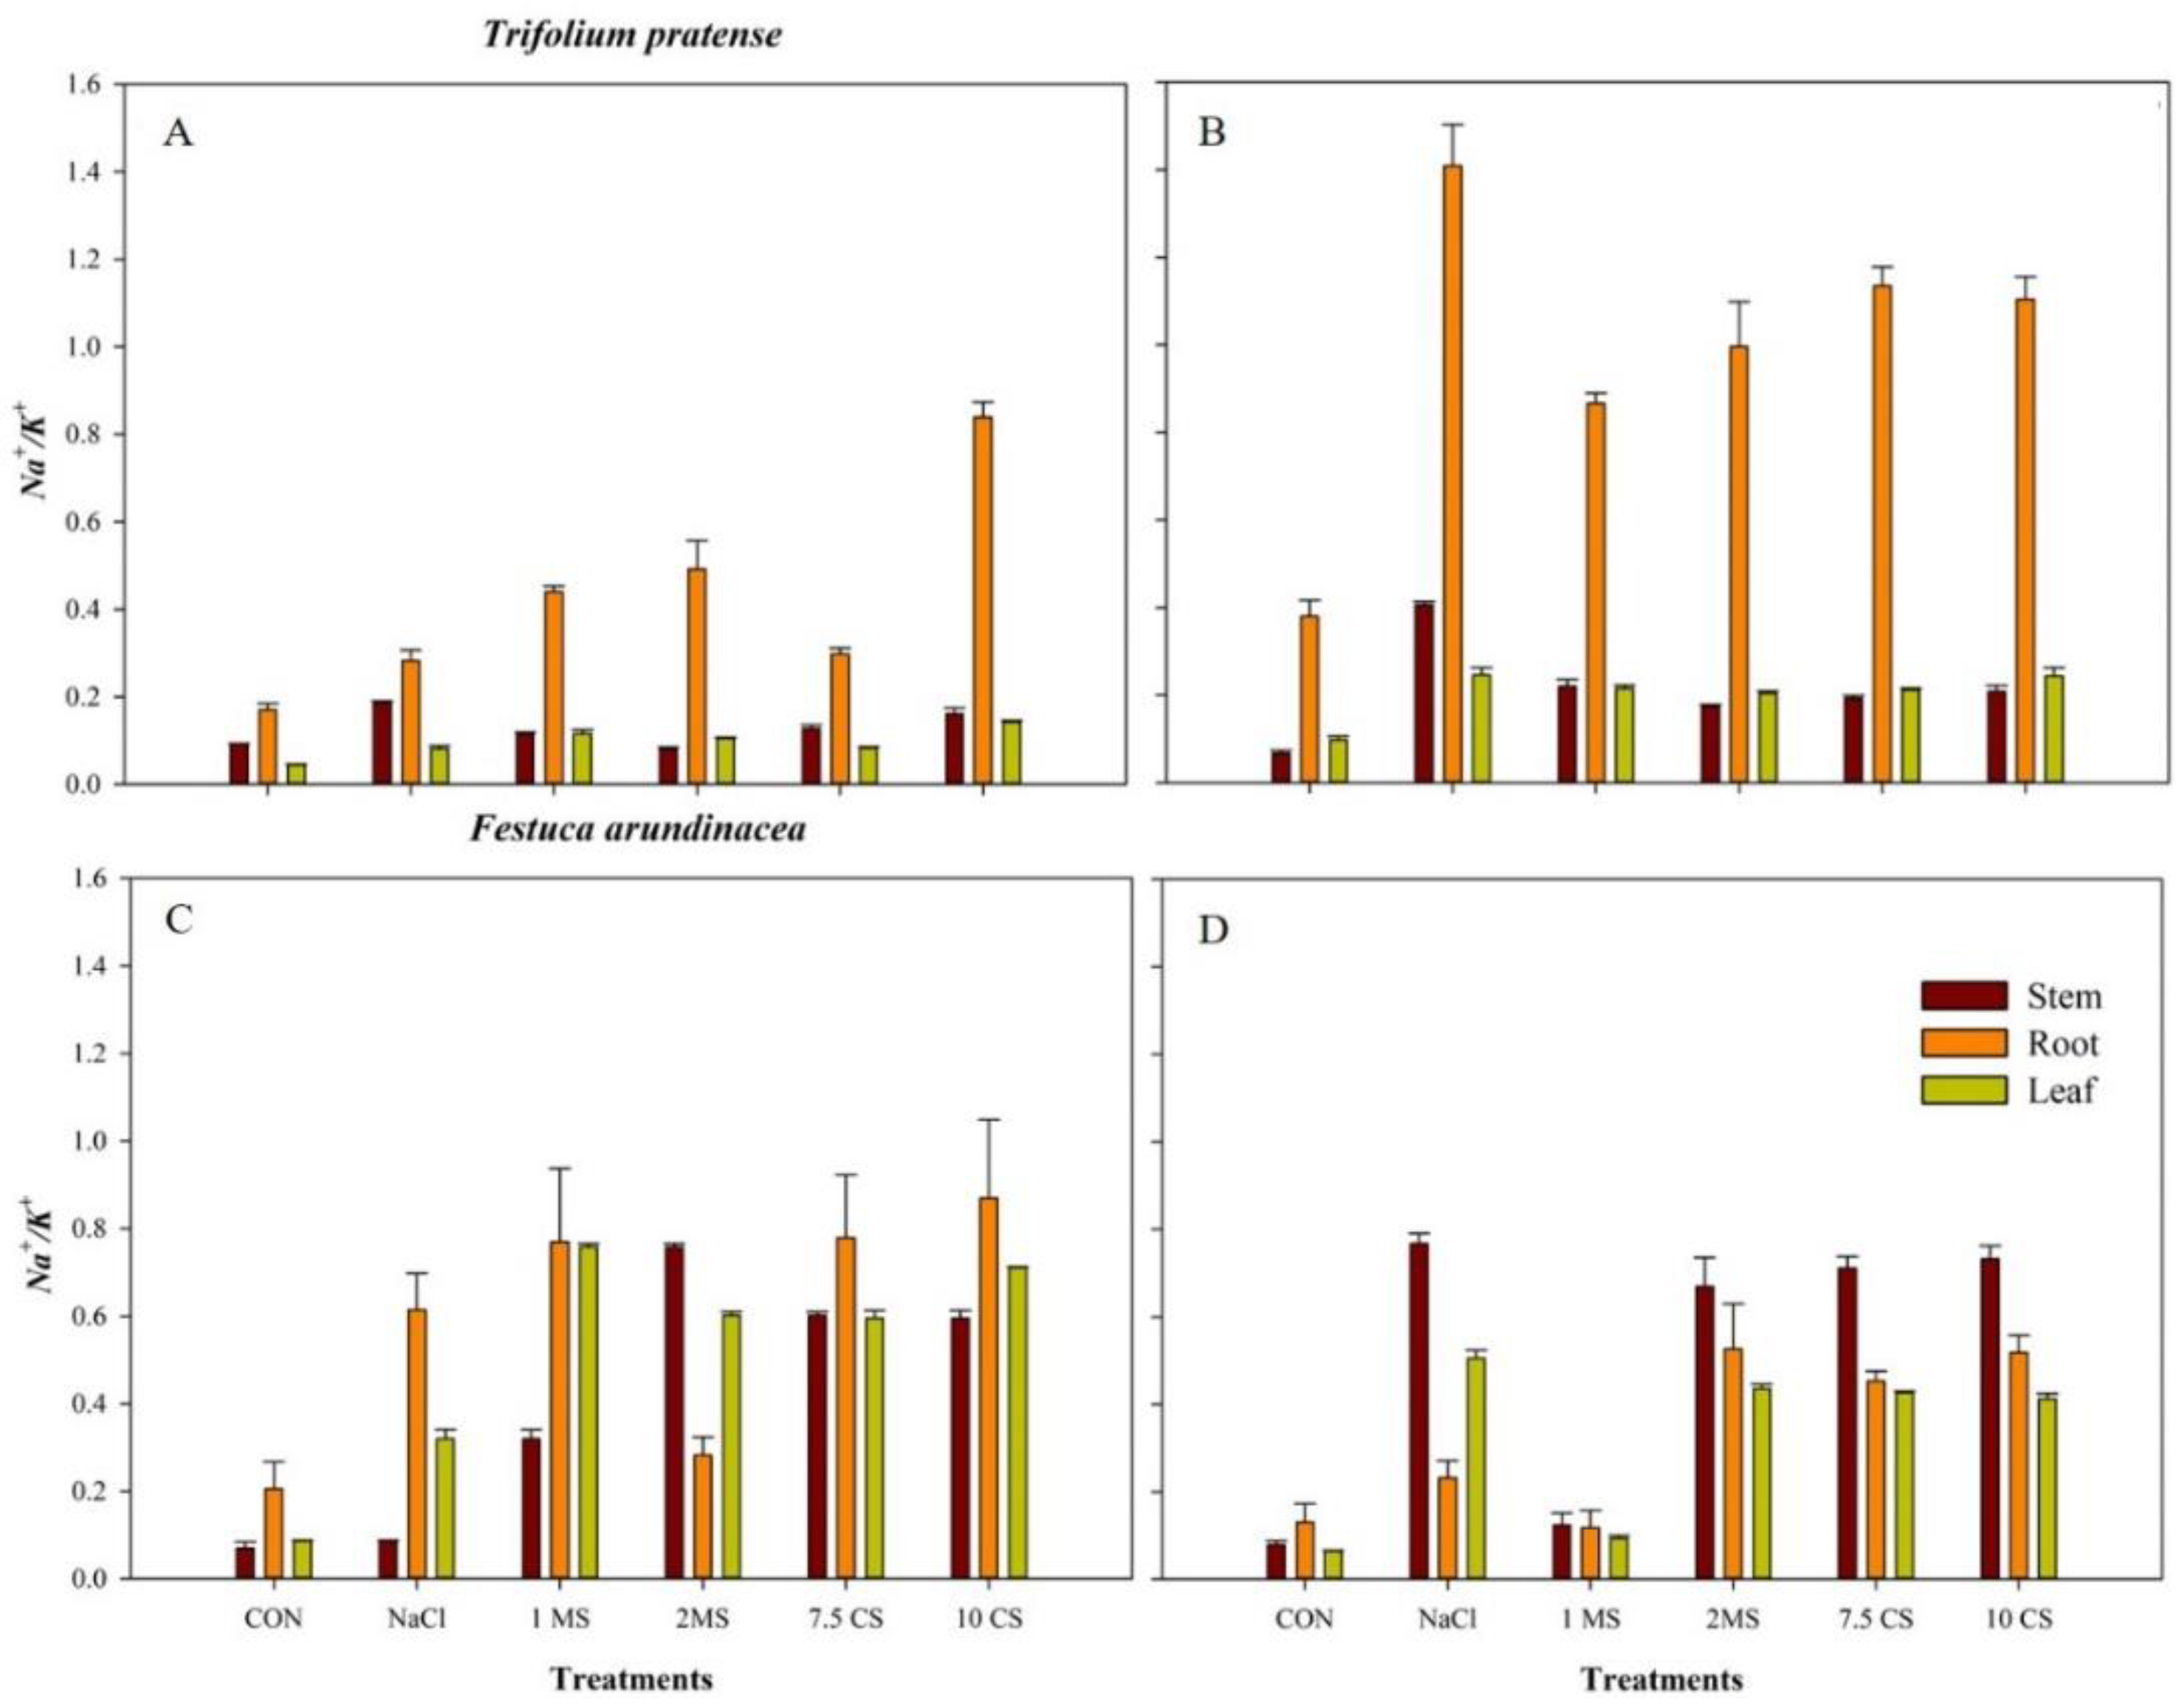
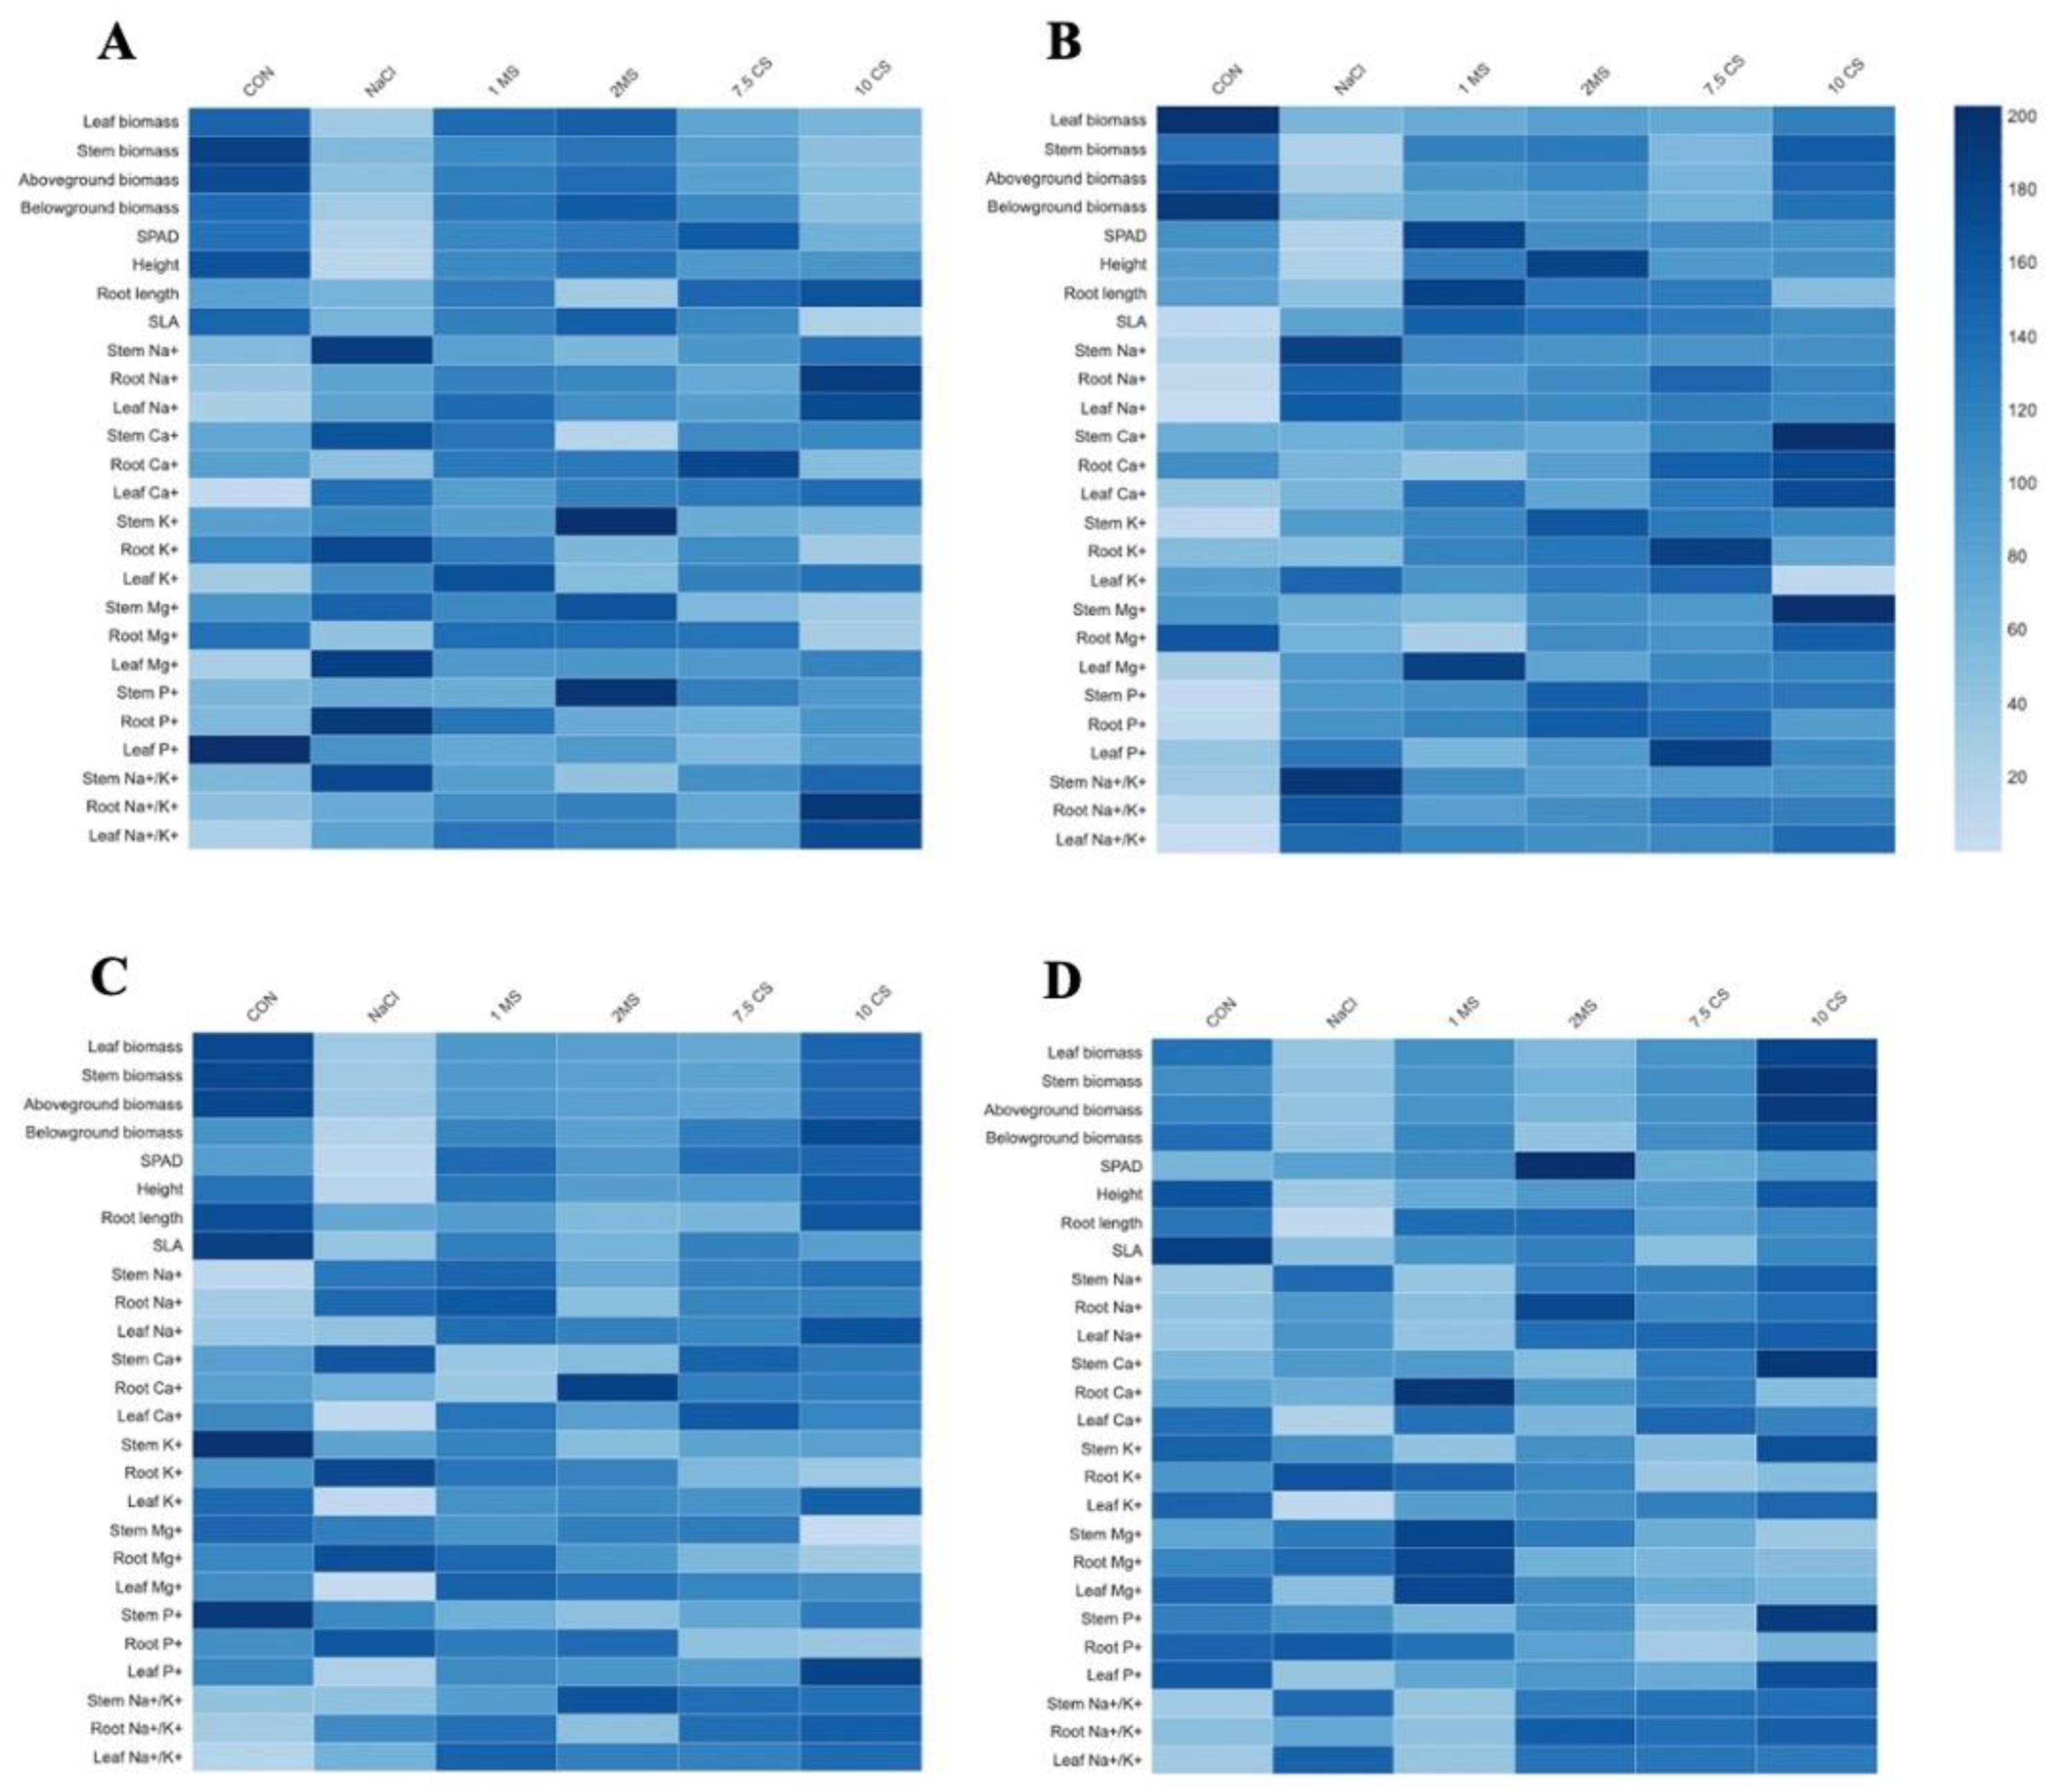
2.4. Elemental Analysis
3. Discussion
4. Materials and Methods
4.1. Plant Materials and Experimental Design
4.2. Experimental Treatments
4.3. Measurement of Biomass
4.4. Measurements of Specific Leaf Area (SLA) and SPAD
4.5. Measurement of Photosynthesis Rate
4.6. Crude protein, ADF, NDF and Elemental Analysis in Plant Tissues
4.7. Statistical Analysis
5. Conclusions
Supplementary Materials
Author Contributions
Funding
Institutional Review Board Statement
Informed Consent Statement
Data Availability Statement
Conflicts of Interest
References
- FAO. Halt soil salinization, boost soil productivity. In Proceedings of the Global Symposium on Salt-affected Soils, Rome, Italy, 20–22 October 2021; p. 413. [Google Scholar]
- Munns, R.; Gilliham, M. Salinity tolerance of crops—What is the cost? New Phytol. 2015, 208, 668–673. [Google Scholar] [CrossRef] [PubMed] [Green Version]
- Munns, R. Genes and salt tolerance: Bringing them together. New Phytol. 2005, 167, 645–663. [Google Scholar] [CrossRef] [PubMed]
- Kucukyumuk, Z.; Suarez, D.L. The effect of selenium on salinity stress and selenate–sulfate comparision in kale. J. Plant Nutr. 2021, 44, 2996–3004. [Google Scholar] [CrossRef]
- Chen, Y.; Hoehenwarter, W. Changes in the phosphoproteome and metabolome link early signaling events to rearrangement of photosynthesis and central metabolism in salinity and oxidative stress response in arabidopsis. Plant Physiol. 2015, 169, 3021–3033. [Google Scholar] [CrossRef] [PubMed] [Green Version]
- Tan, M.; Yolcu, H. Current Status of Forage Crops Cultivation and Strategies for the Future in Turkey: A Review. Tarım Bilim. Derg. 2021, 27, 114–121. [Google Scholar] [CrossRef]
- Capstaff, N.M.; Miller, A.J. Improving the yield and nutritional quality of forage crops. Front. Plant Sci. 2018, 9, 535. [Google Scholar] [CrossRef] [Green Version]
- Al-Dakheel, A.J.; Iftikhar Hussain, M.; Abdul Rahman, A.Q.M. Impact of irrigation water salinity on agronomical and quality attributes of Cenchrus ciliaris L. accessions. Agric. Water Manag. 2015, 159, 148–154. [Google Scholar] [CrossRef]
- Hedayati-Firoozabadi, A.; Kazemeini, S.A.; Pirasteh-Anosheh, H.; Ghadiri, H.; Pessarakli, M. Forage yield and quality as affected by salt stress in different ratios of Sorghum bicolor-Bassia indica intercropping. J. Plant Nutr. 2020, 43, 2579–2589. [Google Scholar] [CrossRef]
- Blaise, D.; Singh, J.V.; Bonde, A.N.; Tekale, K.U.; Mayee, C.D. Effects of farmyard manure and fertilizers on yield, fibre quality and nutrient balance of rainfed cotton (Gossypium hirsutum). Bioresour. Technol. 2005, 96, 345–349. [Google Scholar] [CrossRef]
- Ferreira, J.F.S.; Cornacchione, M.V.; Liu, X.; Suarez, D.L. Nutrient Composition, Forage Parameters, and Antioxidant Capacity of Alfalfa (Medicago sativa, L.) in Response to Saline Irrigation Water. Agriculture 2015, 5, 577–597. [Google Scholar] [CrossRef]
- Wang, W.; Vinocur, B.; Altman, A. Plant responses to drought, salinity and extreme temperatures: Towards genetic engineering for stress tolerance. Planta 2003, 218, 1–14. [Google Scholar] [CrossRef] [PubMed]
- Tang, R.J.; Luan, S. Regulation of calcium and magnesium homeostasis in plants: From transporters to signaling network. Curr. Opin. Plant Biol. 2017, 39, 97–105. [Google Scholar] [CrossRef] [PubMed]
- Thor, K. Calcium—Nutrient and messenger. Front. Plant Sci. 2019, 10, 440. [Google Scholar] [CrossRef]
- Kairies, C.L.; Schroeder, K.T.; Cardone, C.R. Mercury in gypsum produced from flue gas desulfurization. Fuel 2006, 85, 2530–2536. [Google Scholar] [CrossRef]
- Zielewicz, W.; Swędrzyńska, D.; Swędrzyński, A.; Grzebisz, W.; Goliński, P. The Influence of Calcium Sulfate and Different Doses of Potassium on the Soil Enzyme Activity and the Yield of the Sward with a Mixture of Alfalfa and Grasses. Agriculture 2022, 12, 475. [Google Scholar] [CrossRef]
- Schonewille, J.T. Magnesium in dairy cow nutrition: An overview. Plant Soil 2013, 368, 167–178. [Google Scholar] [CrossRef]
- White, P.J.; Broadley, M.R. Biofortification of crops with seven mineral elements often lacking in human diets—Iron, zinc, copper, calcium, magnesium, selenium and iodine. New Phytol. 2009, 182, 49–84. [Google Scholar] [CrossRef]
- Pogłodziński, R.; Barłóg, P.; Grzebisz, W. Effect of nitrogen and magnesium sulfate application on sugar beet yield and quality. Plant Soil Environ. 2021, 67, 507–513. [Google Scholar] [CrossRef]
- Senbayram, M.; Gransee, A.; Wahle, V.; Thiel, H. Role of magnesium fertilisers in agriculture: Plant-soil continuum. Crop Pasture Sci. 2015, 66, 1219–1229. [Google Scholar] [CrossRef]
- Xuan, T.D.; Huong, C.T.; Van Quan, N.; Anh, L.H.; Khanh, T.D.; Rayee, R. Improvement of Salinity Tolerance in Rice Seedlings by Exogenous Magnesium Sulfate Application. Soil Syst. 2022, 6, 69. [Google Scholar] [CrossRef]
- Farhangi-Abriz, S.; Ghassemi-Golezani, K. Changes in soil properties and salt tolerance of safflower in response to biochar-based metal oxide nanocomposites of magnesium and manganese. Ecotoxicol. Environ. Saf. 2021, 211, 111904. [Google Scholar] [CrossRef] [PubMed]
- Kozieł, M.; Kalita, M.; Janczarek, M. Genetic diversity of microsymbionts nodulating Trifolium pratense in subpolar and temperate climate regions. Sci. Rep. 2022, 12, 12144. [Google Scholar] [CrossRef] [PubMed]
- Mo, F.; Li, H.; Li, Y.; Ma, C.; Wang, M.; Li, Z.; Deng, N.; Zhang, C.; Xing, B.; Xu, J.; et al. Exploration of defense and tolerance mechanisms in dominant species of mining area—Trifolium pratense L. upon exposure to silver. Sci. Total Environ. 2022, 811, 151380. [Google Scholar] [CrossRef] [PubMed]
- Sousa, D.O.; Hansen, H.H.; Hallin, O.; Nussio, L.G.; Nadeau, E. A two-year comparison on nutritive value and yield of eight lucerne cultivars and one red clover cultivar. Grass Forage Sci. 2020, 75, 76–85. [Google Scholar] [CrossRef]
- Maiti, R.K.; de la Rosa-Ibarra, M.; Sandoval, N.D. Genotypic Variability in Glossy Sorghum Lines for Resistance to Drought, Salinity and Temperature Stress at the Seedling Stage. J. Plant Physiol. 1994, 143, 241–244. [Google Scholar] [CrossRef]
- Ghassemabadi, F.H.; Eisvand, H.R.; Akbarpour, O.A. Evaluation of salinity tolerance of different clover species at germination and seedling stages. Iran. J. Plant Physiol. 2018, 8, 2469–2477. [Google Scholar] [CrossRef]
- Pan, L.; Cui, S.; Dinkins, R.D.; Jiang, Y. Plant growth, ion accumulation, and antioxidant enzymes of endophyte-infected and endophyte-free tall fescue to salinity stress. Acta Physiol. Plant. 2021, 43, 95. [Google Scholar] [CrossRef]
- Li, X.Y.; Wang, Y.; Dai, Y.; He, Y.; Li, C.X.; Mao, P.; Ma, X.R. The transcription factors of tall fescue in response to temperature stress. Plant Biol. 2021, 23, 89–99. [Google Scholar] [CrossRef]
- Ullah, A.; Bano, A.; Khan, N. Climate Change and Salinity Effects on Crops and Chemical Communication Between Plants and Plant Growth-Promoting Microorganisms Under Stress. Front. Sustain. Food Syst. 2021, 5, 618092. [Google Scholar] [CrossRef]
- Egamberdieva, D.; Wirth, S.; Bellingrath-Kimura, S.D.; Mishra, J.; Arora, N.K. Salt-Tolerant Plant Growth Promoting Rhizobacteria for Enhancing Crop Productivity of Saline Soils. Front. Microbiol. 2019, 10, 2791. [Google Scholar] [CrossRef]
- FAO and ITPS. Status of the World’s Soil Resources: Main Report; FAO: Rome, Italy, 2015. [Google Scholar]
- Szabo, S.; Hossain, M.S.; Adger, W.N.; Matthews, Z.; Ahmed, S.; Lázár, A.N.; Ahmad, S. Soil salinity, household wealth and food insecurity in tropical deltas: Evidence from south-west coast of Bangladesh. Sustain. Sci. 2016, 11, 411–421. [Google Scholar] [CrossRef] [PubMed] [Green Version]
- Kumar, S.; Li, G.; Yang, J.; Huang, X.; Ji, Q.; Liu, Z.; Ke, W.; Hou, H. Effect of Salt Stress on Growth, Physiological Parameters, and Ionic Concentration of Water Dropwort (Oenanthe javanica) Cultivars. Front. Plant Sci. 2021, 12, 660409. [Google Scholar] [CrossRef] [PubMed]
- Angon, P.B.; Tahjib-Ul-Arif, M.; Samin, S.I.; Habiba, U.; Hossain, M.A.; Brestic, M. How Do Plants Respond to Combined Drought and Salinity Stress?—A Systematic Review. Plants 2022, 11, 2884. [Google Scholar] [CrossRef] [PubMed]
- Tuna, A.L.; Kaya, C.; Ashraf, M.; Altunlu, H.; Yokas, I.; Yagmur, B. The effects of calcium sulphate on growth, membrane stability and nutrient uptake of tomato plants grown under salt stress. Environ. Exp. Bot. 2007, 59, 173–178. [Google Scholar] [CrossRef]
- Asci, O.O. Salt tolerance in red clover (Trifolium pratense L.) seedlings. African J. Biotechnol. 2011, 10, 8774–8781. [Google Scholar] [CrossRef] [Green Version]
- Kaplan, M.; Baser, M.; Kale, H.; Irik, H.A.; Ulger, I.; Unlukara, A. Change in yield and chemical composition of tall fescue (Festuca arundinacea schreb.) plants under salt stress. Turk. J. F. Crops 2017, 22, 204–210. [Google Scholar] [CrossRef] [Green Version]
- Shiade, S.R.G.; Boelt, B. Seed germination and seedling growth parameters in nine tall fescue varieties under salinity stress. Acta Agric. Scand. Sect. B Soil Plant Sci. 2020, 70, 485–494. [Google Scholar] [CrossRef]
- Gao, Y.; Li, D. Growth responses of tall fescue (Festuca arundinacea schreb.) to salinity stress. Eur. J. Hortic. Sci. 2014, 79, 123–128. [Google Scholar]
- Yamazaki, K.; Ishimori, M.; Kajiya-Kanegae, H.; Takanashi, H.; Fujimoto, M.; Yoneda, J.I.; Yano, K.; Koshiba, T.; Tanaka, R.; Iwata, H.; et al. Effect of salt tolerance on biomass production in a large population of sorghum accessions. Breed. Sci. 2020, 70, 167–175. [Google Scholar] [CrossRef] [Green Version]
- Amin, I.; Rasool, S.; Mir, M.A.; Wani, W.; Masoodi, K.Z.; Ahmad, P. Ion homeostasis for salinity tolerance in plants: A molecular approach. Physiol. Plant. 2021, 171, 578–594. [Google Scholar] [CrossRef]
- Sharavdorj, K.; Jang, Y.; Byambadorj, S.-O.; Cho, J.W. Understanding seed germination of forage crops under various salinity and temperature stress. J. Crop Sci. Biotechnol. 2021, 24, 545–554. [Google Scholar] [CrossRef]
- Sharavdorj, K.; Jang, Y.; Byambadorj, S.O.; Cho, J.W. The effect of MgSO4 and CaSO4 on seedlings of forage crops under environmental stress. Plant Physiol. Rep. 2022, 27, 702–716. [Google Scholar] [CrossRef]
- Al-Maskri, A.; Al-Kharusi, L.; Al-Miqbali, H.; Khan, M.M. Effects of salinity stress on growth of lettuce (Lactuca sativa) under closed-recycle nutrient film technique. Int. J. Agric. Biol. 2010, 12, 377–380. [Google Scholar]
- Omamt, E.N.; Hammes, P.S.; Robbertse, P.J. Differences in salinity tolerance for growth and water-use efficiency in some amaranth (Amaranthus spp.) genotypes. N. Z. J. Crop Hortic. Sci. 2006, 34, 11–22. [Google Scholar] [CrossRef]
- Hassan, A.; Fasiha Amjad, S.; Hamzah Saleem, M.; Yasmin, H.; Imran, M.; Riaz, M.; Ali, Q.; Ahmad Joyia, F.; Mobeen; Ahmed, S.; et al. Foliar application of ascorbic acid enhances salinity stress tolerance in barley (Hordeum vulgare L.) through modulation of morpho-physio-biochemical attributes, ions uptake, osmo-protectants and stress response genes expression. Saudi J. Biol. Sci. 2021, 28, 4276–4290. [Google Scholar] [CrossRef] [PubMed]
- Negrão, S.; Schmöckel, S.M.; Tester, M. Evaluating physiological responses of plants to salinity stress. Ann. Bot. 2017, 119, 1–11. [Google Scholar] [CrossRef] [Green Version]
- Rahneshan, Z.; Nasibi, F.; Moghadam, A.A. Effects of salinity stress on some growth, physiological, biochemical parameters and nutrients in two pistachio (Pistacia vera L.) rootstocks. J. Plant Interact. 2018, 13, 73–82. [Google Scholar] [CrossRef] [Green Version]
- Netondo, G.W.; Onyango, J.C.; Beck, E. Sorghum and Salinity: II. Gas Exchange and Chlorophyll Fluorescence of Sorghum under Salt Stress. Crop Sci. 2004, 44, 806–811. [Google Scholar] [CrossRef]
- Yang, Z.; Li, J.L.; Liu, L.N.; Xie, Q.; Sui, N. Photosynthetic Regulation Under Salt Stress and Salt-Tolerance Mechanism of Sweet Sorghum. Front. Plant Sci. 2020, 10, 1722. [Google Scholar] [CrossRef] [Green Version]
- Brand, J.J.; Becker, D.W. Evidence for direct roles of calcium in photosynthesis. J. Bioenerg. Biomembr. 1984, 16, 239–249. [Google Scholar] [CrossRef]
- Dolatabadian, A.; Sanavy, S.A.M.M.; Gholamhoseini, M.; Joghan, A.K.; Majdi, M.; Kashkooli, A.B. The role of calcium in improving photosynthesis and related physiological and biochemical attributes of spring wheat subjected to simulated acid rain. Physiol. Mol. Biol. Plants 2013, 19, 189–198. [Google Scholar] [CrossRef] [PubMed] [Green Version]
- Masuda, T. Recent overview of the Mg branch of the tetrapyrrole biosynthesis leading to chlorophylls. Photosynth. Res. 2008, 96, 121–143. [Google Scholar] [CrossRef] [PubMed]
- Hauer-Jákli, M.; Tränkner, M. Critical leaf magnesium thresholds and the impact of magnesium on plant growth and photo-oxidative defense: A systematic review and meta-analysis from 70 years of research. Front. Plant Sci. 2019, 10, 776. [Google Scholar] [CrossRef] [PubMed]
- Abo El-Ezz, S.F.; Lo’Ay, A.A.; Al-harbi, N.A.; Al-qahtani, S.M.; Allam, H.M.; Abdein, M.A.; Abdelgawad, Z.A. A Comparison of the Effects of Several Foliar Forms of Magnesium Fertilization on ‘Superior Seedless’ (Vitis vinifera L.) in Saline Soils. Coatings 2022, 12, 201. [Google Scholar] [CrossRef]
- Farooq, M.; Asif, S.; Jang, Y.H.; Park, J.R.; Zhao, D.D.; Kim, E.G.; Kim, K.M. Effect of Different Salts on Nutrients Uptake, Gene Expression, Antioxidant, and Growth Pattern of Selected Rice Genotypes. Front. Plant Sci. 2022, 13, 895282. [Google Scholar] [CrossRef]
- Laohavisit, A.; Richards, S.L.; Shabala, L.; Chen, C.; Colaço, R.D.D.R.; Swarbreck, S.M.; Shaw, E.; Dark, A.; Shabala, S.; Shang, Z.; et al. Salinity-induced calcium signaling and root adaptation in arabidopsis require the calcium regulatory protein annexin1. Plant Physiol. 2013, 163, 253–262. [Google Scholar] [CrossRef] [Green Version]
- Wissuwa, M. How Do Plants Achieve Tolerance to Phosphorus Deficiency? Small Causes with Big Effects. Plant Physiol. 2003, 133, 1947–1958. [Google Scholar] [CrossRef] [Green Version]
- Tang, H.; Niu, L.; Wei, J.; Chen, X.; Chen, Y. Phosphorus limitation improved salt tolerance in maize through tissue mass density increase, osmolytes accumulation, and Na+ uptake inhibition. Front. Plant Sci. 2019, 10, 856. [Google Scholar] [CrossRef] [Green Version]
- Davis, M.R. The comparative phosphorus requirements of some temperate perennial legumes. Plant Soil 1991, 133, 17–30. [Google Scholar] [CrossRef]
- Anshori, M.F.; Purwoko, B.S.; Dewi, I.S.; Suwarno, W.B.; Ardie, S.W. Cluster heatmap for detection of good tolerance trait on doubled-haploid rice lines under hydroponic salinity screening. IOP Conf. Ser. Earth Environ. Sci. 2020, 484, 012001. [Google Scholar] [CrossRef]
- Hu, Y.; Kang, S.; Ding, R.; Zhao, Q. A crude protein and fiber model of alfalfa incorporating growth age under water and salt stress. Agric. Water Manag. 2021, 255, 107037. [Google Scholar] [CrossRef]
- Wang, J.; Baerenklau, K.A. Crop response functions integrating water, nitrogen, and salinity. Agric. Water Manag. 2014, 139, 17–30. [Google Scholar] [CrossRef]
- Fariaszewska, A.; Aper, J.; Van Huylenbroeck, J.; Baert, J.; De Riek, J.; Staniak, M.; Pecio, Ł. Mild Drought Stress-Induced Changes in Yield, Physiological Processes and Chemical Composition in Festuca, Lolium and Festulolium. J. Agron. Crop Sci. 2017, 203, 103–116. [Google Scholar] [CrossRef]
- Robinson, P.H.; Grattan, S.R.; Getachew, G.; Grieve, C.M.; Poss, J.A.; Suarez, D.L.; Benes, S.E. Biomass accumulation and potential nutritive value of some forages irrigated with saline-sodic drainage water. Anim. Feed. Sci. Technol. 2004, 111, 175–189. [Google Scholar] [CrossRef]
- APERA Instruments. PH8500-SL Portable pH Meter for Soil. Available online: https://aperainst.com/apera-instruments-ai3211-ph8500-sl-portable-ph-meter-tester-for-soil-direct-measurement-equipped-with-labsen-553-electrode-plastic-lead-free-glass (accessed on 10 November 2021).
- Garnier, E.; Shipley, B.; Roumet, C.; Laurent, G. A standardized protocol for the determination of specific leaf area and leaf dry matter content. Funct. Ecol. 2001, 15, 688–695. [Google Scholar] [CrossRef]
- Pereira, S.; Singh, S.; Oliveira, R.S.; Ferreira, L.; Rosa, E.; Marques, G. Co-inoculation with rhizobia and mycorrhizal fungi increases yield and crude protein content of cowpea (Vigna unguiculata (L.) Walp.) under drought stress. Landbauforschung 2020, 70, 56–65. [Google Scholar] [CrossRef]
- Van Soest, P.J.; Robertson, J.B.; Lewis, B.A. Methods for Dietary Fiber, Neutral Detergent Fiber, and Nonstarch Polysaccharides in Relation to Animal Nutrition. J. Dairy Sci. 1991, 74, 3583–3597. [Google Scholar] [CrossRef]
- SAS Software, Version 9.4; SAS Institute Inc.: Cary, NC, USA, 2014.


| Measurements | Species | Treatments | Species × Treatments | ||||||
|---|---|---|---|---|---|---|---|---|---|
| D | F | p Value | D | F | p Value | D | F | p Value | |
| Total Biomass | 1 | 15.32 | <0.0004 | 5 | 0.81 | 0.4948 | 5 | 0.37 | 0.9457 |
| Aboveground biomass | 1 | 0.61 | 0.4386 | 5 | 3.92 | 0.0061 | 5 | 2.21 | 0.0746 |
| Belowground biomass | 1 | 26.85 | <0.0001 | 5 | 2.67 | 0.0377 | 5 | 2.03 | 0.0977 |
| Height | 1 | 206.03 | <0.0001 | 5 | 14.16 | <0.0001 | 5 | 8.58 | <0.0001 |
| Root length | 1 | 12.88 | 0.0010 | 5 | 7.42 | <0.0001 | 5 | 5.60 | 0.0006 |
| Specific leaf area | 1 | 169.44 | <0.0001 | 5 | 1.23 | 0.3168 | 5 | 3.48 | 0.0115 |
| SPAD | 1 | 124.93 | <0.0001 | 5 | 2.86 | 0.0435 | 5 | 3.24 | 0.0027 |
| Species | Date | Treatments | ||||||
|---|---|---|---|---|---|---|---|---|
| CON | NaCl | 1 MS | 2 MS | 7.5 CS | 10 CS | |||
| T. pratense | 60 DAT | CP | 15.61 c | 16.96 b | 16.64 bc | 16.01 bc | 18.22 a | 15.84 c |
| NDF | 36.27 a | 30.31 b | 31.1 b | 34.39 a | 32.33 b | 31.1 b | ||
| ADF | 28.71 a | 20.85 c | 23.51 b | 22.31 b | 20.65 c | 18.05 d | ||
| 120 DAT | CP | 15.22 a | 15.09 ab | 15.83 a | 14.42 b | 15.74 a | 15.14 ab | |
| NDF | 44.03 a | 40.6 b | 40.51 b | 35.93 c | 43.57 a | 42.24 ab | ||
| ADF | 36.63 a | 29.17 c | 31.98 b | 25.64 d | 32.25 b | 29.49 c | ||
| F. arundinacea | 60 DAT | CP | 17.6 c | 20.38 a | 19.13 b | 18.45 bc | 19.13 b | 17.84 c |
| NDF | 62.62 bc | 65.68 ab | 67.39 a | 59.07 c | 60.08 c | 50.9 d | ||
| ADF | 28.45 a | 27.23 ab | 28.36 a | 26.21 b | 26.63 ab | 26.01 b | ||
| 120 DAT | CP | 12.37 c | 15.1 a | 14.01 b | 13.64 b | 12.5 c | 15.46 a | |
| NDF | 61.37 bc | 61.82 bc | 58.6 c | 60.98 bc | 64.15 b | 67.93 a | ||
| ADF | 29.53 a | 27.33 b | 29.01 ab | 27.65 ab | 27.88 ab | 28.91 ab | ||
| Species | Date | Treatments | pH | EC (ds/m) | Salt (ppt) |
|---|---|---|---|---|---|
| T. pratense | 60 DAT | CON | 7.36 | 0.036 | 0.02 |
| NaCl | 8.46 | 0.156 | 0.7 | ||
| 1 MS | 8.02 | 0.224 | 0.11 | ||
| 2 MS | 8.24 | 0.193 | 0.09 | ||
| 7.5 CS | 8.44 | 0.105 | 0.05 | ||
| 10 CS | 7.65 | 0.46 | 0.21 | ||
| 120 DAT | CON | 7.9 | 0.024 | 0.01 | |
| NaCl | 8.5 | 0.929 | 0.44 | ||
| 1 MS | 7.52 | 0.559 | 0.26 | ||
| 2 MS | 7.9 | 0.441 | 0.2 | ||
| 7.5 CS | 7.5 | 0.291 | 0.13 | ||
| 10 CS | 7.65 | 0.522 | 0.15 | ||
| F. arundinacea | 60 DAT | CON | 5.28 | 0.029 | 0.04 |
| NaCl | 8.37 | 0.211 | 0.1 | ||
| 1 MS | 7.7 | 0.181 | 0.09 | ||
| 2 MS | 7.73 | 0.173 | 0.05 | ||
| 7.5 CS | 7.66 | 0.29 | 0.15 | ||
| 10 CS | 8.06 | 0.104 | 0.05 | ||
| 120 DAT | CON | 5.79 | 0.025 | 0.05 | |
| NaCl | 7.34 | 0.057 | 0.27 | ||
| 1 MS | 7.29 | 0.03 | 0.02 | ||
| 2 MS | 7.57 | 0.064 | 0.29 | ||
| 7.5 CS | 7.22 | 0.061 | 0.29 | ||
| 10 CS | 8.14 | 0.19 | 0.09 |
Publisher’s Note: MDPI stays neutral with regard to jurisdictional claims in published maps and institutional affiliations. |
© 2022 by the authors. Licensee MDPI, Basel, Switzerland. This article is an open access article distributed under the terms and conditions of the Creative Commons Attribution (CC BY) license (https://creativecommons.org/licenses/by/4.0/).
Share and Cite
Sharavdorj, K.; Byambadorj, S.-O.; Jang, Y.; Cho, J.-W. Application of Magnesium and Calcium Sulfate on Growth and Physiology of Forage Crops under Long-Term Salinity Stress. Plants 2022, 11, 3576. https://doi.org/10.3390/plants11243576
Sharavdorj K, Byambadorj S-O, Jang Y, Cho J-W. Application of Magnesium and Calcium Sulfate on Growth and Physiology of Forage Crops under Long-Term Salinity Stress. Plants. 2022; 11(24):3576. https://doi.org/10.3390/plants11243576
Chicago/Turabian StyleSharavdorj, Khulan, Ser-Oddamba Byambadorj, Yeongmi Jang, and Jin-Woong Cho. 2022. "Application of Magnesium and Calcium Sulfate on Growth and Physiology of Forage Crops under Long-Term Salinity Stress" Plants 11, no. 24: 3576. https://doi.org/10.3390/plants11243576