Article

Transcriptome Analysis of Genes Involved in Fatty Acid and Lipid Biosynthesis in Developing Walnut (Juglans regia L.) Seed Kernels from Qinghai Plateau

Academy of Agriculture and Forestry Sciences, Qinghai University, Xining 810016, China
*
Author to whom correspondence should be addressed.
Plants 2022, 11(23), 3207; https://doi.org/10.3390/plants11233207
Submission received: 8 August 2022 / Revised: 13 November 2022 / Accepted: 20 November 2022 / Published: 23 November 2022
(This article belongs to the Section Plant Molecular Biology)

Abstract

:
Walnut (Juglans regia) is an important woody oil-bearing plant with high nutritional value. For better understanding of the underlying molecular mechanisms of its oil accumulation in the Qinghai Plateau, in this study we monitored walnut fruit development, and 15 cDNA libraries were constructed from walnut seed kernels collected at 72, 79, 93, 118 and 135 days after flowering (DAF). The candidate genes were identified using sequencing and expression analysis. The results showed that the oil content in the kernels increased dramatically in late July and reached the maximum value of 69% in mature seed. More than 90% of the oils were unsaturated fatty acids (UFAs) and linoleic acid (18:2) was the predominant UFA accumulated in mature seed. Differentially expressed genes (DEGs) in 15 KEGG pathways of lipid metabolism were detected. We identified 119 DEGs related to FA de novo biosynthesis (38 DEGs), FA elongation and desaturation (39 DEGs), triacylglycerol (TAG) assembly (24 DEGs), oil bodies (12 DEGs), and transcription factors (TFs, 6 DEGs). The abundantly expressed oleosins, caleosins and steroleosins may be important for timely energy reserve in oil bodies. Weighted gene coexpression network analysis (WGCNA) showed that AP2/ERF and bHLH were the key TFs, and were co-expressed with ACC1, α-CT, BCCP, MAT, KASII, LACS, FATA, and PDCT. Our transcriptome data will enrich public databases and provide new insights into functional genes related to the seed kernel lipid metabolism and oil accumulation in J. regia.

1. Introduction

Walnut (Juglans regia L.), as an important woody oil plant, is widely cultivated in many regions around the world. Walnut is rich in several beneficial compounds, e.g., unsaturated fatty acids (UFAs), proteins, minerals, and tocopherols [1], and therefore it has gained tremendous interest due to its nutritional and medicinal benefits [2]. Beneficial effects of walnut consumption have been reported, including anti-atherogenic, anti-inflammatory, antimutagenic, and anticancer effects [3], and protection from diabetes [4,5] or cardiovascular diseases [6]. A mature walnut kernel contains a high oil content, which can vary from 52% to 72% [7,8,9]. The application of vegetable oils is determined by FA composition, which is one of the most important characteristics of vegetable oil quality and which determines the suitability of a vegetable oil for nutrition [2].
Walnut kernels are rich in polyunsaturated fatty acids (PUFAs), which are essential dietary FAs [8]. The FA composition and content of walnut oils in different countries and regions have been reported [2,7,8,9,10]. It has been found that even though walnuts from different areas have the same FA composition, the relative content of each component varies in different production areas [10]. Linoleic acid (LA, 18:2, range 42.5–76%) is the major FA of walnut oil, followed by oleic acid (OA, 18:1, 9–39.2%), linolenic acid (ALA, 18:3, 2–19.2%), palmitic acid (PA, 16:0, 2.9–11.4%) and stearic acid (SA, 18:0, 0.6–2.5%) [8,9,11,12,13,14,15,16]. Walnut species and varieties may affect the FA composition [17]. Environmental factors affect plant growth, development and quality [18]. The growth period of plants is affected by the environment, e.g., with increases in altitude, the plant growth period becomes shorter. It is generally believed that the increase of altitude is conducive to the accumulation of fruit oil content [19,20]. Previous studies report that FA composition and content are affected by growth environments. The responses of different plants to their environment regarding FA content are different [16,19,21,22]. Greve et al. [23] reported that environment, nut maturity, and interactions contribute significantly to variations in PUFA content in walnuts. Gao et al. [15] found that the planting environment was the main factor that affected the composition and content of FAs in walnut oil. The geographical environment also exerts an important influence on the triacylglycerol (TAG) composition and content.
Plant oils, mainly in the form of TAGs, primarily accumulate in seeds and fruits [24]. In plants, the seed oil synthesis process includes de novo FA synthesis and TAG assembly in multiple subcellular organelles [25]. The oil quantity and quality (i.e., FA composition) are controlled and regulated by a series of enzymes that take part in the biosynthesis of all lipids. Recently, new multi-omics technologies, including transcriptomics and metabolomics, have been used to analyze the complex biosynthesis pathway of oils in walnut kernels. Yan et al. [26] found that TGs (18:2/18:2/18:3) and diacylglycerols (DG) (18:2/18:3) were the main glycerolipids, and mapped the main lipid metabolism pathways in walnut. It has been reported that ACCase, LACS, and acyl-lipid omega-3 desaturase (omega-3 fatty acid desaturase, FAD7) are the key genes related to oil synthesis [27]. A total of 104 key genes associated with walnut oil accumulation were obtained from “Xiangling” walnut kernels at three stages. The phospholipid diacylglycerol acyltransferase (PDAT) metabolic pathway may be more conducive to the accumulation of walnut oil. Zhao et al. [28] constructed 16 miRNA–mRNA regulatory modules involved in walnut oil accumulation and FA synthesis. Furthermore, eight known miRNAs and nine novel miRNAs regulate 28 genes related to FA metabolism and lipid synthesis. Huang et al. [29] identified 108 unigenes associated with lipid biosynthesis from RNA sequencing (RNA-Seq) data, and stearoyl-ACP desaturase (SAD), delta-12 desaturase (omega-6 desaturase, FAD2), and omega-3 desaturase (delta-15 desaturase, FAD3) were abundantly expressed in the walnut embryo stage. High expression of FAD2 and FAD3 is the possible reason for rich PUFAs. A subcellular localization analysis suggested that 18:3 was mainly synthesized in the endoplasmic reticulum (ER) [29]. However, the high contents of oil and PUFAs in walnuts have still not been addressed.
Due to the higher altitude and lower temperatures, the phenological stage of walnuts in the Qinghai Plateau begins later than the lower altitude regions. The synthesis and accumulation of oil is completed in a relatively short time, and the characteristics of gene expression in oil synthesis pathways during seed development are not clear. In this study, the morphological development and changes in fruits, oil content and the transcriptome of walnut seed kernels from the Qinghai Plateau were analyzed to discover the key genes involved in lipid biosynthesis and to dissect the molecular mechanisms of oil accumulation during walnut fruit development. The annotated transcriptome sequences and gene expression profiles provide useful information for the identification of key genes involved in the biosynthesis pathways of lipids and for research on the mechanisms of oil accumulation in walnut kernels.

2. Results

2.1. Morphological Characteristics and Oil Accumulation during J. regia Embryo Development

White cotyledons formed and had clear boundaries with the pericarp (Figure 1A, G1). The walnut shell hardened gradually from the top (G1–G2), and various nutrients such as fat were synthesized and accumulated until the ripening of the fruit. The endocarp was completely lignified at the G4 stage, and the pericarp of the fully mature fruit was readily separated from the seed kernel (G5) (Figure 1A). We began harvesting the walnut fruits on 11 September.
Single fresh fruit weight rapidly increased from 51.983 g to 59.375 g (from 12 July to 9 August), then slowly increased to 61.479 g (3 September), and then slightly decreased from 61.479 g to 59.121 g (from 11 September to 20 September). Single nut weight and single walnut kernel weight showed slow upward trends from 3.63 g to 12.11 g, and 0.72 g to 5.43 g, respectively (Figure 1B, Table S1).
The vertical diameter of walnut fruit slowly increased to 50.73 mm and then decreased to 50.33 mm in the last period; the fruit transverse diameter slowly increased to 45.69 mm and then decreased to 45.52 mm in the last period (Figure 1C, Table S1).
The total oil content of the walnut kernel samples from 10 time points was calculated (Figure 1D, Table S1). The total oil content continuously increased from 20.20% to 69.17% from 12 July to 11 September, and then slightly decreased to 68.43% on 20 September. The total oil content sharply increased from 19 July (24.10%) to 5 August (51.25%), and then showed a slowly rising trend. The maximum oil increase in the walnut kernels appeared between 79 days after flowering (DAF, G2) and 89 DAF (Figure 1D). The mature walnut seed oil content was more than 69% of the total composition of the walnut seed. According to the embryo morphology development and the oil content, seed kernels at the G1–G5 stages were chosen for RNA-seq analysis.
The FA composition and content of walnut oil in the mature walnut seed kernels were analyzed (Table 1), and a total of 16 FAs were detected and measured. There were five kinds of main FAs in the mature walnut seeds: 16:0, 18:0, 18:1, 18:2 and 18:3. The total content of these FAs accounted for more than 99% of the total FAs, while the content of other FAs was lower. The two predominant compositions of saturated fatty acids (SFAs) in mature seeds were 16:0 (6.41 %) and 18:0 (2.04 %), which were maintained at low levels, while the main UFAs were 18:2, 18:1 and 18:3. The total content of the three UFAs accounted for more than 90% of the total FAs. PUFAs were the major FAs, accounting for more than 70%. A proportion of 57.67% of the total FAs was 18:2, and this was the primary fatty acid in walnut oil.

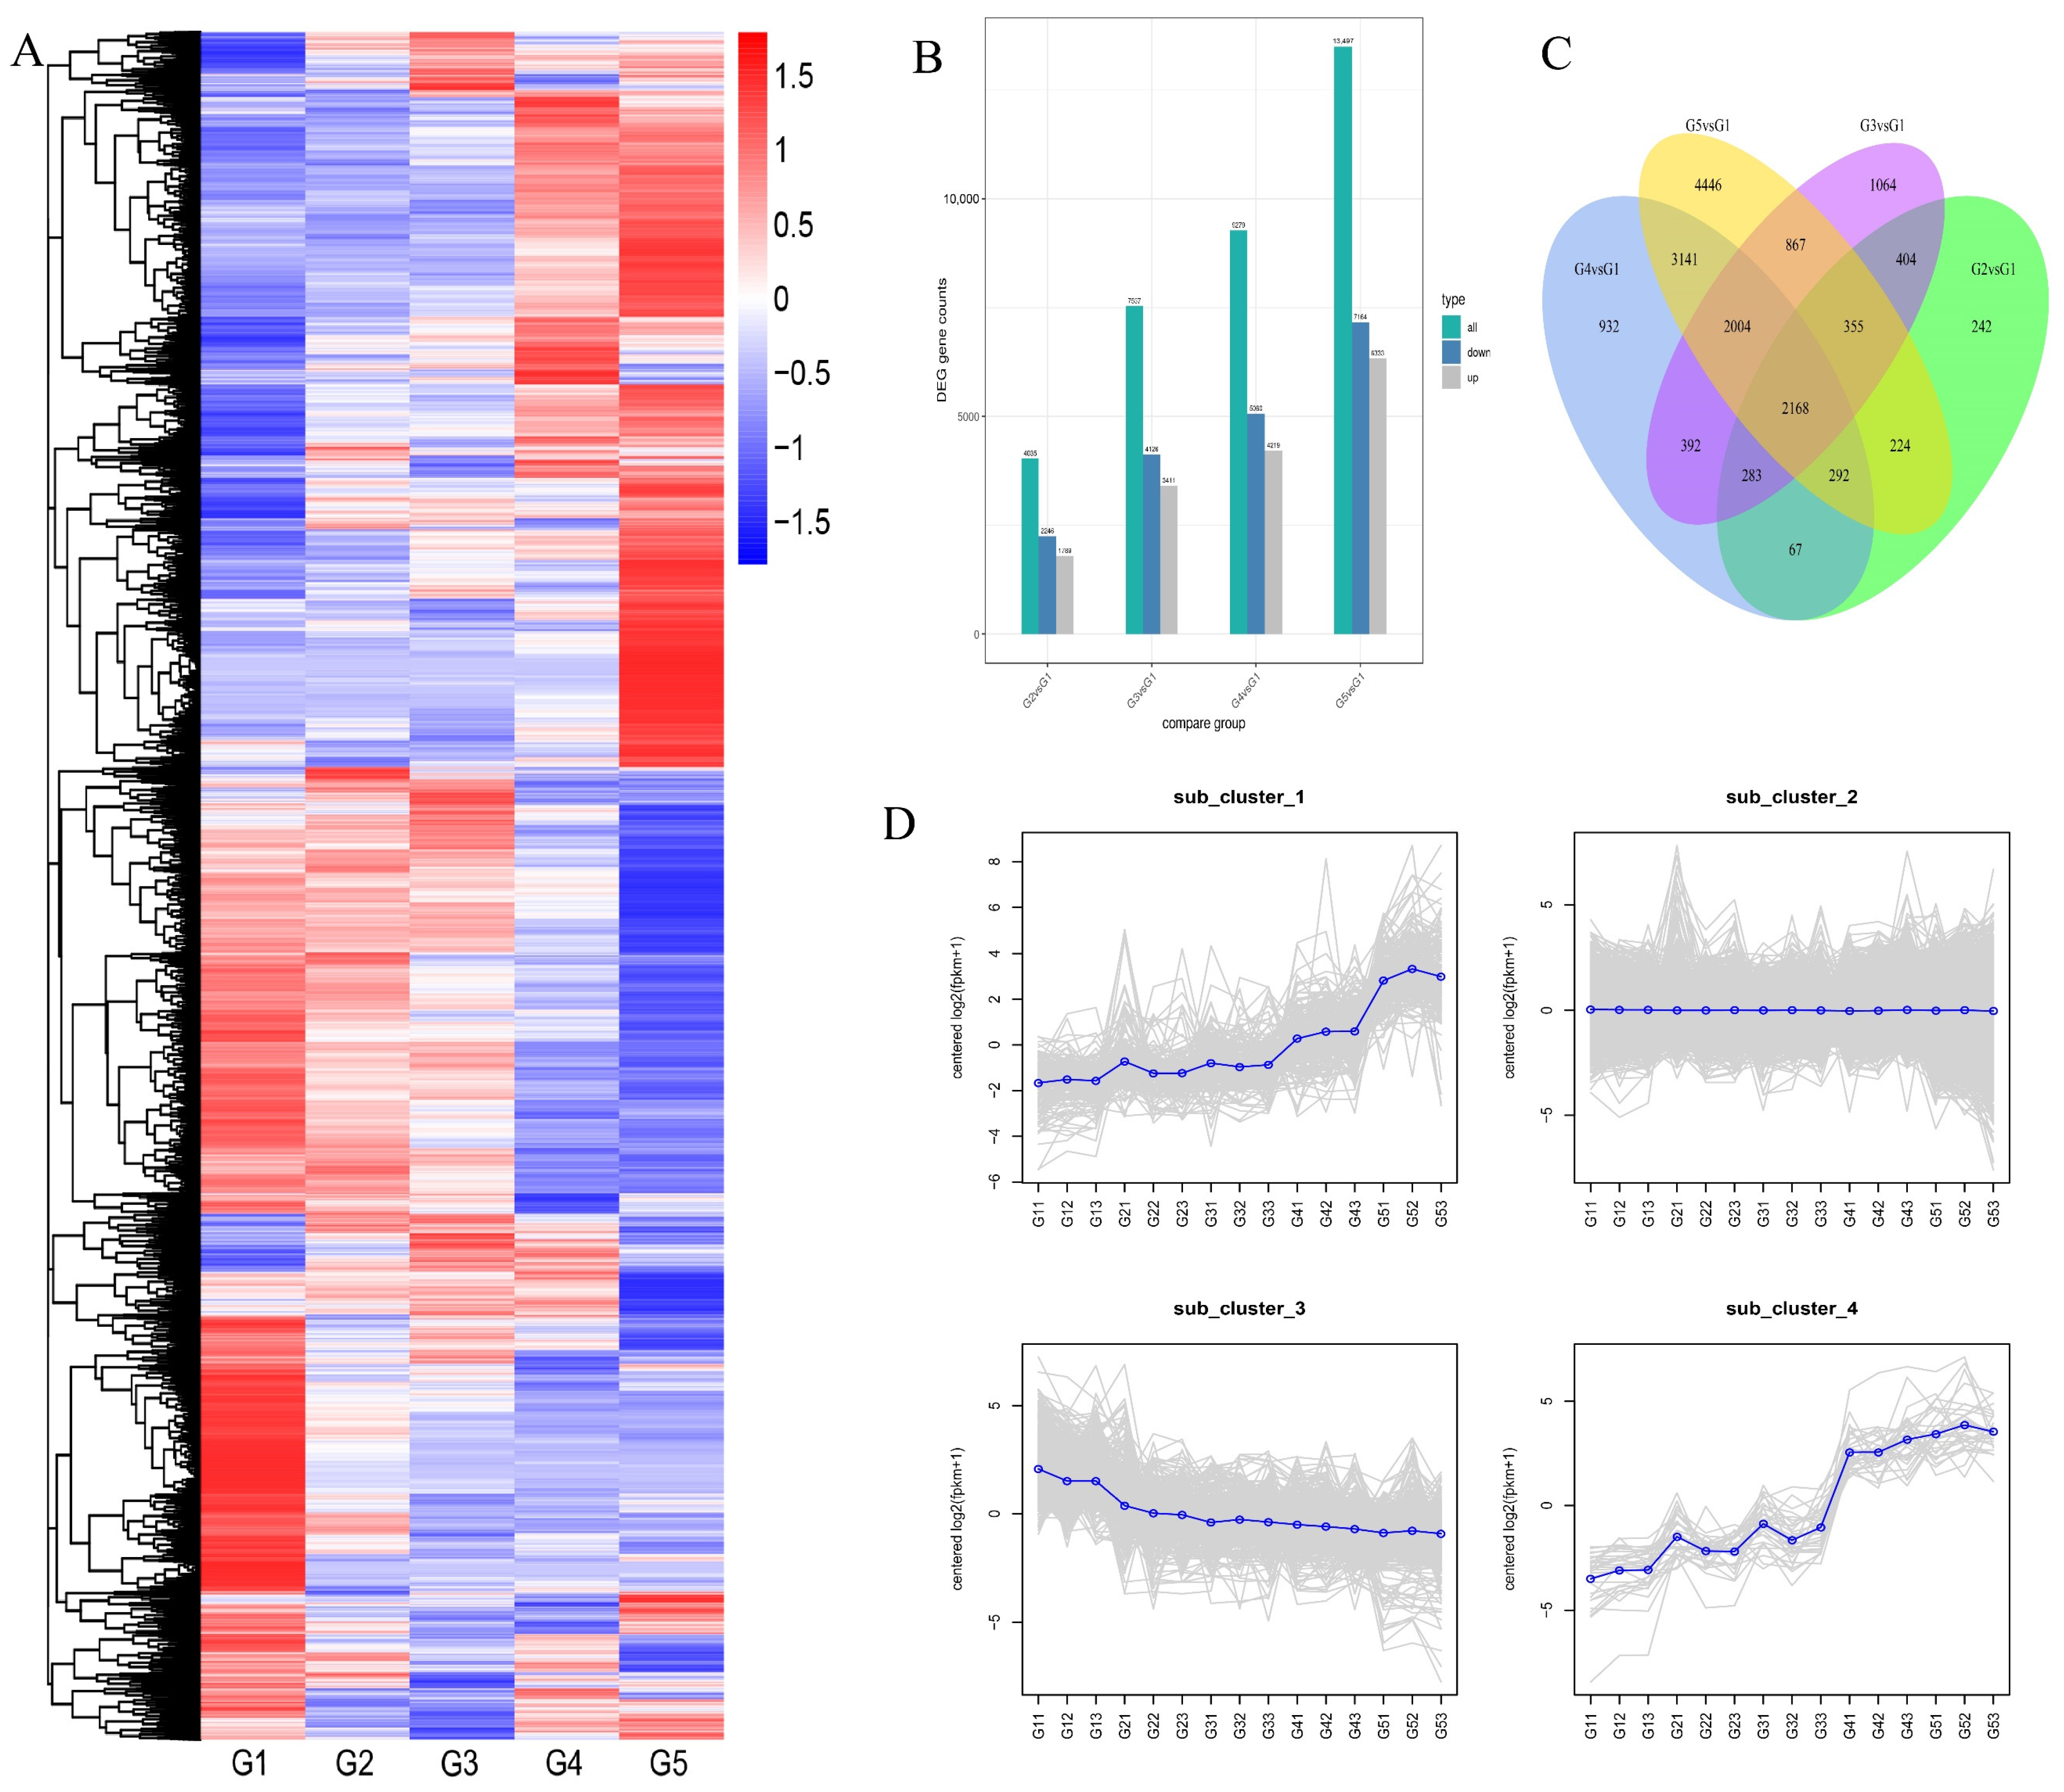
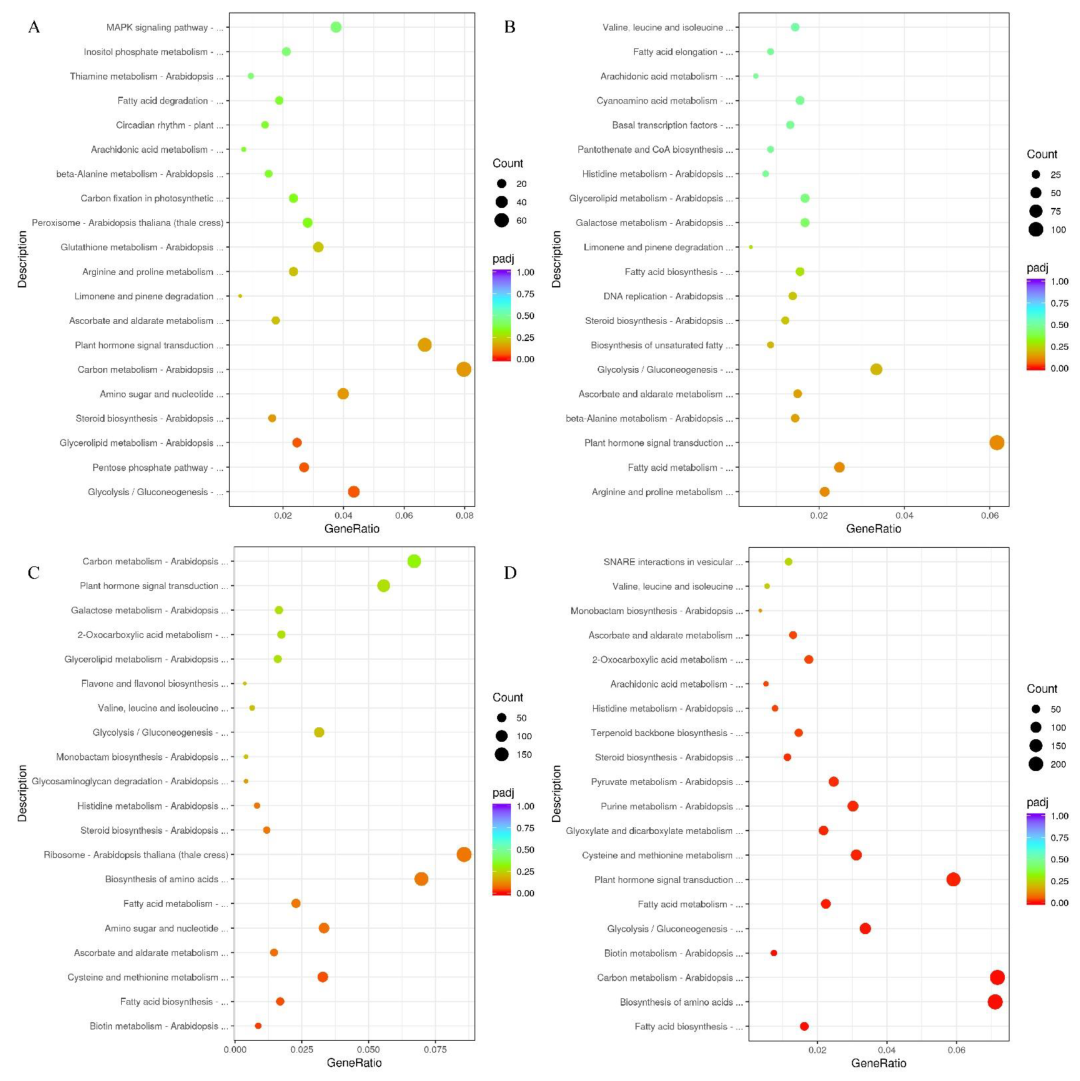
2.2. Identification of DEGs and Enrichment Analysis during Seed Development

A total of 709,394,820 raw reads were obtained from 15 sequencing libraries and 103.82 G clean bases were obtained after quality control. All of the clean reads were mapped to the walnut genome sequence; the average total map rate was 97.55% and the proportion of the total map rate ranged from 97.09% to 98.06%. The mapping results of each sample are shown in Table S2. The average reads number mapped to the exon region of the genome was 6,441,750,032 and the average proportion mapped to the exon region of the genome was 95.606%. The mapping results of each sample are shown in Table S3. Over 92% of sequences aligned to the reference genome located in the exon regions. The percentage of the sequences located in intergenic regions ranged from 1.35% to 4.27%; a small proportion of sequences were located in intron regions (Figure S1).
Raw data of all raw reads are available in the NCBI SRA database with the accession number PRJNA781571.
The gene expression levels of all samples from five fruit development stages were qualified and compared, and the DEGs were detected. The clustering heatmaps of all DEGs were analyzed (Figure 2A). The numbers of DEGs identified in samples from different developmental stages can be seen in Figure 2B. It is interesting that the numbers of DEGs increased with the walnut seed development. A total of 4035 DEGs were found in G1 vs. G2, including 1789 upregulated genes and 2246 downregulated genes. A total of 7537 DEGs were found in G3 vs. G1, including 3411 upregulated genes and 4126 down-regulated genes; 9279 DEGs were found in G4 vs. G1, including 4219 upregulated genes and 5060 downregulated genes. The most DEGs were found in G5 vs. G1, including 6333 upregulated genes and 7164 downregulated genes. A Venn diagram of DEGs was drawn, and a total of 2168 genes were expressed in all five stages (Figure 2C). To analyze the gene expression pattern, clustering analysis was performed, and all the genes were clustered into four major patterns (Figure 2D).
GO (Gene Ontology) annotation classed all the DEGs. The intracellular organelle parts and organelle parts were the top two terms in G2 and G1, followed by cytoskeletal protein binding, tubulin binding, microtubule binding, microtubule-based process, motor activity, microtubule motor activity, microtubule-based movement, and movement of cell or subcellular component (Figure S2A). Molecular function regulator and cytoskeletal protein binding were the top two terms in G3 and G1, followed by enzyme regulator activity, tubulin binding, motor activity and microtubule binding (Figure S2B). Ribonucleoprotein complex, ribosome, carboxylic acid metabolic process, oxoacid metabolic process and organic acid metabolic processes were the top five terms in G4 and G1 (Figure S2C). Cytoskeletal protein binding, carboxylic acid biosynthetic process, and organic acid biosynthetic process were the top three terms in G5 and G1, followed by tubulin binding, microtubule binding, and pyridoxal phosphate binding (Figure S2D).
KEGG (Kyoto Encyclopedia of Genes and Genomes) annotation classed all the DEGs to the pathways, and the top 20 DEGs of the pathways were analyzed (Figure 3). Carbon metabolism (ath01200) was the top pathway that DEGs enriched, followed by plant hormone signal transduction pathway (Ko04075) in G2 and G1 (Figure 3A). Plant hormone signal transduction pathway (Ko04075) was the most enriched pathway in G3 and G1, followed by glycolysis/gluconeogenesis (ath00010) (Figure 3B). Ribosome (ath03010) was the top pathway that DEGs enriched, followed by biosynthesis of amino acid pathway (ath01230) and carbon metabolism in G4 and G1 (Figure 3C). For G5 and G1, the carbon metabolism pathway and biosynthesis of amino acid pathway were the top two pathways, followed by the plant hormone signal transduction pathway (Ko04075) (Figure 3D). There are a few pathways involved in FA biosynthesis and lipid metabolism shown in the figure. A total of 15 pathways of these involved DEGs were annotated to lipid metabolism in our work (Figure S3, Table 2).

2.3. Analysis of DEGs for Lipid Metabolism

In addition, the 15 lipid metabolism pathways, including ‘Fatty acid biosynthesis’ (ko00061), ‘Fatty acid elongation’ (ko00062), ‘Steroid biosynthesis’ (Ko00100), ‘Glycerolipid metabolism’ (ko00561), ‘Glycerophospholipid metabolism’ (Ko00564), ‘Arachidonic acid metabolism’ (ko00590), ‘alpha-Linolenic acid metabolism’ (ko00592), ‘Biosynthesis of unsaturated fatty acids’ (ko01040), ‘Fatty acid degradation’ (ko00071), ‘Linoleic acid metabolism’ (ko00591), ‘Sphingolipid metabolism’ (ko00600), ‘Cutin, suberine and wax biosynthesis’ (ko00073), ‘Ether lipid metabolism’ (ko00565), ‘Synthesis and degradation of ketone bodies’ (ko00072) and ‘Fatty acid metabolism’ (ko01212) were selected, to identify and analyze the DEGs. The number of these DEGs in the 15 pathways mentioned above increased with the seed development. In these pathways, there were more downregulated genes than upregulated genes in all comparisons, and the number of DEGs in G5 vs. G1 was the largest. There were 69, 60, 50 and 44 genes involved in fatty acid metabolism, glycerophospholipid metabolism, fatty acid biosynthesis, and glycerolipid metabolism, respectively (Table 2).

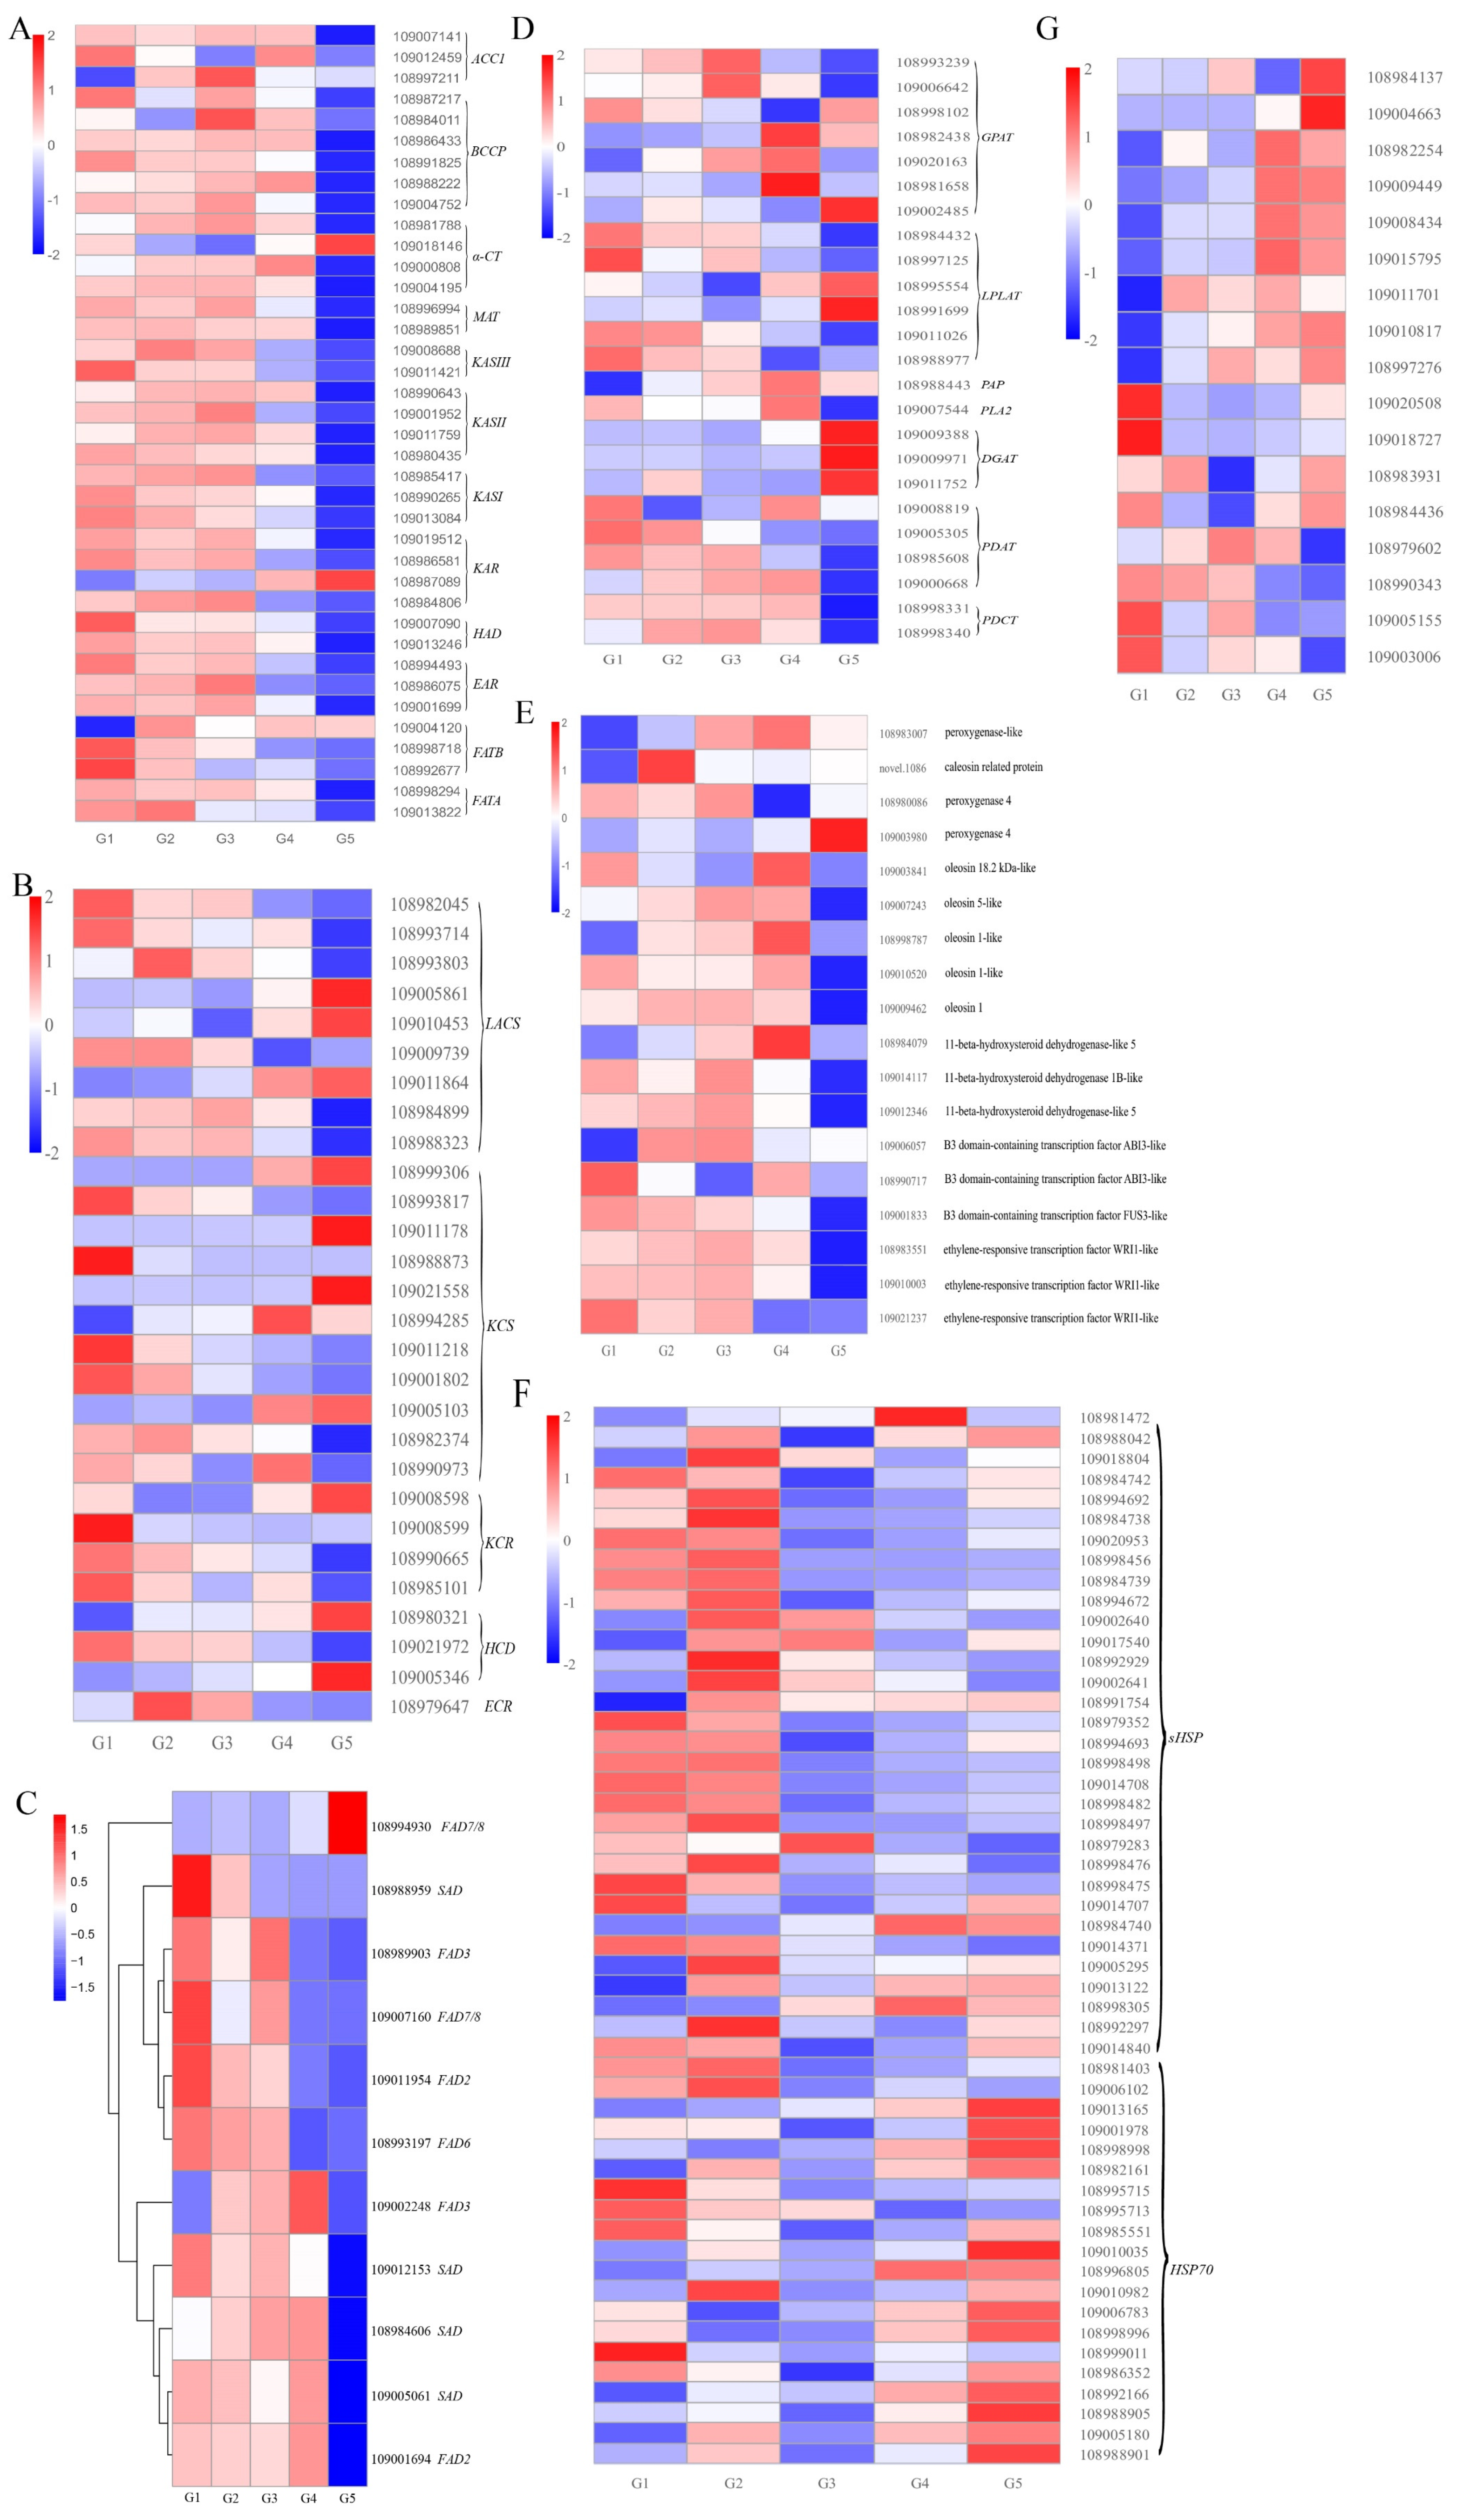
2.4. Identification and Expression Profiling of DEGs for Fatty Acid Biosynthesis, Elongation, and Desaturation

In this study, we focused on the key genes associated with lipid synthesis and oil accumulation. Based on the gene annotation for the transcriptome of the five developmental walnut seeds, DEGs related to FA biosynthesis, FA elongation, biosynthesis of UFAs, TAG biosynthesis, oil body and transcription factors (TFs) were screened to further investigate their expression patterns during walnut seed development (Figure 4).
Acetyl-CoA carboxylase (ACCase) catalyzes the first step of the FA biosynthesis pathway in the plastids. Acetyl-CoA conversion to malonyl-CoA is catalyzed by ACCase that consists of four subunits, including biotin carboxylase (BC), carboxyl transferase subunit alpha (α-CT), carboxyl transferase subunit beta (β-CT) and biotin carboxyl carrier protein (BCCP). A total of 13 DEGs encoding ACCase and its subunits, including three ACC1, six BCCP, and four α-CT, were found in this research. Our analysis revealed that ACC1 (109007141), BCCP (108991825, 108988222) and α-CT (109000808) were the dominant ones because their transcriptional levels were maintained at high levels (KPFM > 80) from G3 to G4, and then reduced afterwards at the G5 stage. This may promote rapid increases in oil content during this stage. The transcriptional levels of six BCCP repeats were similar, and were high at the G1–G4 stage and lower at the G5 stage.
Among the four α-CT, three α-CTs (108981788, 109000808 and 109004195) showed a similar pattern which was upregulated continuously from the G1 to G4 stage, but downregulated at the G5 stage. The transcription of the other α-CT (109018146) was maintained at a low level during G1-G4, but was high at the G5 stage. Then, MAT further transfers malonly-CoA to malonly-ACP. Two DEGs was identified as MAT, were highly expressed from G1 to G4, and showed the lowest level at the G5 stage. Subsequently, six continuous condensation reactions are catalyzed by KAS, KAR, HAD and EAR. The 14:0-ACP is transformed to 16:0-ACP, after seven cycles of those reactions, 4:0-ACP is transformed to 18:0-ACP. Then, 16:0-ACP and 18:0-ACP are transformed to 16:0 and 18:0 by FATB and FATA, respectively. We identified 23 DEGs, including two KASIII, four KASII, three KASI, four KAR, two HAD, three EAR, three FATB, and two FATA (Figure 4A, Table S4). Among these DEGs, one KAR (108987089) and one FATB (109004120) showed similar transcriptional patterns, and their transcriptional levels were the lowest at G1 and higher from G2 to G5. The transcription of the other DEGs mentioned maintained high levels from G1 to G4, but had the lowest level at G5. These expression patterns provided an explanation for the continuous and rapid oil accumulation during early seed developmental stages (G1 to G4).
FAs (C ≥ 16) are transformed to long-chain acyl-CoA (C ≥ 16) by LACS and transported to the ER. Subsequently, long-chain acyl-CoA (C ≥ 16) is transformed to long-chain acyl-CoA (C + 2) by KCS, KCR, HCD/PAS2 and ECR. A total of 9, 11, 4, 3, and 1 DEGs were identified as LACS (2 LACS1, 1 LACS4, 2 LACS6, 1 LACS7, 1 LACS8, 2 LACS9), KCS (KCS1, KCS2, KCS4, 2 KCS6, KCS10, 4 KCS11, KCS12), KCR, HCD (HCD, 2 PAS2A) and ECR, respectively (Figure 4B, Table S4). Among these genes, the transcriptional levels of LACS6 (109005861, 109010453), LACS8 (109011864), HCD/PAS2 (109005346), LACS9 (108984899), KCS10 (108994285), and KCR (108990665) were high, and the first four genes reached their peak at G5. LACS9 and KCS10 had the highest expression at G3 and G4, respectively.
UFAs were the major FAs in walnut oil. The biosynthesis of UFAs through the plastid pathway or endoplasmic pathway starts with 18:0-ACP. The first pathway, the 18:0-ACP, can be desaturated to oleoyl-ACP (18:1-ACP) by SAD in the plastid, and then 18:1-ACP is dehydrogenized to linoleoyl-ACP (18:2-ACP) by delta-12 desaturase (FAD6, chloroplastic type) in the plastid. Subsequently, under the effect of delta-15 desaturase (FAD7/8, chloroplastic type), 18:2-ACP is transformed to 18:3-ACP in the plastid. In the second pathway, 18:1-ACP is hydrolyzed to free 18:1 by the FATA. Free fatty acids (16:0, 18:0, 18:1) are esterified to FA-CoA by LACS and then transported into ER [25]. Next, 18:1-CoA and lysophosphatidylcholine (LPC) are transformed to 18:1-PC by lysophosphatidylcholine acyltransferase (LPCAT), and in turn are dehydrogenated to 18:2-PC and 18:3-PC by FAD2 and FAD3 [30,31]. In this study, four, two, three, one and two DEGs were identified as SAD, FAD2, FAD3, FAD6 and FAD7/8, respectively. There were no DEGs identified as FAD5. The transcriptional levels of SAD, FAD2 and FAD3 were high, while FAD6 and FAD7/8 were less expressed in developing walnut seeds. The expression heat map showed that SAD (108984606, 109005061 and 109012153), FAD2 (109001694) and FAD3 (109002248) were grouped into one category, with high expression levels at G1−G4 and the lowest expression levels at G5 (Figure 4C, Table S4). Moreover, SAD (108984606, 109005061), FAD2 (109001694) and FAD3 (109002248) had the highest expression at G4, and FPKM had values of 1121.26, 778.72, 1675.20 and 4629.80, respectively (Table S4). The transcriptional levels of SAD (109012153) reached their peak at G1. Among the four repeats of SAD in walnut, SADs (108984606, 109005061) were remarkably transcribed (FPKM > 140), followed by SAD (109012153). The expression pattern of these genes suggested that the highly expressed SADs rapidly catalyzed the synthesis of UFAs upstream of lipid biosynthesis in the plastids, while the highly expressed FADs catalyzed the synthesis of UFAs downstream in the ER.

2.5. Identification and Expression Profiling of DEGs for TAG Assembly and Oil Accumulation

TAG assembly takes place in the ER and is synthesized by the acyl-CoA-dependent pathway (Kennedy pathway) and the acyl-CoA-independent pathway. Glycerol-3-phosphate (G3P) and acyl-CoAs are taken as primary substrates [32]. Glycerol-3-phosphate acyltransferase (GPAT), lysophospholipid acyltransferases (LPLATs), phosphatidic acid phosphatase (PAP), phospholipase A2 (PLA2), DGAT, LPCAT, PDAT and phosphatidylcholine: diacylglycerol cholinephosphotransferase (PDCT) are involved in TAG assembly. Seven, six, one, one, three, four and two DEGs were identified as GPAT, LPLAT, PAP, PLA2, DGAT, PDAT and PDCT, respectively. Among the seven GPATs, GPAT3 (109006642) exhibited higher expression levels than the other GPATs during seed development, with FPKM values ranging from 19.15 to 39.04, reaching a peak at G3 and then significantly decreasing. The expression levels of GPATs (108982438, 109020163 and 108981658) decreased significantly after attaining a peak at G4. One PAP and one PLA2 were highly expressed at G3, with FPKM values of 12.11 and 132.92, respectively, and which then decreased. LPLAT superfamily members are acyltransferases of de novo and remodeling pathways of glycerophospholipid biosynthesis. The incorporation of an acyl group from either acyl-CoAs or acylACPs into acceptors such as glycerol 3-phosphate, dihydroxyacetone phosphate was catalyzed by the proteins mentioned above. LPLATs such as LPCAT-1, lysophosphatidylethanolamine acyltransferase (LPEAT, also known as MBOAT2) are included in this superfamily [33,34,35]. The FPKM (fragments per kilobase of transcript sequence per millions base pairs sequenced) values of six LPLATs ranged from 0.73 to 124.65, of which the FPKM of LPLAT (108984432) was higher (24.82 to 124.65), while the remaining DEGs expression levels were relatively low. LPLATs (108984432, 108997125, 109011026 and 108988977) were highly expressed at G1, and the others (108995554, 108991699) were highly expressed at G5 (Figure 4D, Table S4).
The expression levels of PLA2s were high during all the developmental stages, with FPKM values from 65.72 to 132.92. The expression levels of PDCT (108998331) were maintained at a stable, high level (78.49~89.29) at G1–G4, and then significantly declined to a low level (FPKM < 9). Another PDCT was less expressed during the seed development, with FPKM values from 0.16 to 2.09. DGAT and PDAT are essential enzymes for TAG biosynthesis. In walnuts, among the three DGAT1s, the expression level of DGAT1 (109011752) was significantly higher than that of other members during seed development (FPKM > 27), while the transcription of one DGAT1 (109009971) was maintained at a low level all along (FPKM < 1). The expression levels of the three DGAT1s were most abundant at G5. The two PDATs (109000668, 109008819) exhibited higher expression levels than others during the seed development (FPKM > 12), and one PDAT (109000668) was upregulated continuously at G1–G4, then downregulated at G5. These results suggested that TAG assembly occurred during the entire seed development (G1–G5) under the synergistic effect of these genes (Figure 4D, Table S4).
Seed oils are mainly stored in the form of TAG, which is stored in oil bodies (OBs). Oleosins (OLEs), caleosins (CLOs) and steroleosins (STEs) are associated with seed OBs. Twelve DEGs (four CLO, five OLE and three STE) were identified in this work. Throughout development, the five gene homologs encoding OLE were highly expressed in the seed kernel (595 < FKPM < 7678) (Figure 4E, Table S4), and had the highest expression levels at G3 or G4. In addition, the OLE-encoding genes were more strongly upregulated than the CLO- or STE-encoding genes from G1 to G4. Among the four CLOs, CLO (10893007) exhibited higher expression levels than other CLOs (FPKM > 573), reached a peak at G4, and then declined at G5. The expression level of STE (108984079) was significantly higher than the other STEs and was expressed to the highest level at G4. TFs are important activators which modulate gene expression at the transcriptional level. Besides the lipid-related genes, six crucial TFs were differentially transcribed during the seed development, including two B3 domain-containing transcription factor ABI3 (ABI3), one B3 domain-containing transcription factor FUS3 (FUS3), and three ethylene-responsive transcription factor WRI1 (WRI1). The two ABI3s were highly expressed at G1–G5. The differentially transcribed WRI1 (109021237) maintained a relatively low level at G1–G5 (FKPM < 1). FUS3 and WRI1 (108983551, 109010003) were highly expressed at G1–G4, but declined sharply at the following stage.

2.6. Identification and Expression Profiling of DEGs of HSPs and HSFs

Because of its unique geographical location, in the Qinghai Plateau there are large temperature differences between day and night (Figure S4). Temperatures are typically lowest in the morning and reach a maximum in the afternoon. There may be a protective mechanism during seed kernel development to eliminate the impacts of large temperature differences and protect seed development and the accumulation of oil. Interestingly, differentially expressed HSPs were found in developing seeds, and they were identified as HSP70 and small HSPs (SHSPs). Many HSPs were highly expressed at G1, G2, and G5 (Figure 4F, Table S4), which may be caused by the large fluctuation of day and night temperature. In addition, 17 DEGs were identified as heat stress TFs or heat shock factors (HSFs). The transcriptional level of most of the HSFs had a relatively low level at G3 (Figure 4G, Table S4).

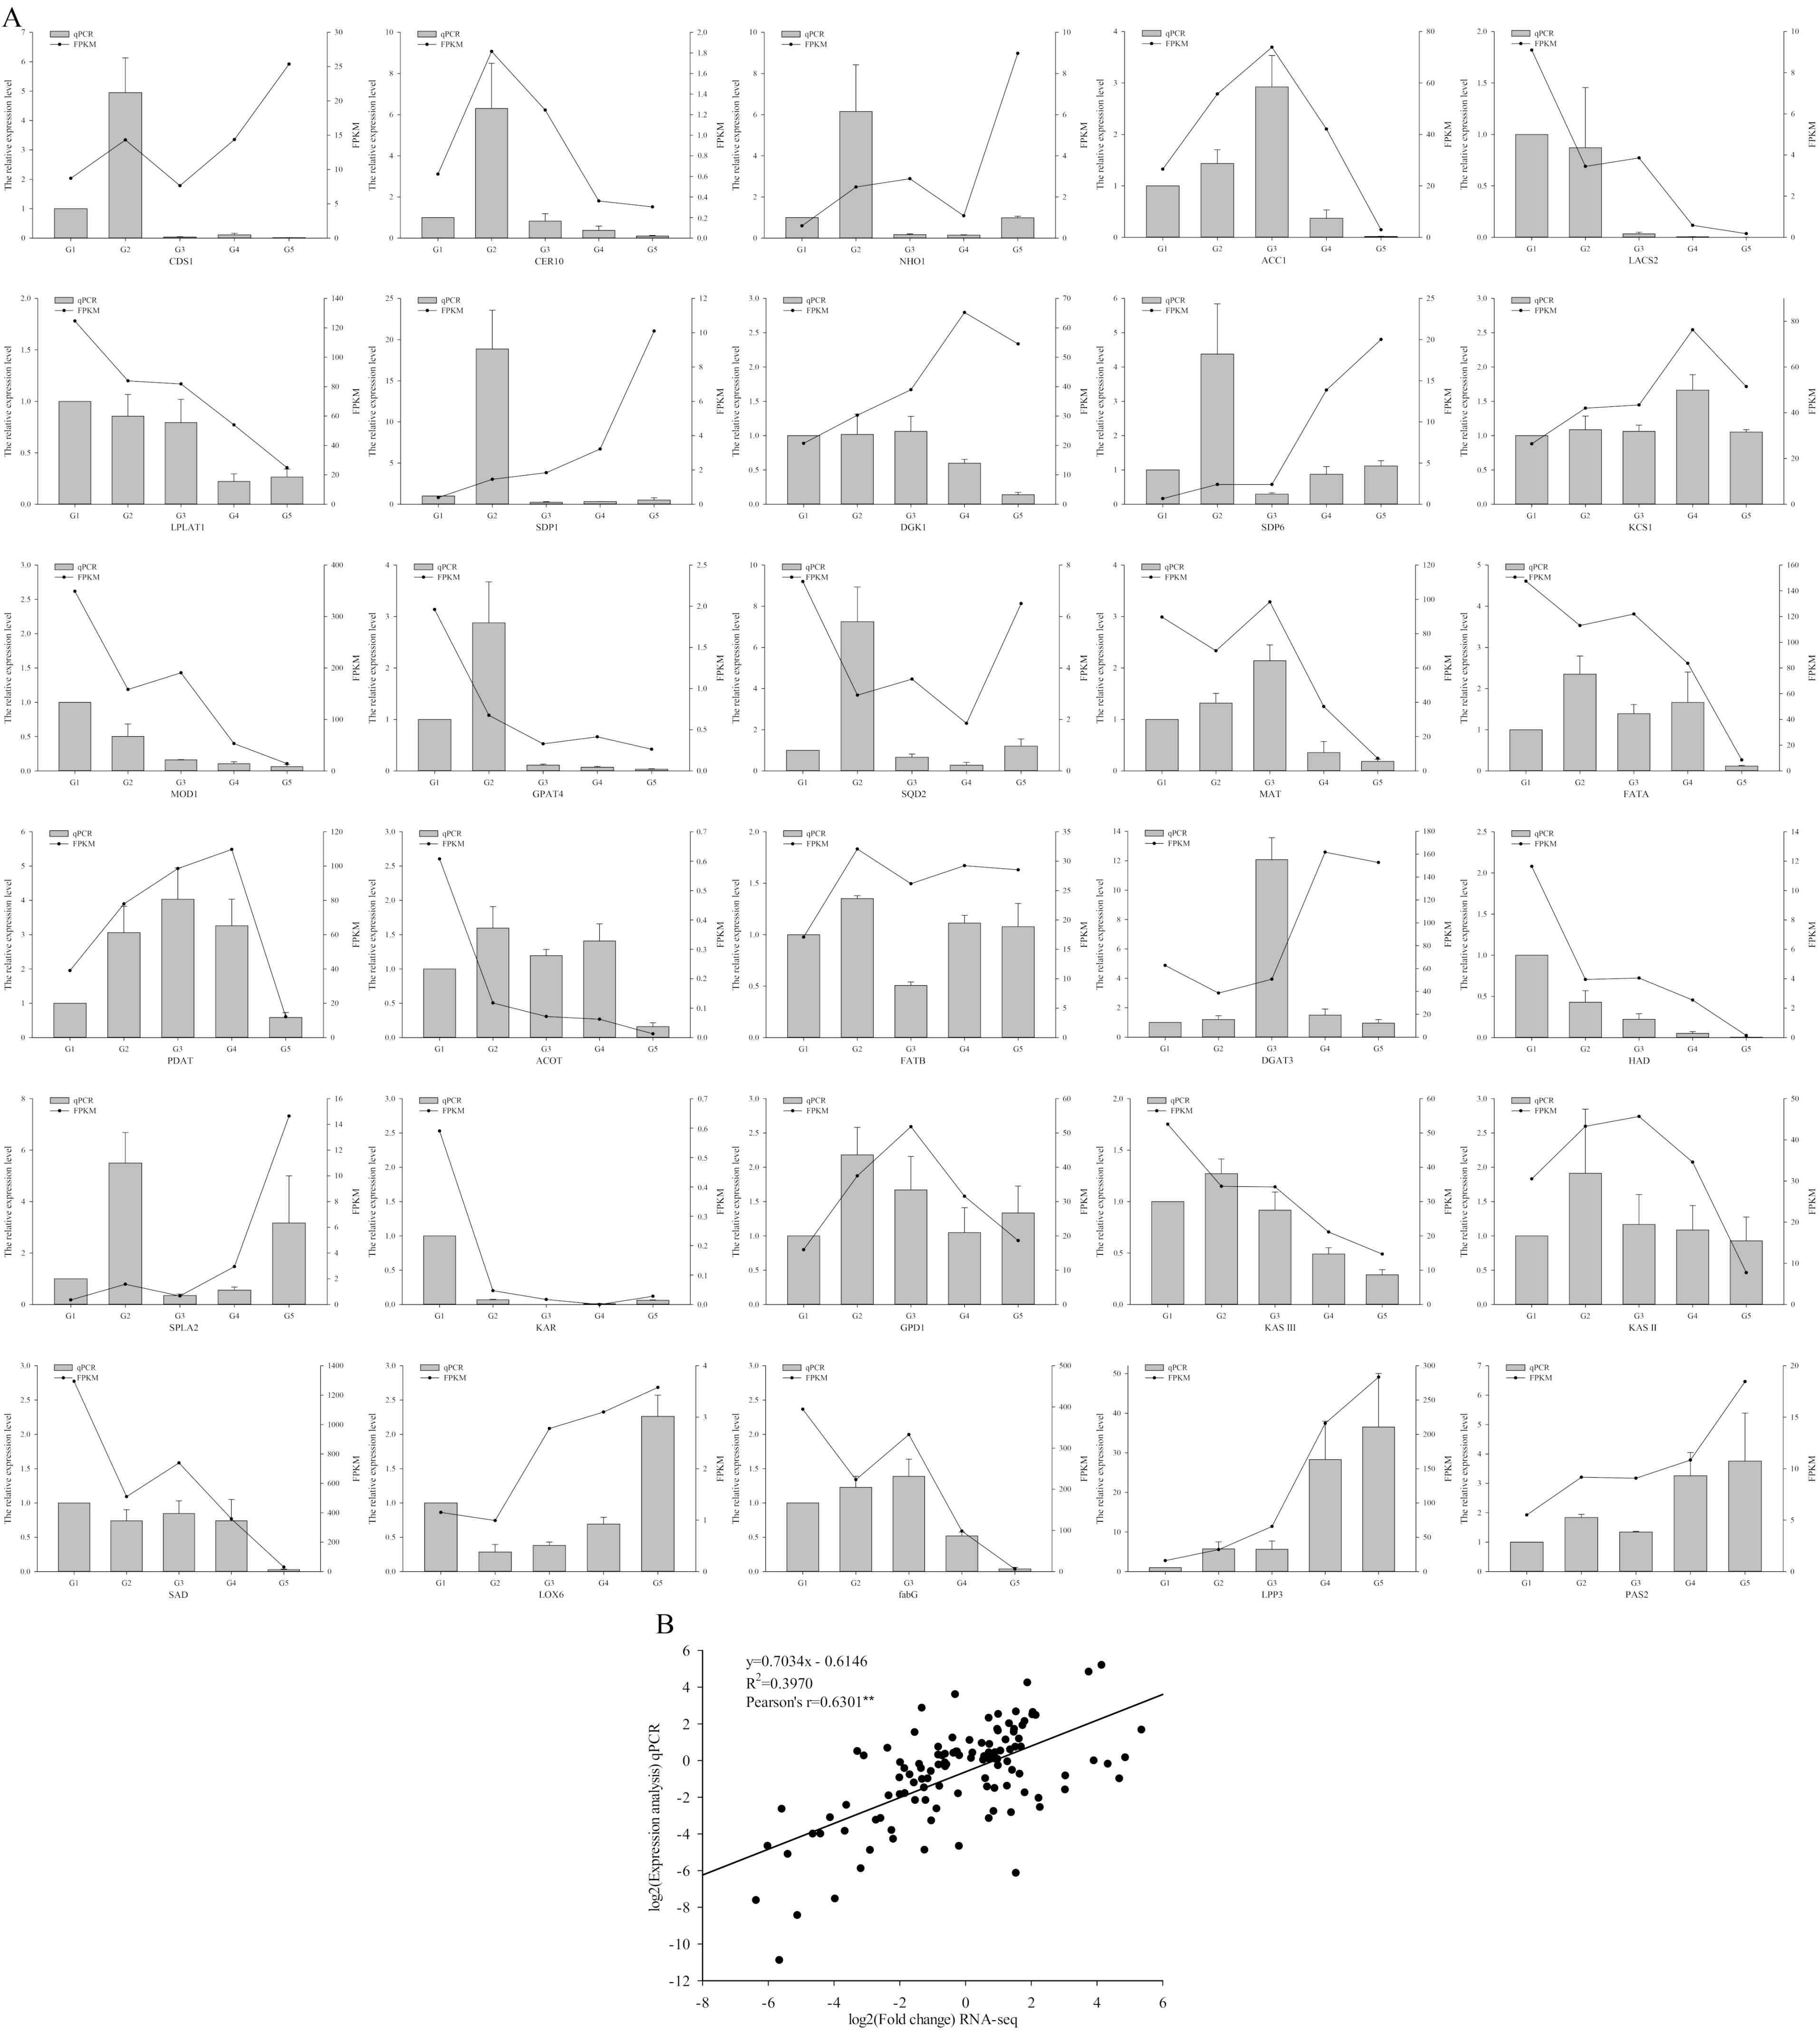
2.7. Validation of RNA-Seq Results by Quantitative Real-Time PCR (qRT-PCR)

The expression level and temporal transcription patterns of 30 DEGs (Table S5) involved in lipid biosynthesis and metabolism were analyzed to verify the accuracy of our RNA-seq data. Figure 5A shows the expression profiles of the 30 genes related to lipid biosynthesis and metabolism. The expression patterns of the DEGs (CER10, ACC1, LPLAT1, KCS1, PDAT, FATB, HAD, KAR, GPD1, KAS II, LOX6, LPP3 and PAS2) detected by qRT-PCR were consistent with those estimated by RNA-seq (Figure 5A). Correlation analysis between the RNA-seq and qRT-PCR expression levels of DEGs was conducted (Figure 5B). The expression levels of the DEGs were positively correlated (p < 0.01) between the RNA-seq and qRT-PCR results, and the Pearson correlation coefficient was 0.6301 (Figure 5B).

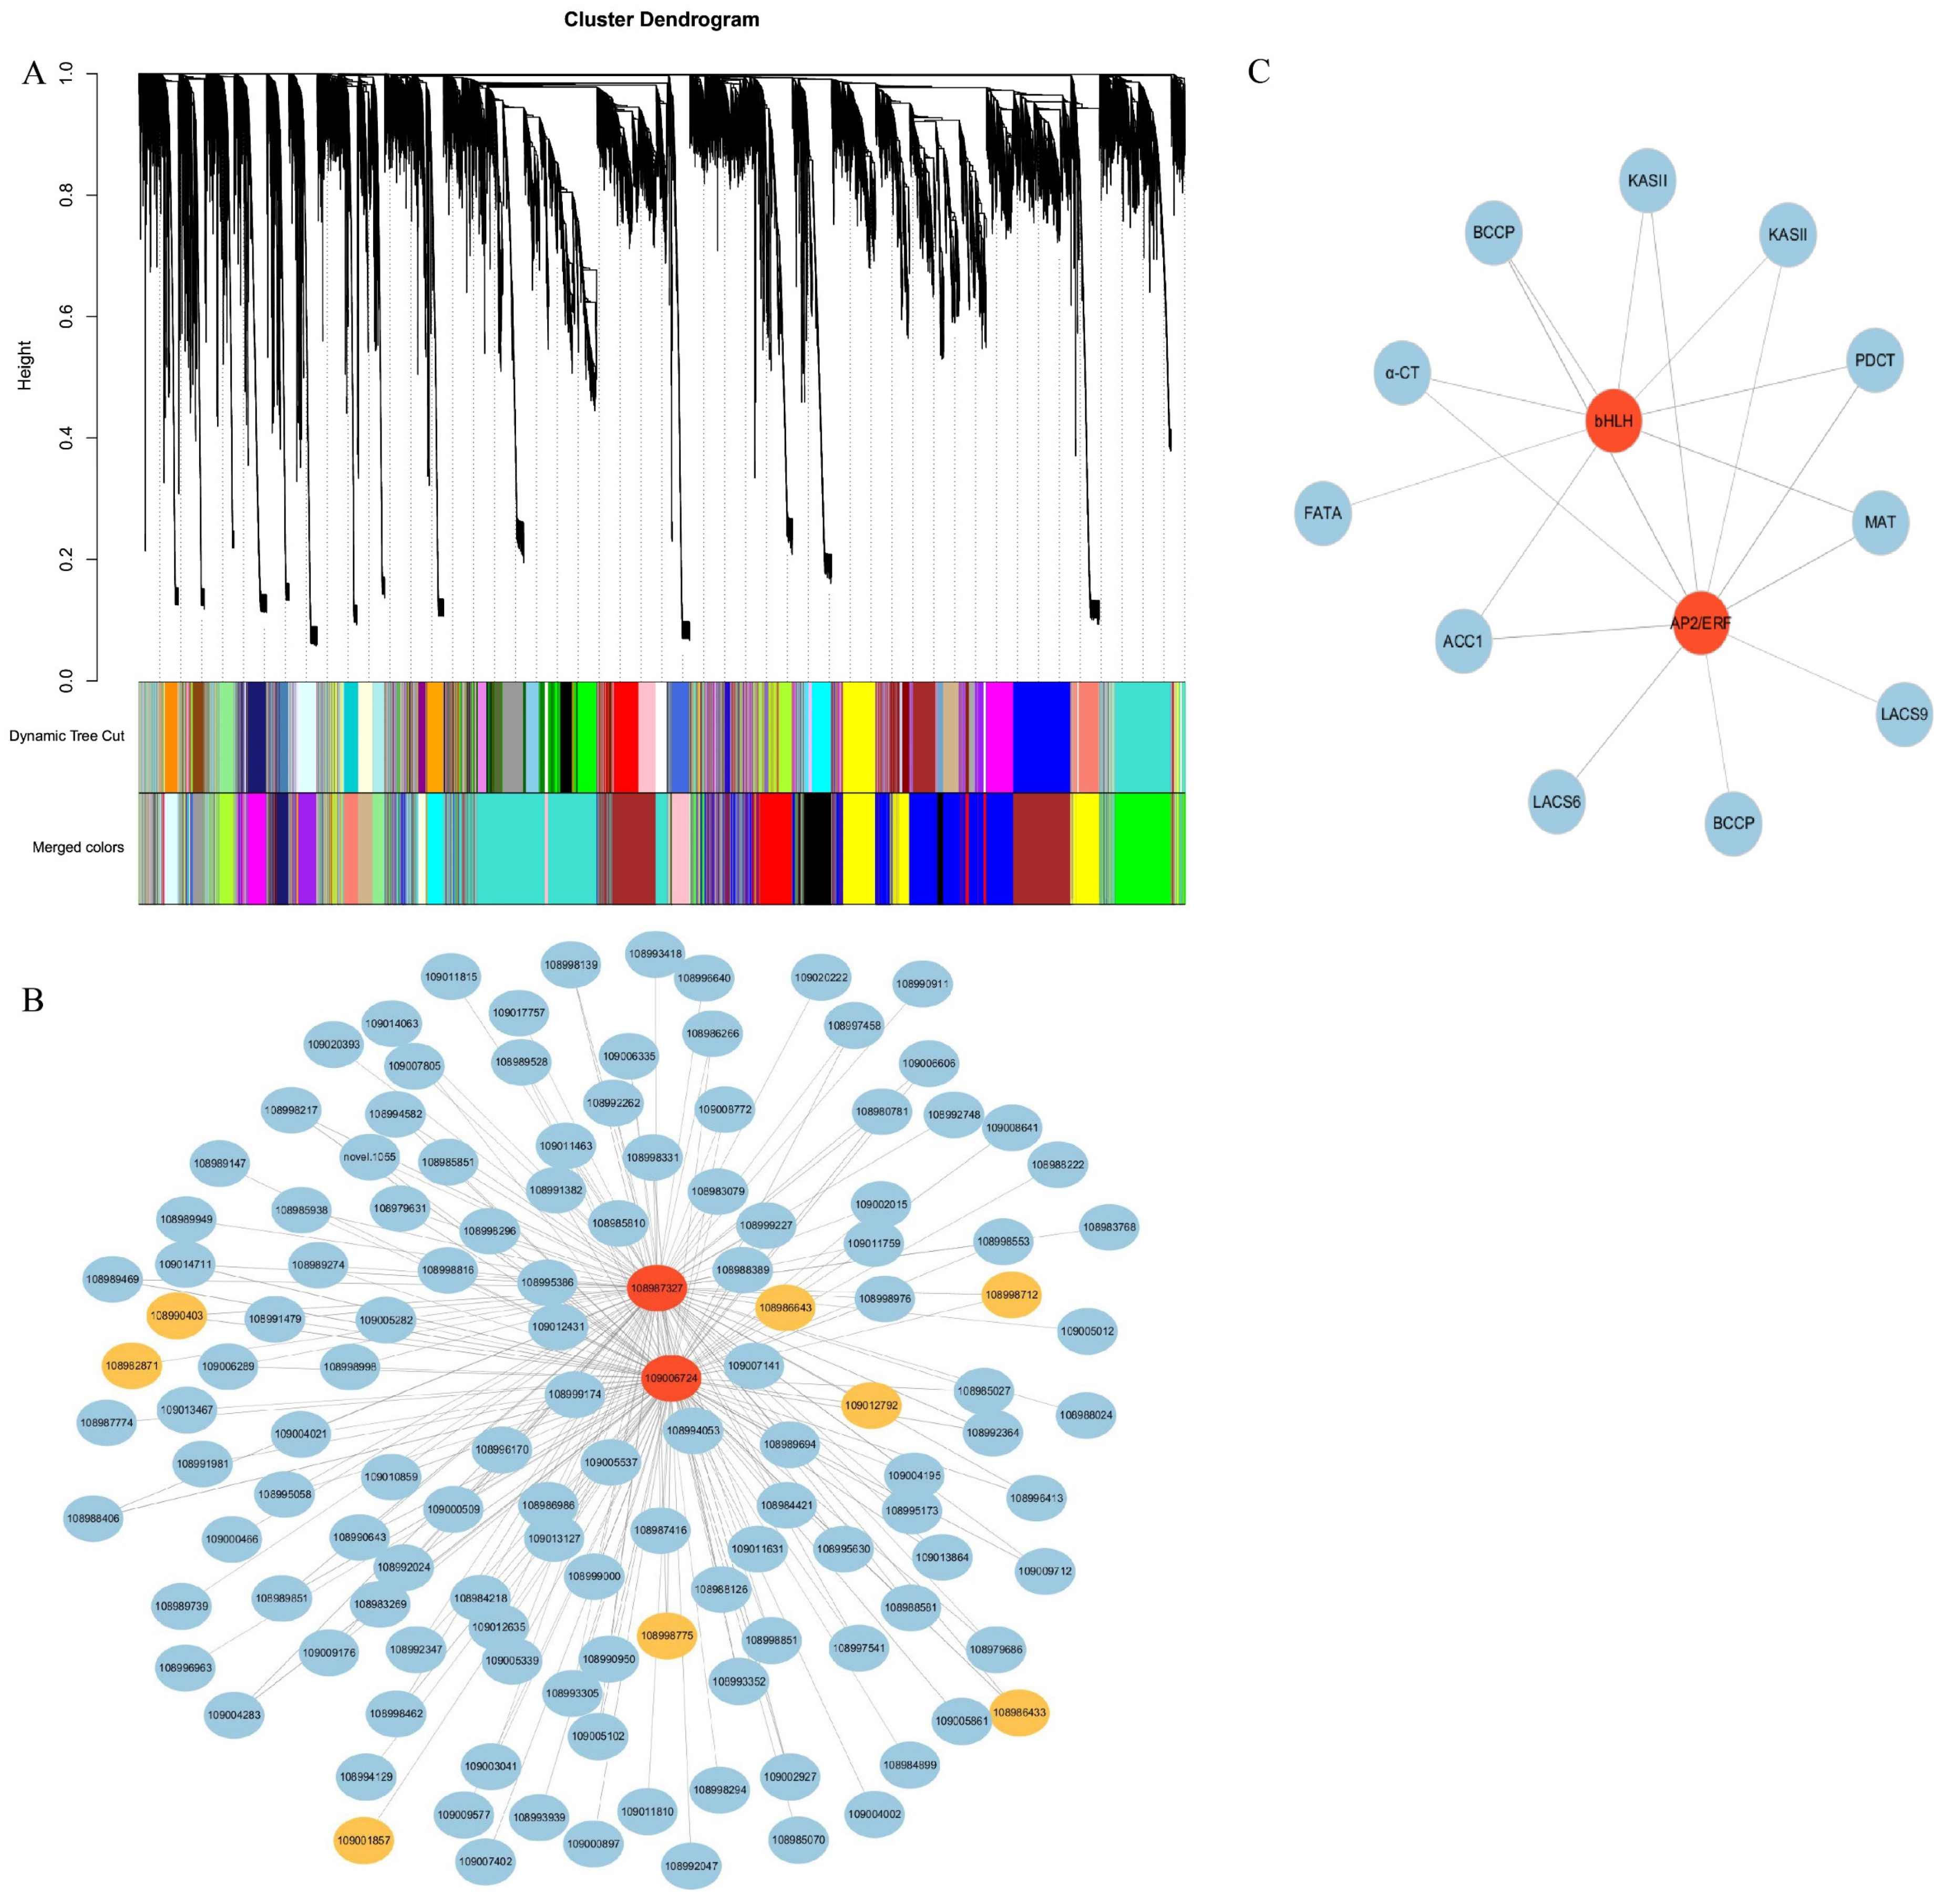
2.8. Weighted Gene Co-Expression Network Analysis

Weighted gene co-expression network analysis (WGCNA) was carried out in order to study the relationship between the DEGs and the oil content in walnut seed kernels. The results indicated that 35 modules were identified and marked with different colors (Figure 6A, Figure S5A). The module–trait correlation relationships were analyzed, which showed that the blue module had the highest correlation with oil content of J. regia (Figure S5B,C). The most abundant TF families in the blue module were AP2/ERF (36), WD40 (32), MYB (30), bHLH (16), bZIP (16), NAM (14), BTB (13), and WRKY (12) (Table S6).
Gene co-expression analysis indicated that the TFs AP2/ERF (109006724) and bHLH (108987327) were the hub genes of the blue module (Figure 6B). Gene expression analysis showed that the expression trends of the two TFs were similar with those of the genes related to oil biosynthesis, that is, were highly expressed at G4–G5 (Figure S5D). Moreover, AP2/ERF (109006724) and bHLH (108987327) were co-expressed with genes related to oil biosynthesis, such as ACC1 (109007141), α-CT (109004195), BCCP (108988222, 108986433), MAT (108989851), KASII (109011759, 108990643), LACS (109005861, 108984899), FATA (108998294), and PDCT (108998331) (Figure 6C).

3. Discussion

Walnut (J. regia) is an important oil-bearing plant with high nutritional value. Recently, RNA-seq has been shown to be one of the effective methods of revealing the biological mechanism of lipid metabolism and oil accumulation in the oilseed crops. In our study, the oil contents of walnut seed kernels at different developmental stages growing at high altitude were analyzed. DEGs and TFs related to lipid biosynthesis and metabolism were screened and obtained through transcriptomics analysis.
In this study, the walnuts flowered in early May in the Qinghai Plateau, and the fruit was harvested in mid-September. The time from full blossom to fruit maturity was about 126 days. The walnut fruit growth period in the Qinghai Plateau in this research is shorter than that in Xinjiang, which was about 150 days in a site 1394 m above sea level [36]. The plant growth period is shorter with the increase in altitude. The sampling site of this study is at an elevation of 2102 m, and there is also a large temperature difference between day and night (Figure S4). Therefore, we believe that the plateau environment led to the shorter growth period in this study. The fruit development, single fruit weight, nut weight, kernel weight, and fruit vertical and transverse diameters showed increasing trends in general (Figure 1B,C). The single fruit weight and the fruit vertical and transverse diameters slightly decreased after reaching maximum values in the late developmental phase (G5), due to the moisture content decreasing during fruit development, accompanied by the decrease in single fruit weight and the fruit vertical and transverse diameters caused by dehydration and shrinkage of seed and pericarp.
In the process of walnut fruit development, the oil content showed a trend of slow–fast–slow. The oil accumulated slowly in the early stages of fruit development, then accumulated rapidly at 70 to 110 DAF. Thereafter, the oil accumulated slowly until fruit ripening [37]. The oil bodies were first observed at 60 DAF in the embryo, and then the number of oil bodies gradually increased until the fruit ripening [36]. In the present study, the oil content increased gradually during fruit development and maturation, which was consistent with previous studies [37] on the dynamic accumulation of walnut oil. The mature walnut nut was made up of more than 69% oil. The FA composition of the mature walnut oil was further investigated, and we found more than 90% were UFAs and more than 70% were PUFAs (Table 1). The contents of the two predominant compositions of SFAs were maintained at low levels. These results showed that the walnut kernel contained more PUFAs and fewer MUFAs, which was similar to previous descriptions of walnuts cultivated in other regions in China and in other countries (Italy [16], Turkey [38], New Zealand [11]). Therefore, walnuts from the Qinghai Plateau are good edible oil sources with high amounts of PUFAs. However, Geng et al. [39] reported that MUFA content was the highest in walnuts from Yunnan. Previous studies showed that FA composition and content are affected by growth environments [40,41]. It has been found that the content of 18:3 in soybean was the most vulnerable to environmental changes [41]. Temperature is one of the essential environmental factors affecting plant metabolism. Therefore, we speculate that the temperature of the sampling site affected the UFA content. In this study, HSPs were highly expressed at G1, G2, and G5, and this may be caused by the large fluctuation of day and night temperature in Qinghai. How walnut plants adapt to large diurnal temperature fluctuations to protect seed development and oil accumulation needs more research in the future.
In this study, 15 cDNA libraries for transcriptome sequencing of walnut seed kernels at five developmental stages were constructed, more than 97% of clean reads in each library mapped to the walnut reference genome. We obtained four sets of DEGs between the different seed development stages. There were more downregulated genes than upregulated genes in lipid synthesis pathways. We focused on FA biosynthesis and oil accumulation in the developing walnut seed kernels, which involves FA biosynthesis, TAG assembly and lipid storage.
The 18C UFAs are important constituents of vegetable oils (e.g., camellia, hickory, walnut), and the regulatory mechanisms are different among plants. With dehydrogenation by SAD, 18:0-ACP is transformed to 18:1-ACP in the plastid, and then 18:1-ACP is transformed to 18:2-ACP and 18:3-ACP in the plastid by FAD6 and FAD7/8, respectively. In another pathway, 18:1-ACP is transformed to 18:1-PC by a series of enzymes, which is desaturated by FAD2 and FAD3 to form 18:2-PC and 18:3-PC in the ER. The results of studies on mutation, overexpression, or heterotopic expression of these genes showed that they have an important influence on oil accumulation or FA compositions. The 18:1 FA is dominant in Camellia oleifera and Carya cathayensis Sarg. [42,43], and the perfect coordination of high SAD levels with low FAD2 levels enhanced the accumulation of 18:1. High 18:2 accumulation in the seeds of Artemisia sphaerocephala and Gossypium hirsutum L. is due to the high expression of FAD2 and the low expression of FAD3 [44,45]. Previous studies indicated that the expression of FAD3 and FAD7/8 are variable in plants with high 18:3 content. The upregulation of FAD3 was associated with 18:3 accumulation in seeds of Paeonia ostii and Linum usitatissimum [46,47]. In addition, the accumulation of 18:3 was associated with the expression of FAD2 and FAD3 in Perilla frutescens seeds [48].
It has been reported that J. regia L is rich in PUFAs, which may be due to high expression levels of FAD2 and FAD3 [29]. The results of subcellular localization confirmed that JrFAD3 plays a part in the ER rather than the plastid [29]. However, what causes high 18:2 and low 18:3 is still unknown.
In this study, UFAs accounted for more than 90% of the total FAs, and more than 70% were PUFAs (Table 1). Four, two, three, one and two DEGs were identified as SAD, FAD2, FAD3, FAD6 and FAD7/8, respectively. The transcriptional levels of SAD, FAD2 and FAD3 were high, while FAD6 and FAD7/8 were less expressed in developing walnut seeds, which was consistent with previous results [29]. In our work, the expression levels of SAD, FAD2, and FAD3 were high from G1 to G4 (Figure 4C), and reached their peak at G4. This trend is consistent with oil accumulation, where the oil continuously and rapidly increased at G1–G4. However, the expression levels of FAD7/8 (108994930) were less than one during walnut seed development (Figure 4C, Table S4). Based on this, we speculated that 18:2 and 18:3 in walnut seeds were mainly produced by the highly expressed FAD2 and FAD3 in the ER rather than by FAD6 and FAD7/8 in plastids.
DGAT and PDAT are essential enzymes for TAG biosynthesis, and their contributions to TAG assembly varies in different species. Studies show that PDAT exhibits higher expression levels than DGAT in Carthamus tinctorius L., G. hirsutum L., J. regia L., and P. ostia. This indicates that PDAT might play a more important role in the process of TAG biosynthesis [29,44,46,49]. In Torreya grandis kernels, PDAT showed a higher correlation with oil content than DGAT, indicating that PDAT contributed more to the accumulation of oil than DGAT [50]. However, it was found that DGAT was more important for the biosynthesis of TAG in many oilseeds, such as Brassica napus and Paeonia lactiflora [51,52]. Furthermore, PDAT and DGAT simultaneously regulated TAG biosynthesis in A. sphaerocephala [45]. The expression level of PDAT in walnut is much higher than that of DGAT1 and DGAT2, and PDAT is highly expressed at 63−133 DAP [29]. From this study, two PDATs (109000668, 109008819) exhibited higher expression levels than the others during the seed development. One PDAT (109000668) was upregulated continuously at G1–G4 then downregulated at G5. This expression trend of PDAT was similar to that of PDAT reported by Huang et al. [29]. Further, in our work, the expression level of DGAT (109011752) was much higher than that of the other two DGATs (109009388, 109009971) during seed kernel development, and reached a peak at G5. These results indicated that it might be that PDAT and DGAT simultaneously regulate TAG biosynthesis in walnut.
It has been reported that oleosins controlling oil body structure and lipid accumulation are important proteins in seed [53]. In this study, the OLEs were highly expressed from G1 to G4, and were expressed at much higher levels than the CLOs and STEs. The expression trend of OLEs, CLO (10893007) and STE (108984079) were consistent with oil accumulation. Thus, they might play an important role in lipid accumulation, and high expression levels of OLEs may be closely related to high oil content of walnut kernels.
Previous studies have shown that TFs, such as LEC, WRI1, FUS3 and ABI3, play roles in seed oil synthesis and deposition, but this varies from species to species. WRI1 and NF-YB6 were considered to be elite TFs in the regulation of lipid metabolism in G. hirsutum L. [44]. WRI1 and FUS3 may be crucial in the regulation of lipid biosynthesis in the kernel of P. ostii and T. grandis [46,50]. In walnut cultivar “Linzaoxiang”, the expression pattern of WRI1 aligned with the accumulation of oil, and WRI1 may play an important role in the synthesis of walnut oil [29]. Wang et al. [54] identified five important TFs (WRI1, ABI3, FUS3, PKL and VAL1) which might highly regulate ACCase, KASII, LACS, FAD3 and LPAAT. In this study, the results of gene co-expression analysis showed that AP2/ERF and bHLH were the key TFs for the walnut oil accumulation during seed kernel development.
The differential activity of one or more enzymes in each step might lead to the variation in the oil content in developing walnut seeds. Thus, it would be extremely important to study the genes related to oil content and FA composition and content of walnut seed varieties, in respect to copy numbers, allelic combination, transcriptional and post-translational regulations [48]. The oil synthesis is a complicated process that involves a series of enzymes and molecules. Some important genes differentially expressed in the developing walnut seed kernels were identified. Additionally, some TFs that might be related to the FA biosynthesis and oil accumulation of J. regia were identified. Nevertheless, the regulating mechanism of oil accumulation in developing seed kernels is still unclear. Further studies on their functions in FA biosynthesis and oil accumulation are required.

4. Materials and Methods

4.1. Plant Materials

All of the fruits were collected from a local walnut variety (30-year-old walnut trees), which is located in Jianzha county (101°57′ E, 36°01′ N, elevation 2102 m, Qinghai province, China). The annual average temperature is 8.3 °C, the annual average precipitation is 350~400 mm, and the annual sunshine hours are around 2500 h.

4.2. Sampling and Fruit Growth Analysis

Samples were collected every 7~10 days during the seed development in 2019. The fruits were collected from areas with the same sunlight conditions. Walnut fruits were harvested on 12 July, 19 July, 26 July, 5 August, 9 August, 16 August, 23 August, 3 September, 11 September, and 20 September (65, 72, 79, 89, 93, 100, 107, 118, 126, and 135 DAF, respectively). According to the results of the pilot study, due to the low oil extraction rate at the early stages, the oil content was continuously analyzed from early July to mid-September. According to the embryo morphology development and oil content, the seed kernels collected at 72, 79, 93, 118 and 135 DAF (designated as G1, G2, G3, G4 and G5, respectively) (Figure 1A) were chosen for RNA-seq analysis. The walnut husk and hull were removed quickly, and the peeled walnut kernel samples for transcriptome sequencing and qRT-PCR were immediately frozen in liquid nitrogen and then taken back to the laboratory, and stored in a refrigerator at −80 °C until use. All of the samples were collected with three biological replicates. At the same time, the vertical and transverse diameter of walnut fruit were measured using vernier calipers. One percent electronic balance was used to determine the weight of fruit, nut, and seed kernel. The mean values of 20 fruits were calculated. Meanwhile, the fruit morphology was recorded using a camera (Canon PowerShot SX50 HS, Oita Prefecture, Japan).

4.3. Kernel Oil Content and Fatty Acid Composition Detection

The walnut seed kernels dried to constant weight were ground to a homogenized powder. Then, 1.50 g of the powder was put in a water-free and oil-free filter paper bag used to extract crude fat using a Soxhlet apparatus at 75 °C for 8 h with anhydrous ether (boiling point 34.5 °C) as the extractant. Fatty acid methyl esters (FAMEs) were assayed by gas chromatography with flame ionization detection (GC–FID) and DB-23 chromatographic column (Agilent Technologies, Santa Clara, CA, USA) using the method described by Poggetti et al. [16]. Relative percentage of FAs was calculated according to the peak areas. All analyses were carried out in triplicate. The data were expressed as mean ± standard error (SE).

4.4. Total RNA Isolation, Transcriptome Sequencing Library Construction, and the Next Generation Sequencing

The total RNA of the walnut kernel samples was extracted using a Plant RNA Kit (OMEGA Bio-Tek, Norcross, GA, USA) according to the instructions. Three methods were used to detect RNA quality and quantity: agarose gel electrophoresis was used to detect the RNA degradation and contamination, the Nano Photometer® spectro photometer (IMPLEN, Munich, Germany) was used to check RNA purity, and the Bioanalyzer 2100 system (Agilent Technologies, CA, USA) was used to check RNA integrity. A transcriptome sequencing library was constructed using a NEBNext® UltraTM RNA Library Prep Kit for Illumina® (Illumina, San Diego, CA, USA) following the producer’s recommended technology process. The library quality was assessed on the Agilent Bioanalyzer 2100 system. Illumina sequencing was performed at Novogene Bioinformatics Technology Co., Ltd., Beijing, China. The library preparations were sequenced on the Illumina Novaseq 6000 platform and 150 bp paired-end reads were generated.

4.5. Analysis of Transcriptome, Quality Control and Clean Reads Mapping to the Reference Genome

All sequencing results were assessed for quality control by removing reads containing adapter, reads containing ploy-N, and low-quality reads from the raw data, and thus we obtained clean data that were used for downstream analyses. All clean data were mapped to the walnut genome reference sequence (GenBank assembly accession: GCF_001411555.1) using Hisat2 v2.0.5 [55].

4.6. Quantification of Gene Expression Level and Differential Expression Analysis

The reads numbers mapped to each gene were counted using feature Counts v1.5.0-p3 [56]. FPKM values for each gene were calculated based on the length of the gene and reads count were mapped to this gene, and were used for estimating gene expression levels [57]. Differential expression analysis of five groups (three biological replicates per group) was performed using the DESeq2 R package (1.16.1) [58]. The Benjamini and Hochberg’s approach was used to adjust the resulting p-values for controlling the false discovery rate [59]. Genes with an adjusted p-value < 0.05 found by DESeq2 were said to be differentially expressed.

4.7. GO and KEGG Enrichment of DEGs

The clusterProfiler R package was used to analyze the DEGs and correct the gene length bias. GO terms with corrected p-values less than 0.05 were considered significantly enriched by DEGs. The clusterProfiler R package was used to test the statistical enrichment of DEGs in KEGG pathways [60].

4.8. WGCNA

The gene coexpression network was constructed by WGCNA of NovoMagic Cloud platform accessed on 6 June 2022 (https://magic.novogene.com/). The network diagram was created using Cytoscape 3.9.1 accessed on 26 June 2022 (https://cytoscape.org/).

4.9. Quantitative Real-Time PCR and Correlation Analyses

The total RNA was extracted using a TaKaRa MiniBEST Plant RNA Extraction Kit according to the manufacturer’s instructions, and cDNA was synthesized from the total RNA (500 ng) using TaKaRa PrimeScript TM RT Master Mix (Takara Biotechnology Co., Ltd., Dalian, China) to reach 10 μL total volume following the instructions (Takara). The qRT-PCR was performed with TaKaRa TB Green® Premix Ex TaqTM II (Tli RNaseH Plus) (Takara Biotechnology Co., Ltd., Dalian, China) according to the manufacturer’s instructions, and was performed on a CFX Connect TM Real-Time System (Bio-Rad Laboratories, CA, USA). As the housekeeping gene, walnut GAPDH was used as the reference gene [29]. The primers for qRT-PCR were designed with Oligo software (Table S5). The relative expression level of the target genes was calculated by 2−ΔΔCT method [61]. Pearson correlation analysis of the expression levels between qRT-PCR and RNA-seq was conducted by GraphPad Prism 6.0., and p ≤ 0.01 was the threshold for statistical significance (**).

5. Conclusions

In this study, the oil contents of J. regia seed kernels from the Qinghai Plateau in different developmental stages were measured. The results indicated that walnut oils increased dramatically in late July and reached the maximum value of 69% in mature seeds. The 18:2 was the predominant UFA accumulated in mature seeds. The transcriptome of J. regia at five developmental stages was sequenced and annotated using the Illumina RNA-seq technology. Through transcriptomics profiling, four sets of DEGs in the different seed development stages were obtained. Compared to G1, the number of DEGs increased with the seed kernel development. The DEGs related to lipid biosynthesis and metabolism were screened by the DESeq method. We counted the number of DEGs associated with the lipid metabolic and oil accumulation. The key regulatory enzymes were identified, and they may play crucial roles in FA biosynthesis and oil accumulation in walnut seed kernels. FA de novo biosynthesis-related genes, including ACCase, MAT, KAS, KAR, HAD, EAR, FATB and FATA, were highly expressed from G1 to G4 stage. LACS, KCS, KCR, HCD, ECR, SAD, and FADs were related to FA elongation and desaturation. GPAT, LPLAT, PAP, PLA2, DGAT, PDAT, and PDCT were involved in TAG assembly pathway. The synergy of these genes promoted oil synthesis, and highly expressed oleosins, caleosins and steroleosins may be important for timely energy reserve in oil bodies. This transcriptome data will enrich public databases and provide new insights into functional genes related to the seed kernel lipid metabolism and oil accumulation in J. regia. Heat shock protein and heat stress TFs may protect walnuts from damage caused by large temperature differences and provide a guarantee for high lipid content. WGCNA showed that AP2/ERF and bHLH were the key TFs in lipid biosynthesis in walnut seed kernels, and were co-expressed with ACC1, α-CT, BCCP, MAT, KASII, LACS, FATA, and PDCT. Our results will serve as a basis to investigate regulation networks of J. regia to clarify the molecular mechanisms of oil accumulation process and to accelerate the genetic engineering to increase seed oil content and quality. Our results may also provide a useful reference for the molecular breeding of woody oil plants.

Supplementary Materials

The following supporting information can be downloaded at: https://www.mdpi.com/article/10.3390/plants11233207/s1, Figure S1: Distribution of reads in different regions of the genome at five developmental stages, Figure S2: Gene ontology classification of the walnut transcriptome data, Figure S3: Bubble diagram of enrichment of KEGG pathway, Figure S4: Temperature variation in the process of walnut seed development, Figure S5: Weighted gene coexpression network analysis of genes and the expression of TF at different walnut seed development stages; Table S1: The morphological and physiological characteristics, oil accumulation in the process of walnut embryo development, Table S2: The mapping result of each sample, Table S3. Distribution of sequencing reads in genome regions, Table S4: Detailed information regarding gene annotation and FPKM values of genes in developing walnut seeds, Table S5: The designed primers of the key enzymes involved in lipid biosynthesis and metabolism for qRT-PCR, Table S6: Identification of transcription factors in the transcriptome of J. regia. in blue module.

Author Contributions

Designing the work, W.S. and D.Z.; running the experiments, W.S. and D.Z.; data analysis and statistics, W.S., D.Z. and Z.M.; manuscript writing and revising, W.S., D.Z. and Z.M. All authors have read and agreed to the published version of the manuscript.

Funding

This research was supported by the Qinghai Province Natural Science Foundation for Youths (2019-ZJ-980Q), the Fund Project of Qinghai Academy of Agriculture and Forestry Sciences (2018-NKY-007), and the National Natural Science Foundation of China (General Program) (32170239).

Informed Consent Statement

Not applicable.

Data Availability Statement

Transcriptome sequencing data are available from the NCBI under project ID PRJNA781571.

Acknowledgments

We would like to thank Novogene (Novogene Co., Ltd., Beijing, China) for help with the transcriptome sequencing and technical assistance.

Conflicts of Interest

The authors declare no conflict of interest.

References

  1. Abdallah, I.B.; Tlili, N.; Martinez-Force, E.; Rubio, A.G.P.; Perez-Camino, M.C.; Albouchi, A.; Boukhchina, S. Content of carotenoids, tocopherols, sterols, triterpenic and aliphatic alcohols, and volatile compounds in six walnuts (Juglans regia L.) varieties. Food Chem. 2015, 173, 972–978. [Google Scholar] [CrossRef] [PubMed] [Green Version]
  2. Bouabdallah, I.; Bouali, I.; Martinez-Force, E.; Albouchi, A.; Perez Camino, M.C.; Boukhchina, S. Composition of fatty acids, triacylglycerols and polar compounds of different walnut varieties (Juglans regia L.) from Tunisia. Nat. Prod. Res. 2014, 28, 1826–1833. [Google Scholar] [CrossRef] [PubMed] [Green Version]
  3. Ruijun, W.; Shi, W.; Yijun, X.; Mengwuliji, T.; Lijuan, Z.; Yumin, W. Antitumor effects and immune regulation activities of a purified polysaccharide extracted from Juglan regia. Int. J. Biol. Macromol. 2015, 72, 771–775. [Google Scholar] [CrossRef] [PubMed]
  4. Djoussé, L.; Lu, B.; Gaziano, J.M. Effects of walnut consumption on endothelial function in people with type 2 diabetes: A randomized pilot trial. Curr. Nutr. Rep. 2016, 5, 1–8. [Google Scholar] [CrossRef]
  5. Kendall, C.W.C.; Esfahani, A.; Josse, A.R.; Augustin, L.S.A.; Vidgen, E.; Jenkins, D.J.A. The glycemic effect of nut-enriched meals in healthy and diabetic subjects. Nutr. Metab. Cardiovasc. Dis. 2011, 21, S34–S39. [Google Scholar] [CrossRef]
  6. Tindall, A.M.; Mclimans, C.J.; Petersen, K.S.; Kris-Etherton, P.M.; Lamendella, R. Walnuts and vegetable oils containing oleic acid differentially affect the gut microbiota and associations with cardiovascular risk factors: Follow-up of a randomized, controlled, feeding trial in adults at risk for cardiovascular disease. J. Nutr. 2020, 150, 806–817. [Google Scholar] [CrossRef] [Green Version]
  7. Martínez, M.L.; Mattea, M.A.; Maestri, D.M. Varietal and crop year effects on lipid composition of walnut (Juglans regia) genotypes. J. Am. Oil Chem. Soc. 2006, 83, 791–796. [Google Scholar] [CrossRef]
  8. Amaral, J.S.; Casal, S.; Pereira, J.A.; Seabra, R.M.; Oliveira, B.P.P. Determination of sterol and fatty acid compositions, oxidative stability, and nutritional value of six walnut (Juglans regia L.) cultivars grown in Portugal. J. Agr. Food Chem. 2003, 51, 7698–7702. [Google Scholar] [CrossRef] [Green Version]
  9. Prasad, R.B.N. Walnuts and pecans. In Encyclopedia of Food Sciences and Nutrition, 2nd ed.; Caballero, B., Ed.; Academic Press: Oxford, UK, 2003; pp. 6071–6079. ISBN 978-0-12-227055-0. [Google Scholar]
  10. Li, Q.; Yin, R.; Zhang, Q.; Wang, X.; Hu, X.; Gao, Z.; Duan, Z. Chemometrics analysis on the content of fatty acid compositions in different walnut (Juglans regia L.) varieties. Eur. Food Res. Technol. 2017, 243, 2235–2242. [Google Scholar] [CrossRef]
  11. Zwarts, L.; Savage, G.P.; Mcneil, D.L. Fatty acid content of New Zealand-grown walnuts (Juglans regia L.). Int. J. Food Sci. Nutr. 1999, 50, 189–194. [Google Scholar] [CrossRef]
  12. Doğan, A.; Celik, F.; Balta, F.; Javidipour, I.; Yaviç, A. Analysis of fatty acid profiles of pistachios (Pistacia vera L.) and native walnuts (Juglans regia L.) from Turkey. Asian J. Chem. 2010, 22, 517–521. [Google Scholar]
  13. Ozrenk, K.; Javidipour, I.; Yarilgac, T.; Balta, F.; Gundogdu, M. Fatty acids, tocopherols, selenium and total carotene of pistachios (P. vera L.) from Diyarbakir (Southeastern Turkey) and walnuts (J. regia L.) from Erzincan (Eastern Turkey). Food Sci. Technol. Int. 2012, 18, 55–62. [Google Scholar] [CrossRef] [PubMed]
  14. Zhai, M.Z.; Wang, D.; Tao, X.D.; Wang, Z.Y. Fatty acid compositions and tocopherol concentrations in the oils of 11 varieties of walnut (Juglans regia L.) grown at Xinjiang, China. J. Hortic. Sci. Biotechnol. 2015, 90, 715–718. [Google Scholar] [CrossRef]
  15. Gao, P.; Jin, J.; Liu, R.; Jin, Q.; Wang, X. Chemical compositions of walnut (Juglans regia L.) oils from different cultivated regions in China. J. Am. Oil Chem. Soc. 2018, 95, 825–834. [Google Scholar] [CrossRef]
  16. Poggetti, L.; Ferfuia, C.; Chiabà, C.; Testolin, R.; Baldini, M. Kernel oil content and oil composition in walnut (Juglans regia L.) accessions from north-eastern Italy. J. Sci. Food Agr. 2018, 98, 955–962. [Google Scholar] [CrossRef] [Green Version]
  17. Gao, P.; Liu, R.; Jin, Q.; Wang, X. Comparative study of chemical compositions and antioxidant capacities of oils obtained from two species of walnut: Juglans regia and Juglans sigillata. Food Chem. 2019, 279, 279–287. [Google Scholar] [CrossRef]
  18. Combres, J.; Pallas, B.; Rouan, L.; Mialet-Serra, I.; Caliman, J.; Braconnier, S.; Soulié, J.; Dingkuhn, M. Simulation of inflorescence dynamics in oil palm and estimation of environment-sensitive phenological phases: A model based analysis. Funct. Plant Biol. FPB 2013, 40, 263–279. [Google Scholar] [CrossRef]
  19. Shen, Q.; Zhao, J.; Qiu, X.; Shang, Z.; Wang, X.; Yang, S.; Xu, J.; Chen, S. Research on influence of environment factors to yield and quality traits of Perilla frutescen. China J. Chin. Mater. Med. 2018, 43, 4033–4043. [Google Scholar] [CrossRef]
  20. Dabbou, S.; Sifi, S.; Rjiba, I.; Esposto, S.; Taticchi, A.; Servili, M.; Montedoro, G.F.; Hammami, M. Effect of pedoclimatic conditions on the chemical composition of the sigoise olive cultivar. Chem. Biodivers. 2010, 7, 898–908. [Google Scholar] [CrossRef]
  21. Primomo, V.S.; Falk, D.E.; Ablett, G.R.; Tanner, J.W.; Rajcan, I. Genotype × environment interactions, stability, and agronomic performance of soybean with altered fatty acid profiles. Crop Sci. 2002, 42, 37–44. [Google Scholar] [CrossRef]
  22. Lee, J.; Woolard, M.; Sleper, D.A.; Smith, J.R.; Pantalone, V.R.; Nyinyi, C.N.; Cardinal, A.; Shannon, J.G. Environmental effects on oleic acid in soybean seed oil of plant introductions with elevated oleic concentration. Crop Sci. 2009, 49, 1762–1768. [Google Scholar] [CrossRef]
  23. Greve, L.; Mcgranahan, G.; Hasey, J.; Snyder, R.; Kelly, K.; Goldhamer, D.; Labavitch, J. Variation in polyunsaturated fatty acids composition of persian walnut. J. Am. Soc. Hortic. Sci. 1992, 117, 518–522. [Google Scholar] [CrossRef]
  24. Tzen, J.; Cao, Y.; Laurent, P.; Ratnayake, C.; Huang, A. Lipids, proteins, and structure of seed oil bodies from diverse species. Plant Physiol. 1993, 101, 267–276. [Google Scholar] [CrossRef] [PubMed] [Green Version]
  25. Bates, P.D.; Stymne, S.; Ohlrogge, J. Biochemical pathways in seed oil synthesis. Curr. Opin. Plant Biol. 2013, 16, 358–364. [Google Scholar] [CrossRef] [PubMed] [Green Version]
  26. Yan, S.; Wang, X.; Yang, C.; Wang, J.; Wang, Y.; Wu, B.; Qiao, L.; Zhao, J.; Mohammad, P.; Zheng, X.; et al. Insights into walnut lipid metabolism from metabolome and transcriptome analysis. Front. Genet. 2021, 12, 1334. [Google Scholar] [CrossRef]
  27. Zhao, S.; Zhang, X.; Su, Y.; Chen, Y.; Liu, Y.; Sun, M.; Qi, G.; Ferrante, A. Transcriptome analysis reveals dynamic fat accumulation in the walnut kernel. Int. J. Genom. 2018, 2018, 1–13. [Google Scholar] [CrossRef]
  28. Zhao, X.; Yang, G.; Liu, X.; Yu, Z.; Peng, S. Integrated analysis of seed microRNA and mRNA transcriptome reveals important functional genes and microRNA-targets in the process of walnut (Juglans regia) seed oil accumulation. Int. J. Mol. Sci. 2020, 21, 9093. [Google Scholar] [CrossRef]
  29. Huang, R.; Zhou, Y.; Zhang, J.; Ji, F.; Pei, D. Transcriptome analysis of walnut (Juglans regia L.) embryos reveals key developmental stages and genes involved in lipid biosynthesis and polyunsaturated fatty acid metabolism. J. Agr. Food Chem. 2021, 69, 377–396. [Google Scholar] [CrossRef]
  30. Arondel, V.; Lemieux, B.; Hwang, I.; Gibson, S.; Goodman, H.; Somerville, C. Map-based cloning of a gene controlling omega-3 fatty acid desaturation in Arabidopsis. Science 1992, 258, 1353–1355. [Google Scholar] [CrossRef] [PubMed]
  31. Okuley, J.; Lightner, J.; Feldmann, K.; Yadav, N. Arabidopsis FAD2 gene encodes the enzyme that is essential for polyunsaturated lipid synthesis. Plant Cell 1994, 6, 147–158. [Google Scholar]
  32. Baud, S.; Lepiniec, L. Physiological and developmental regulation of seed oil production. Prog. Lipid Res. 2010, 49, 235–249. [Google Scholar] [CrossRef] [PubMed]
  33. St Hl, U.; St Lberg, K.; Stymne, S.; Ronne, H. A family of eukaryotic lysophospholipid acyltransferases with broad specificity. Febs Lett. 2008, 582, 305–309. [Google Scholar] [CrossRef] [PubMed]
  34. Bates, P.D.; Fatihi, A.; Snapp, A.R.; Carlsson, A.S.; Browse, J.; Lu, C. Acyl editing and headgroup exchange are the major mechanisms that direct polyunsaturated fatty acid flux into triacylglycerols. Plant Physiol. 2012, 160, 1530–1539. [Google Scholar] [CrossRef] [PubMed] [Green Version]
  35. Jasieniecka-Gazarkiewicz, K.; Demski, K.; Lager, I.; Stymne, S.; Banaś, A. Possible role of different yeast and plant lysophospholipid: Acyl-CoA acyltransferases (LPLATs) in acyl remodelling of phospholipids. Lipids 2016, 51, 15–23. [Google Scholar] [CrossRef] [PubMed] [Green Version]
  36. Chen, H.; Pan, C.; Wang, B.; Xiao, Z.; Hu, Y.; Hu, G. Oil body observation in seed development and its analysis in seed of Juglans regia ‘Wen185’ and J. regia ‘Xinxin2’ in period of seed maturity. Sci. Agric. Sincia 2015, 48, 3899–3909. [Google Scholar]
  37. Chen, H.; Pan, C.; Wang, B.; Hu, Y.; Xiao, Z.; He, M. The relationship among nutrients’ accumulation and dynamic changes of fatty acids in seed development of walnut. J. Agric. Univ. Hebei 2016, 39, 57–62. [Google Scholar]
  38. Simsek, M. Chemical, mineral, and fatty acid compositions of various types of walnut (Juglans regia L.) in Turkey. Izv. Po Khimiya Bulg. Akad. Na Nauk. 2016, 48, 66–70. [Google Scholar]
  39. Geng, S.; Ning, D.; Ma, T.; Chen, H.; Zhang, Y.; Sun, X. Comprehensive analysis of the components of walnut kernel (Juglans regia L.) in China. J. Food Qual. 2021, 2021, 1–11. [Google Scholar] [CrossRef]
  40. Hao, B.Q.; Zhao, Z.H.; Cai, Y.; Wang, L.H.; Li, M.S.; Rui, Y.K. Effects of different environmental conditions on composition of walnut oil. Fresen. Environ. Bull. 2021, 30, 3130–3133. [Google Scholar]
  41. Hou, G.; Ablett, G.R.; Pauls, K.P.; Rajcan, I. Environmental effects on fatty acid levels in soybean seed oil. J. Am. Oil Chem. Soc. 2006, 83, 759–763. [Google Scholar] [CrossRef]
  42. Lin, P.; Wang, K.; Zhou, C.; Xie, Y.; Yao, X.; Yin, H. Seed transcriptomics analysis in Camellia oleifera uncovers genes associated with oil content and fatty acid composition. Int. J. Mol. Sci. 2018, 19, 118. [Google Scholar] [CrossRef] [Green Version]
  43. Huang, J.; Zhang, T.; Zhang, Q.; Chen, M.; Wang, Z.; Zheng, B.; Xia, G.; Yang, X.; Huang, C.; Huang, Y. The mechanism of high contents of oil and oleic acid revealed by transcriptomic and lipidomic analysis during embryogenesis in Carya cathayensis Sarg. BMC Genom. 2016, 17, 113. [Google Scholar] [CrossRef] [Green Version]
  44. Zhao, Y.; Wang, Y.; Huang, Y.; Cui, Y.; Hua, J. Gene network of oil accumulation reveals expression profiles in developing embryos and fatty acid composition in upland cotton. J. Plant Physiol. 2018, 228, 101–112. [Google Scholar] [CrossRef]
  45. Nan, S.; Zhang, L.; Hu, X.; Miao, X.; Han, X.; Fu, H. Transcriptomic analysis reveals key genes involved in oil and linoleic acid biosynthesis during Artemisia sphaerocephala seed development. In. J. Mol. Sci. 2021, 22, 8369. [Google Scholar] [CrossRef]
  46. Yu, S.; Zhang, X.; Huang, L.; Lyu, Y.; Zhang, Y.; Yao, Z.; Zhang, X.; Yuan, J.; Hu, Y. Transcriptomic analysis of α-linolenic acid content and biosynthesis in Paeonia ostii fruits and seeds. BMC Genom. 2021, 22, 297. [Google Scholar] [CrossRef]
  47. Banik, M.; Duguid, S.; Cloutier, S. Transcript profiling and gene characterization of three fatty acid desaturase genes in high, moderate, and low linolenic acid genotypes of flax (Linum usitatissimum L.) and their role in linolenic acid accumulation. Genome 2011, 54, 471–483. [Google Scholar] [CrossRef]
  48. Liao, B.N.; Hao, Y.J.; Lu, J.X.; Bai, H.Y.; Guan, L.; Zhang, T. Transcriptomic analysis of Perilla frutescens seed to insight into the biosynthesis and metabolic of unsaturated fatty acids. BMC Genom. 2018, 19, 213. [Google Scholar] [CrossRef] [Green Version]
  49. Banaś, W.; Sanchez Garcia, A.; Banaś, A.; Stymne, S. Activities of acyl-CoA:diacylglycerol acyltransferase (DGAT) and phospholipid:diacylglycerol acyltransferase (PDAT) in microsomal preparations of developing sunflower and safflower seeds. Planta 2013, 237, 1627–1636. [Google Scholar] [CrossRef] [Green Version]
  50. Ding, M.; Lou, H.; Chen, W.; Zhou, Y.; Zhang, Z.; Xiao, M.; Wang, Z.; Yang, Y.; Yang, L.; Zhang, F.; et al. Comparative transcriptome analysis of the genes involved in lipid biosynthesis pathway and regulation of oil body formation in Torreya grandis kernels. Ind. Crop. Prod. 2020, 145, 112051. [Google Scholar] [CrossRef]
  51. Woodfield, H.K.; Cazenave-Gassiot, A.; Haslam, R.P.; Guschina, I.A.; Wenk, M.R.; Harwood, J.L. Using lipidomics to reveal details of lipid accumulation in developing seeds from oilseed rape (Brassica napus L.). Biochim. Et Biophys. Acta (BBA)—Mol. Cell Biol. Lipids 2018, 1863, 339–348. [Google Scholar] [CrossRef]
  52. Meng, J.; Tang, Y.; Sun, J.; Zhao, D.; Zhang, K.; Tao, J. Identification of genes associated with the biosynthesis of unsaturated fatty acid and oil accumulation in herbaceous peony ‘Hangshao’ (Paeonia lactiflora ‘Hangshao’) seeds based on transcriptome analysis. BMC Genom. 2021, 22, 94. [Google Scholar] [CrossRef] [PubMed]
  53. Siloto, R.M.P.; Findlay, K.; Lopez-Villalobos, A.; Yeung, E.C.; Nykiforuk, C.L.; Moloney, M.M. The accumulation of olesins determines the size of seed oilbodies in Arabidopsis. Plant Cell 2006, 18, 1961–1974. [Google Scholar] [CrossRef] [PubMed] [Green Version]
  54. Wang, W.; Wen, H.; Jin, Q.; Yu, W.; Li, G.; Wu, M.; Bai, H.; Shen, L.; Wu, C. Comparative transcriptome analysis on candidate genes involved in lipid biosynthesis of developing kernels for three walnut cultivars in Xinjiang. Food Sci. Hum. Wellness 2022, 11, 1201–1214. [Google Scholar] [CrossRef]
  55. Mortazavi, A.; Williams, B.A.; Mccue, K.; Schaeffer, L.; Wold, B. Mapping and quantifying mammalian transcriptomes by RNA-Seq. Nat. Methods 2008, 5, 621–628. [Google Scholar] [CrossRef] [PubMed]
  56. Liao, Y.; Smyth, G.K.; Shi, W. featureCounts: An efficient general purpose program for assigning sequence reads to genomic features. Bioinformatics 2014, 30, 923–930. [Google Scholar] [CrossRef] [PubMed] [Green Version]
  57. Bray, N.L.; Pimentel, H.; Melsted, P.; Pachter, L. Near-optimal probabilistic RNA-seq quantification. Nat. Biotechnol. 2016, 34, 525–527. [Google Scholar] [CrossRef]
  58. Love, M.I.; Huber, W.; Anders, S. Moderated estimation of fold change and dispersion for RNA-seq data with DESeq2. Genome Biol. 2014, 15, 550. [Google Scholar] [CrossRef] [Green Version]
  59. Benjamini, Y.; Hochberg, Y. Controlling the false discovery rate: A practical and powerful approach to multiple testing. J. R. Stat. Society. Ser. B Methodol. 1995, 57, 289–300. [Google Scholar] [CrossRef]
  60. Yu, G.; Wang, L.; Han, Y.; He, Q. ClusterProfiler: An R package for comparing biological themes among gene clusters. OMICS: A J. Integr. Biol. 2012, 16, 284–287. [Google Scholar] [CrossRef]
  61. Livak, K.J.; Schmittgen, T.D. Analysis of relative gene expression data using Real-Time quantitative PCR and the 2−ΔΔCT Method. Methods 2001, 25, 402–408. [Google Scholar] [CrossRef]
Figure 1. Characterization of walnut fruit and seed kernel development. (A) Morphological changes of fruit and walnut kernel growth and development. Walnut fruits were collected on 19 July, 26 July, 9 August, 11 September, 20 September, designated as G1, G2, G3, G4 and G5, respectively. The longitudinal and transverse cuts of walnut fruits are shown in the above and below panels. (B) Dynamic changes in single fruit fresh weight, nut and kernel weight of walnuts at different developmental stages. Vertical bars represent standard errors (SE) in all graphs. (C) Dynamic changes in the vertical diameter and transverse diameter of the walnut fruits at different developmental stages. (D) Dynamic changes in oil content of the walnut seed kernels during seed development.
Plants 11 03207 g001
Figure 2. Preliminary analysis of the transcriptome of walnut seed kernels. (A) Cluster heat map of differentially expressed genes (DEGs) at five developmental stages. (B) Number of DEGs identified in the developing walnut seed kernels compared to G1. (C) The Venn diagram of DEGs from four groups. (D) The four cluster groups with different gene expression profiles.
Plants 11 03207 g002
Figure 3. Bubble diagram of enrichment of KEGG pathway. The top 20 enriched KEGG pathways of G2 vs. G1 (A), G3 vs. G1 (B), G4 vs. G1 (C), G5 vs. G1 (D). X axis represents the enrichment ratio (calculating formula for Rich thewire = Term Candidate Gene Num/Term Gene Num). Y axis represents the KEGG pathway, the size of the dot represents the numbers of DEGs. The color of each dot represents the Qvalue; red to purple represent the significance of enrichment.
Plants 11 03207 g003
Figure 4. Heat maps of lipid biosynthesis, oil body and TF genes in the developing walnut seed kernels. (A) Expression patterns of DEGs related to fatty acid biosynthesis. (B) Heat map of DEGs involved in fatty acid elongation. (C) Heat map of DEGs involved in fatty acid desaturation. (D) Heat map of DEGs involved in TAG assembly. (E) Heat map of DEGs related to oil body. (F) Heat map of differentially expressed HSP genes. (G) Heat map of differentially expressed HSF genes. Abbreviations: ACCase, acetyl−CoA carboxylase; BCCP, biotin carboxyl carrier protein; α−CT, α−carboxyltransferase; ACP, acyl carrier protein; MAT, malonyl−CoA ACP S−malonytransferase; KAS, 3−oxoacyl−ACP synthase; KAR, 3−oxoacyl−ACP reductase; HAD, 3−hydroxyacyl−ACP dehydratase; EAR, enoyl−ACP reductase; FAT, fatty acyl−ACP thioesterase; LACS, long chain acyl−CoA; KCS, 3−ketoacyl−CoA synthase; KCR, very−long−chain 3−oxoacyl−CoA reductase; HCD/PAS, very−long−chain (3R)−3−hydroxyacyl−CoA dehydratase; ECR, very−long−chain enoyl−CoA reductase; SAD, stearoyl−ACP desaturase; FAD, fatty acid desaturase; GPAT, glycerol−3−phosphate acyltransferase; LPLAT, lysophospholipid acyltransferase; PAP, phosphatidate phosphatase; PLA2, phospholipase A2; DGAT, diacylglycerol O−acyltransferase; PDAT, phospholipid: diacylglycerol acyltransferase; PDCT, phosphatidylcholine:diacylglycerol cholinephosphotransferase; TAG, triacylglycerol.
Plants 11 03207 g004
Figure 5. qRT−PCR validation of DEGs related to lipid biosynthesis and metabolism in walnut. (A) Comparison of the expression levels determined by RNA−seq and qRT−PCR. Symbols represent mean values and short vertical lines indicate SE (n = 3). (B) Correlation analysis of the RNA−seq (FKPM) and qRT−PCR (2−∆∆ct) results. The results were calculated using a log2 fold−change measurement. Pearson’s r indicates the Pearson correlation coefficient. ** indicates 0.01 significance.
Plants 11 03207 g005
Figure 6. WGCNA of genes in developing walnut seed kernels. (A) Gene co-expression modules detected by WGCNA. The clustering dendrogram of the genes across all the samples exhibits dissimilarities based on topological overlap, together with the original module colors (dynamic tree cut) and assigned merged module colors (merged dynamic). (B) Primary co-expression network for hub genes for AP2/ERF (109006724) and bHLH (108987327). Blue ellipses represent gene, yellow ellipses represent TF. (C) Co-expression network between TFs and oil biosynthesis communication-related genes in blue module. Red ellipses represent hub genes. The edge width represents the weight value between the two nodes.
Plants 11 03207 g006
Table 1. The fatty acid composition and content in mature seed kernels (%, w/w).
Fatty Acid TypeContent
Saturated (SFA)Myristic acid (14:0)0.0220 ± 0.0007
Palmitic acid (16:0)6.4067 ± 0.1109
Heptadecanoic acid (17:0)0.0539 ± 0.0007
Stearic acid (18:0)2.0400 ± 0.0829
Arachidic acid (20:0)0.0863 ± 0.0075
Docosanoic acid (22:0)0.0429 ± 0.0069
Tetracosanoic acid (24:0)0.0195 ± 0.0138
Unsaturated
(UFA)
Monounsaturated
(MUFA)
Palmitoleic acid (16:1)0.1217 ± 0.0074
Heptadecenoic acid (17:1)0.0320 ± 0.0023
Oleic acid (18:1)19.9333 ± 0.4190
11-Eicosenoic acid (20:1)0.1753 ± 0.0146
Erucic acid (22:1)0.0270 ± 0.0259
Nervonic acid (24:1)0.0150 ± 0.0111
Polyunsaturated
(PUFA)
Linoleic acid (18:2)57.6667 ± 0.7717
Linolenic acid (18:3)13.3333 ± 0.2867
Eicosadienoic acid (20:2)0.0261 ± 0.0015
SFA 8.6713 ± 0.1688
UFA 91.3304 ± 0.1675
MUFA 20.3043 ± 0.4147
PUFA 71.0261 ± 0.5715
MUFA/SFA 2.3417 ± 0.0296
PUFA/SFA 8.1952 ± 0.2219
MUFA/PUFA 0.2859 ± 0.0081
Table 2. The numbers of the DEGs in 15 lipid metabolism KEGG pathways.
KEGGIDDescriptionStageGeneRatioCountUpDown
ath00061Fatty acid biosynthesisG2 vs. G110/8531037
G3 vs. G127/1735271116
G4 vs. G137/219137829
G5 vs. G150/308050644
ath00062Fatty acid elongationG2 vs. G17/853725
G3 vs. G115/173515411
G4 vs. G117/219117512
G5 vs. G123/308023914
ath00100Steroid biosynthesisG2 vs. G114/85314410
G3 vs. G121/173521615
G4 vs. G126/219126620
G5 vs. G135/308035827
ath00561Glycerolipid metabolismG2 vs. G121/853211011
G3 vs. G129/1735291415
G4 vs. G135/2191351421
G5 vs. G144/3080442024
ath00564Glycerophospholipid metabolism G2 vs. G119/85319910
G3 vs. G137/1735371522
G4 vs. G146/2191461828
G5 vs. G160/3080602535
ath00590Arachidonic acid metabolism G2 vs. G16/853642
G3 vs. G19/1735954
G4 vs. G110/21911073
G5 vs. G116/308016115
ath00592alpha-Linolenic acid metabolism G2 vs. G111/8531174
G3 vs. G121/1735211110
G4 vs. G121/219121138
G5 vs. G133/3080331914
ath01040Biosynthesis of unsaturated fatty acidsG2 vs. G17/853734
G3 vs. G115/17351578
G4 vs. G113/21911367
G5 vs. G118/308018513
ko00071Fatty acid degradationG2 vs. G116/85316610
G3 vs. G126/1735261016
G4 vs. G129/2191291118
G5 vs. G143/3080432221
ko00591Linoleic acid metabolismG2 vs. G12/853220
G3 vs. G12/1735220
G4 vs. G14/2191431
G5 vs. G17/3080752
ko00600Sphingolipid metabolismG2 vs. G12/853202
G3 vs. G17/1735716
G4 vs. G110/21911046
G5 vs. G114/30801477
ko00073Cutin, suberine and wax biosynthesisG2 vs. G12/853211
G3 vs. G15/1735532
G4 vs. G15/2191523
G5 vs. G17/3080743
ko00565Ether lipid metabolismG2 vs. G16/853624
G3 vs. G19/1735918
G4 vs. G114/21911459
G5 vs. G121/308021813
ko00072Synthesis and degradation of ketone bodiesG2 vs. G12/853220
G3 vs. G14/1735422
G4 vs. G14/2191422
G5 vs. G16/3080633
ko01212Fatty acid metabolismG2 vs. G118/85318612
G3 vs. G143/1735431726
G4 vs. G150/2191501337
G5 vs. G169/3080691752
Note: Up: upregulated; DOWN: downregulated; GeneRatio: the ratio of the number of differential genes on the GO number to the total number of differential genes.
Publisher’s Note: MDPI stays neutral with regard to jurisdictional claims in published maps and institutional affiliations.

