2.3. Soil Chemical Properties
Total dissolved solids, which is usually used to estimate the proportion of dissolved organic materials including organic matter and salts, was significantly (
p < 0.001) higher for the AN-soil by more than 208% and 463% compared to that of the BI-soil and the C-soil, respectively (
Table 1). Electric conductivity and salinity, which are indicators of soil fertility status, were significantly (
p < 0.001) high in the AN-soils., i.e., ca. 204% and ca. 211% compared to the BI-soil and ca. 476% and ca. 476% compared to the C-soil, respectively (
Table 1). These were expected due to the high SOM in the AN-soil followed by the BI-soil. This is because SOM is a reservoir of soil nutrients [
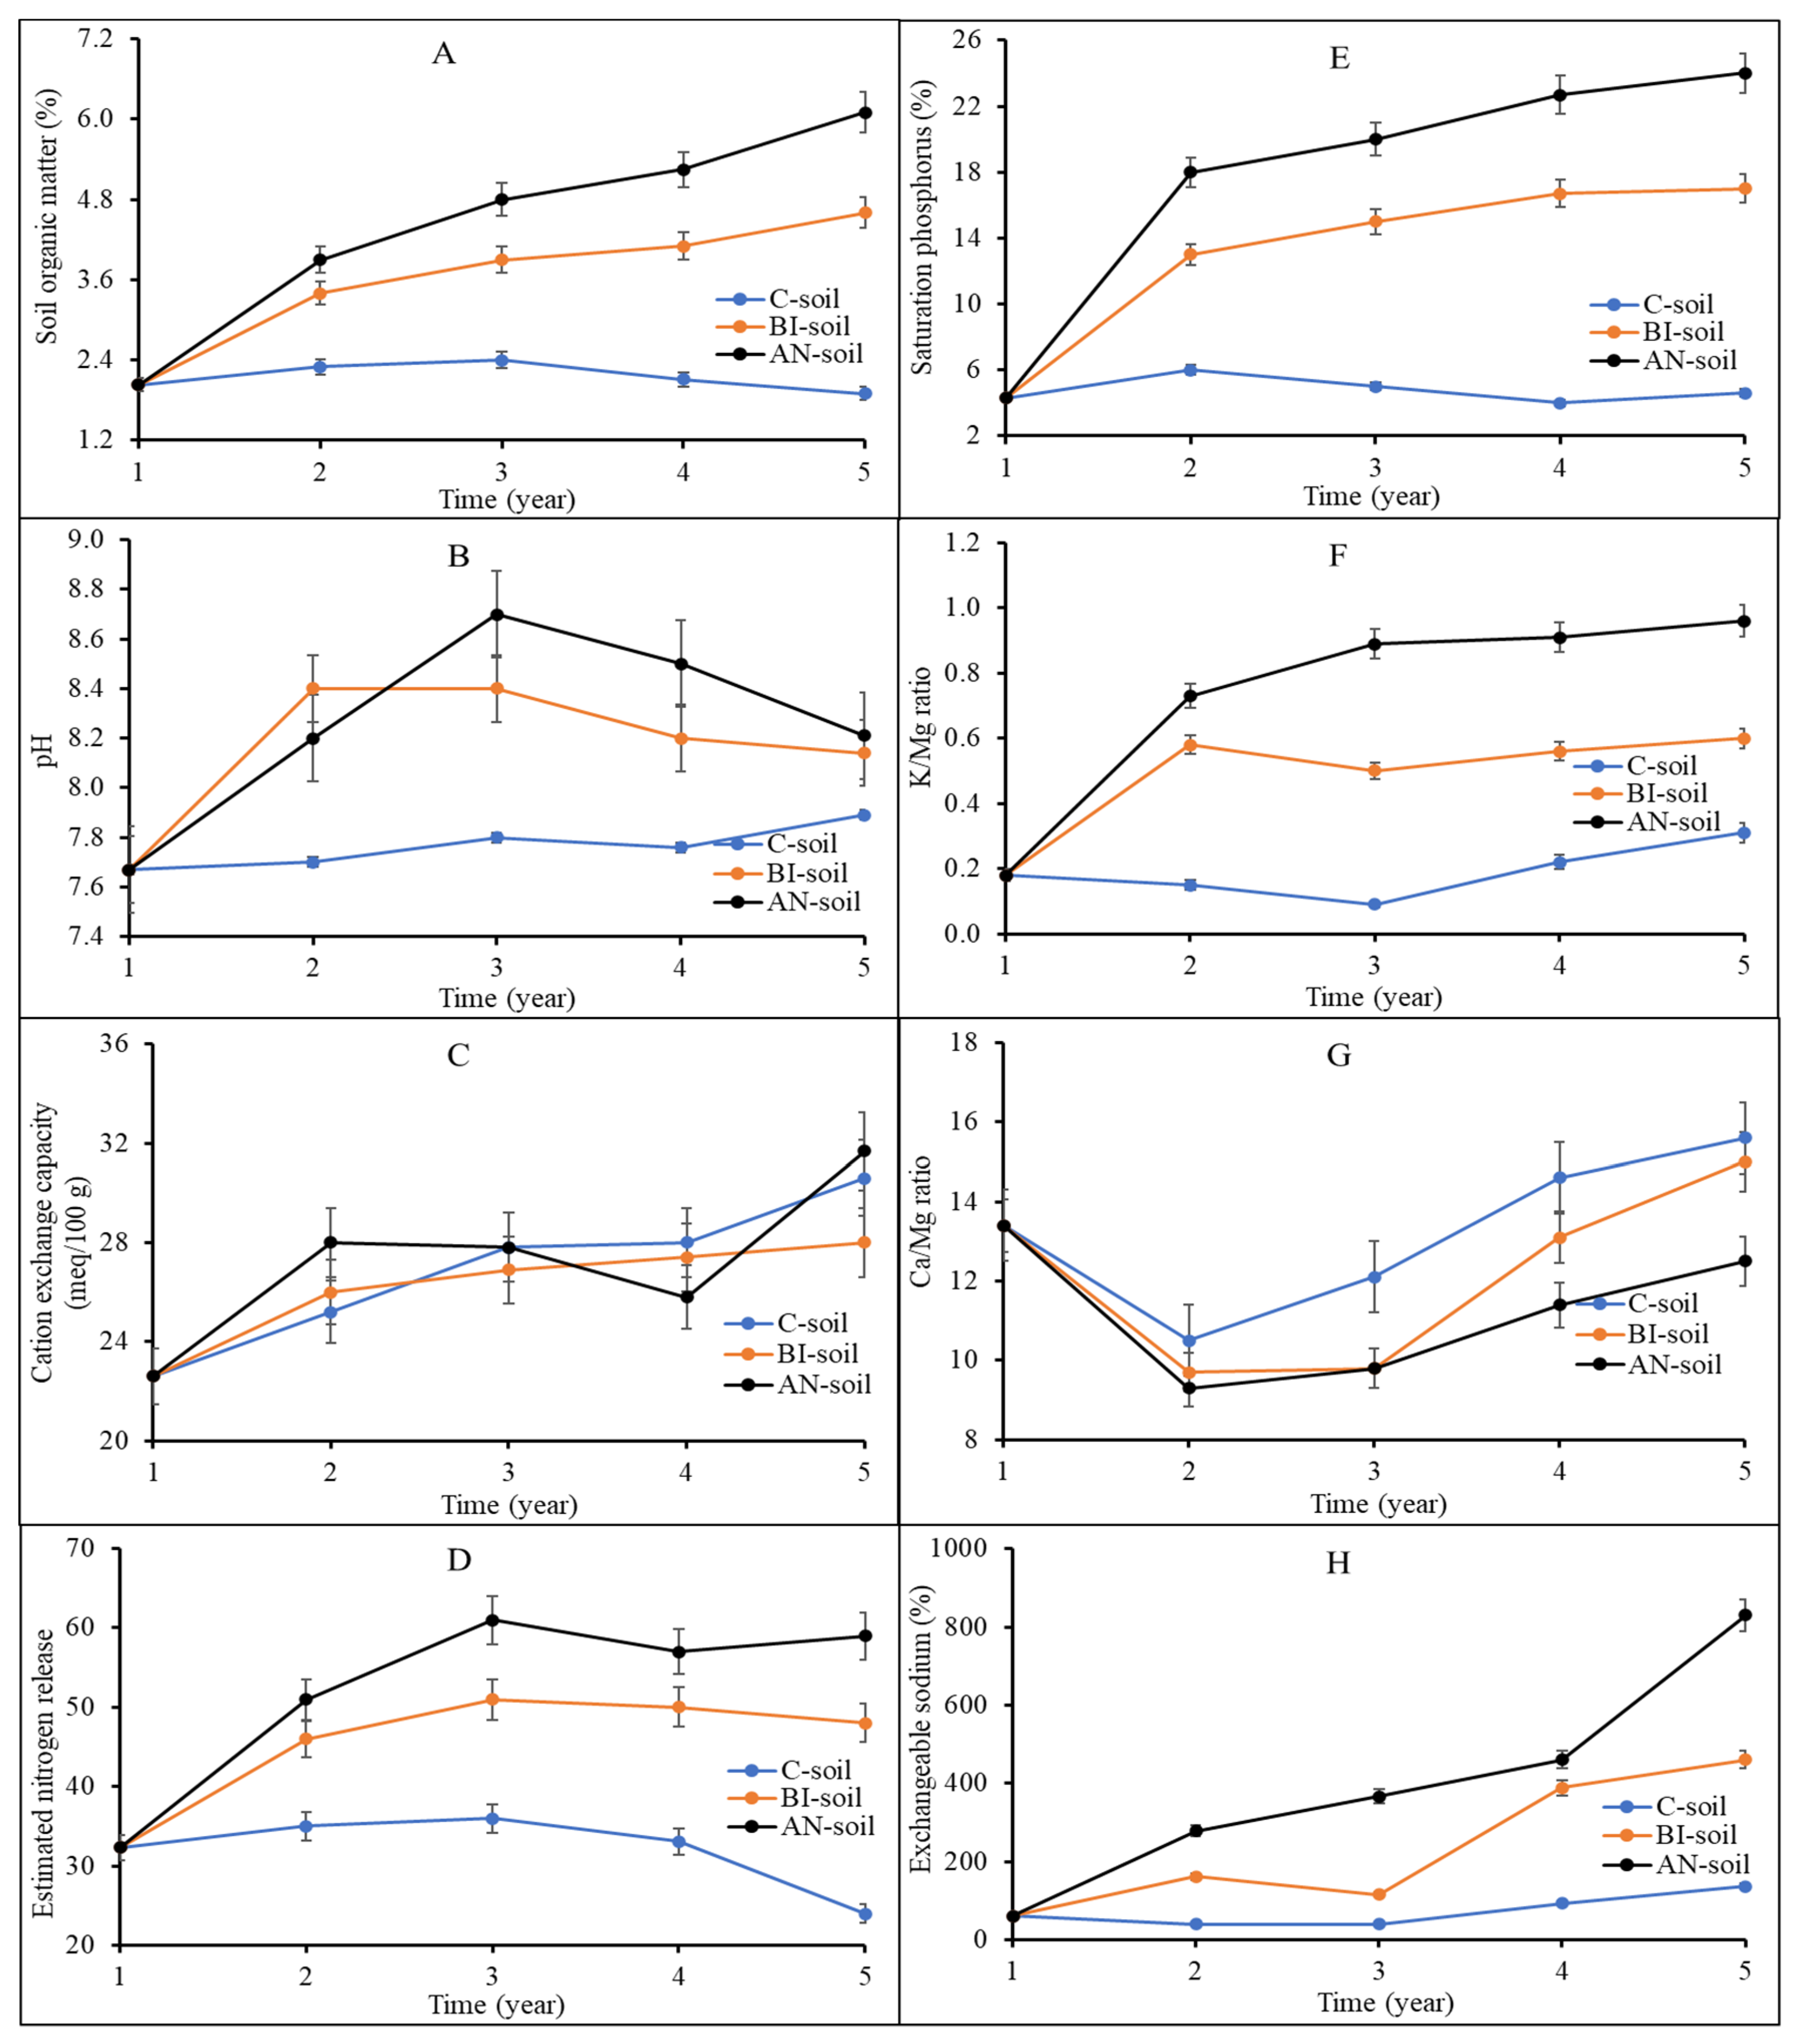
14]. The chemistry of the soil was influenced by continuous and long-term MSW compost application (
Figure 1A–H). The SOM in the C-soil increased slightly from Year 1 up to Year 3 before it declined from 2.4% to 1.9% (
Figure 1A). There was a sharp increase in AN-soil and BI-soil SOM from Year 1 with a dip in Year 4 before rising again. The dip in Year 4 was due to the late application of compost in Year 3 because of a delay in MSW compost delivery for the study. SOM of the AN-soil at Year 5 was significantly (
p < 0.01) increased by ca. 33% and ca. 217% compared to those of the BI-soil and the C-soil, respectively. High SOM is associated with high soil organic carbon (SOC) and ultimately, desirable environmental and soil health [
31,
32]. In 5 years, the AN-soil pH was in general higher (i.e., between lower-upper difference) then BI-soil and C-soil. Soil pH increased from 7.7 in Year 1 to a range between 8.4 (BI-soil) and 8.7 (AN-soil) in Year 3, before declining slightly to an average of 8.15 in Year 5 (
Figure 1B). The increase in AN-soil and BI-soil pH could be due to the intrinsically high Na content of the compost, which is supported by the corresponding increases in AN-soil and BI-soil electric conductivity and salinity (
Table 1). The increase in pH can also be attributed to the release of hydroxyl ions from the high organic matter AN-soil and BI-soil, which declined after Year 3. This is because MSW compost has high organic matter content with negatively charged sites that can bind or release hydroxyl ions in acidic and basic soils, respectively to buffer soil acidity [
33]. There was a slight increase in C-soil pH from Year 4, which can be ascribed to possible base cations naturally associated with Orthic Black Chernozem solum on moderate to strong calcareous, loamy morainal till of limestone, granitic and shale origin (Newdale series) of the experimental site (MAFRD, 2010). This is evident in the highest Ca and Mg levels in C-soil (
Figure 1F,G).
The inherent capacity of the soil particles to adsorb cations (i.e., CEC) was not altered by compost application within the first 3 years of the study (
Figure 1C). The AN-soil had a higher CEC compared to the BI-soil in Year 5. There was a dip in AN-soil CEC in Year 4, which was not significantly (
p > 0.05) different from those of BI-soil and C-soil and cannot be readily explained. Cations like K
+, Na
+, Ca
2+ and Mg
2+ are retained on negatively charged soil components such as organic matter. According to Solly et al. [
34], exchangeable Ca contributes the most (i.e., 59–83%) to CEC at pH > 5.5 with a strong positive relationship existing between CEC and SOM. In the present study, the exchangeable Ca increased from 19.41 meq/100 g from Year 1 to 23.67 and 23.99 and 21.85 meq/100 g in the AN-, BI-, and C-soils, respectively, in Year 5 (data not presented). Therefore, the trend of the AN-soil CEC compared to the BI-soil can be ascribed to the pH range (
Figure 1B) and its high SOM (
Figure 1A) and exchangeable Ca (
Table 2).
Total nitrogen (N) was highly increased in the AN-soil by ca. 149% and ca. 390% more than the BI-soil and the C-soil, respectively (
Table 2). Of particular interest was the high estimated nitrogen release (ENR) in the AN-soil followed by the BI-soil (
Figure 1D). ENR is a critical index for the estimation of N availability to plants in the next growing season. Typically, nutrients are slowly released from compost due to slow microbial decomposition and mineralization processes. ENR of the C-soil progressively declined while compost application increased ENR, especially in the AN-soil (
Figure 1D). The AN-soil ENR was ca. 23% more than that of the BI-soil from Years 3–5; and ca. 69% and 146% more than the C-soil at Years 3–4 and Year 5, respectively.
The other major plant required nutrient elements, i.e., P, K, Mg and S were significantly (
p < 0.05) highest in AN-soil followed by BI-soil and the lowest in the C-soil (
Table 2). This is expected due to the variations in frequency of MSW compost addition and the resultant differences in soil organic matter content and chemical indices as shown in
Table 1. Besides, the trends in percentage P saturation (Psat%) (
Figure 1E) and K/Mg ratio (
Figure 1F) were similar. That is, AN-soil > BI-soil > C-soil. The Psat% ranged from 4–24%, 4–17% and 4–6% for the AN-soil, BI-soil and C-soil, respectively. Rheault [
35] found a threshold range of ca. 6–18% for Manitoba soils with the different types of soil. Therefore, the addition of MSW compost increased Psat% to a maximum (BI) or exceeded the maximum (AN) threshold. Psat% is a function of soil Ca, Fe and Al contents, and an Indicator for environmental risk assessment [
36]. The Psat% seemed to level off after Year 3, which suggested less environmental risk, particularly with the BI-soil compared to the AN-soil. This will require further investigation to ensure safe level of soil P for such an AN-soils. Rheault [
35] also explained that stabilization of soil P occurs over time leading to a significant reduction in extractable P. We found that exchangeable K and Mg did not significantly (
p > 0.05) change in the soils after Year 2 (data not presented). Exchangeable K and Mg in the C-soil changed from 0.41–0.37 meq/100 g and 2.76–2.12 meq/100 g in Years 1 and 5, respectively. This can be attributed to the lack of soil amendment and continuous soil nutrient depletion. For the AN- and BI-soils, exchangeable K was increased from 0.41 meq/100 g in Year 1 to 2.77 and 2.09 meq/100 g in Year 2, after which it did not change significantly (
p > 0.05). Similarly, exchangeable Mg remained the same throughout the study after increasing from 2.76 meq/100 g in Year 1 to 3.78 meq/100 g for the AN-soil and 3.41 meq/100 g for the BI-soil, respectively, in Year 2. These results suggested that MSW compost amendment increased K and Mg availability to plants compared to the control. However, these cations remain the same due to consistency of crop species and MSW compost, i.e., compost type, amount, and time of application. The soil K/Mg ratio was less than one over the entire study period irrespective of the treatment (
Figure 1F). This suggested inadequate K for plant use at time of soil sampling. A desirable soil K/Mg ratio is between 2–10. There was a sharp decline in Ca/Mg ratio in Year 2 but rose almost linearly with the highest increase recorded in the AN-soil followed by the BI-soil and then the C-soil (
Figure 1G). The high Ca/Mg ratio in AN-soil suggested improved soil structure, and improved porosity and aeration. An exchangeable sodium percentage (ESP) of more than 10 suggests sodic soils. Overall, exchangeable Na was increased in the AN-soil and the BI-soil, which shows that the application of MSW compost increased soil sodicity (
Figure 1H), especially in the AN-soil. The general trend for the soil macro-elements P, K, Mg and Ca was AN-soil > BI-soil > C-soil (
Table 2). A similar trend was observed for the soil micro-elements sulphur (S), boron (B), iron (Fe), manganese (Mn), molybdenum (Mo), sodium (Na), copper (Cu) and zinc (Zn). However, soil content of cobalt (Co), chromium (Cr) and nickel (Ni) did not change (
Table 2), irrespective of the differences in soil treatment. This suggested that soil amendment with this MSW compost will not have any negative environmental impact.
2.4. Soil Microbial Communities
Overall, Basidiomycota was the most relatively abundant fungal phylum found in the microbiome in all the soils, and it was represented by ca. 42% of all ITS reads (
Supplementary Table S4) and contained 24%, 11% and 6% of the ITS reads annotated as
Tremellomycetes,
Agaricomycetes, and
Ustilaginomycetes, respectively.
Mortierellomycota were the other most abundant phyla represented by 42% of all the ITS reads. The ITS reads annotated as
Mortierellomycetes.
Mortierellales,
Filobasidiales,
Cystofilobasidiales,
Agaricales, and
Ustilaginales were the most abundant fungal orders represented by 41%, 15%, 9%, 9%, and 5%, respectively. On the other hand,
Actinobacteria,
Proteobacteria,
Acidobacteria,
Chloroflexi, and
Bacteroidetes were the most abundant bacterial taxa and were represented by 35%, 23%, 11%, 11% and 5%, respectively (
Supplementary Table S4). Based on total percentage reads, the most abundant bacterial taxa were
Rhizobiales (10% of total reads),
Rubrobacterales (7% of total reads),
Acidobacteria Subgroup 6 (6% of total reads),
Propionibacteriales (4% of total reads), and
Gaiellales (4% of total reads).
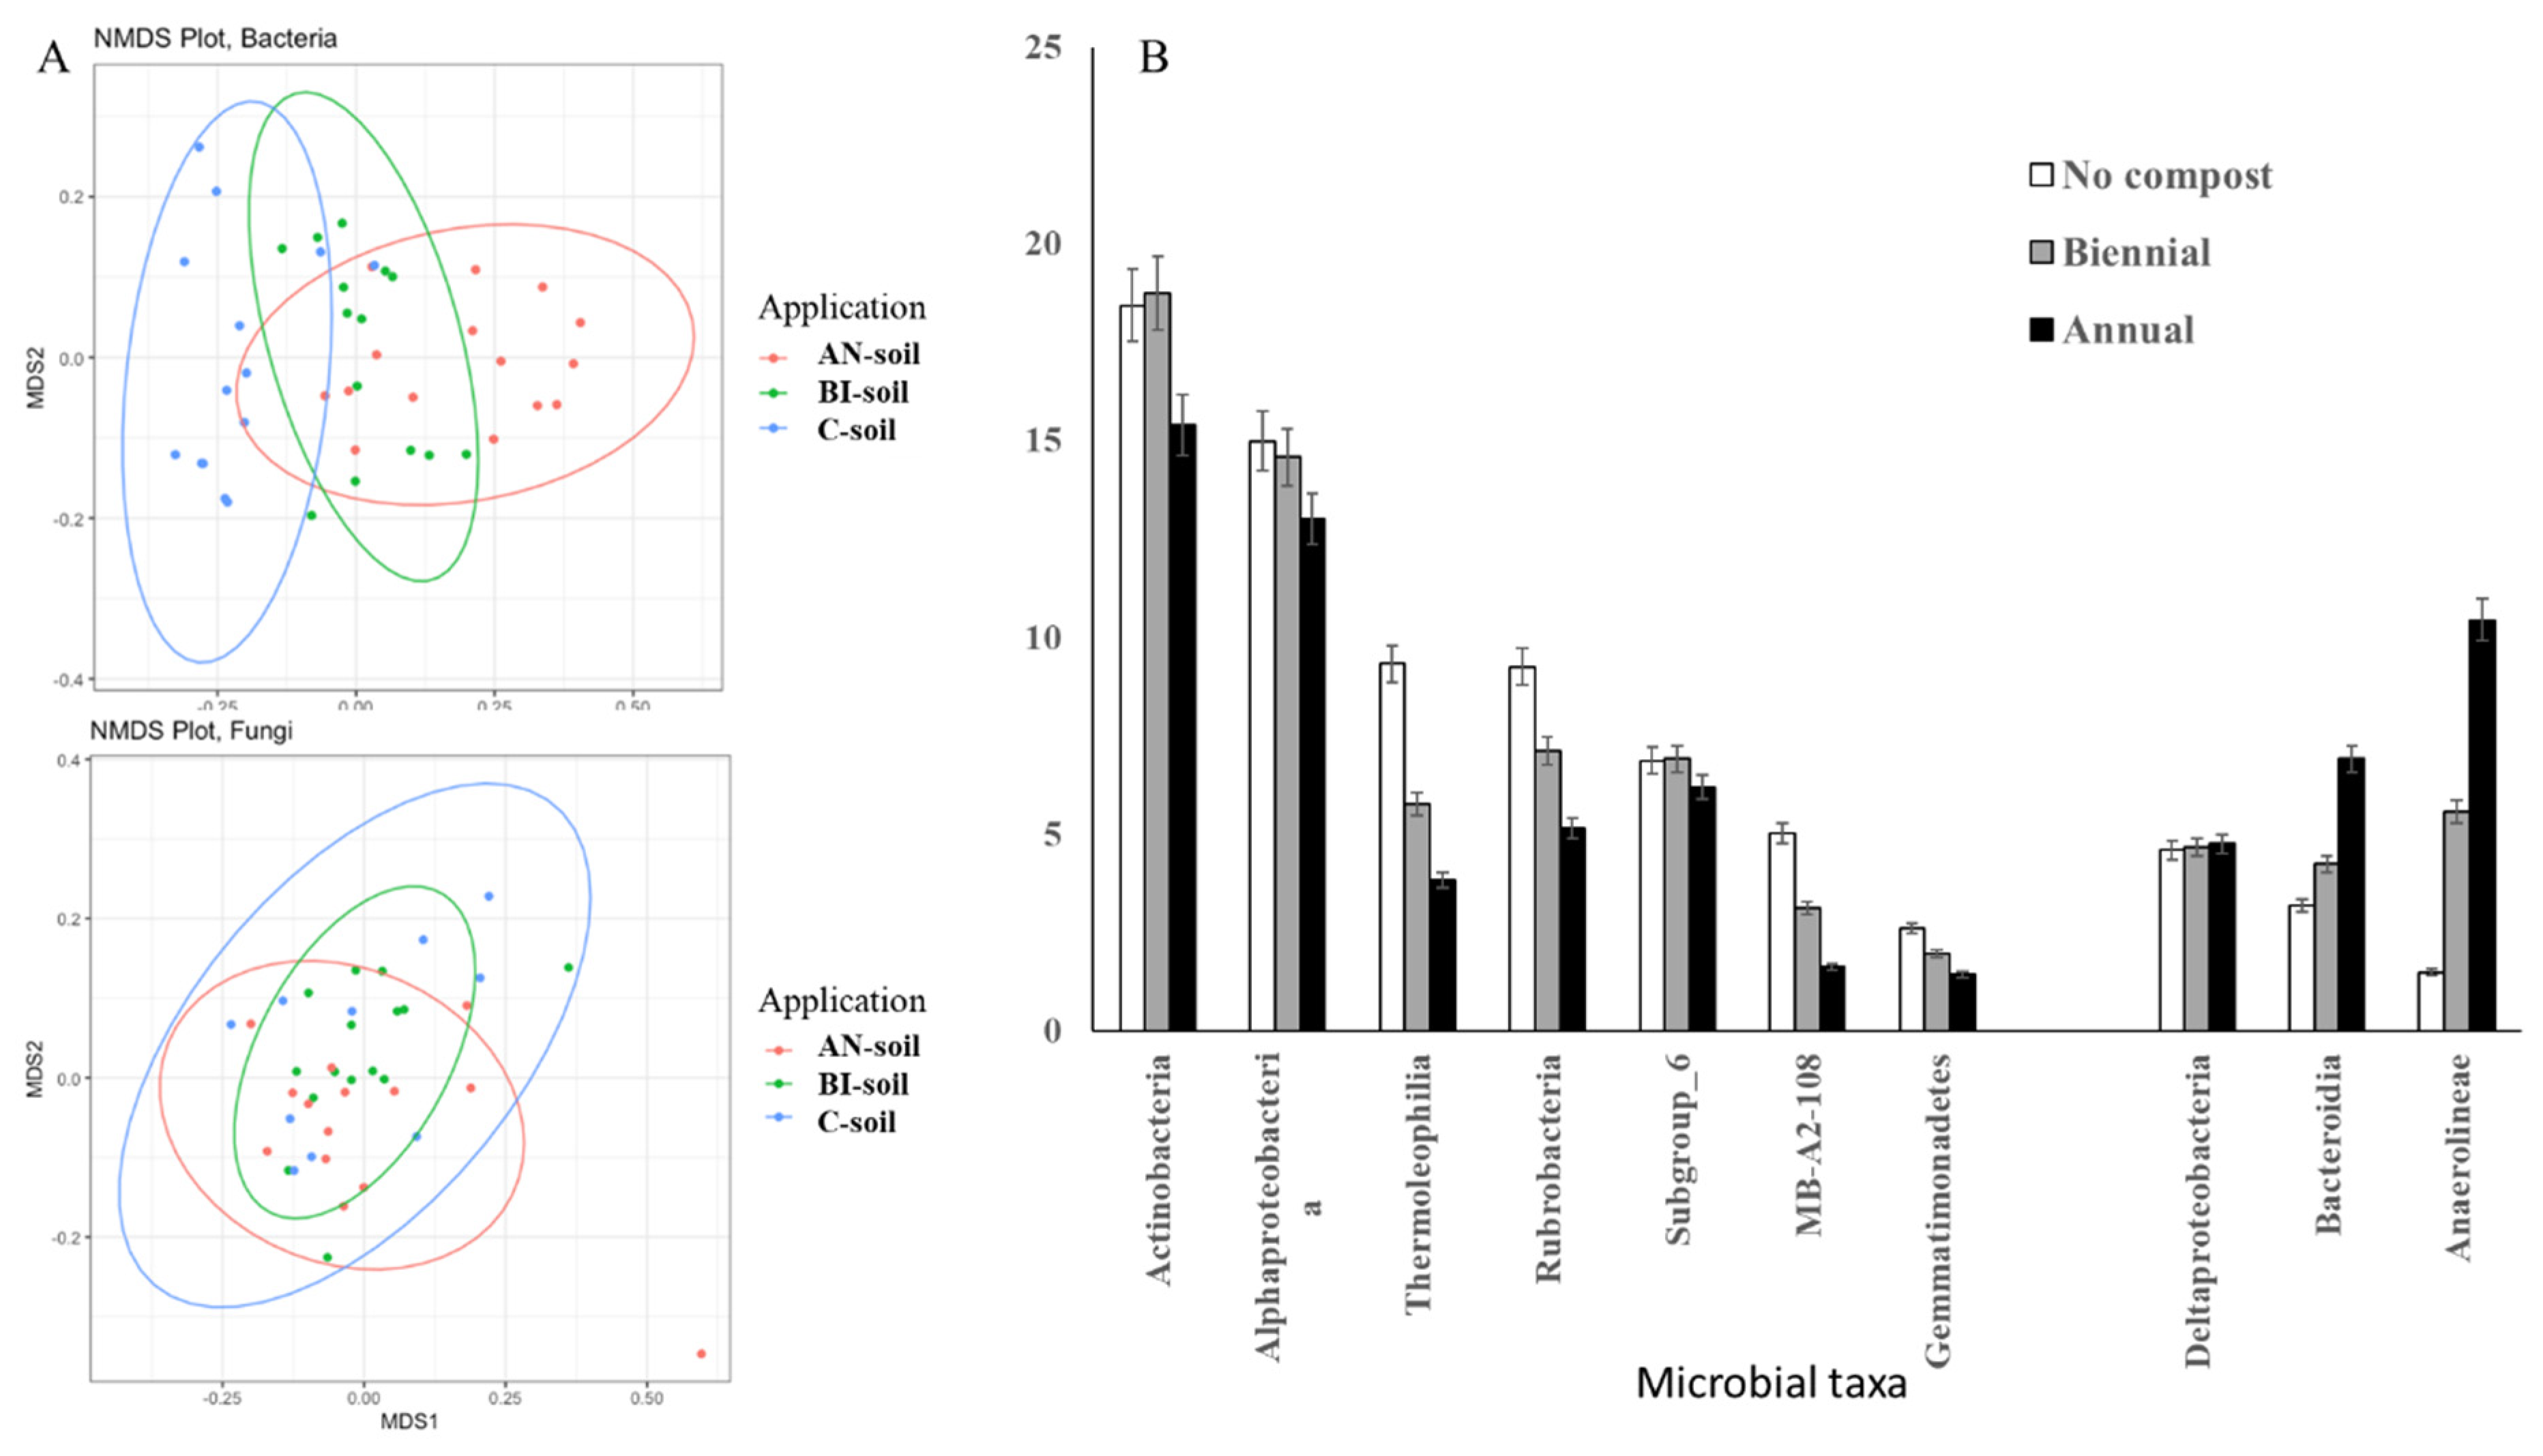
In general, compost amendments significantly (
p < 0.05) influenced soil bacterial community structure and diversity (
Figure 2,
Supplementary Table S5). Unlike bacteria, fungi communities were less affected by the MSW compost application (
Figure 2A).
Approximately 44% of bacterial community variation could be attributed to compost amendment. Moreover, compost significantly (
p < 0.001) increased the relative number of observed bacterial features and Shannon diversity (
Table 3). More specifically, several Actinobacteria classes such as Actinobacteria, Thermoleophilia, Rubrobacteria, Subgroup 6, and MB-A2-108 were less abundant in compost amended soils, i.e., AN- and BI-soils (
Figure 2B). The relative abundances of Alphaproteobacterial and Gemmatimonadetes were also reduced by compost application. On the other hand, Deltaproteobacteria, Bacteroidetes Bacteroidia, and Chloroflexi Anaerolineae were overrepresented in compost amended compared to the C-soil (
Figure 2B).
The relative abundances of
Alphaproteobacterial and
Gemmatimonadetes were also reduced by compost application. On the other hand,
Deltaproteobacteria,
Bacteroidetes Bacteroidia and
Chloroflexi Anaerolineae were overrepresented in compost amended compared to the C-soil (
Figure 2B). Our previous study showed that
Bacteroidetes were among the 10 most abundant taxa in MSW compost sampled across Nova Scotia composting facilities [
37]. Therefore,
Bacteroidetes class
Bacteroidia (
Figure 2B) might be enriched in the MSW compost before adding to the soil resulting in the increase in relative abundance of this class in compost treated soils. The relative abundances of the two most abundant microbial taxa in our previous compost study
Alphaproteobacterial and
Actinobacteria [
37], were reduced with frequent compost application in the present study (
Figure 2B).
As such, the observed changes in microbial abundances could be due to promotion or repression of soil microbial growth due to differences in compost application frequency. Furthermore, the present results showed that bacterial metabolic pathways were influenced by frequency of compost application, which will be discussed later in this report. Specifically, compost application significantly (
p < 0.01) increased fungal observed features, but not Shannon diversity (
Table 3). Approximately, 9% of variations in fungal community can be attributed to the MSW compost application (
Supplementary Table S5). We also did not detect any fungal classes differentially represented between treated and untreated soils. This agreed with our previous report that prokaryotes and eukaryotes differ in their responses to environmental factors [
38].
To understand the effect of compost application on microbiome function, we extrapolated functional profile of bacterial community based on 16S rRNA marker gene using PICRUS2 software. Non-metric multidimensional scaling identified visual differences in functional profiles between bacterial community from soils with different compost application frequency. Additionally, ca. 38% KO and ca. 40% pathway of functional variation was attributed to differences in the frequency of compost application (
Table 4).
When functional profiles of bacterial communities from the AN-soil and the BI-soil were combined and compared to the C-soil, ca. 23% KO and 26% pathway of functional variations were attributed to the former. With reference to C-soil, the BI-soil had lower effect on functional variation., i.e., ca. 15% KO and ca. 18% pathway as compared to those for the AN-soil., i.e., ca. 43% KO and ca. 46% pathway. Interestingly, functional profiles of bacterial communities from the AN-soil and the BI-soil also differed significantly (p < 0.001). Obviously, ca. 28% KO and ca. 27% pathway of functional variation was explained by the annual or the biennial compost application compared to the control.
2.5. Soil Microbiome Function
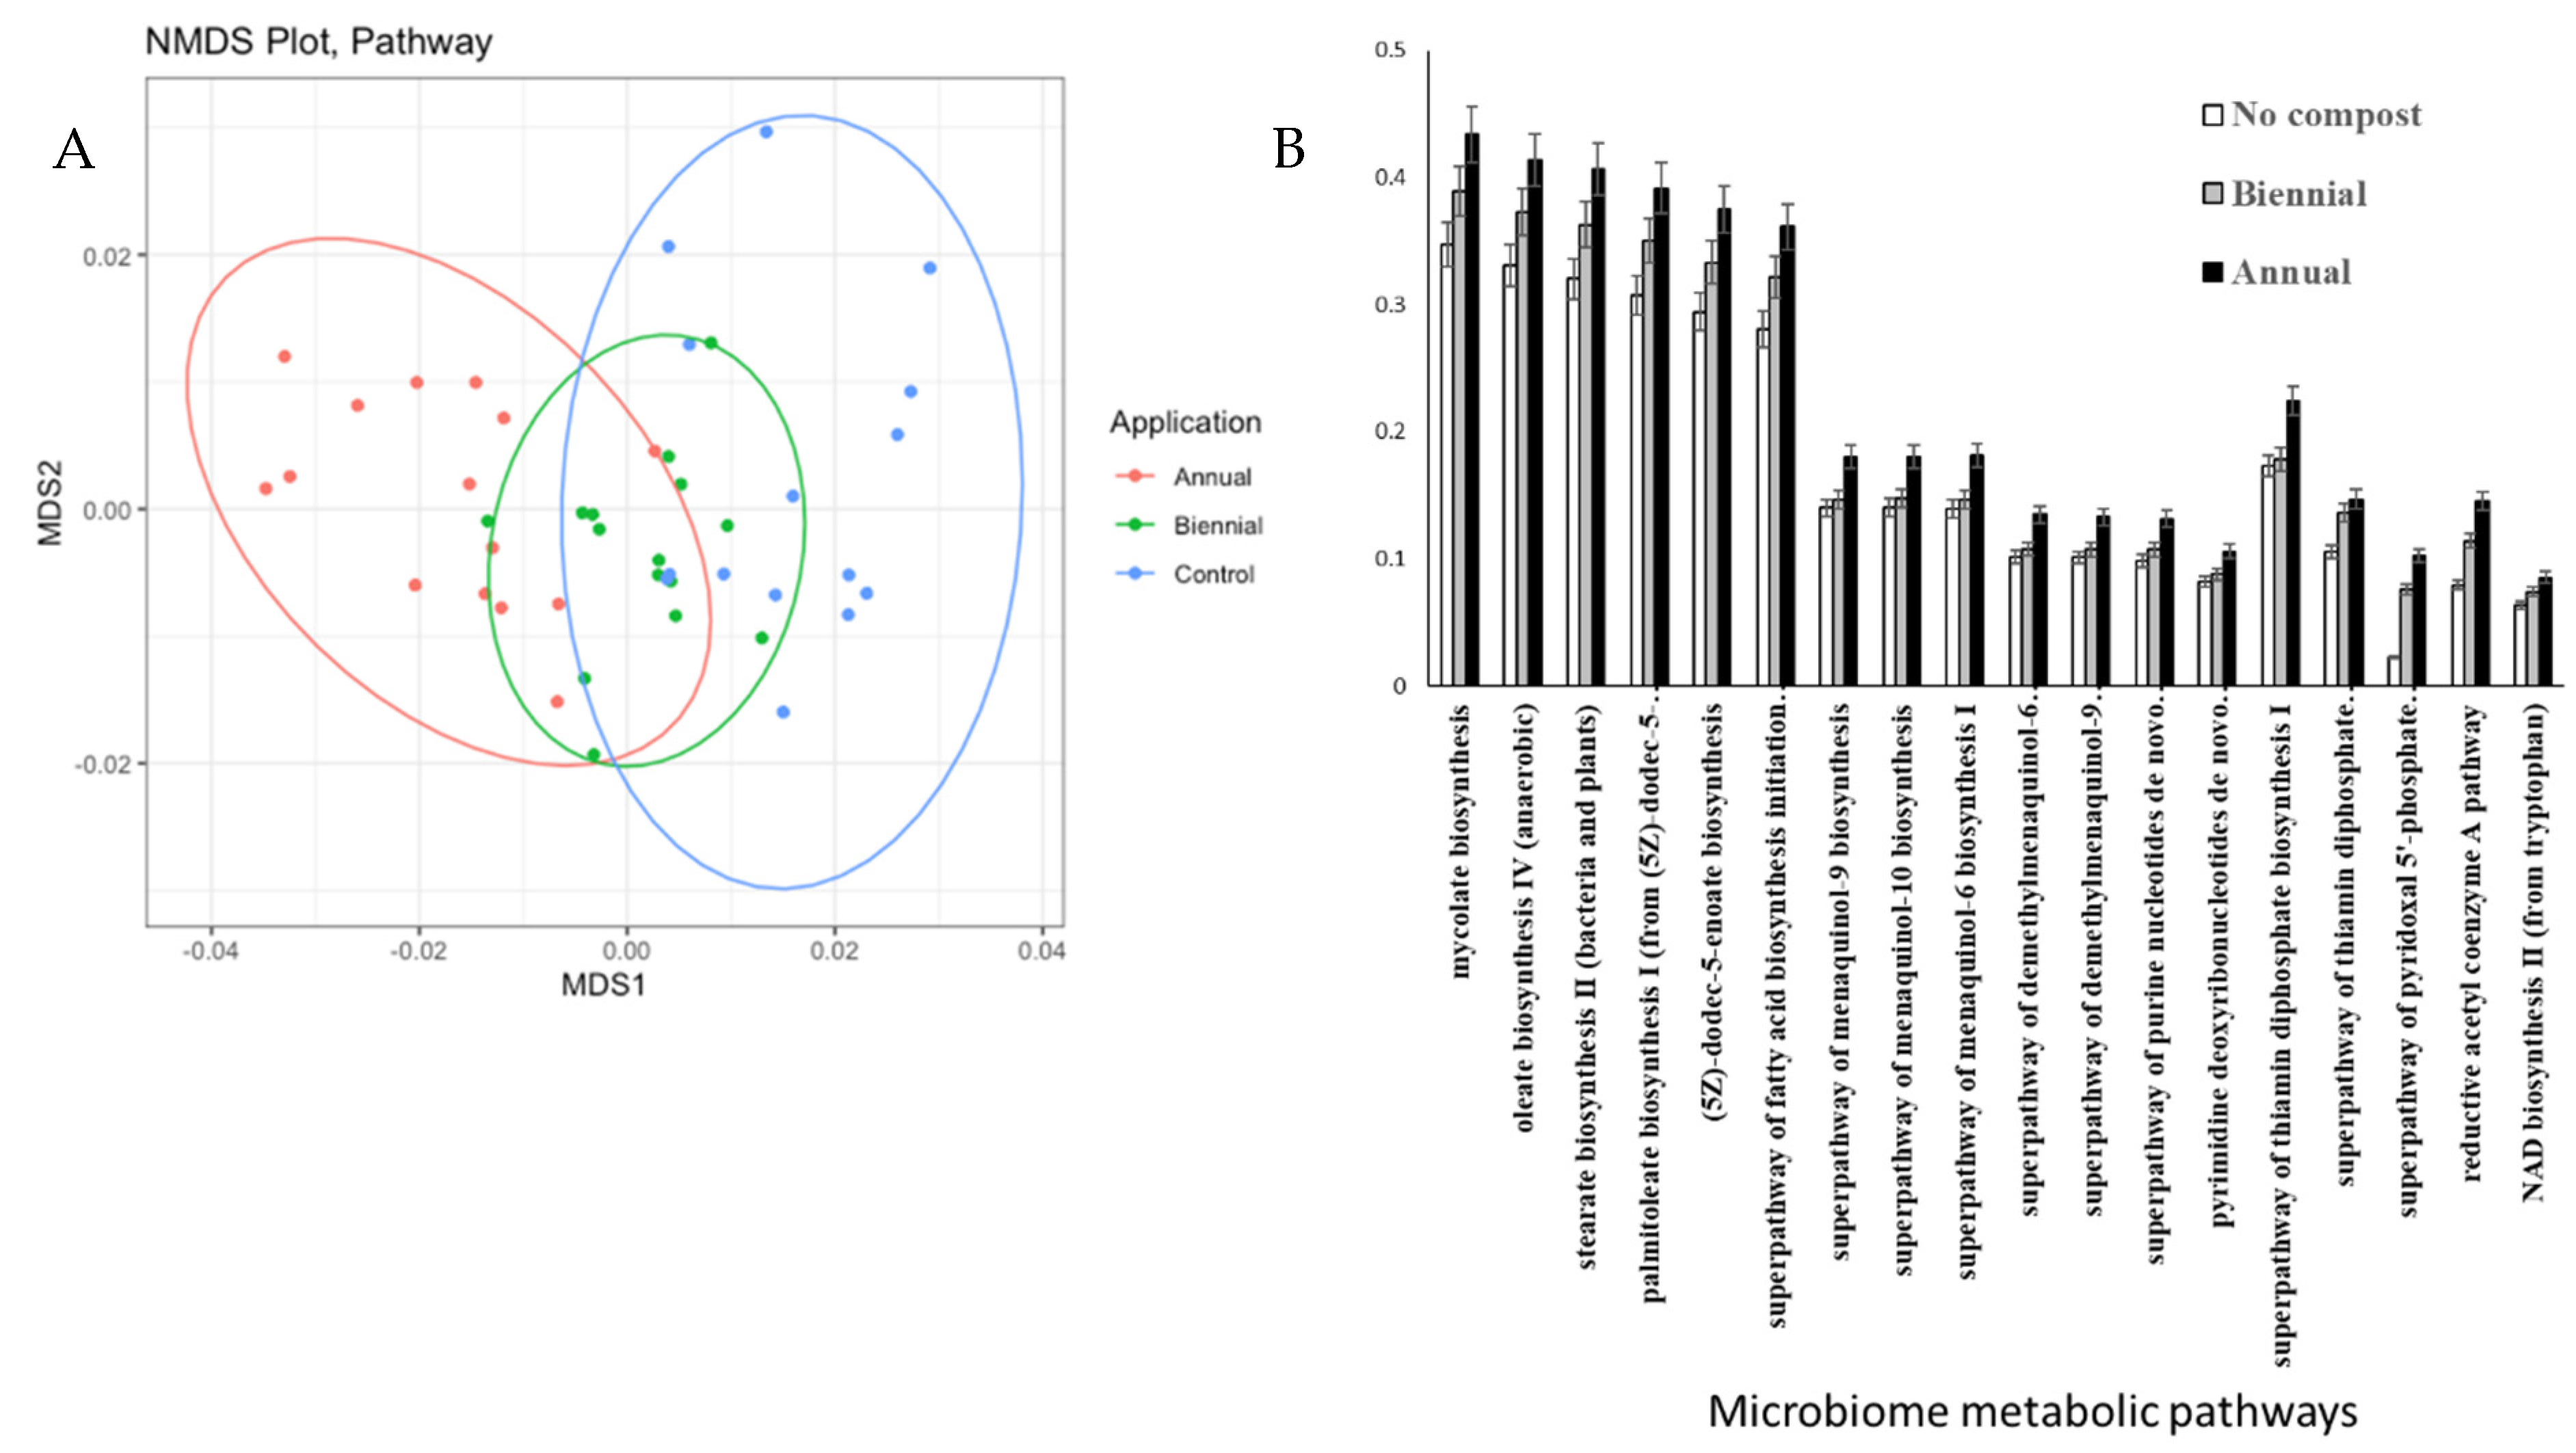
In total, 205 pathways were differentially represented in microbiomes from the AN-soil, BI-soil, and the C-soil out of which 18 were overrepresented in the AN-soil and the BI-soil compared to the C-soil (
Figure 3). The B-soil had medium level of functional profile of bacteria community compared to the AN-soil (high) and the C-soil (low) on the NMDS plot (
Figure 3A). These 18 metabolic pathways were menaquinones (MK) and demethylmenaquinones (DMK) biosynthesis, i.e., superpathway of menaquinol-9 biosynthesis, superpathway of menaquinol-10 biosynthesis; superpathway of menaquinol-6 biosynthesis I, superpathway of demethylmenaquinol-6 biosynthesis I and superpathway of demethylmenaquinol-9 biosynthesis; fatty acid biosynthesis, i.e., oleate biosynthesis IV (anaerobic), stearate biosynthesis II (bacteria and plants), palmitoleate biosynthesis I (from (5Z)-dodec-5-enoate), (5Z)-dodec-5-enoate biosynthesis and superpathway of fatty acid biosynthesis initiation; DNA and RNA structures and enzymes cofactors, i.e., superpathway of purine nucleotides de novo biosynthesis II and pyrimidine deoxyribonucleotides de novo biosynthesis II; energy production, i.e., superpathway of thiamin diphosphate biosynthesis I, NAD biosynthesis II (from tryptophan), superpathway of thiamin diphosphate biosynthesis II, superpathway of pyridoxa–phosphate biosynthesis and salvage and carbon fixation, i.e., reductive acetyl coenzyme A pathway (
Figure 3B).
The extent to which plants form mutually beneficial partnership with rhizosphere microbiome is dependent on the genotypic characteristics of the plant as explained by Kelly et al. [
18]. This manifested in the plant growth and yield components of the different species in
Table 5 and
Table 6. According to Zhou et al. [
22], plants use their root exudates to mobilize specific microbial communities to combat disease pathogens, facilitate nutrient acquisition and crosstalk amongst various plant growth regulators, and to modulate signaling pathways and increase productivity. This can explain the results of the present study as shown below but will need to be validated in future studies.
2.6. Crop Morpho-Physiology
Application of MSW compost significantly (
p < 0.05) increased SPAD (soil plant analysis development) value of leaf greenness (
Table 5), which can be used to estimate leaf chlorophyll content because of the high positive regression coefficient (R
2 > 0.93) between the two [
39]. F
o was comparatively high in all the control but did not differ between AN and BI treated crops. Fm was not significantly (
p > 0.05) altered by MSW compost irrespective of the crop. F
v of lettuce and beets were not altered by compost, but it was significantly (
p < 0.05) higher in the AN-green beans compared to the BI-green beans and the C-green beans. F
v, F
v/F
m and F
v/F
o were similarly high (
p < 0.05) in AN- and BI-green beans and lettuce compared to the control plants (
Table 5). Chlorophyll fluorescence indices were not altered in beets except for F
o (
Table 5). Compost alteration of fundamental plant structural, biochemical, and physiological functions [
14] translated into increased leaf chlorophyll content and photosynthetic activities.
Although the MSW compost only increased F
v/F
m and F
v/F
o of green beans grown in soils applied annually with compost, the comparatively low values of these indices in all the control plants suggest stressful conditions (
Table 5). It is well established that nutrients imbalance can reduce photosynthetic efficiency and plant metabolism [
40,
41] as found in plants grown in the control plots. Furthermore, P deficiency reduced F
v/F
m while increasing F
o [
42] with photosystem II being the most sensitive and vulnerable [
43]. The comparatively low C-soil nutrients (
Table 2) might have caused the nutrient-deficient control plants to switch to a survival mode by growing extensive root system (i.e., SRL) and biomass by way of increased leaf dry matter content and specific stem density (
Table 6). According to Lohmus et al. [
44], different plant species adopt different adaptation strategies to sustain and improve nutrition, which may include an increase in above-ground biomass or fine root length.
The positive impact of compost on crop Productivity is well established [
2,
12]. Plant heights of the AN-green beans and the AN-beets were significantly (
p < 0.01) increased by ca. 19% and ca. 17% compared to their BI- counterparts; and by ca. 44% and ca. 46% compared to their C- counterparts, respectively (
Table 6). Plant heights for the AN-lettuce and the BI-lettuce were similar (
p > 0.05) but higher than that of the C-lettuce. Plant leaf area for the AN-green beans, AN-lettuce and AN-beets were increased significantly (
p < 0.001) by ca. 58%, 15% and 44%, respectively, compared to their BI- counterparts; and by ca. 206%, 63% and 217% compared to their C- counterparts, respectively (
Table 6). Compost did not affect leaf dry matter content (LDMC) of the lettuce and beets (
Table 6). However, compost significantly (
p < 0.01) reduced LDMC of the AN-green beans and the BI-green beans by an average of 38% compared to the C-green beans. Specific stem density (SSD) of the plants did not change with compost application (
Table 6). However, SSD was reduced in the C-green beans by ca. 74% and increased in C-lettuce and C-beets by ca. 57% and 52%, respectively, compared to the average for their AN- and BI- counterparts.
Specific root length (SRL) was higher in the C-green beans and the C-beets than their AN- and BI- counterparts (
Table 6). In contrast, SRL was significantly (
p < 0.01) reduced in the C-lettuce by ca. 45% compared to the average for the AN-lettuce and the BI-lettuce. There was no significant (
p > 0.05) difference between the AN- and BI-green bean fresh immature pod yield (
Table 6). The fresh pod yield of C-green bean was reduced significant (
p < 0.01) by ca. 35% compared to the average for the AN- and the BI-green beans. The yield difference between the AN- and the BI-lettuce was ca. 18% (
Table 6). The average yield for the AN- and the BI-lettuce was ca. 717% more than the C-lettuce. The yield of the AN-beets was significantly (
p < 0.0001) increased by ca. 20% compared to the BI-beets; and by ca. 386% compared to the C-beets.
The results proved that the different crop species responded differently to the MSW compost treatment. Additionally, the results of the plant growth indices demonstrated increased plant growth and productivity with the application of MSW compost compared with the control. According to Cornelissen et al. [
45], plants with high LDMC (e.g., control plants) have high physical strength for survival under stress conditions and can be associated with long leaf life-span but may be less productive compared to plants with low LDMC (e.g., plants grown in AN-soil and BI-soil). Similarly, a high SSD demonstrates a dense stem that provides structural strength to the plant and an indication of carbon storage [
45], which suggest a switch to survival mode of plants in the C-soil compared to plants that were grown in the AN- and BI-soils. Plants with high SRL develop longer roots per dry mass for water and nutrients uptake [
45]. It seemed compost applied lettuce had higher SRL but lower in compost applied green beans and only AN-beets compared to the control. It can be suggested that C-soil had low soil nutrient content and as such, plants develop higher SRL to be able to reach available nutrients and water. Lettuce is shallow-rooted and was probably, stressed in the C-soil to the point where SRL was reduced.
2.8. TCA Cycle Intermediate Metabolites
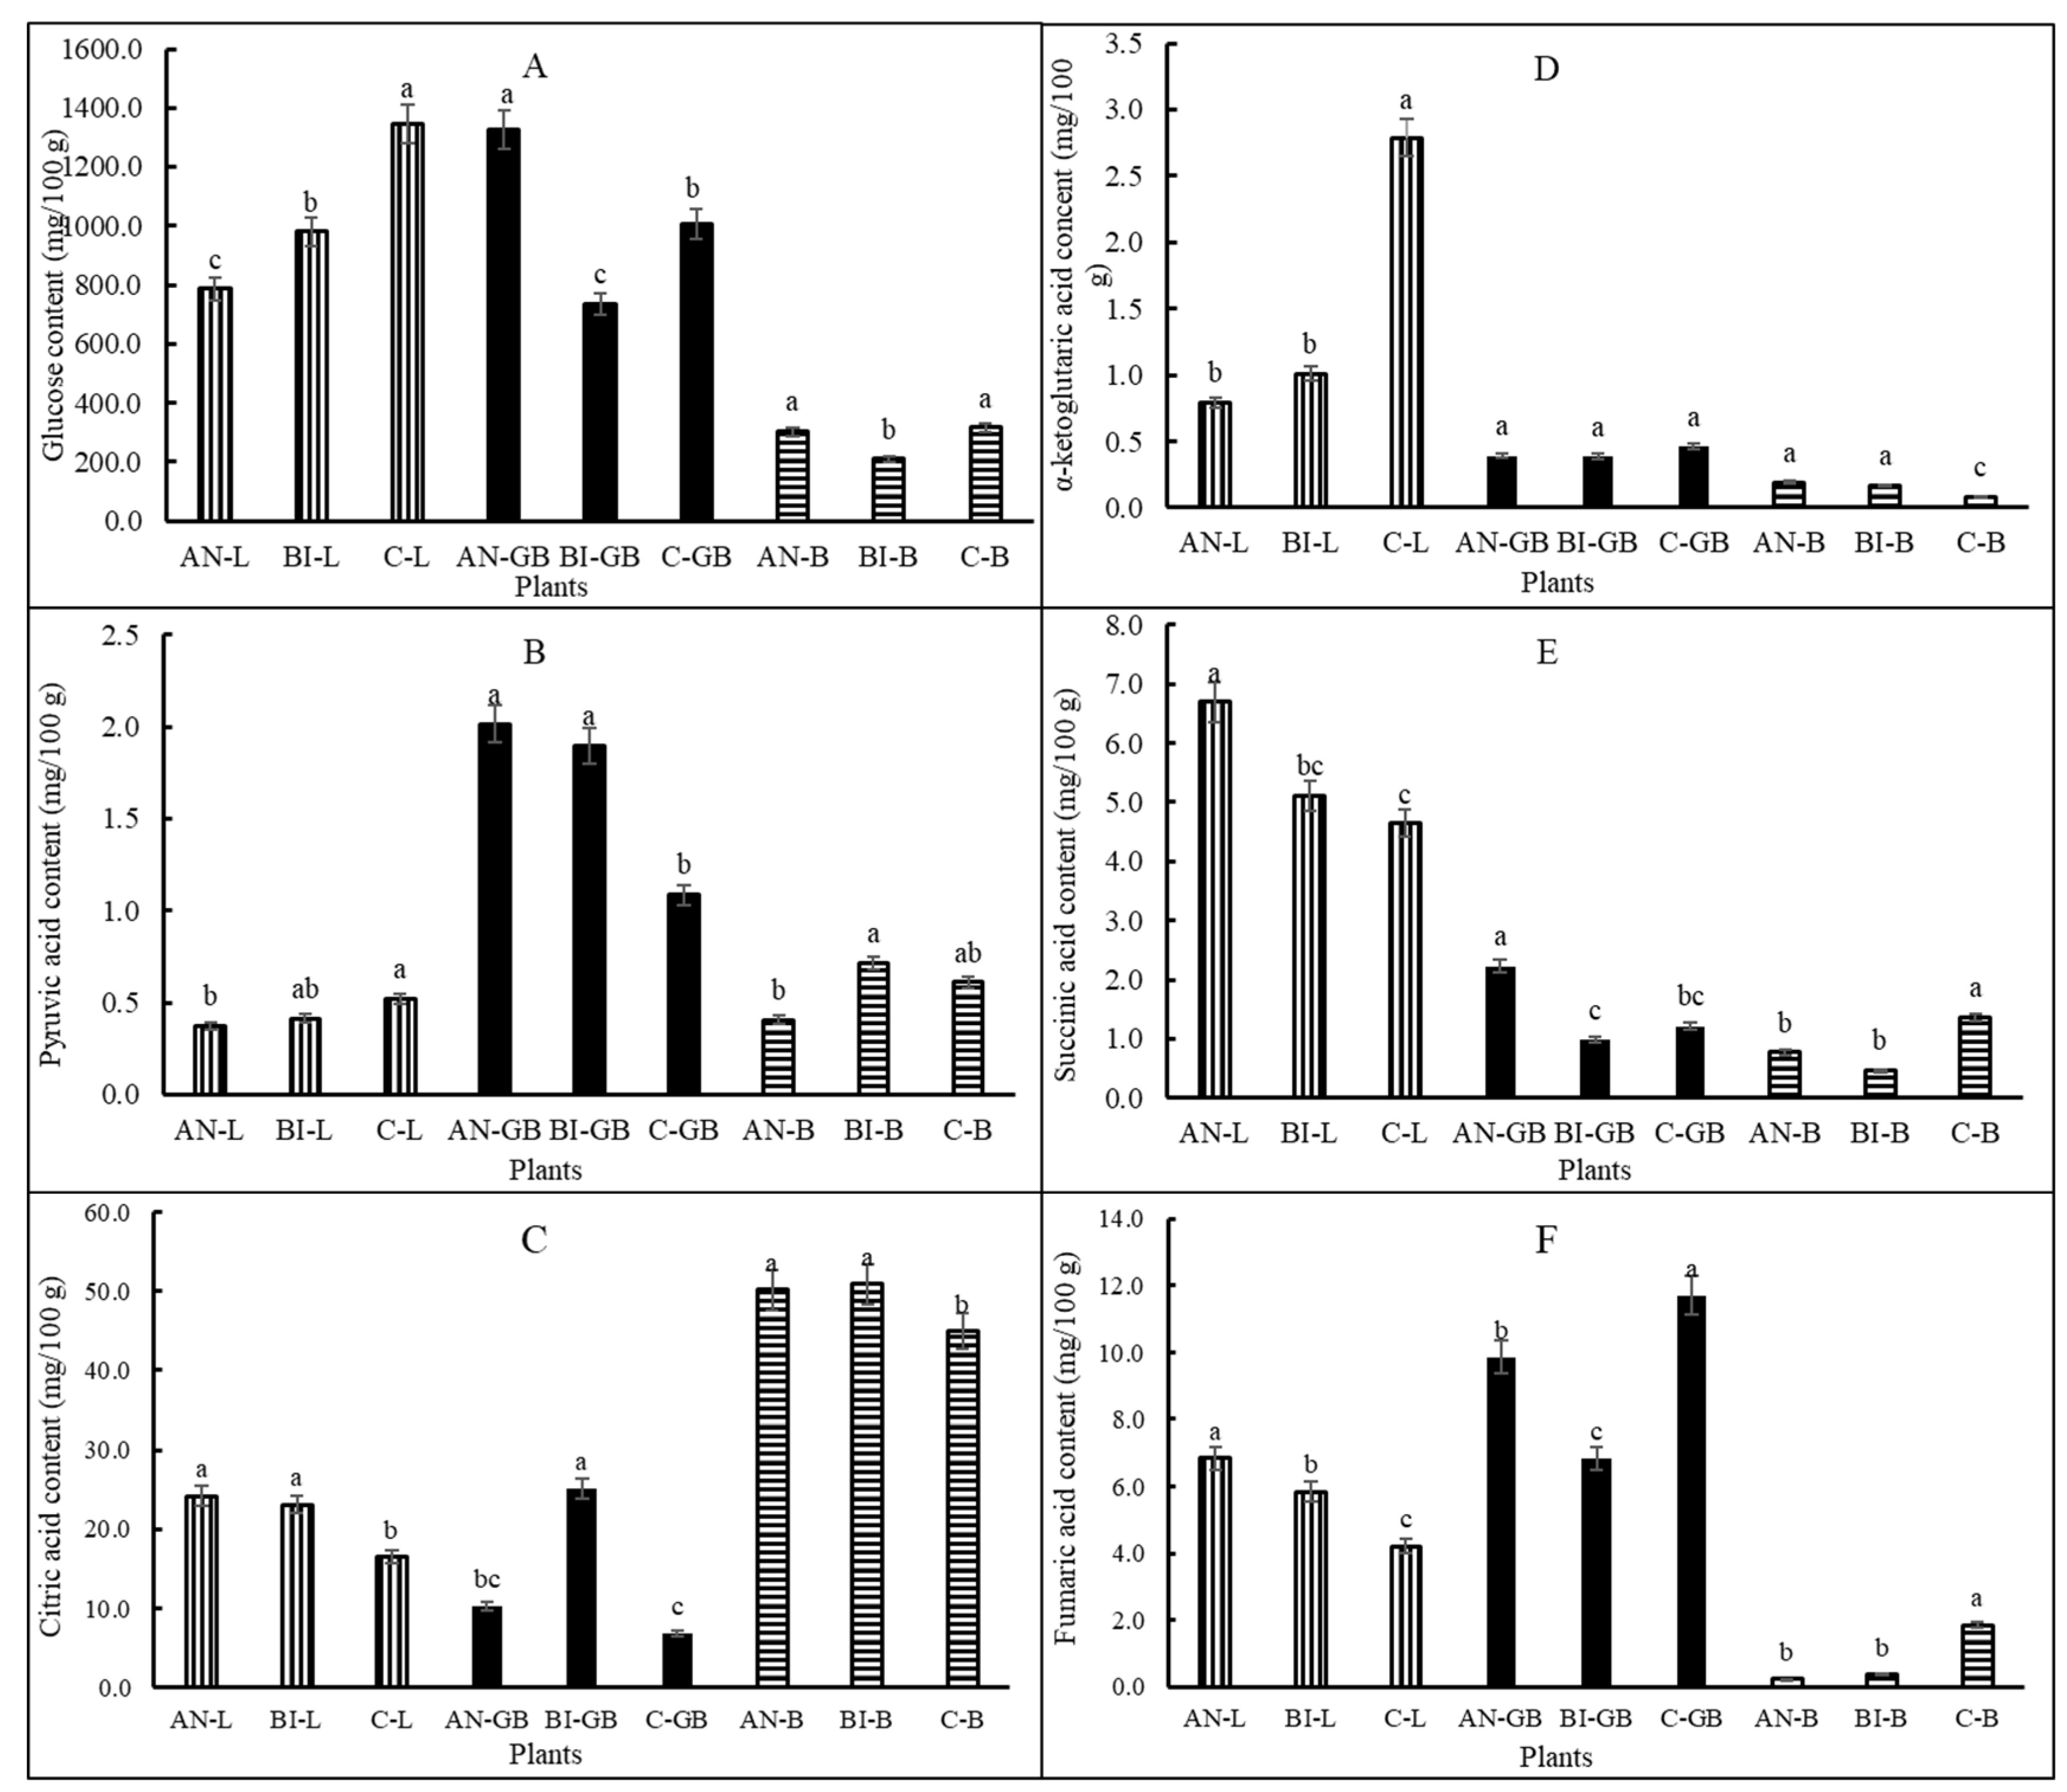
Plant metabolites involved in the TCA cycle were highly (
p < 0.001) influenced by MSW compost application frequency (
Figure 4A–F). Overall, glucose content was similarly high in lettuce and green beans but low in beets. We found that as part of the survival and adaptation modes, lettuce plants grown in the C-soil accumulated more glucose than their counterparts in the AN-soil and the BI-soil (
Figure 4A).
This conforms to previous observation on glucose accumulation in N-deficient plants [
26,
44]. AN-green beans glucose was ca. 80% and 37% more than that of the BI-green beans and the C-green beans, respectively. The AN-beets and the C-beets glucose were not significantly (
p > 0.05) different, and their average was over 43% more than that of the BI-beets. The AN-green beans and the BI-green beans had similar and high pyruvic acid content than that of the C-green beans (
Figure 4B). The general trend for pyruvic acid was green beans > beets > lettuce. For lettuce and beets citric acid contents, AN = BI > C (
Figure 4C). In contrast, citric acid was significantly (
p < 0.001) increased by ca. 147% and 270% in the BI-green beans compared to the AN-green beans and the C-green beans, respectively.
The AN-lettuce and BI-lettuce α-ketoglutaric acid contents were not significantly (
p > 0.05) different and was less than that of the C-lettuce (
Figure 4D). The C-lettuce α-ketoglutaric acid content was ca. 208% more than the average for the AN-lettuce and the BI-lettuce. There was no significant (
p > 0.05) difference in α-ketoglutaric acid content between the AN-green beans and the BI-green beans or the AN-beets and the BI-beets. Succinic acid was significantly (
p < 0.05) increased in the AN-lettuce by ca. 38% compared to the average for the BI-lettuce and the C-lettuce (
Figure 4E). Likewise, succinic acid was significantly (
p < 0.001) increased in the AN-green beans by ca. 103% compared to the average for the BI-green beans and the C-green beans. Succinic acid content was not significantly (
p > 0.05) different between the BI-lettuce and the C-lettuce or between the BI-green beans and the C-green beans (
Figure 4E). Moreover, the AN-lettuce fumaric acid was more than 17% and 63% compared to the BI-lettuce and the C-lettuce, respectively (
Figure 4F). The trend for fumaric acid contents in the green beans and the beets was different from that for the lettuce. Fumaric acid content was highest in the C-green beans, and it was ca. 19% and 71% more than those for the AN-green beans and the BI-green beans, respectively. However, the AN-green beans had ca. 44% more fumaric acid than its BI- counterpart. In general, the application of MSW compost reduced fumaric acid content in the beets. This was confirmed by the over 509% increase in the C-beets fumaric acid content compared to the average for the AN-beets and the BI-beets.
The biennially treated plants consistently had high pyruvic acid and citric acid contents (
Figure 4). α-ketoglutaric acid is formed from oxidation of isocitrate and found to be similar in plants grown with annual and biennial MSW compost application. Additionally, plant tissue contents of succinic acid (
Figure 4E) and fumaric acid (
Figure 4F) suggested that much of the high α-ketoglutaric acid in C-lettuce was not converted or its synthesis exceeded the rate at which it was converted to succinic acid. The oxidized succinic acid, i.e., succinate is converted to fumarate and then to malate and oxaloacetate to close the TCA cycle. Fumaric acid was high in AN-lettuce, C-green beans, and C-beets. The interconversion of these intermediate metabolites in the TCA cycle starting from photosynthesis to respiration is tightly regulated by enzymes [
23]. The conversion is also dependent on plant species and type of tissue as demonstrated in the present study and in previous report by Fernie and Martinoia [
48]. It is obvious from the present study that the composition of these metabolites can vary with plant species, plant developmental stage and type of plant tissue. However, further work will be required to investigate impact on respiratory products such as ATP and NADPH. According to van der Merwe [
20], a reduction in TCA cycle activity in a given tissue (e.g., beet roots) reduces respiration and energy generation in that tissue. However, green tissues (e.g., lettuce and green beans) can compensate for TCA cycle deficiencies through photosynthesis and photorespiration as explained by Kromer [
49].
2.9. Multivariate Assessment
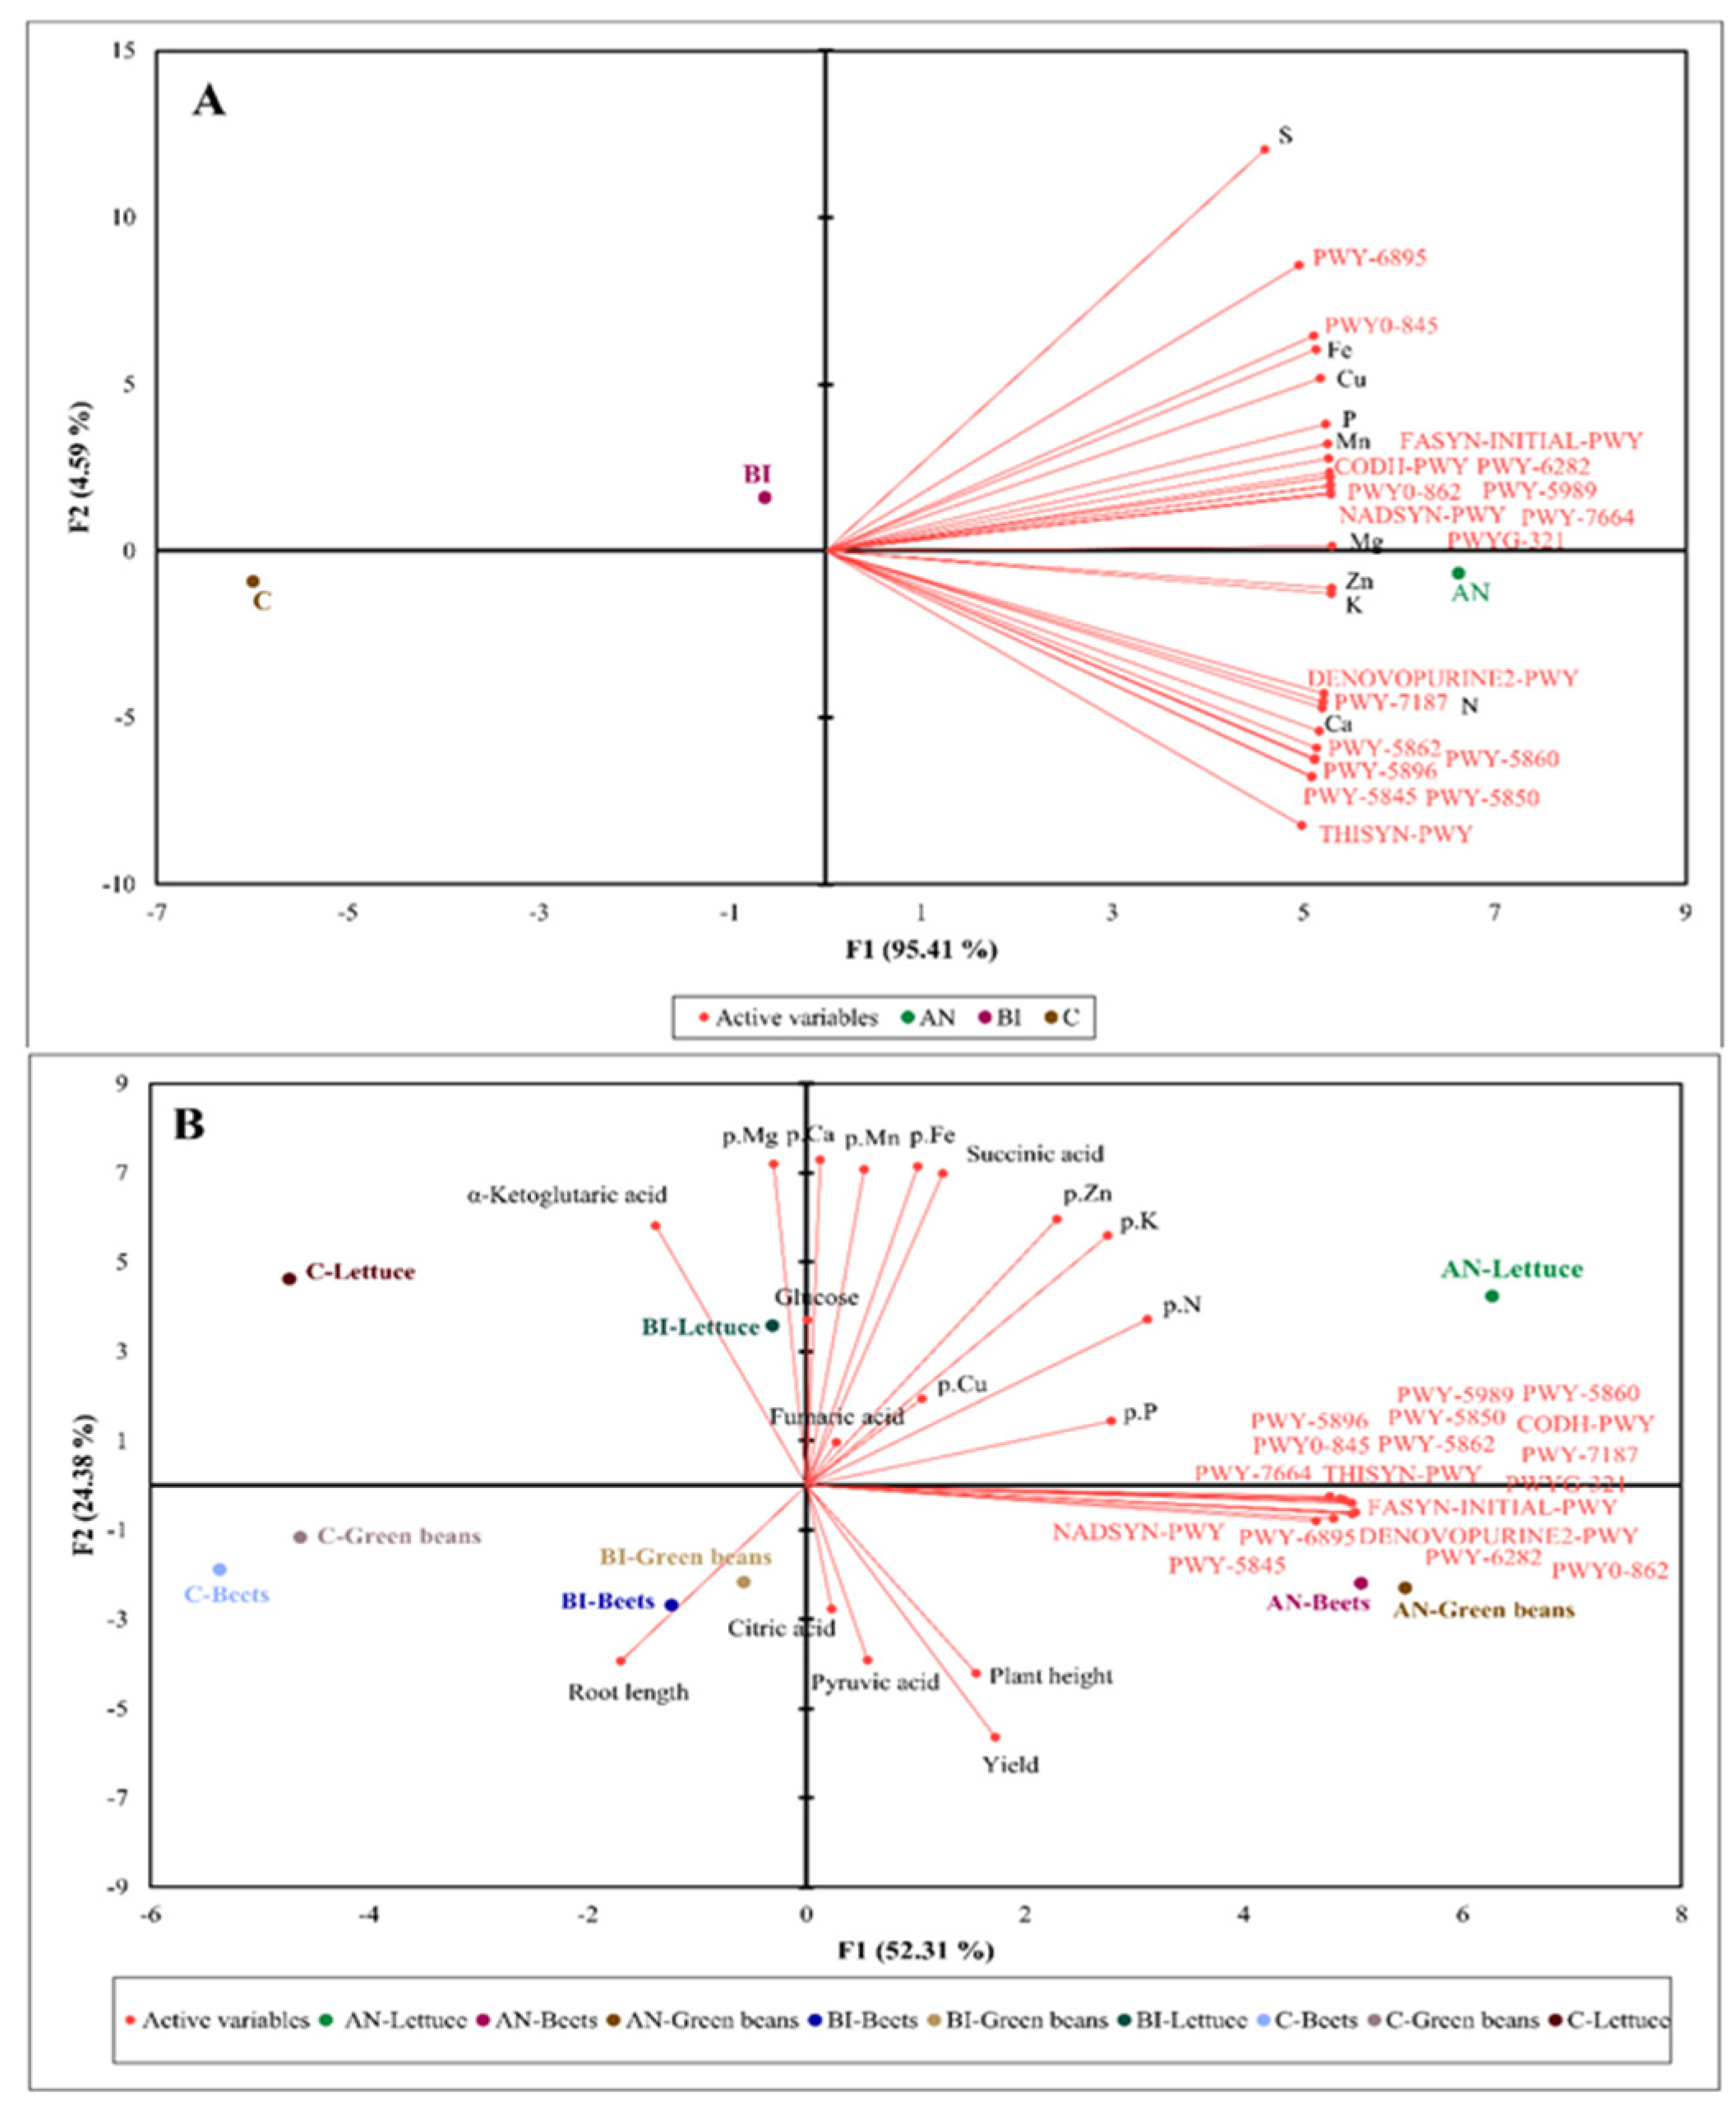
To further examine the relationship among key variables—soil nutrients, microbiome function and citric acid intermediate metabolites—we first constructed a multivariate 2-D PCA biplot using an extrapolated functional profile of bacterial communities based on the 16S rRNA marker gene and the soil nutrient profile (
Figure 5).
The two-dimension PCA plot showed that the AN-soil and the BI-soil can be highly and moderately associated with high content of soil elements and the 18 metabolic pathways, respectively, and negatively associated (r = −0.76) with the C-soil (
Figure 5A). This is expected because compost increase of soil organic matter, chemical elements and microbiome composition is well established in the literature [
2,
3,
50]. Moreover, DNA and RNA structures and enzymes cofactors (DENOVOPURINE2-PWY and PWY-7187) and MK and DMK pathways had positively strong association (r = 0.8) with soil N and Ca. Several studies confirmed that N source influenced bacteria growth and abundance [
51,
52,
53], which is dependent on their ability to synthesize new cells, i.e., mainly new cellular structures [
54]. This suggests that the high N and other elements in the AN-soil (
Table 2) met the requirement for bacteria growth more than that of the BI-soil and the C-soil.
The green beans, lettuce and beets tissue N, P, K, Zn, and Cu were positively influenced (r = 0.9) by the 18 microbiome metabolic pathways in the AN-soil (
Figure 5B). These pathways showed a moderate influence on citric acid and pyruvic acid accumulation as well as plant height and yield in the AN-green beans and the AN-beets, but less for the AN-lettuce. Under BI-soil, both BI-green beans and BI-beets were associated with high accumulation of pyruvic acid and citric acid, and increased plant height, root length and yield. In contrast, BI-lettuce exhibited high contents of glucose, fumaric acid, α-ketoglutaric acid and succinic acid, which were positively associated (r ≥ 0.78) with all the determined plant tissue elements. On the other hand, BI-lettuce was negatively associated (r ≥ −0.92) with the plant growth components and the metabolic pathways (
Figure 5B). The C-lettuce showed a moderate positive association (r = 0.56) with only α-ketoglutaric acid accumulation and root length; and a strong negative association (r = −0.89) with plant tissue elements, plant growth and the remaining TCA cycle intermediate metabolites (
Figure 5B). Hence, the low accumulation of metabolites and nutrient elements in edible portions of the C-lettuce, the C-green beans and the C-beets beside the stunted growth and low yield. Overall, MSW compost increased organic acids in the plant tissues that can participate in the TCA cycle pathway for energy generation, especially in plants grown in soils that received compost annually.
A healthy and thriving soil food web is largely dependent on beneficial soil microbial diversity and abundance as influenced by soil organic matter and soil nutrient status [
2,
55]. Overall, the 2-D PCA biplot showed a strong association between MSW compost enhancement of soil health, particularly plots that received the annual compost application; and high functional microbial metabolic activities that was consistent with previous studies [
2,
55,
56]. Soil microbes utilize carbon and other nutrients in organic matter for their metabolic activities, which facilitate nutrient mineralization and bioavailability [
2,
56]. Besides, the availability of soil N, P and S are crucial for enhancing microbial amino acids, proteins and nucleotides biosynthetic pathways, and C for structural building and energy production through glycolysis and peptidoglycan biosynthesis. These might have culminated in the high crop performance in the AN-soil followed by the BI-soil and the lowest in the C-soil.

 ,
, 


