
Soybean Protein and Oil Variants Identified through a Forward Genetic Screen for Seed Composition


USDA-ARS Crop Production and Pest Control Research Unit, 915 West State Street, West Lafayette, IN 47907, USA
Plants 2022, 11(21), 2966; https://doi.org/10.3390/plants11212966
Submission received: 30 September 2022
/
Revised: 25 October 2022
/
Accepted: 31 October 2022
/
Published: 3 November 2022
(This article belongs to the Special Issue Mutagenesis in the Age of Next-Generation-Sequencing and Genome Editing)
Abstract
:Mutagenesis remains an important tool in soybean biology. In classical plant mutation breeding, mutagenesis has been a trusted approach for decades, creating stable non-transgenic variation, and many mutations have been incorporated into germplasm for several crops, especially to introduce favorable seed composition traits. We performed a genetic screen for aberrant oil or protein composition of soybean seeds, and as a result isolated over 100 mutant lines for seed composition phenotypes, with particular interest in high protein or high oil phenotypes. These lines were followed for multiple seasons and generations to select the most stable traits for further characterization. Through backcrossing and outcrossing experiments, we determined that a subset of the lines showed recessive inheritance, while others showed a dominant inheritance pattern that suggests the involvement of multiple loci and genetic mechanisms. These lines can be used as a resource for future studies of the genetic control of seed protein and oil content in soybean.
1. Introduction
Although CRISPR and gene editing technologies show great promise in soybean composition engineering [1,2,3] stable soybean transformation remains a significant challenge for most laboratories, and this technology has not yet reached the level of low cost and rapid throughput where it can be applied to broad hypothesis testing in the public sector. Mutagenesis followed by forward genetic screening still has the advantage in soybean that only mutations that are phenotypically significant even in the presence of often redundant, highly similar homeologous genes are detected. For seed composition characteristics, traits created via mutagenesis have the added benefit of being categorized for regulatory and labelling purposes as non-genetically modified, which can accelerate study and broader adoption. Before the genomic age, forward genetics was a time- and resource intensive process that took many years, particularly in soybean, but today soybean genetic research can take advantage of many genomics-enabled sequencing technologies to accelerate the process of map-based cloning, including genotyping by sequencing and other high throughput dense marker approaches, and whole-genome resequencing. As a tool for the discovery of gene function, chemical mutagenesis can still provide validated targets to affect gene function in complex genomes like soybean, and several groups are currently exploiting this approach [4,5,6].
2. Results
2.1. Identification of Mutants
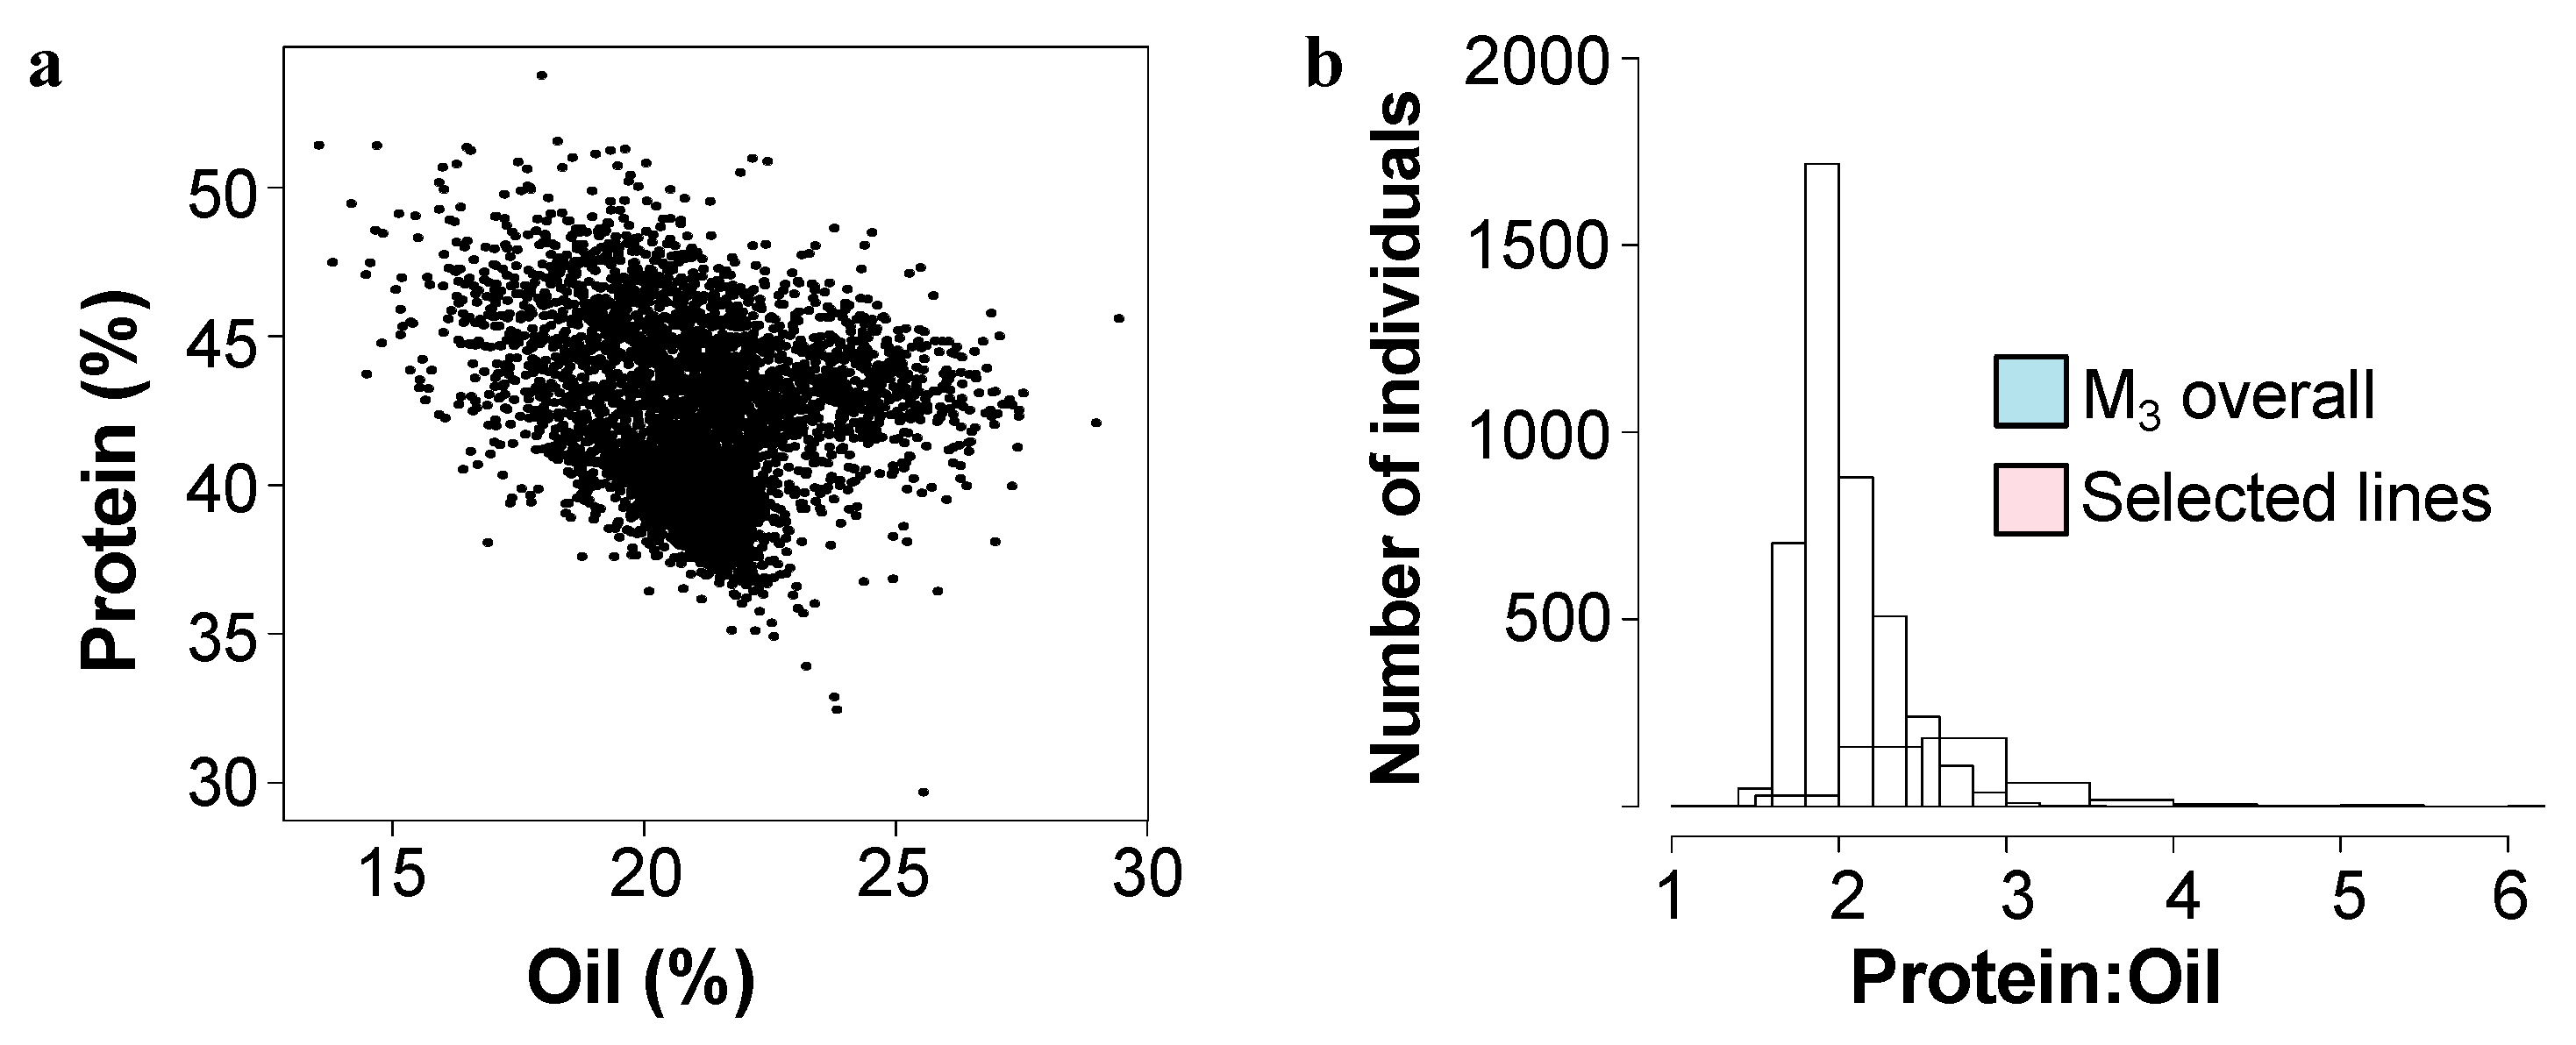
A population of over 8000 inbred Williams-82 soybean was treated with N-methyl nitrosourea (NMU) to induce single nucleotide polymorphsims (SNPs). The intended purpose of this population was for a TILLinG (Targeting Induced Local Lesions in Genomes) approach for reverse genetics, and it has provided new alleles for the modification of carbohydrates in soybean seeds [18,19]. However, it has also proven fruitful as a source of new composition alleles using a forward genetics approach by screening for composition phenotypes [5]. Over the course of five field seasons, 4300 M3 lines (each line representing the offspring of one M2 mutant individual) were screened by NIR (Near-InfraRed Spectroscopy) for overall protein and oil levels in seeds (Figure 1a).
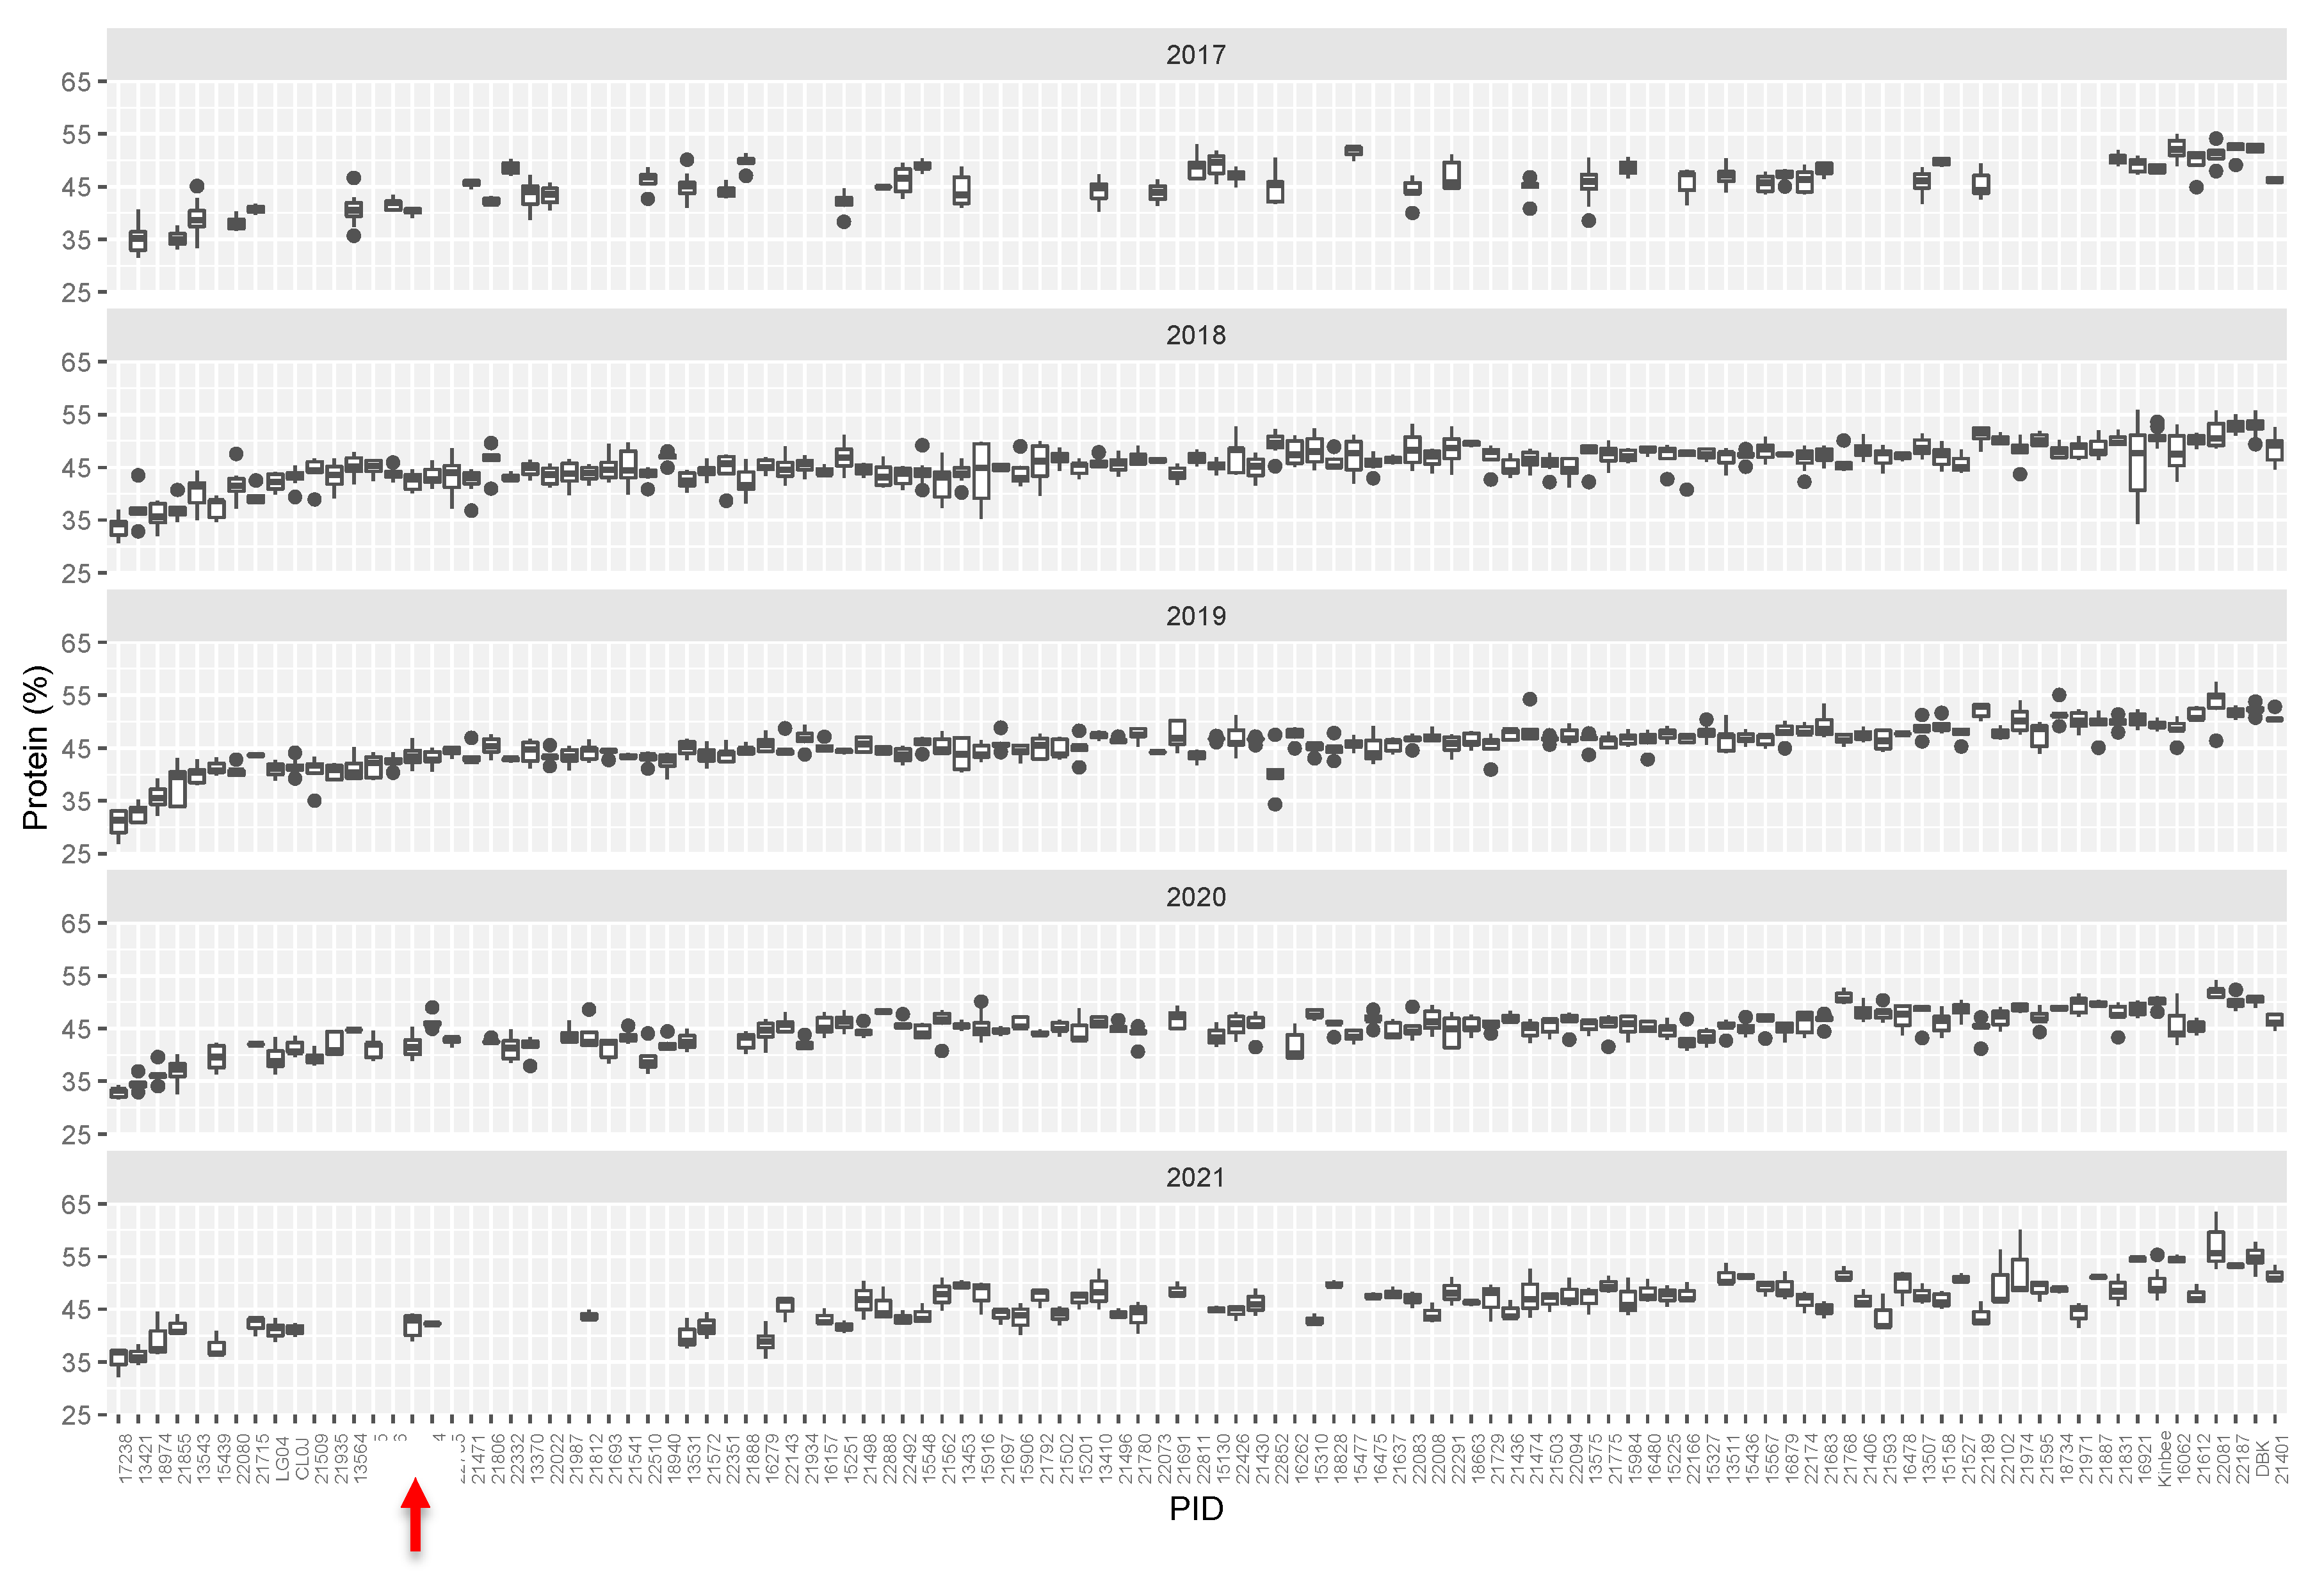
We initially identified over 125 lines that varied from the reference genotype (Williams-82) by ~>10% in protein and/or oil content. Most commonly, mutants were elevated in protein levels and were reduced in levels of total oil, however seven mutant lines had elevated levels of oil and reduced levels of protein. Compared to the initial full mutant population, ratio of protein to oil in the selected mutants tended to be higher, driven by several outlying lines with low levels of seed oil (Figure 1b). Mutant rows which had low seed set due to reduced fertility were eliminated, as protein levels are inversely correlated with seed set. Promising lines, which showed statistically significant differences from the Williams-82 wild-type were followed for up to five subsequent growing seasons. (Figure 2, Supplemental Table S1). Many of the lines demonstrated statistically significant and reproducible effects on protein and/or oil content over multiple years. Many of the mutants demonstrated agronomically significant increases in protein levels (up to 50% protein, similar to known high protein lines such as Danbaekkong (PI 619083) or Kinbee (PI 417027). LG04-6000 (PI 664025, [20]) and CL0J-173-6-8 [21] are locally adapted commodity-type high-yielding soybean, and were characterized in the SoyNAM project, thus have publicly available dense genome marker data [22].
2.2. Genetic Classification of Mutants
To further characterize the most promising mutant lines, mutants were backcrossed to Williams-82 (with the mutant as the male parent) and outcrossed to another parent for genetic mapping (with the mutant as the female parent). Small populations (25–60) of F3 seed from an individual cross were phenotyped by NIR (Table 1). As overall variation for these quantitative traits is relatively subtle, it was important to determine if the phenotypes can be followed in a segregating population as the result of a single locus. In many cases it was possible to determine if each locus was dominant or recessive. In general, visual inspection of the protein and oil levels in F3 seed bulks was used to assess the inheritance pattern. Statistical methods were applied to attempt to validate segregation in the population, although these have limited effectiveness with small populations (Table 1).
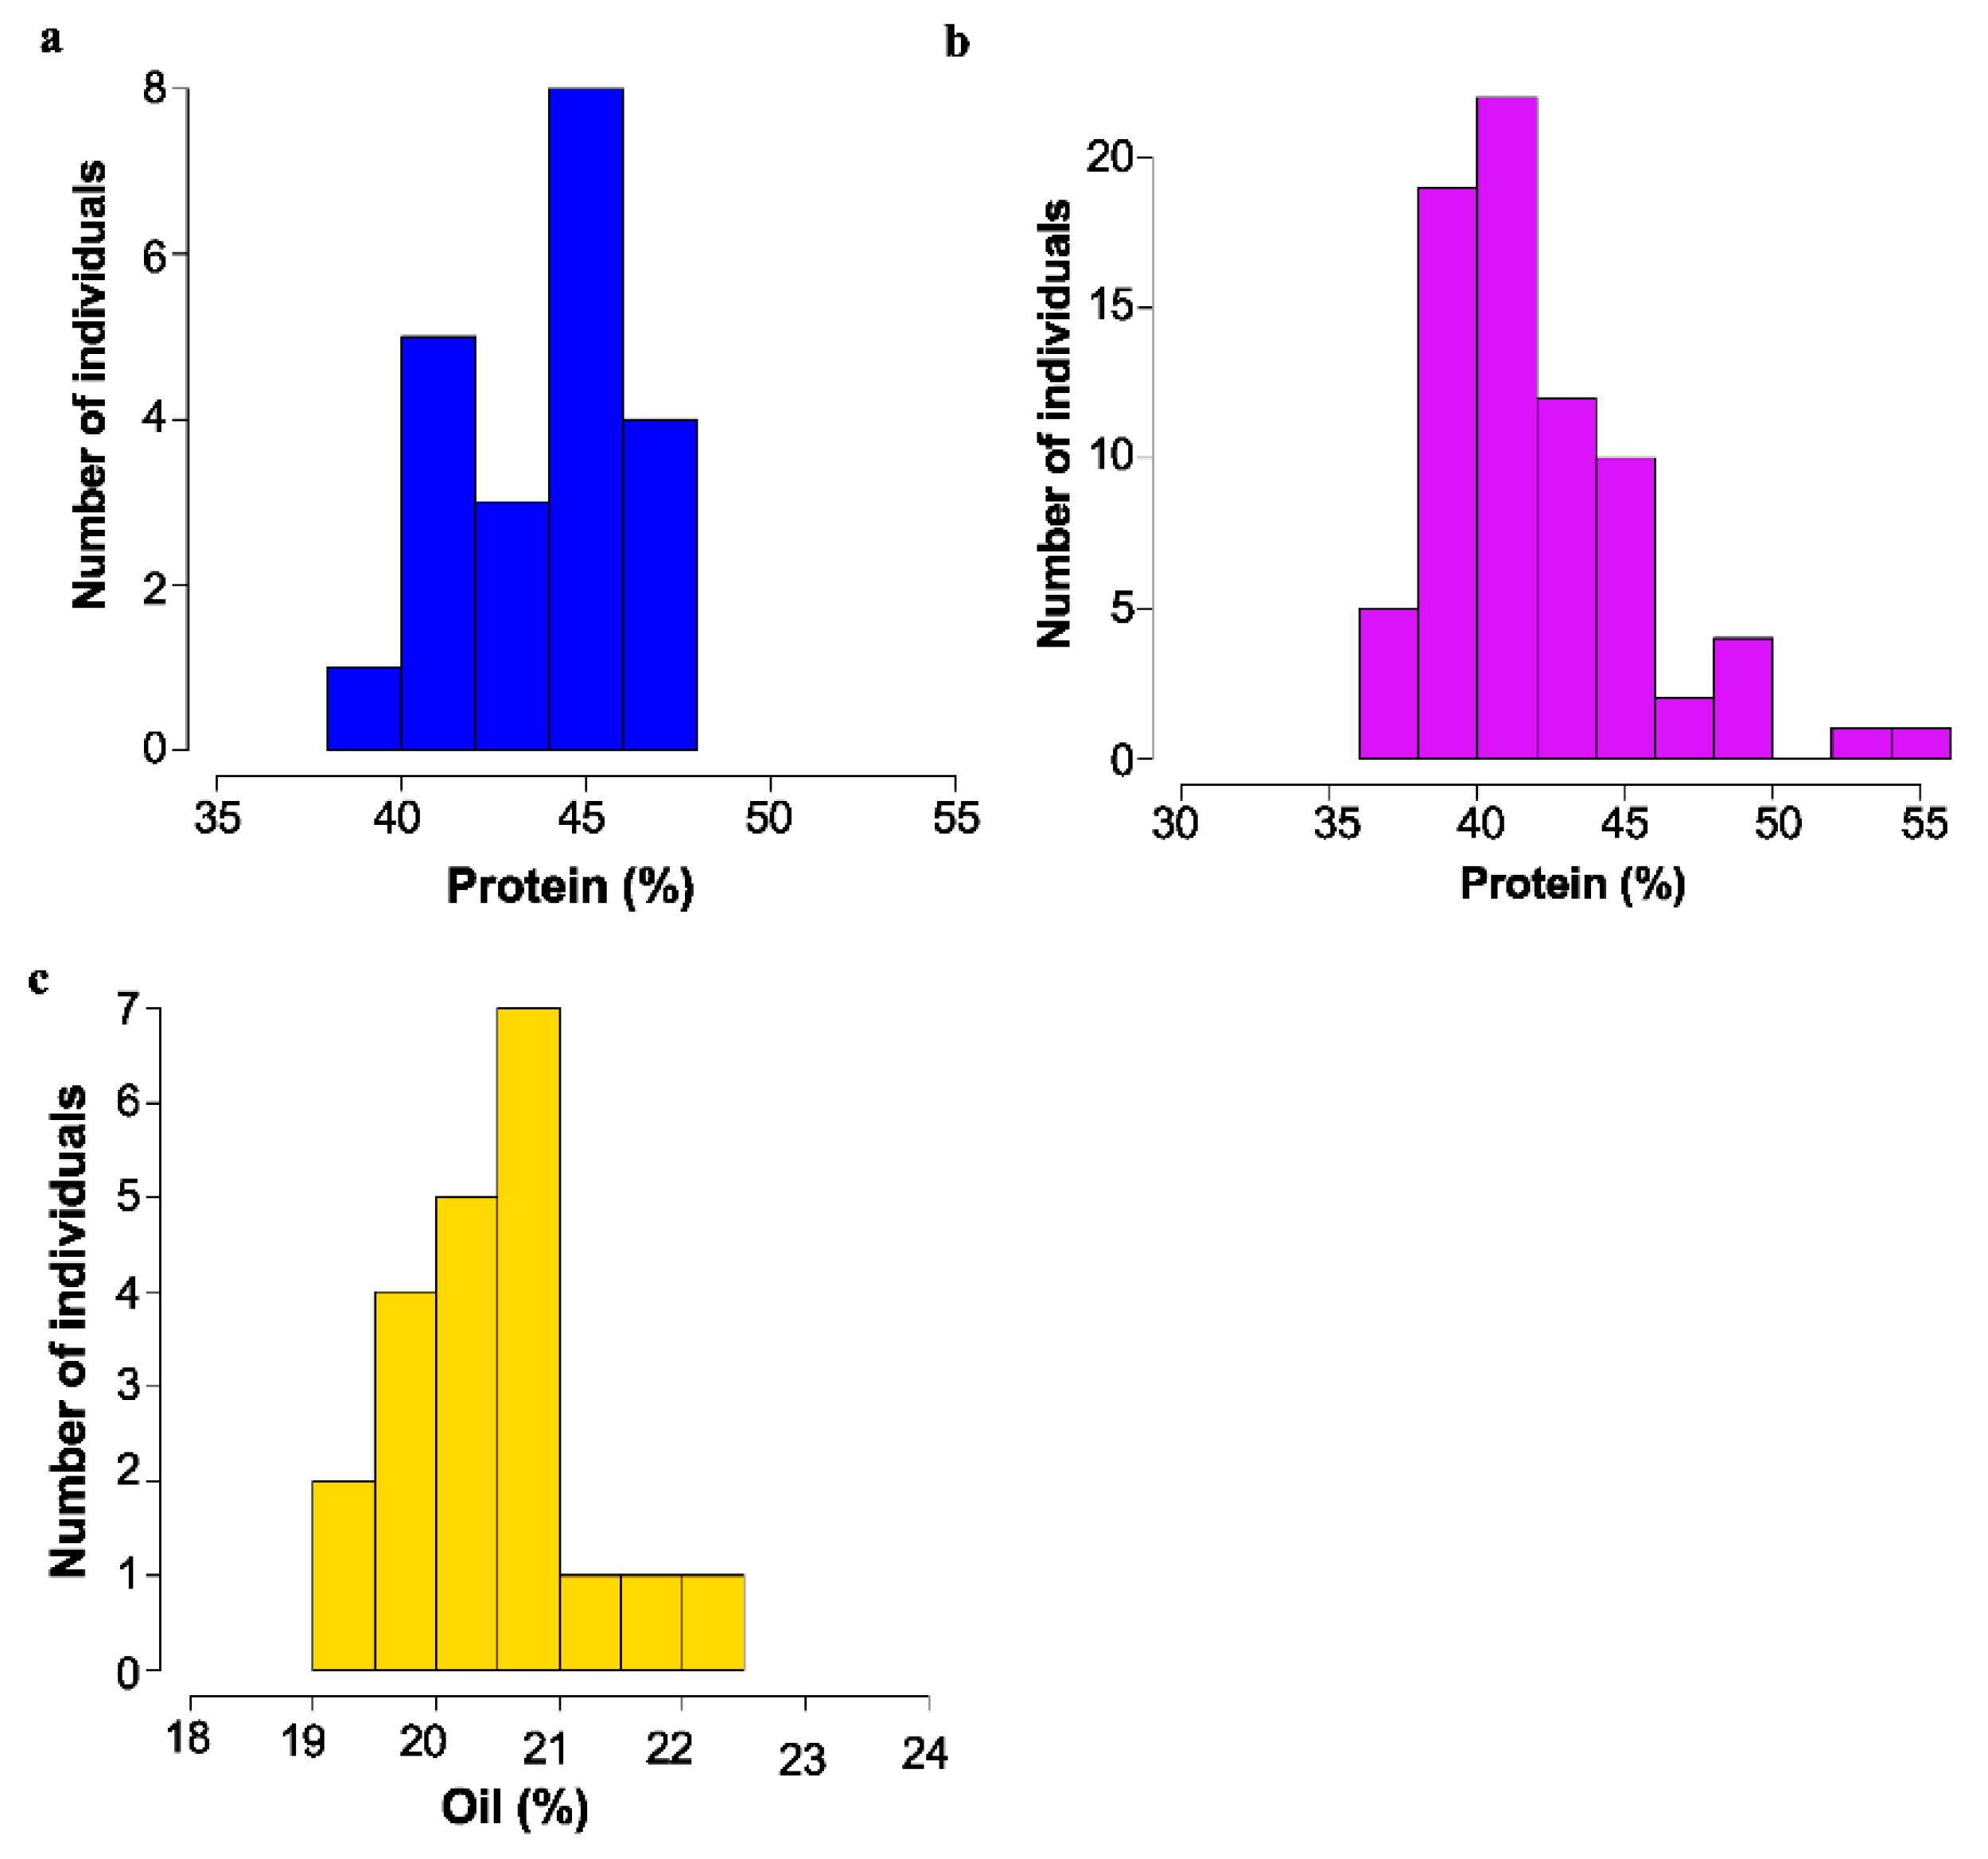
Of 44 lines crossed, it was determined that 14 of the lines showed a dominant, high protein phenotype, and 17 lines showed a recessive high protein phenotype. Two were classed as recessive high oil, and one was recessive low oil. For the remainder of the cases, the cross was not informative. Segregation of protein and oil levels for several example populations are shown in Figure 3.
3. Discussion
A significant challenge for identifying new protein and oil mutants in soybean is the number of individual plants and volume of seed that must be screened. Ideally, for testing maintenance of the genetic trait over multiple seasons and segregation within populations, large populations are superior, however in a screen a balance must be achieved between the time spent propagating and characterizing individuals and a wide survey of the mutant population and preliminary characterization of numerous lines to achieve the best return of potential new loci. NIR-based methods have the strength of being fast, non-destructive, and with immediate relevance to how protein is measured in industrial settings, however it is important to validate this with chemical or biochemical approaches as the assumptions of NIR calibrations to infer protein amounts may not hold true in developmental mutants, for example those that affect the seed coat [23,24].
A key difference between the lines that we have identified from the mutant population and previous high-protein lines that have been the focus of composition research is that prior work has focused on a limited number of major protein QTL from diverse genotypes [9,25]. Soybean is limited in diversity and has undergone genetic bottlenecks during domestication [26]. The mutagenesis approach creates new diversity that did not previously exist in soybean. Combining these two approaches, a simple point mutation that is allelic with a more complex germplasm allele can help identify the causative gene underlying a QTL isolated from a germplasm source. The genetic differences between germplasm accessions are often a result of large genetic deletions, duplications or complex genomic rearrangements, which makes them hard to interpret in terms of gene function. Mutants from this chemically mutagenized population are expected to be the result of a single-base point mutation in the Williams-82 genetic background. (For all the fatty acid mutations previously characterized from this population, we have found this to be the case [27].) Thus, identification of the molecular nature of the lesion in these mutant lines should be more straightforward following genetic mapping.
Interestingly, we have observed both recessive and dominant phenotypes for the control of overall protein levels, which implies that multiple loci have been identified, and as SNP polymorphisms frequently create loss-of-function alleles this suggests multiple mechanisms can affect mature seed composition. In addition to using a mutation breeding approach to increase protein, mutants with reduced protein levels can confer valuable information about resource allocation during seed development. It is likely that by identifying genes involved in the control of protein levels we will gain understanding on how the balance of storage compounds in seeds is regulated and find new ways to improve composition, for example by changing gene activity in an opposite direction using transgenic or targeted mutation approaches.
4. Materials and Methods
Williams-82 soybean were mutagenized with n-nitroso-n-methylurea (NMU) as described previously [28]. M2 soybeans were planted in 1.8m plots containing up to 25 plants at the Agronomy Center for Research and Education field in West Lafayette, Indiana (40.0700° N, 86.9918° W). Over the five growing seasons (1 June–1 September) for each year at the experimental location, the average daily temperature ranged from 27.4 °C in 2017 to 28.8 °C in 2021. Rainfall during the growing season averaged 32.4 cm, and ranged from 19.7 cm in 2019 to 46.5 cm in 2017 (Midwestern Regional Climate Center, West Lafayette, IN, USA, https://mrcc.purdue.edu/CLIMATE/welcome.jsp, accessed on 1 November 2022). Seed total protein and oil from M2:3 were measured on bulks of 15 seed using the mirror cup of a Perten DA 7250 NIR analyzer (Perten, Springfield, IL, USA). M3 seeds were planted in the field and harvested as individual plants, and protein and oil was measured in M4 seeds to determine if the mutation was segregating (suggesting a heterozygous state in the M2) or uniform (indicating a homozygous line determined by overall consistency and small standard deviation among individuals). M2 families were assigned and followed with a unique, five-digit PID (Plant ID) number. In Supplemental Table S1, protein or oil is expressed as an average of three or more individuals, and statistical significance was determined by two-tailed, type II t-test with Williams-82 wild type individuals from the same year, which was the method that determined if a particular M2 line would be planted in future seasons. For lines where the trait was assessed to be segregating, plants were self pollinated and individuals from further generations were tested until the selfed progeny showed consistent protein or oil levels (at which point it was presumed that the gene involved was in the homozygous state). Presumed homozygous mutants were backcrossed to Williams-82 as the male parent (such that in the F3 seeds, deviation from wild-type protein or oil levels indicated a successful backcross, as no flower color, pubescence, or other physical characteristics can be used to differentiate the mutants from the non-mutagenized parent to determine if the cross was successful). Statistical analysis of M2 families and F2 populations, including the Shapiro–Wilks test for normality [29] were performed in R and Microsoft Excel, and plots were generated in R.
Supplementary Materials
The following supporting information can be downloaded at: https://www.mdpi.com/article/10.3390/plants11212966/s1, Table S1: Protein and oil content of selected mutants over five growing seasons.
Funding
This research was funded by USDA-ARS intramural CRIS 5020-21000-008-00D. This research received no external funding.
Institutional Review Board Statement
Not applicable.
Informed Consent Statement
Not applicable.
Data Availability Statement
Not applicable.
Acknowledgments
The author is grateful for the contribution of numerous undergraduate lab assistants who have supported fieldwork and performed NIR measurements, and JP Gomes-Viana and ME Hudson of the University of Illinois for assistance with R software. Mention of trade names or commercial products in this publication is solely for the purpose of providing specific information and does not imply recommendation or endorsement by the US Department of Agriculture. The USDA is an equal opportunity provider and employer.
Conflicts of Interest
The author declares no conflict of interest.
References
- Jacobs, T.B.; LaFayette, P.R.; Schmitz, R.J.; Parrott, W.A. Targeted genome modifications in soybean with CRISPR/Cas9. BMC Biotechnol. 2015, 15, 16. [Google Scholar] [CrossRef] [PubMed] [Green Version]
- Carrijo, J.; Illa-Berenguer, E.; LaFayette, P.; Torres, N.; Aragão, F.J.L.; Parrott, W.; Vianna, G.R. Two efficient CRISPR/Cas9 systems for gene editing in soybean. Transgenic. Res. 2021, 30, 239–249. [Google Scholar] [CrossRef] [PubMed]
- Xu, H.; Zhang, L.; Zhang, K.; Ran, Y. Progresses, Challenges, and Prospects of Genome Editing in Soybean (Glycine max). Front. Plant Sci. 2020, 11, 571138. [Google Scholar] [CrossRef] [PubMed]
- Espina, M.J.; Ahmed, C.M.S.; Bernardini, A.; Adeleke, E.; Yadegari, Z.; Arelli, P.; Pantalone, V.; Taheri, A. Development and Phenotypic Screening of an Ethyl Methane Sulfonate Mutant Population in Soybean. Front. Plant Sci. 2018, 9, 394. [Google Scholar] [CrossRef] [PubMed] [Green Version]
- Hudson, K. Soybean Oil-Quality Variants Identified by Large-Scale Mutagenesis. Int. J. Agron. 2012, 2012, 7. [Google Scholar] [CrossRef] [Green Version]
- Li, Z.; Jiang, L.; Ma, Y.; Wei, Z.; Hong, H.; Liu, Z.; Lei, J.; Liu, Y.; Guan, R.; Guo, Y.; et al. Development and utilization of a new chemically-induced soybean library with a high mutation density. J. Integr. Plant Biol. 2017, 59, 60–74. [Google Scholar] [CrossRef] [Green Version]
- Clemente, T.E.; Cahoon, E.B. Soybean Oil: Genetic Approaches for Modification of Functionality and Total Content. Plant Physiol. 2009, 151, 1030–1040. [Google Scholar] [CrossRef] [Green Version]
- Wilcox, J.R.; Shibles, R.M. Interrelationships among Seed Quality Attributes in Soybean. Crop Sci. 2001, 41, 11–14. [Google Scholar] [CrossRef]
- Nichols, D.M.; Glover, K.D.; Carlson, S.R.; Specht, J.E.; Diers, B.W. Fine Mapping of a Seed Protein QTL on Soybean Linkage Group I and Its Correlated Effects on Agronomic Traits. Crop Sci. 2006, 46, 834–839. [Google Scholar] [CrossRef]
- Sebolt, A.M.; Shoemaker, R.C.; Diers, B.W. Analysis of a Quantitative Trait Locus Allele from Wild Soybean That Increases Seed Protein Concentration in Soybean. Crop Sci. 2000, 40, 1438–1444. [Google Scholar] [CrossRef]
- Rincker, K.; Nelson, R.; Specht, J.; Sleper, D.; Cary, T.; Cianzio, S.R.; Casteel, S.; Conley, S.; Chen, P.; Davis, V.; et al. Genetic Improvement of U.S. Soybean in Maturity Groups II, III, and IV. Crop Sci. 2014, 54, 1419–1432. [Google Scholar] [CrossRef]
- Patil, G.; Mian, R.; Vuong, T.; Pantalone, V.; Song, Q.; Chen, P.; Shannon, G.J.; Carter, T.C.; Nguyen, H.T. Molecular mapping and genomics of soybean seed protein: A review and perspective for the future. Appl. Genet. 2017, 130, 1975–1991. [Google Scholar] [CrossRef] [PubMed] [Green Version]
- Bandillo, N.; Jarquin, D.; Song, Q.; Nelson, R.; Cregan, P.; Specht, J.; Lorenz, A. A Population Structure and Genome-Wide Association Analysis on the USDA Soybean Germplasm Collection. Plant Genome 2015, 8, plantgenome2015.04.0024. [Google Scholar] [CrossRef] [PubMed] [Green Version]
- Fliege, C.E.; Ward, R.A.; Vogel, P.; Nguyen, H.; Quach, T.; Guo, M.; Viana, J.P.G.; Dos Santos, L.B.; Specht, J.E.; Clemente, T.E.; et al. Fine mapping and cloning of the major seed protein quantitative trait loci on soybean chromosome 20. Plant J. 2022, 110, 114–128. [Google Scholar] [CrossRef]
- Wang, S.; Liu, S.; Wang, J.; Yokosho, K.; Zhou, B.; Yu, Y.C.; Liu, Z.; Frommer, W.B.; Ma, J.F.; Chen, L.Q.; et al. Simultaneous changes in seed size, oil content and protein content driven by selection of SWEET homologues during soybean domestication. Natl. Sci. Rev. 2020, 7, 1776–1786. [Google Scholar] [CrossRef]
- Zhang, H.; Goettel, W.; Song, Q.; Jiang, H.; Hu, Z.; Wang, M.L.; An, Y.C. Selection of GmSWEET39 for oil and protein improvement in soybean. PLoS Genet. 2020, 16, e1009114. [Google Scholar] [CrossRef]
- Manan, S.; Ahmad, M.Z.; Zhang, G.; Chen, B.; Haq, B.U.; Yang, J.; Zhao, J. Soybean LEC2 Regulates Subsets of Genes Involved in Controlling the Biosynthesis and Catabolism of Seed Storage Substances and Seed Development. Front. Plant Sci. 2017, 8, 1604. [Google Scholar] [CrossRef] [Green Version]
- Cooper, J.L.; Till, B.J.; Laport, R.G.; Darlow, M.C.; Kleffner, J.M.; Jamai, A.; El-Mellouki, T.; Liu, S.; Ritchie, R.; Nielsen, N.; et al. TILLING to detect induced mutations in soybean. BMC Plant Biol. 2008, 8, 9. [Google Scholar] [CrossRef] [Green Version]
- Thapa, R.; Carrero-Colon, M.; Rainey, K.M.; Hudson, K. TILLING by Sequencing: A Successful Approach to Identify Rare Alleles in Soybean Populations. Genes 2019, 10, 1003. [Google Scholar] [CrossRef] [Green Version]
- Nelson, R.L.; Johnson, E.O.C. Registration of the High-Yielding Soybean Germplasm Line LG04-6000. J. Plant Regist. 2012, 6, 212–215. [Google Scholar] [CrossRef]
- LeRoy, A.R.; Abney, T.S. Registration of ‘CL0J173-6-2’ and ‘CL0J173-6-8’ Soybeans. J. Plant Regist. 2007, 1, 98–99. [Google Scholar] [CrossRef] [Green Version]
- Song, Q.; Yan, L.; Quigley, C.; Jordan, B.D.; Fickus, E.; Schroeder, S.; Song, B.-H.; Charles An, Y.-Q.; Hyten, D.; Nelson, R.; et al. Genetic Characterization of the Soybean Nested Association Mapping Population. Plant Genome 2017, 10, plantgenome2016.10.0109. [Google Scholar] [CrossRef] [PubMed] [Green Version]
- Manan, S.; Zhao, J. Role of Glycine max ABSCISIC ACID INSENSITIVE 3 (GmABI3) in lipid biosynthesis and stress tolerance in soybean. Funct. Plant Biol. 2021, 48, 171–179. [Google Scholar] [CrossRef]
- Zhang, D.; Sun, L.; Li, S.; Wang, W.; Ding, Y.; Swarm, S.A.; Li, L.; Wang, X.; Tang, X.; Zhang, Z.; et al. Elevation of soybean seed oil content through selection for seed coat shininess. Nat. Plants 2018, 4, 30–35. [Google Scholar] [CrossRef] [PubMed]
- Bolon, Y.T.; Joseph, B.; Cannon, S.B.; Graham, M.A.; Diers, B.W.; Farmer, A.D.; May, G.D.; Muehlbauer, G.J.; Specht, J.E.; Tu, Z.J.; et al. Complementary genetic and genomic approaches help characterize the linkage group I seed protein QTL in soybean. BMC Plant Biol. 2010, 10, 41. [Google Scholar] [CrossRef] [PubMed] [Green Version]
- Hyten, D.L.; Song, Q.; Zhu, Y.; Choi, I.-Y.; Nelson, R.L.; Costa, J.M.; Specht, J.E.; Shoemaker, R.C.; Cregan, P.B. Impacts of genetic bottlenecks on soybean genome diversity. Proc. Natl. Acad. Sci. USA 2006, 103, 16666–16671. [Google Scholar] [CrossRef] [Green Version]
- Hudson, K.A.; Hudson, M.E. Genetic Variation for Seed Oil Biosynthesis in Soybean. Plant Mol. Biol. Rep. 2021, 39, 700–709. [Google Scholar] [CrossRef]
- Ritchie, R.; Wiley, H.; Szymanski, D.; Nielsen, N. Targeting Induced Local Lesions in Genomes-TILLING. In Legume Crop Genomics; Wilson, R.F., Stalker, H.T., Brummer, E.C., Eds.; AOCS Press: Champaign, IL, USA, 2004; pp. 194–203. [Google Scholar]
- Shapiro, S.S.; Wilk, M.B. An Analysis of Variance Test for Normality (Complete Samples). Biometrika 1965, 52, 591–611. [Google Scholar] [CrossRef]
Figure 1.
Mature seed protein and oil content in the mutant population. (a) Total protein and oil content in mature seeds as determined by NIR as % dry weight basis for 4300 M3 lines of the mutant population. (b) Distribution of mature seed protein:oil ratio for all mutant lines (blue) and the selected mutant lines (pink) over five seasons.

Figure 2.
Tukey box plots of average seed protein content (%, dry weight basis). Seed protein content in M3 lines over five growing seasons. Lines are plotted left to right in order based on increasing median protein level over 5 years. Abbreviations: W82—Williams-82, LG04—LG04-6000, CL0J: CL0J-173-6-8, DBK: Danbaekkong. Red arrow indicates the Williams-82 (wild type) content.

Figure 3.
Mature seed protein or Oil content as determined by NIR as % dry weight basis. for mutant backcross populations. (a) Segregation of protein content in 16475 × Williams-82 F3; bulk seed samples. (b) Segregation of protein content in 18734 × Williams 82 F3 bulk seed samples. (c) Segregation of oil content in 17238 × Williams 82 F3 bulk seed samples.


Table 1.
Inheritance pattern of alleles for high protein from selected mutants.
| Backcross PID | Phenotype | No. of Plants | SW | p |
|---|---|---|---|---|
| 13421 | inconclusive | 39 | 0.914 | 0.006 |
| 13507 | D high protein | 50 | 0.975 | 0.380 |
| 13531 | r high protein | 48 | 0.974 | 0.352 |
| 14015 | r high protein | 55 | 0.939 | 0.008 |
| 15130 | r high protein | 56 | 0.988 | 0.840 |
| 15158 | D high protein | 56 | 0.978 | 0.405 |
| 15201 | inconclusive | 19 | 0.983 | 0.972 |
| 15251 | D high protein | 85 | 0.936 | <0.001 |
| 15310 | r high protein | 107 | 0.992 | 0.763 |
| 15439 | r high oil | 70 | 0.986 | 0.607 |
| 15477 | r high protein | 35 | 0.978 | 0.704 |
| 15548 | r high protein | 40 | 0.930 | 0.017 |
| 15906 | r high protein | 22 | 0.890 | 0.019 |
| 15916 | r high protein | 100 | 0.993 | 0.893 |
| 16062 | D high protein | 96 | 0.971 | 0.032 |
| 16157 | inconclusive | 37 | 0.953 | 0.119 |
| 16262 | r high protein | 38 | 0.980 | 0.734 |
| 16279 | D high protein | 54 | 0.964 | 0.108 |
| 16475 | D high protein | 56 | 0.950 | 0.021 |
| 16480 | r high protein | 38 | 0.951 | 0.094 |
| 16879 | D high protein | 42 | 0.920 | 0.006 |
| 16921 | D high protein | 48 | 0.950 | 0.040 |
| 17238 | r high oil | 44 | 0.872 | <0.001 |
| 18663 | r high protein | 78 | 0.969 | 0.052 |
| 18734 | r high protein | 76 | 0.907 | <0.001 |
| 18940 | inconclusive | 32 | 0.974 | 0.626 |
| 18974 | r high protein | 39 | 0.967 | 0.295 |
| 21401 | D high protein | 49 | 0.972 | 0.288 |
| 21424 | D high protein | 54 | 0.975 | 0.325 |
| 21502 | inconclusive | 41 | 0.980 | 0.687 |
| 21715 | r low oil | 51 | 0.964 | 0.125 |
| 21768 | inconclusive | 42 | 0.991 | 0.982 |
| 21775 | r high protein | 31 | 0.963 | 0.357 |
| 21831 | D high protein | 58 | 0.987 | 0.793 |
| 21855 | r high protein | 48 | 0.959 | 0.091 |
| 21887 | D high protein | 57 | 0.982 | 0.552 |
| 22080 | Inconclusive | 41 | 0.950 | 0.071 |
| 22081 | Inconclusive | 30 | 0.975 | 0.688 |
| 22102 | r high protein | 38 | 0.924 | 0.013 |
| 22143 | D high protein | 40 | 0.939 | 0.031 |
| 22187 | Inconclusive | 56 | 0.988 | 0.841 |
| 22189 | Inconclusive | 53 | 0.970 | 0.199 |
| 22426 | D high protein | 31 | 0.953 | 0.195 |
PID—Plant ID Number, SW—Shapiro–Wilks statistic in test for normality, p—p-value. D—dominant, r—recessive.
Publisher’s Note: MDPI stays neutral with regard to jurisdictional claims in published maps and institutional affiliations. |
© 2022 by the author. Licensee MDPI, Basel, Switzerland. This article is an open access article distributed under the terms and conditions of the Creative Commons Attribution (CC BY) license (https://creativecommons.org/licenses/by/4.0/).
Share and Cite
MDPI and ACS Style
Hudson, K. Soybean Protein and Oil Variants Identified through a Forward Genetic Screen for Seed Composition. Plants 2022, 11, 2966. https://doi.org/10.3390/plants11212966
AMA Style
Hudson K. Soybean Protein and Oil Variants Identified through a Forward Genetic Screen for Seed Composition. Plants. 2022; 11(21):2966. https://doi.org/10.3390/plants11212966
Chicago/Turabian StyleHudson, Karen. 2022. "Soybean Protein and Oil Variants Identified through a Forward Genetic Screen for Seed Composition" Plants 11, no. 21: 2966. https://doi.org/10.3390/plants11212966
Note that from the first issue of 2016, this journal uses article numbers instead of page numbers. See further details here.