
The Influence of End-of-Day Blue Light on the Growth, Photosynthetic, and Metabolic Parameters of Lettuce at Different Development Stages

 ,
,  ,
,  and
and
Abstract
:1. Introduction
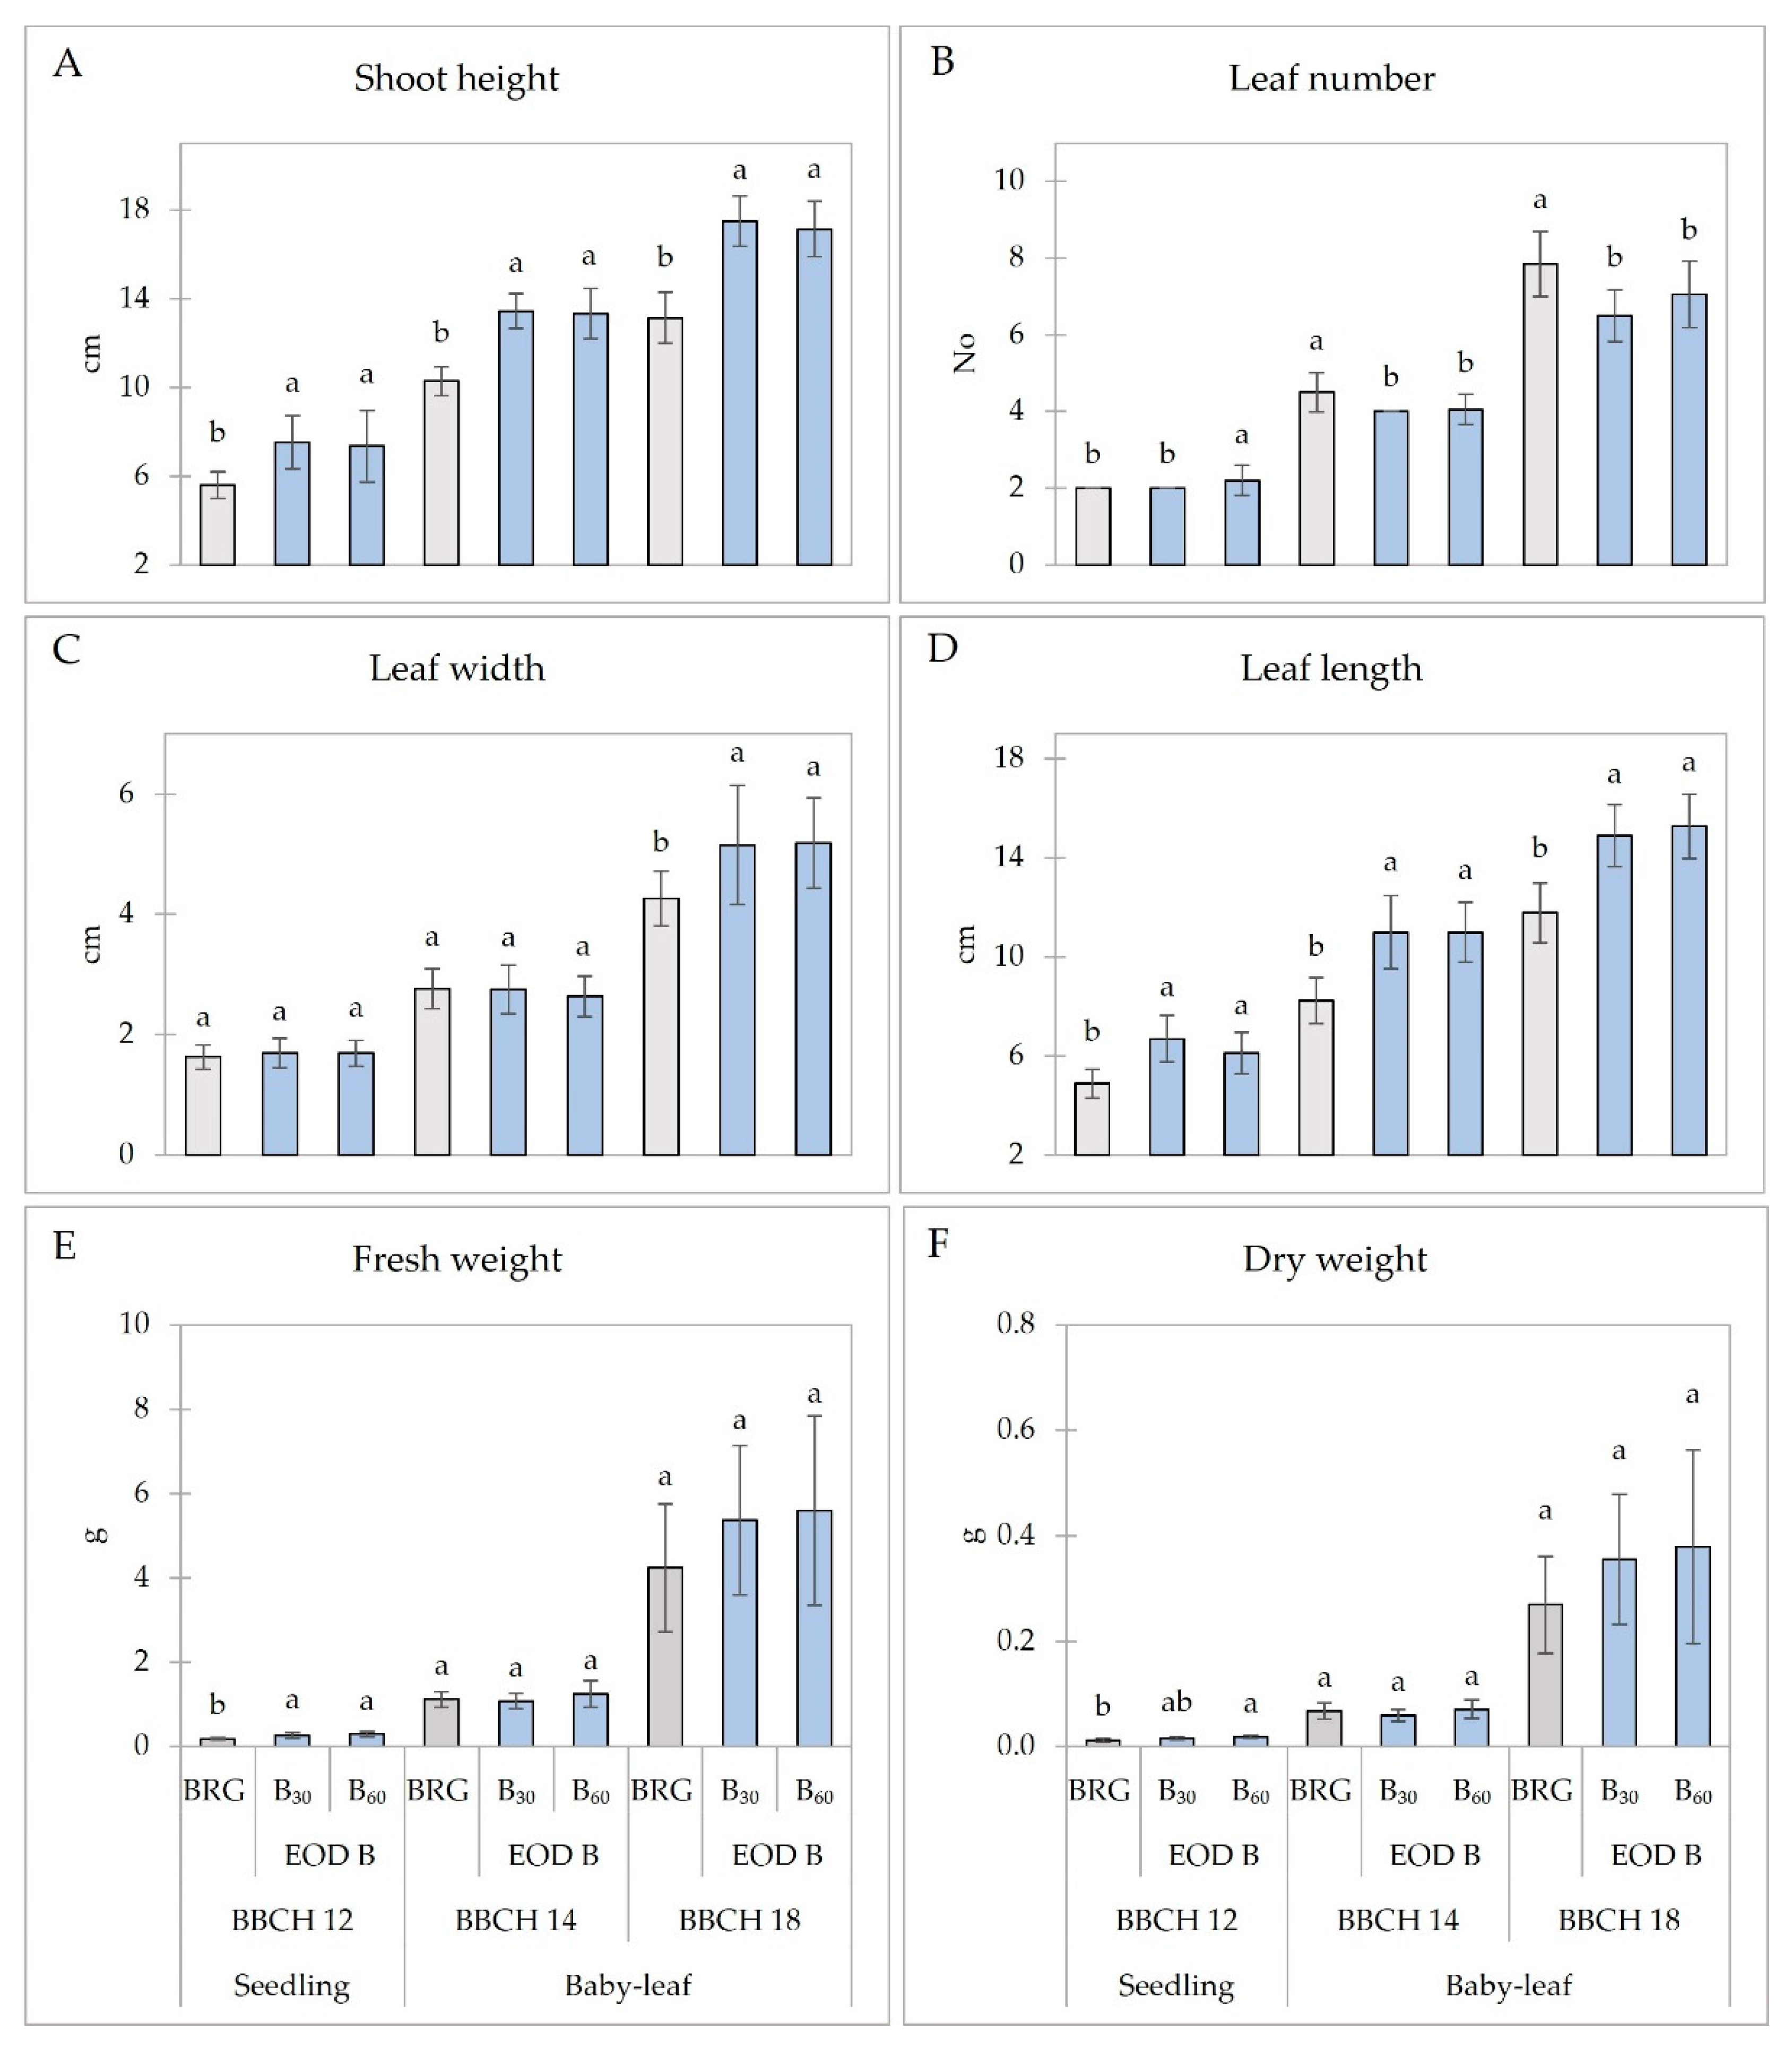
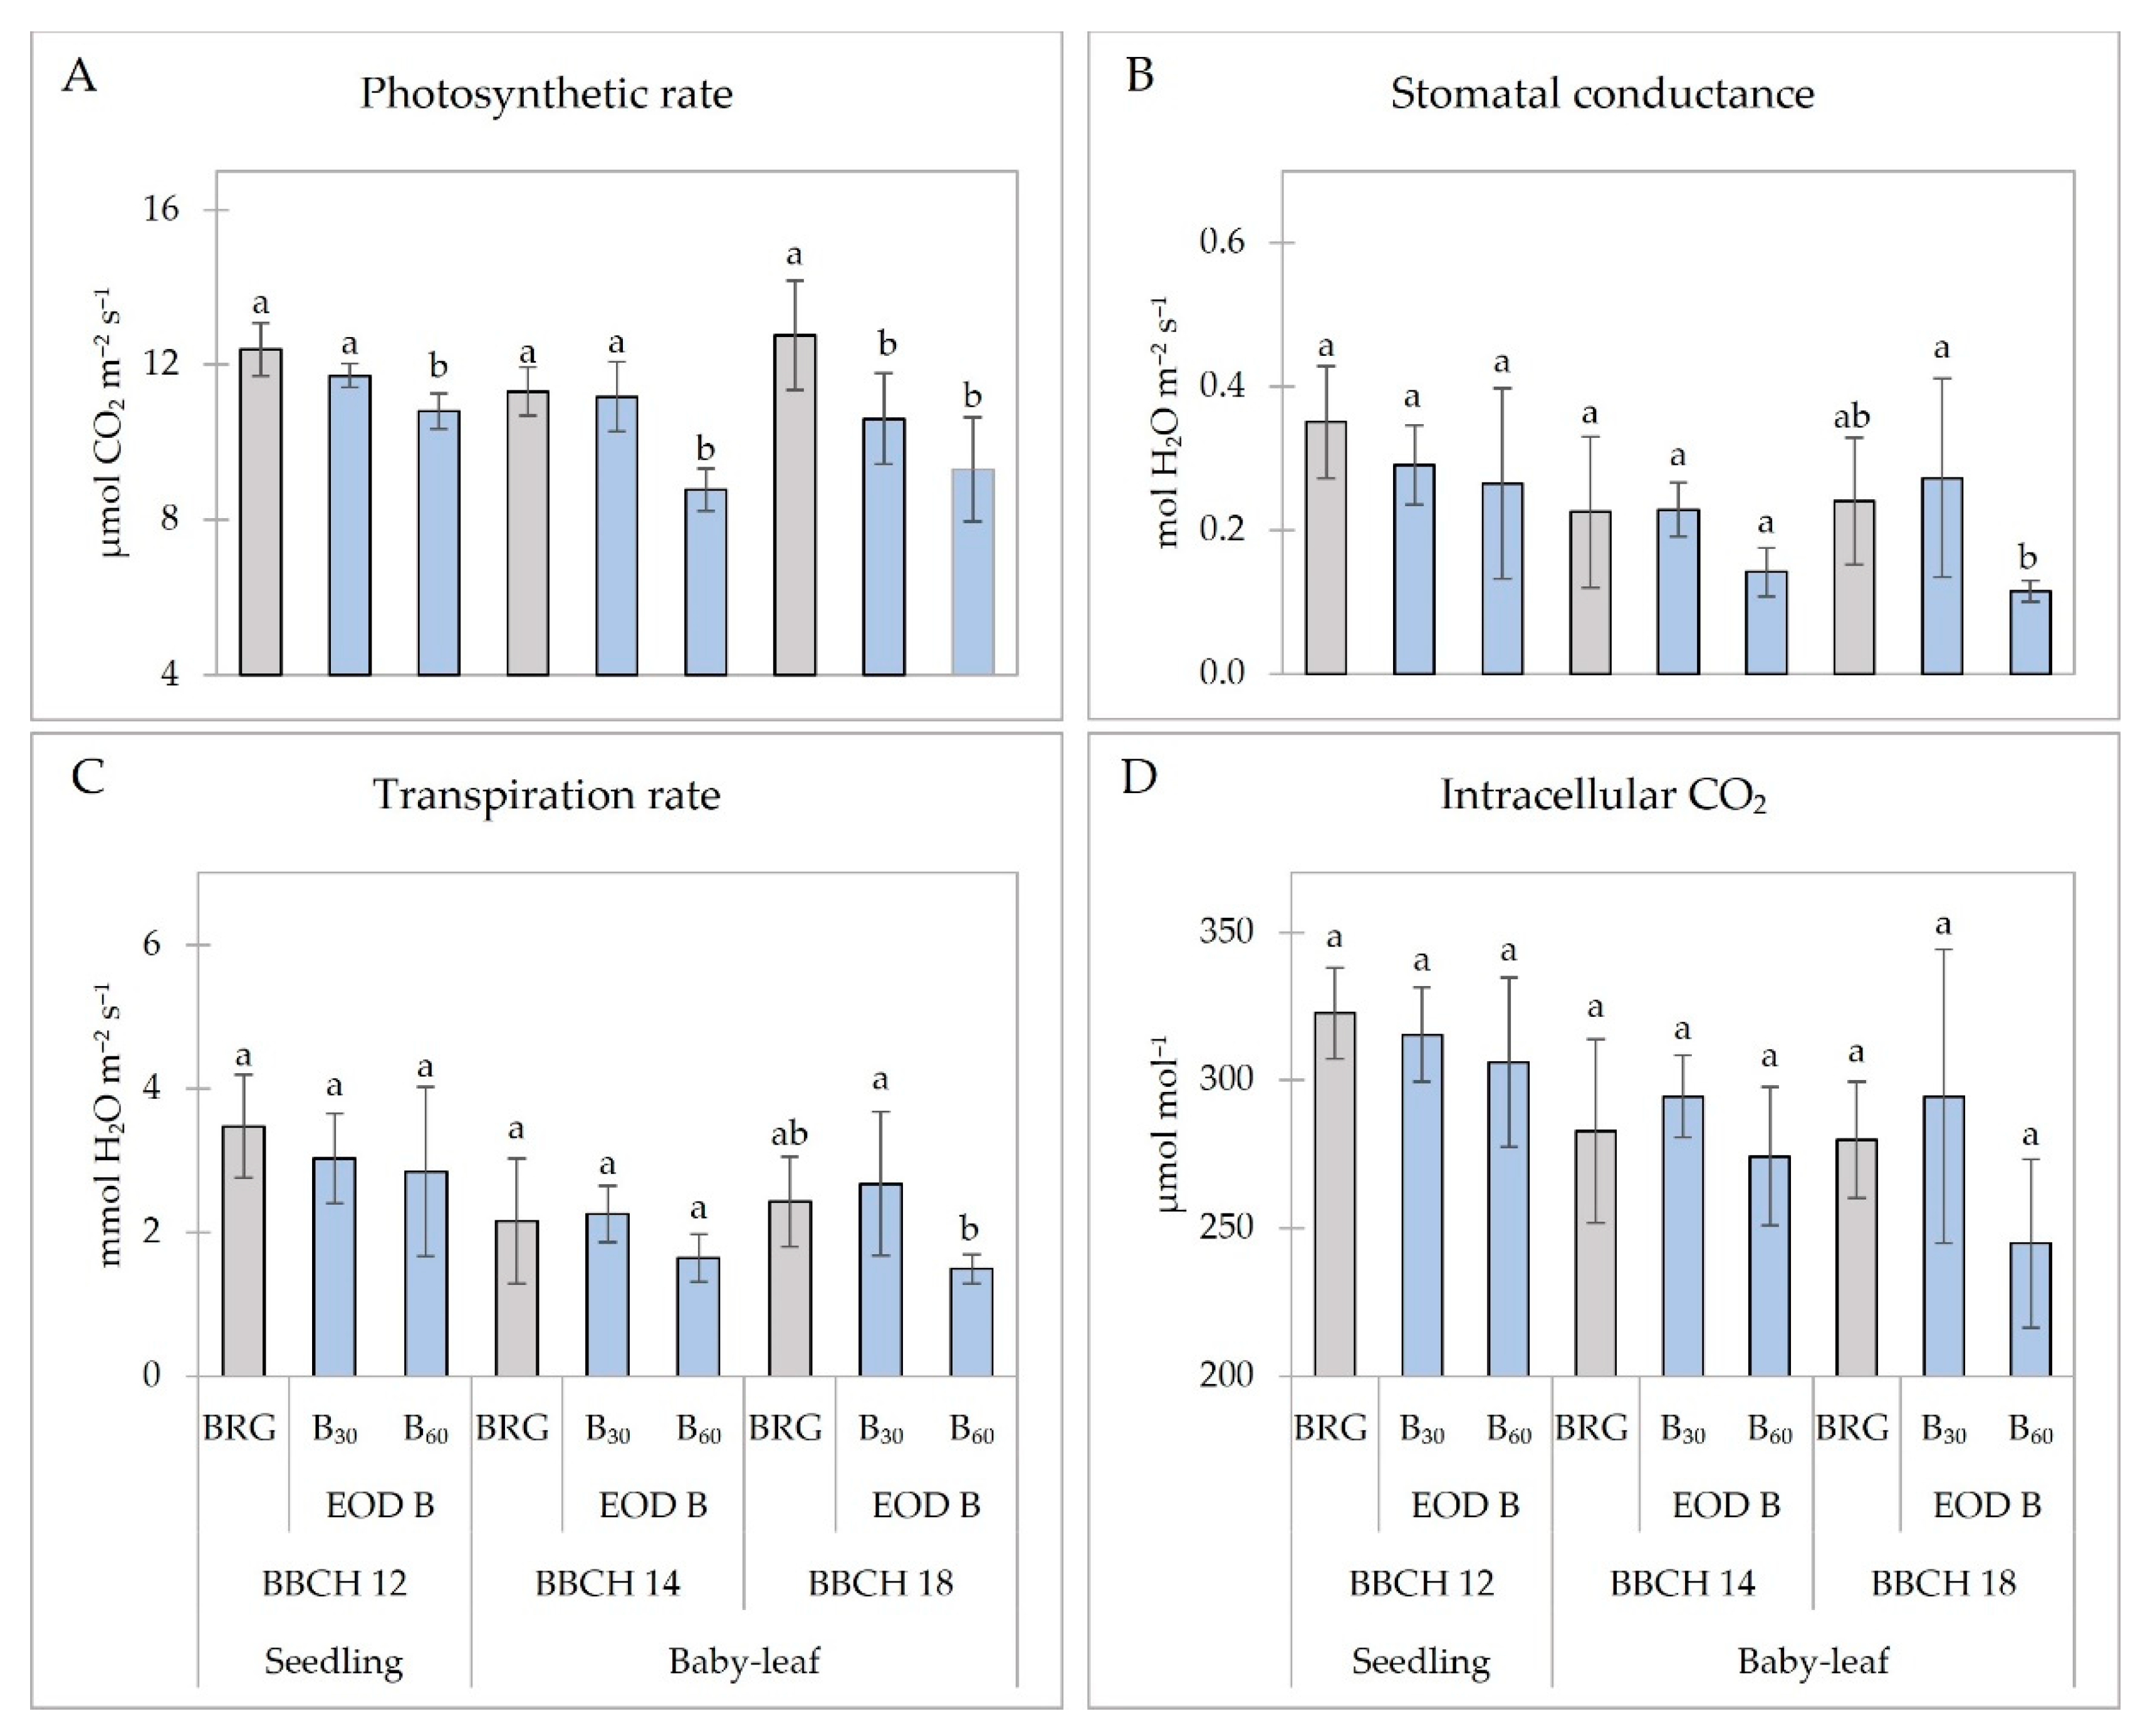
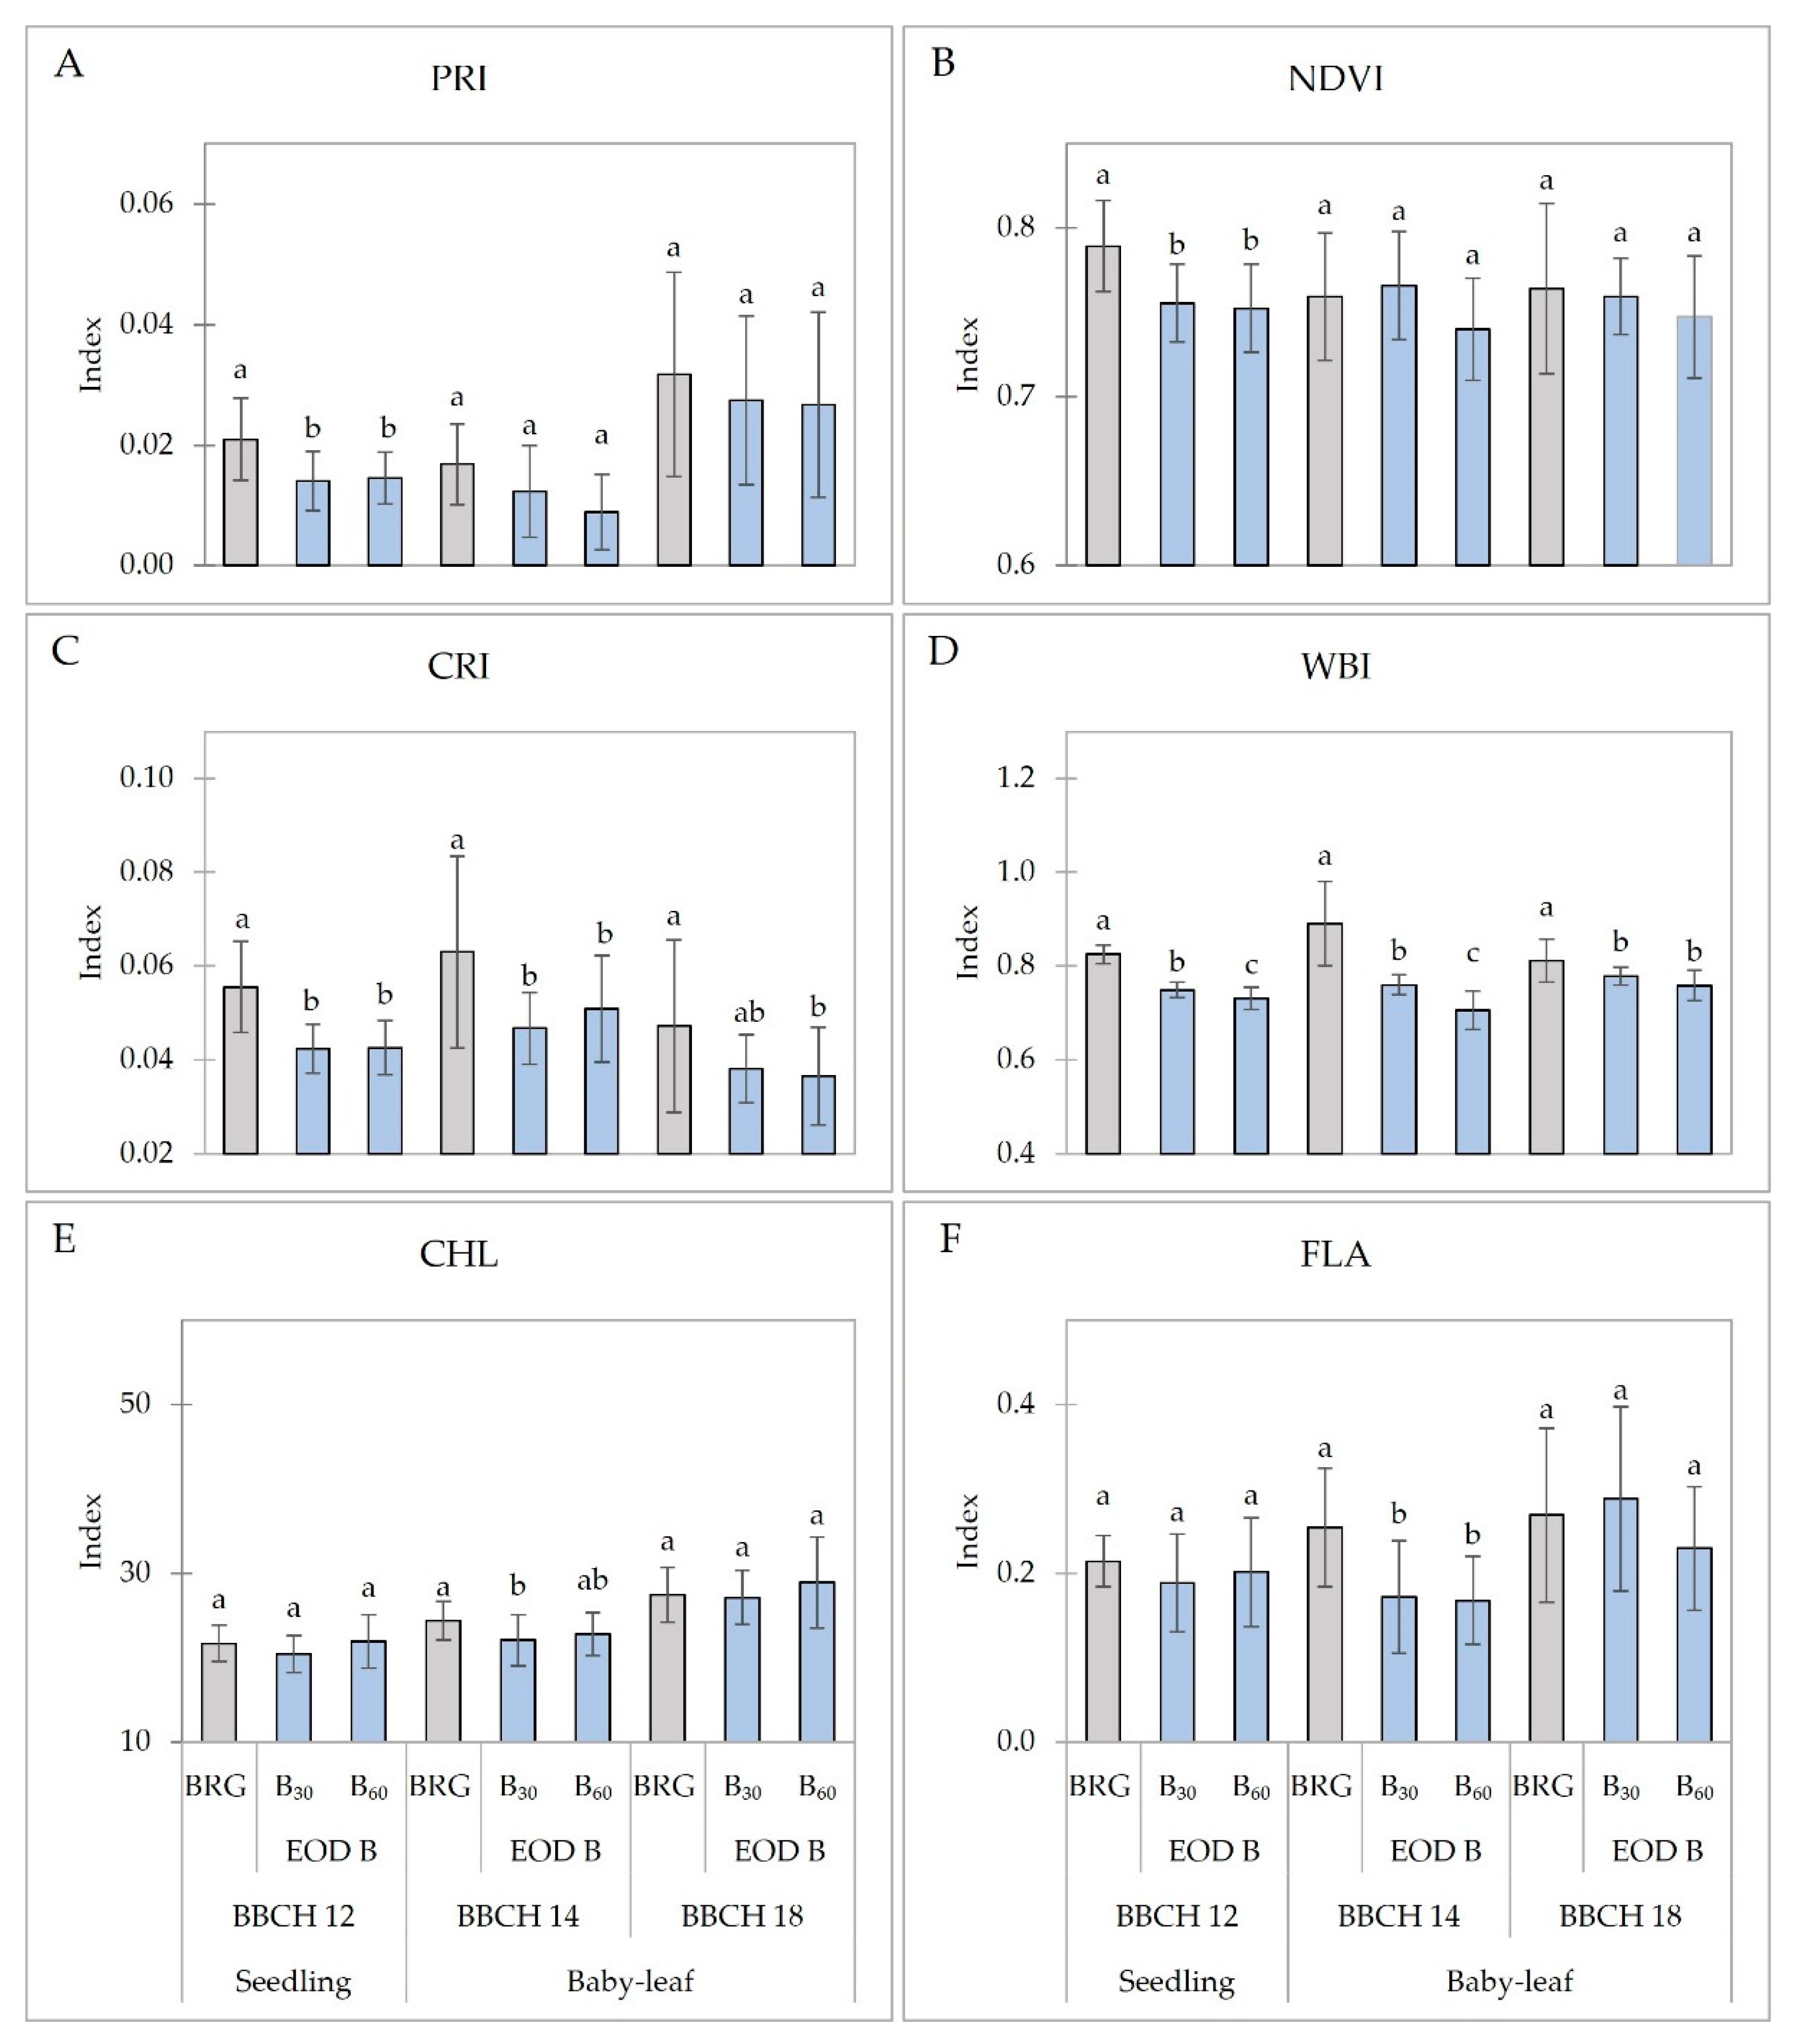
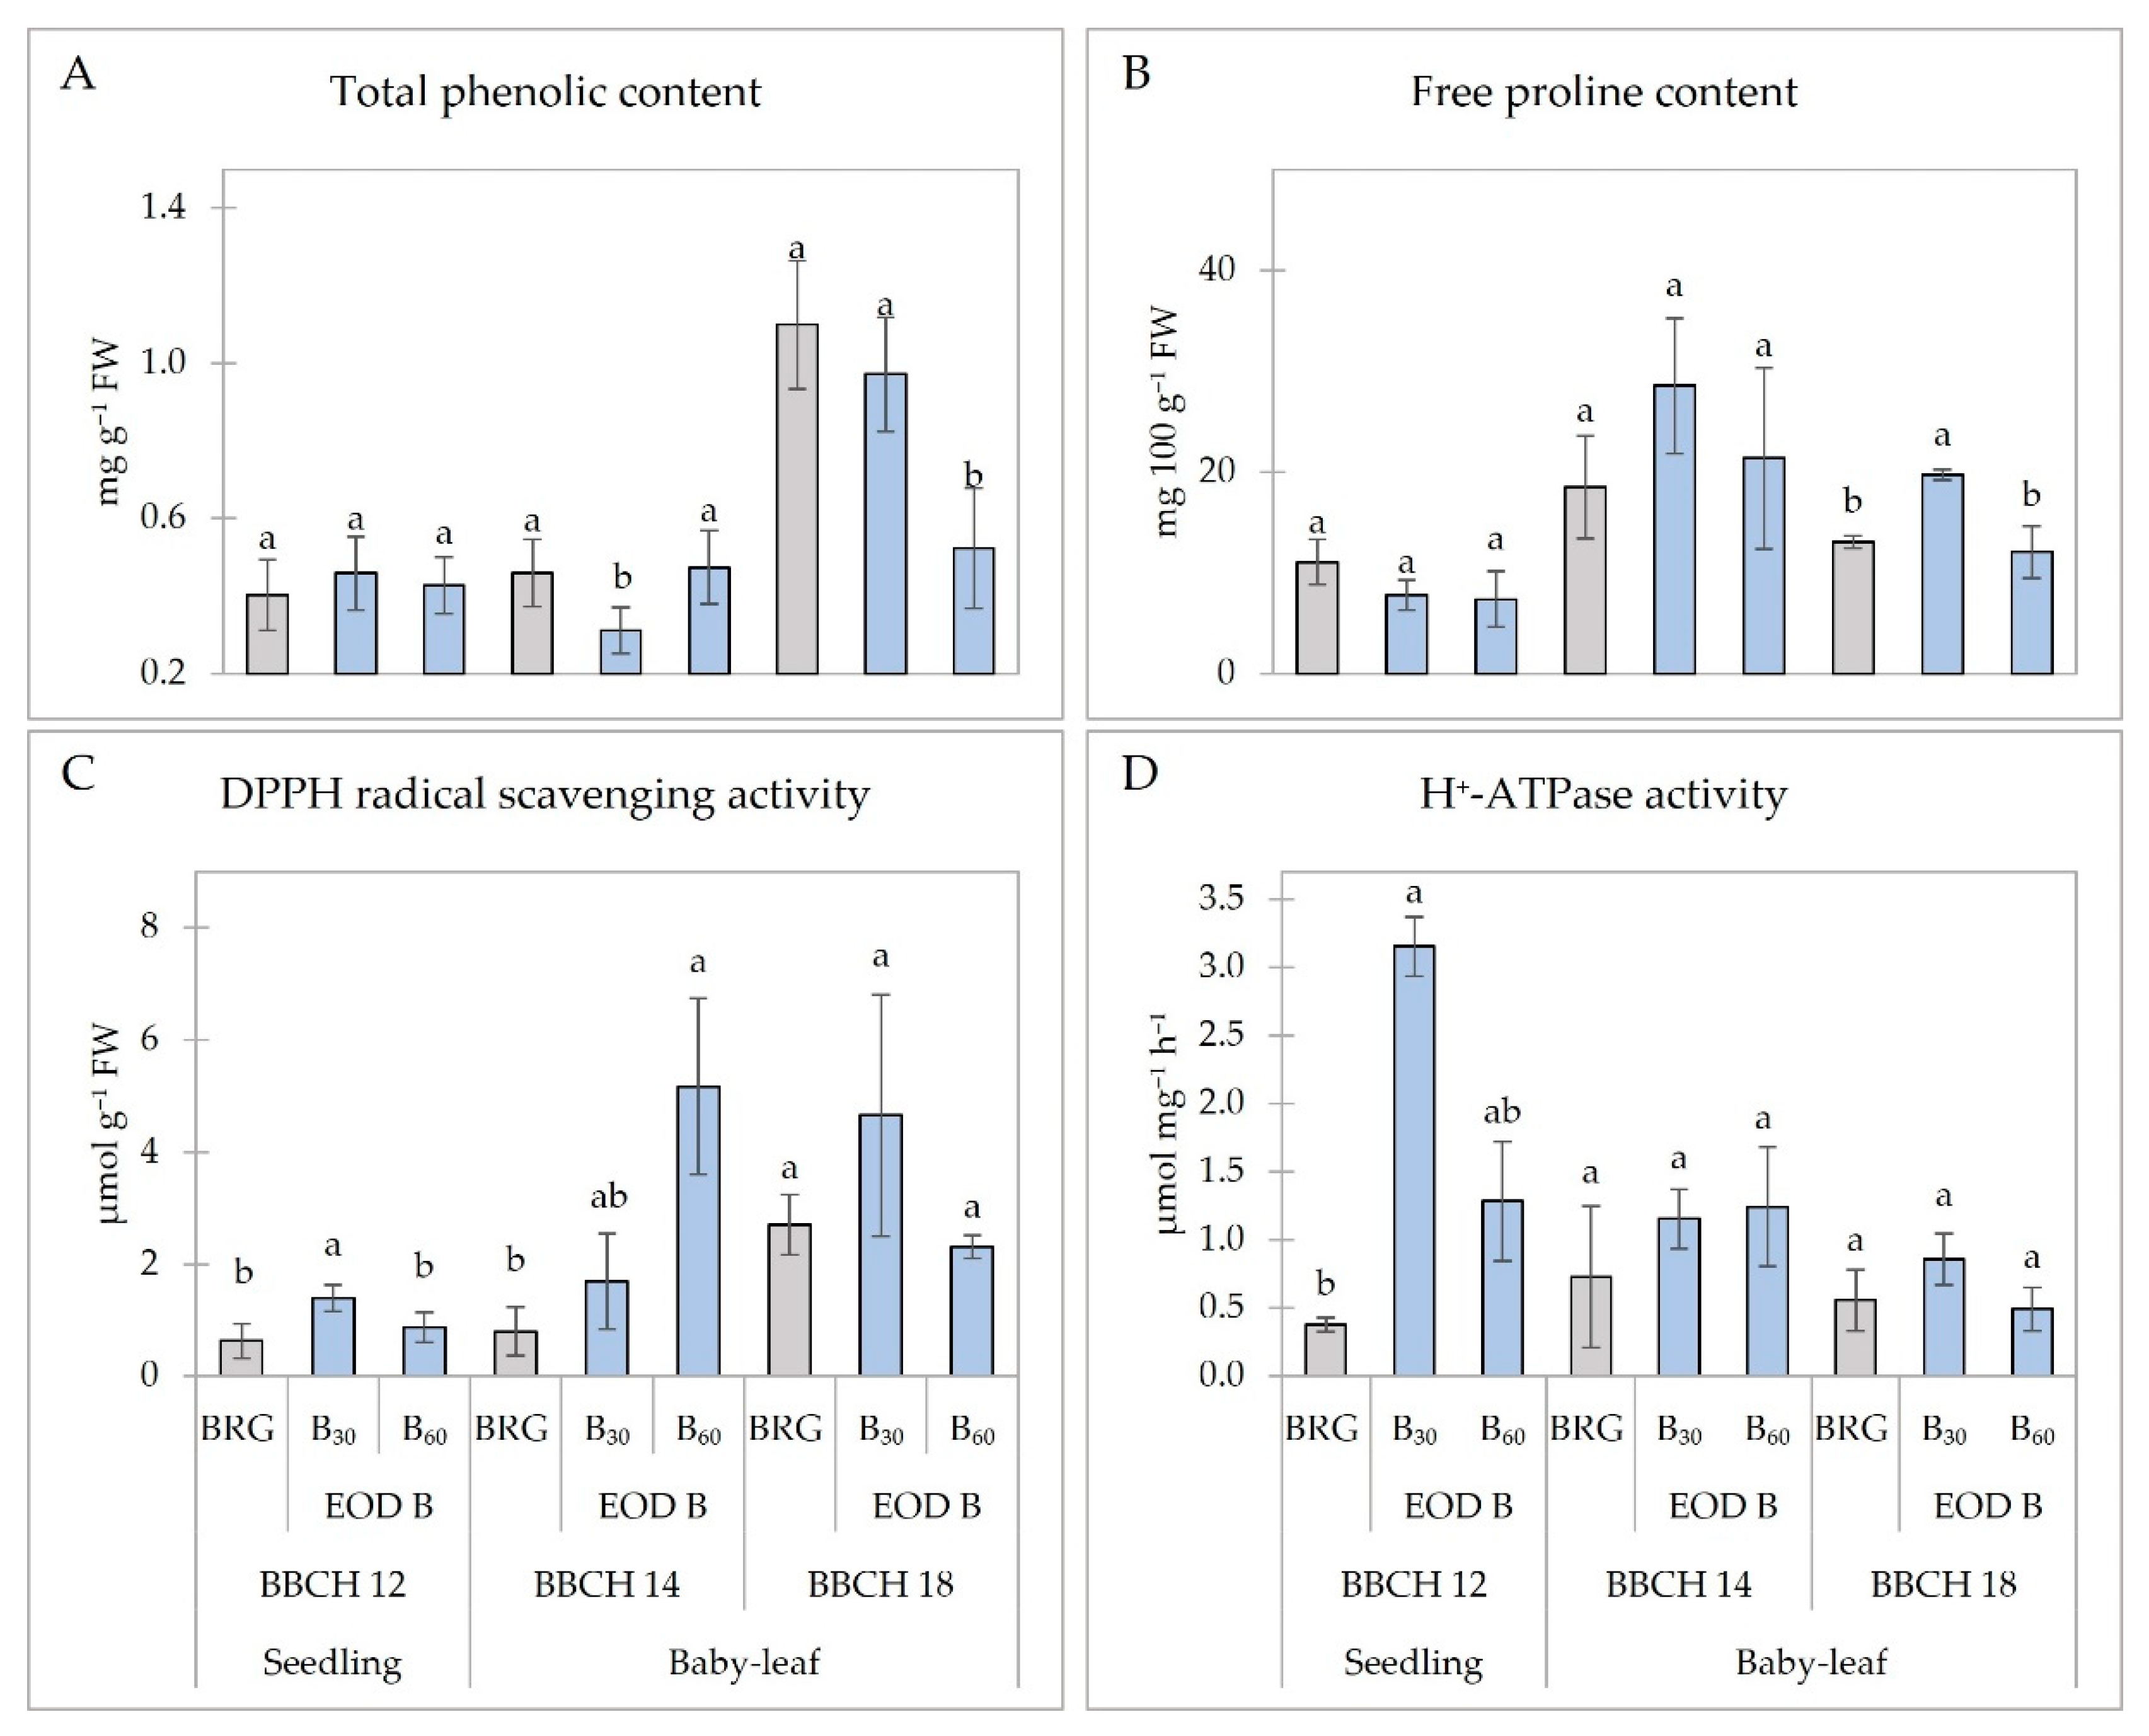
2. Results
2.1. Growth
2.2. Photosynthetic Indices
2.3. Spectral Reflectance Indices
2.4. Metabolic Response
3. Discussion and Conclusions
4. Materials and Methods
4.1. Growing Conditions
4.2. Lighting Treatments
4.3. Growth Measurements
4.4. Measurements of Photosynthesis
4.5. Nondestructive Measurements of Spectral Indices
4.6. Determination of Total Phenolic Content
4.7. Evaluation of DPPH Free Radical Scavenging Activity
4.8. Determination of Free Proline Content
4.9. Determination of H+-ATPase Activity
4.10. Statistical Analysis
Author Contributions
Funding
Data Availability Statement
Conflicts of Interest
References
- Wong, C.E.; Teo, Z.W.N.; Shen, L.; Yu, H. Seeing the Lights for Leafy Greens in Indoor Vertical Farming. Trends Food Sci. Technol. 2020, 106, 48–63. [Google Scholar] [CrossRef]
- Pocock, T. Light-Emitting Diodes and the Modulation of Specialty Crops: Light Sensing and Signaling Networks in Plants. HortScience 2015, 50, 1281–1284. [Google Scholar] [CrossRef] [Green Version]
- Harbinson, J.; Kaiser, E.; Morales, A.S. Integrating the stages of photosynthesis. In Photosynthesis in Action; Academic Press: Cambridge, MA, USA, 2022; pp. 195–242. [Google Scholar] [CrossRef]
- Legris, M.; Ince, Y.Ç.; Fankhauser, C. Molecular Mechanisms Underlying Phytochrome-Controlled Morphogenesis in Plants. Nat. Commun. 2019, 10, 5219. [Google Scholar] [CrossRef] [Green Version]
- Yu, X.; Liu, H.; Klejnot, J.; Lin, C. The Cryptochrome Blue Light Receptors. Arab. Book 2010, 8, e0135. [Google Scholar] [CrossRef] [PubMed] [Green Version]
- Wang, H.; Deng, X.W. Phytochrome Signaling Mechanism. Arab. Book 2004, 3, e0074.1. [Google Scholar] [CrossRef] [Green Version]
- Mawphlang, O.I.L.; Kharshiing, E. Photoreceptor Mediated Plant Growth Responses: Implications for Photoreceptor Engineering toward Improved Performance in Crops. Front. Plant Sci. 2017, 8, 1181. [Google Scholar] [CrossRef] [Green Version]
- Benke, K.; Tomkins, B. Future Food-Production Systems: Vertical Farming and Controlled-Environment Agriculture. Sustain. Sci. Pract. Policy 2017, 13, 13–26. [Google Scholar] [CrossRef] [Green Version]
- Hornyák, M.; Dziurka, M.; Kula-Maximenko, M.; Pastuszak, J.; Szczerba, A.; Szklarczyk, M.; Płażek, A. Photosynthetic Efficiency, Growth and Secondary Metabolism of Common Buckwheat (Fagopyrum Esculentum Moench) in Different Controlled-Environment Production Systems. Sci. Rep. 2022, 12, 257. [Google Scholar] [CrossRef] [PubMed]
- Rouphael, Y.; Kyriacou, M.C.; Petropoulos, S.A.; de Pascale, S.; Colla, G. Improving Vegetable Quality in Controlled Environments. Sci. Hortic. 2018, 234, 275–289. [Google Scholar] [CrossRef]
- Song, S.; Kusuma, P.; Carvalho, S.D.; Li, Y.; Folta, K.M. Manipulation of Seedling Traits with Pulsed Light in Closed Controlled Environments. Environ. Exp. Bot. 2019, 166, 103803. [Google Scholar] [CrossRef]
- Park, Y.G.; Park, J.E.; Hwang, S.J.; Jeong, B.R. Light Source and CO2 Concentration Affect Growth and Anthocyanin Content of Lettuce under Controlled Environment. Hortic. Environ. Biotechnol. 2012, 53, 460–466. [Google Scholar] [CrossRef]
- Samuolienė, G.; Brazaitytė, A.; Vaštakaitė, V. Light-Emitting Diodes (LEDs) for Improved Nutritional Quality. In Light Emitting Diodes for Agriculture: Smart Lighting; Springer: Singapore, 2017; pp. 149–190. ISBN 9789811058073. [Google Scholar]
- Yeh, N.; Chung, J.P. High-Brightness LEDs—Energy Efficient Lighting Sources and Their Potential in Indoor Plant Cultivation. Renew. Sustain. Energy Rev. 2009, 13, 2175–2180. [Google Scholar] [CrossRef]
- Bantis, F.; Smirnakou, S.; Ouzounis, T.; Koukounaras, A.; Ntagkas, N.; Radoglou, K. Current Status and Recent Achievements in the Field of Horticulture with the Use of Light-Emitting Diodes (LEDs). Sci. Hortic. 2018, 235, 437–451. [Google Scholar] [CrossRef]
- Chen, J.; Chen, Z.; Li, Z.; Zhao, Y.; Chen, X.; Wang-Pruski, G.; Guo, R. Effect of Photoperiod on Chinese Kale (Brassica alboglabra) Sprouts Under White or Combined Red and Blue Light. Front. Plant Sci. 2021, 11, 589746. [Google Scholar] [CrossRef] [PubMed]
- Piovene, C.; Orsini, F.; Bosi, S.; Sanoubar, R.; Bregola, V.; Dinelli, G.; Gianquinto, G. Optimal Red: Blue Ratio in Led Lighting for Nutraceutical Indoor Horticulture. Sci. Hortic. 2015, 193, 202–208. [Google Scholar] [CrossRef]
- Samuolienė, G.; Brazaitytė, A.; Viršilė, A.; Jankauskienė, J.; Sakalauskienė, S.; Duchovskis, P. Red Light-Dose or Wavelength-Dependent Photoresponse of Antioxidants in Herb Microgreens. PLoS ONE 2016, 11, e0163405. [Google Scholar] [CrossRef] [Green Version]
- Kim, H.-H.; Goins, G.D.; Wheeler, R.M.; Sager, J.C. Green-Light Supplementation for Enhanced Lettuce Growth under Red-and Blue-Light-Emitting Diodes. HortScience 2004, 39, 1617–1622. [Google Scholar] [CrossRef] [PubMed] [Green Version]
- Lin, K.H.; Huang, M.Y.; Huang, W.D.; Hsu, M.H.; Yang, Z.W.; Yang, C.M. The Effects of Red, Blue, and White Light-Emitting Diodes on the Growth, Development, and Edible Quality of Hydroponically Grown Lettuce (Lactuca sativa L. Var. Capitata). Sci. Hortic. 2013, 150, 86–91. [Google Scholar] [CrossRef]
- Chia, P.-L.; Kubota, C. End-of-day Far-red Light Quality and Dose Requirements for Tomato Rootstock Hypocotyl Elongation. HortScience 2010, 45, 1501–1506. [Google Scholar] [CrossRef]
- Kalaitzoglou, P.; van Ieperen, W.; Harbinson, J.; van der Meer, M.; Martinakos, S.; Weerheim, K.; Nicole, C.C.S.; Marcelis, L.F.M. Effects of Continuous or End-of-Day Far-Red Light on Tomato Plant Growth, Morphology, Light Absorption, and Fruit Production. Front. Plant Sci. 2019, 10, 322. [Google Scholar] [CrossRef] [PubMed] [Green Version]
- Liu, Q.; Zhang, H.; Mei, Y.; Li, Q.; Bai, Y.; Yu, H.; Xu, X.; Ma, J.; Wu, Y.; Yang, Z. Integrated Transcriptome and Metabolome Analysis Reveals an Essential Role for Auxin in Hypocotyl Elongation during End-of-Day Far-Red Treatment of Cucurbita moschata (Duch. Ex Lam.). Agronomy 2021, 11, 853. [Google Scholar] [CrossRef]
- Frąszczak, B.; Gąsecka, M.; Golcz, A.; Zawirska-Wojtasiak, R. The Effect of Radiation of LED Modules on the Growth of Dill (Anethum graveolens L.). Open Life Sci. 2016, 11, 61–70. [Google Scholar] [CrossRef] [Green Version]
- Chinchilla, S.; Izzo, L.G.; van Santen, E.; Gómez, C. Growth and Physiological Responses of Lettuce Grown under Pre-Dawn or End-of-Day Sole-Source Light-Quality Treatments. Horticulturae 2018, 4, 8. [Google Scholar] [CrossRef] [Green Version]
- Sronsri, C.; Sittipol, W.; U-yen, K. Quantity and Quality of Lettuce (Lactuca sativa L.) Grown by a Circulating Hydroponic Method with a Halbach Array Magnetizer. J. Food Compos. Anal. 2022, 108, 104460. [Google Scholar] [CrossRef]
- Park, Y.; Gómez, C.; Runkle, E.S. Indoor Production of Ornamental Seedlings, Vegetable Transplants, and Microgreens. In Plant Factory Basics, Applications and Advances; Elsevier: Amsterdam, The Netherlands, 2022; pp. 351–375. [Google Scholar] [CrossRef]
- Martínez-Sánchez, A.; Luna, M.C.; Selma, M.; Tudela, J.A.; Abad, J.; Gil, M.I. Baby-Leaf and Multi-Leaf of Green and Red Lettuces Are Suitable Raw Materials for the Fresh-Cut Industry. Postharvest Biol. Technol. 2012, 63, 1–10. [Google Scholar] [CrossRef]
- Vaštakaitė-Kairienė, V.; Brazaitytė, A.; Viršilė, A.; Samuolienė, G.; Miliauskienė, J.; Jankauskienė, J.; Novičkovas, A.; Duchovskis, P. The Nutritional Value of Brassica Leafy Greens in Different Growth Stages. In Acta Horticulturae; International Society for Horticultural Science: Leuven, Belgium, 2020; Volume 1271, pp. 455–463. [Google Scholar]
- Chang, C.L.; Chang, K.P. The Growth Response of Leaf Lettuce at Different Stages to Multiple Wavelength-Band Light-Emitting Diode Lighting. Sci. Hortic. 2014, 179, 78–84. [Google Scholar] [CrossRef]
- Wang, J.; Lu, W.; Tong, Y.; Yang, Q. Leaf Morphology, Photosynthetic Performance, Chlorophyll Fluorescence, Stomatal Development of Lettuce (Lactuca sativa L.) Exposed to Different Ratios of Red Light to Blue Light. Front. Plant Sci. 2016, 7, 250. [Google Scholar] [CrossRef] [PubMed] [Green Version]
- Vaštakaitė-Kairienė, V.; Kelly, N.; Runkle, E.S. Regulation of the Photon Spectrum on Growth and Nutritional Attributes of Baby-Leaf Lettuce at Harvest and during Postharvest Storage. Plants 2021, 10, 549. [Google Scholar] [CrossRef] [PubMed]
- Johkan, M.; Shoji, K.; Goto, F.; Hashida, S.-N.; Yoshihara, T. Blue Light-emitting Diode Light Irradiation of Seedlings Improves Seedling Quality and Growth after Transplanting in Red Leaf Lettuce. HortScience 2010, 45, 1809–1814. [Google Scholar] [CrossRef] [Green Version]
- Christie, J.M. Phototropin Blue-Light Receptors. Annu. Rev. Plant Biol. 2007, 58, 21–45. [Google Scholar] [CrossRef] [PubMed] [Green Version]
- Kong, Y.; Stasiak, M.; Dixon, M.A.; Zheng, Y. Blue Light Associated with Low Phytochrome Activity Can Promote Elongation Growth as Shade-Avoidance Response: A Comparison with Red Light in Four Bedding Plant Species. Environ. Exp. Bot. 2018, 155, 345–359. [Google Scholar] [CrossRef]
- Yang, J.; Song, J.; Jeong, B.R. Low-Intensity Blue Light Supplemented during Photoperiod in Controlled Environment Induces Flowering and Antioxidant Production in Kalanchoe. Antioxidants 2022, 11, 811. [Google Scholar] [CrossRef] [PubMed]
- Brazaitytė, A.; Miliauskienė, J.; Vaštakaitė-Kairienė, V.; Sutulienė, R.; Laužikė, K.; Duchovskis, P.; Małek, S. Effect of Different Ratios of Blue and Red Led Light on Brassicaceae Microgreens under a Controlled Environment. Plants 2021, 10, 801. [Google Scholar] [CrossRef]
- Li, Y.; Shi, R.; Jiang, H.; Wu, L.; Zhang, Y.; Song, S.; Su, W.; Liu, H. End-of-Day Led Lightings Influence the Leaf Color, Growth and Phytochemicals in Two Cultivars of Lettuce. Agronomy 2020, 10, 1475. [Google Scholar] [CrossRef]
- Liere, K.; Weihe, A.; Börner, T. The Transcription Machineries of Plant Mitochondria and Chloroplasts: Composition, Function, and Regulation. J. Plant Physiol. 2011, 168, 1345–1360. [Google Scholar] [CrossRef] [PubMed]
- Hogewoning, S.W.; Trouwborst, G.; Maljaars, H.; Poorter, H.; van Ieperen, W.; Harbinson, J. Blue Light Dose-Responses of Leaf Photosynthesis, Morphology, and Chemical Composition of Cucumis Sativus Grown under Different Combinations of Red and Blue Light. J. Exp. Bot. 2010, 61, 3107–3117. [Google Scholar] [CrossRef] [PubMed]
- Matsuda, R.; Ohashi-Kaneko, K.; Fujiwara, K.; Kurata, K. Analysis of the Relationship between Blue-Light Photon Flux Density and the Photosynthetic Properties of Spinach (Spinacia oleracea L.) Leaves with Regard to the Acclimation of Photosynthesis to Growth Irradiance. Soil Sci. Plant Nutr. 2007, 53, 459–465. [Google Scholar] [CrossRef] [Green Version]
- Gamon, J.A.; Peñuelas, J.; Field, C.B. A Narrow-Waveband Spectral Index That Tracks Diurnal Changes in Photosynthetic Efficiency. Remote Sens. Environ. 1992, 41, 35–44. [Google Scholar] [CrossRef]
- Penuelas, J.; Pinol, J.; Ogaya, R.; Filella, I. Estimation of Plant Water Concentration by the Reflectance Water Index WI (R900/R970). Int. J. Remote Sens. 1997, 18, 2869–2875. [Google Scholar] [CrossRef]
- Aryal, S.; Baniya, M.K.; Danekhu, K.; Kunwar, P.; Gurung, R.; Koirala, N. Total Phenolic Content, Flavonoid Content and Antioxidant Potential of Wild Vegetables from Western Nepal. Plants 2019, 8, 96. [Google Scholar] [CrossRef] [PubMed] [Green Version]
- Babbar, N.; Oberoi, H.S.; Sandhu, S.K. Therapeutic and Nutraceutical Potential of Bioactive Compounds Extracted from Fruit Residues. Crit. Rev. Food Sci. Nutr. 2015, 55, 319–337. [Google Scholar] [CrossRef]
- Hayat, S.; Hayat, Q.; Alyemeni, M.N.; Wani, A.S.; Pichtel, J.; Ahmad, A. Role of Proline under Changing Environments: A Review. Plant Signal. Behav. 2012, 7, 1456–1466. [Google Scholar] [CrossRef] [PubMed] [Green Version]
- Kinoshita, T.; Shimazaki, K.I. Blue Light Activates the Plasma Membrane H+-ATPase by Phosphorylation of the C-Terminus in Stomatal Guard Cells. EMBO J. 1999, 18, 5548–5558. [Google Scholar] [CrossRef] [Green Version]
- Li, Y.; Zeng, H.; Xu, F.; Yan, F.; Xu, W. H+-ATPases in Plant Growth and Stress Responses. Annu. Rev. Plant Biol. 2022, 73, 495–521. [Google Scholar] [CrossRef]
- Janicka-Russak, M. Plant Plasma Membrane H+-ATPase in Adaptation of Plants to Abiotic Stresses. In Abiotic Stress Response in Plants; Shanker, A., Venkateswarlu, B., Eds.; IntechOpen: Rijeka, Croatia, 2011. [Google Scholar]
- Ainsworth, E.A.; Gillespie, K.M. Estimation of Total Phenolic Content and Other Oxidation Substrates in Plant Tissues Using Folin-Ciocalteu Reagent. Nat. Protoc. 2007, 2, 875–877. [Google Scholar] [CrossRef]
- Mishra, K.; Ojha, H.; Chaudhury, N.K. Estimation of Antiradical Properties of Antioxidants Using DPPH- Assay: A Critical Review and Results. Food Chem. 2012, 130, 1036–1043. [Google Scholar] [CrossRef]
- Sharma, O.P.; Bhat, T.K. DPPH Antioxidant Assay Revisited. Food Chem. 2009, 113, 1202–1205. [Google Scholar] [CrossRef]
- Jankovska-Bortkevič, E.; Gavelienė, V.; Koryznienė, D.; Jankauskienė, J.; Mockevičiūtė, R.; Jurkonienė, S. Response of Winter Oilseed Rape to Imitated Temperature Fluctuations in Autumn-Winter Period. Environ. Exp. Bot. 2019, 166, 103801. [Google Scholar] [CrossRef]
- Jankovska-Bortkevič, E.; Gavelienė, V.; Šveikauskas, V.; Mockevičiūtė, R.; Jankauskienė, J.; Todorova, D.; Sergiev, I.; Jurkonienė, S. Foliar Application of Polyamines Modulates Winter Oilseed Rape Responses to Increasing Cold. Plants 2020, 9, 179. [Google Scholar] [CrossRef] [Green Version]
- Bradford, M.M. A Rapid and Sensitive Method for the Quantitation of Microgram Quantities of Protein Utilizing the Principle of Protein-Dye Binding. Anal. Biochem. 1976, 72, 248–254. [Google Scholar] [CrossRef]


| Lighting Treatment | 16 h | EOD 4 h | DLI, mol m−2 d−1 | ||
|---|---|---|---|---|---|
| B, 450 nm | G, 530 nm | R, 660 nm | B, 450 nm | ||
| PPFD, µmol m−2 s−1 | |||||
| BRG (Control) | 10 | 20 | 170 | 0 | 11.52 |
| B30 | 10 | 20 | 170 | 30 | 11.95 |
| B60 | 10 | 20 | 170 | 60 | 12.38 |
Publisher’s Note: MDPI stays neutral with regard to jurisdictional claims in published maps and institutional affiliations. |
© 2022 by the authors. Licensee MDPI, Basel, Switzerland. This article is an open access article distributed under the terms and conditions of the Creative Commons Attribution (CC BY) license (https://creativecommons.org/licenses/by/4.0/).
Share and Cite
Vaštakaitė-Kairienė, V.; Samuolienė, G.; Šveikauskas, V.; Laužikė, K.; Jurkonienė, S. The Influence of End-of-Day Blue Light on the Growth, Photosynthetic, and Metabolic Parameters of Lettuce at Different Development Stages. Plants 2022, 11, 2798. https://doi.org/10.3390/plants11202798
Vaštakaitė-Kairienė V, Samuolienė G, Šveikauskas V, Laužikė K, Jurkonienė S. The Influence of End-of-Day Blue Light on the Growth, Photosynthetic, and Metabolic Parameters of Lettuce at Different Development Stages. Plants. 2022; 11(20):2798. https://doi.org/10.3390/plants11202798
Chicago/Turabian StyleVaštakaitė-Kairienė, Viktorija, Giedrė Samuolienė, Vaidevutis Šveikauskas, Kristina Laužikė, and Sigita Jurkonienė. 2022. "The Influence of End-of-Day Blue Light on the Growth, Photosynthetic, and Metabolic Parameters of Lettuce at Different Development Stages" Plants 11, no. 20: 2798. https://doi.org/10.3390/plants11202798