Article

Effect of Mycotoxin Cytochalasin A on Photosystem II in Ageratina adenophora

1
Weed Research Laboratory, Nanjing Agricultural University, Nanjing 210095, China
2
Bioenergetics Laboratory, University of Geneva, CH-1254 Geneva, Switzerland
*
Author to whom correspondence should be addressed.
Plants 2022, 11(20), 2797; https://doi.org/10.3390/plants11202797
Submission received: 7 September 2022 / Revised: 18 October 2022 / Accepted: 18 October 2022 / Published: 21 October 2022
(This article belongs to the Special Issue Bioherbicide Development for Weed Control)

Abstract

:
Biological herbicides have received much attention due to their abundant resources, low development cost, unique targets and environmental friendliness. This study reveals some interesting effects of mycotoxin cytochalasin A (CA) on photosystem II (PSII). Our results suggested that CA causes leaf lesions on Ageratina adenophora due to its multiple effects on PSII. At a half-inhibitory concentration of 58.5 μΜ (I50, 58.5 μΜ), the rate of O2 evolution of PSII was significantly inhibited by CA. This indicates that CA possesses excellent phytotoxicity and exhibits potential herbicidal activity. Based on the increase in the J-step of the chlorophyll fluorescence rise OJIP curve and the analysis of some JIP-test parameters, similar to the classical herbicide diuron, CA interrupted PSII electron transfer beyond QA at the acceptor side, leading to damage to the PSII antenna structure and inactivation of reaction centers. Molecular docking model of CA and D1 protein of A. adenophora further suggests that CA directly targets the QB site of D1 protein. The potential hydrogen bonds are formed between CA and residues D1-His215, D1-Ala263 and D1-Ser264, respectively. The binding of CA to residue D1-Ala263 is novel. Thus, CA is a new natural PSII inhibitor. These results clarify the mode of action of CA in photosynthesis, providing valuable information and potential implications for the design of novel bioherbicides.

1. Introduction

Weed control is always a great concern in agriculture due to its deduction in crop yields. In the last decades, chemical herbicides have been widely used to control the growth of weeds. However, some chemical herbicides have not been effective in controlling weeds due to the prevalence of resistant weeds because of long-term use [1]. In addition, chemical herbicides are polluting the environment and causing many negative effects on living organisms including human. These reasons have prompted attention to the development and application of novel bioherbicides which are more environmentally friendly. Natural compounds are extensively used in the development of bioherbicides. Several studies have shown that natural compounds derived from plants and microorganisms are effective in controlling weed seed germination and growth [2,3,4], becoming an important resource for the discovery of new natural herbicidal components and action targets.
Cytochalasins are a class of natural products produced by molds, including cytochalasin A, B, C, D, E, F, etc. More than one hundred cytochalasin-related structures or their derivatives have been identified and reported from molds like Chaetomium, Rosellinia, Zygosporium, Helminthosporium, Penicillium, Aspergillus, etc. [5]. In terms of structure, cytochalasins are typically characterized by a substituted perhydro-isoindolone moiety derived from a highly reduced polyketide backbone and amino acids, attached to a macrocyclic ring [5,6]. As for cytochalasin A (CA), the structure is shown in Figure 1A. It is worth mentioning that CA is an oxidized derivative of cytochalasin B (CB), and both differ only in the group attached at C-20 [7], which display as the carbonyl group and the hydroxyl group, respectively. Because of the structural similarities between cytochalasins, they have analogous biological activities. There are numerous studies on the effect of cytochalasins on animal cells. Cytochalasins are most well-known for targeting microfilaments [8] and thereby inhibiting various cellular processes, including actin polymerization [9,10,11], platelet agglutination [12], glucose transport [13,14], mitochondrial contraction [15], etc. In addition, the antitumor [16,17] activity of cytochalasins was also reported.
For the study of cytochalasins in plant cells, it has been reported that because of the action of cytochalasins on the actin cytoskeleton, they inhibit the motility of various organelles in plant cells, including chloroplasts [18,19], mitochondria [20], endoplasmic reticulum [21], Golgi stacks [22,23] and peroxisomes [24]. The disruption of the actin cytoskeleton by cytochalasins leads to activation of the salicylic acid pathway to enhance plant resistance to pathogens [25,26]. In addition, cytochalasin B and F were reported to be effective in inhibiting root elongation of wheat and tomato seedlings [27], showing an interesting herbicidal activity. Photosynthesis, one of the most critical physiological processes in green plants and the main target of many commercial herbicides, is also influenced by cellular cytochalasins. Several cytochalasins, including CA, have been shown to have the ability to inhibit photosynthesis. CA and CB reduced the light absorption capacity of the leaves, resulting in the suppression of photosynthetic efficiency [28]. Cytochalasin F inhibited the photosynthetic activity of Green Alga Chlorella fusca and was shown to be an inhibitor of photosynthesis [29]. Cytochalasin E was found to have a direct effect on photosynthesis by chlorophyll (Chl) fluorescence assay, probably due to the impairment of light harvesting [30]. In summary, we believe that cytochalasins are phytotoxic and have potential bioherbicidal activity. Thus, as a member of the cytochalasin family and being capable of inhibiting photosynthesis, CA’s mechanism of action in photosynthesis is highly inspiring for the development of innovative natural herbicides.
Although there are several reports on the effects of CA in plants, the specific mechanism of action of CA in plant cells is unclear, especially the target of photosynthesis inhibition. In photosynthetic reactions, photosystem II (PSII) is considered as the crucial photosynthetic component, catalyzing light-driven water-splitting and oxygen-evolving reaction, thereby converting light energy into electrochemical potential energy and generating molecular oxygen [31]. As is well known, many classical herbicides target PSII in competition with the native electron acceptor plastoquinone, binding at the QB site of the D1 protein, thereby blocking the transfer of electrons from QA to QB to inhibit photosynthesis [32,33]. QA and QB are the primary and secondary plastoquinone receptors in PSII, respectively. The highly conserved amino acid residues in the QB site may play a key role in the binding to PSII inhibitors in plants [34], and molecular docking studies have been reported in plants to identify the binding properties of some widely used commercial PSII inhibitory herbicides to the QB site within the D1 protein [34]. The molecular details of the interaction of many natural products possessing PSII inhibitory effects in the D1 QB site in plants remain to be elucidated. Therefore, it is important to explore the specific effects and sites of the natural compound CA on photosynthesis for the development of novel bioherbicides in the future.
In this work, we treated the leaves of Ageratina adenophora with CA and found that CA can cause leaf diseases. In addition, the oxygen evolution rate and photosynthetic activity of Chlamydomonas reinhardtii were reduced by CA. From these results, we inferred that CA has great potential for weed management due to its phytotoxicity and ability to inhibit PSII photosynthetic activity. Based on the study of Chl a fluorescence rise kinetics and the analysis of molecular docking, we aimed to determine the mode of action and the site of action of CA in PSII. It was found that CA interrupts PSII electron transfer beyond QA at the acceptor side, leading to impaired PSII antenna structure and inactivation of the reaction centers. The interaction model between the CA and D1 proteins of A. adenophora was simulated to discover the accurate binding site. The revelation of the effect of CA on PSII and the specific binding sites of CA in PSII probably helps to better utilize it as a tool for plant research, especially in the development of new effective photosynthetic herbicides.

2. Results and Discussion

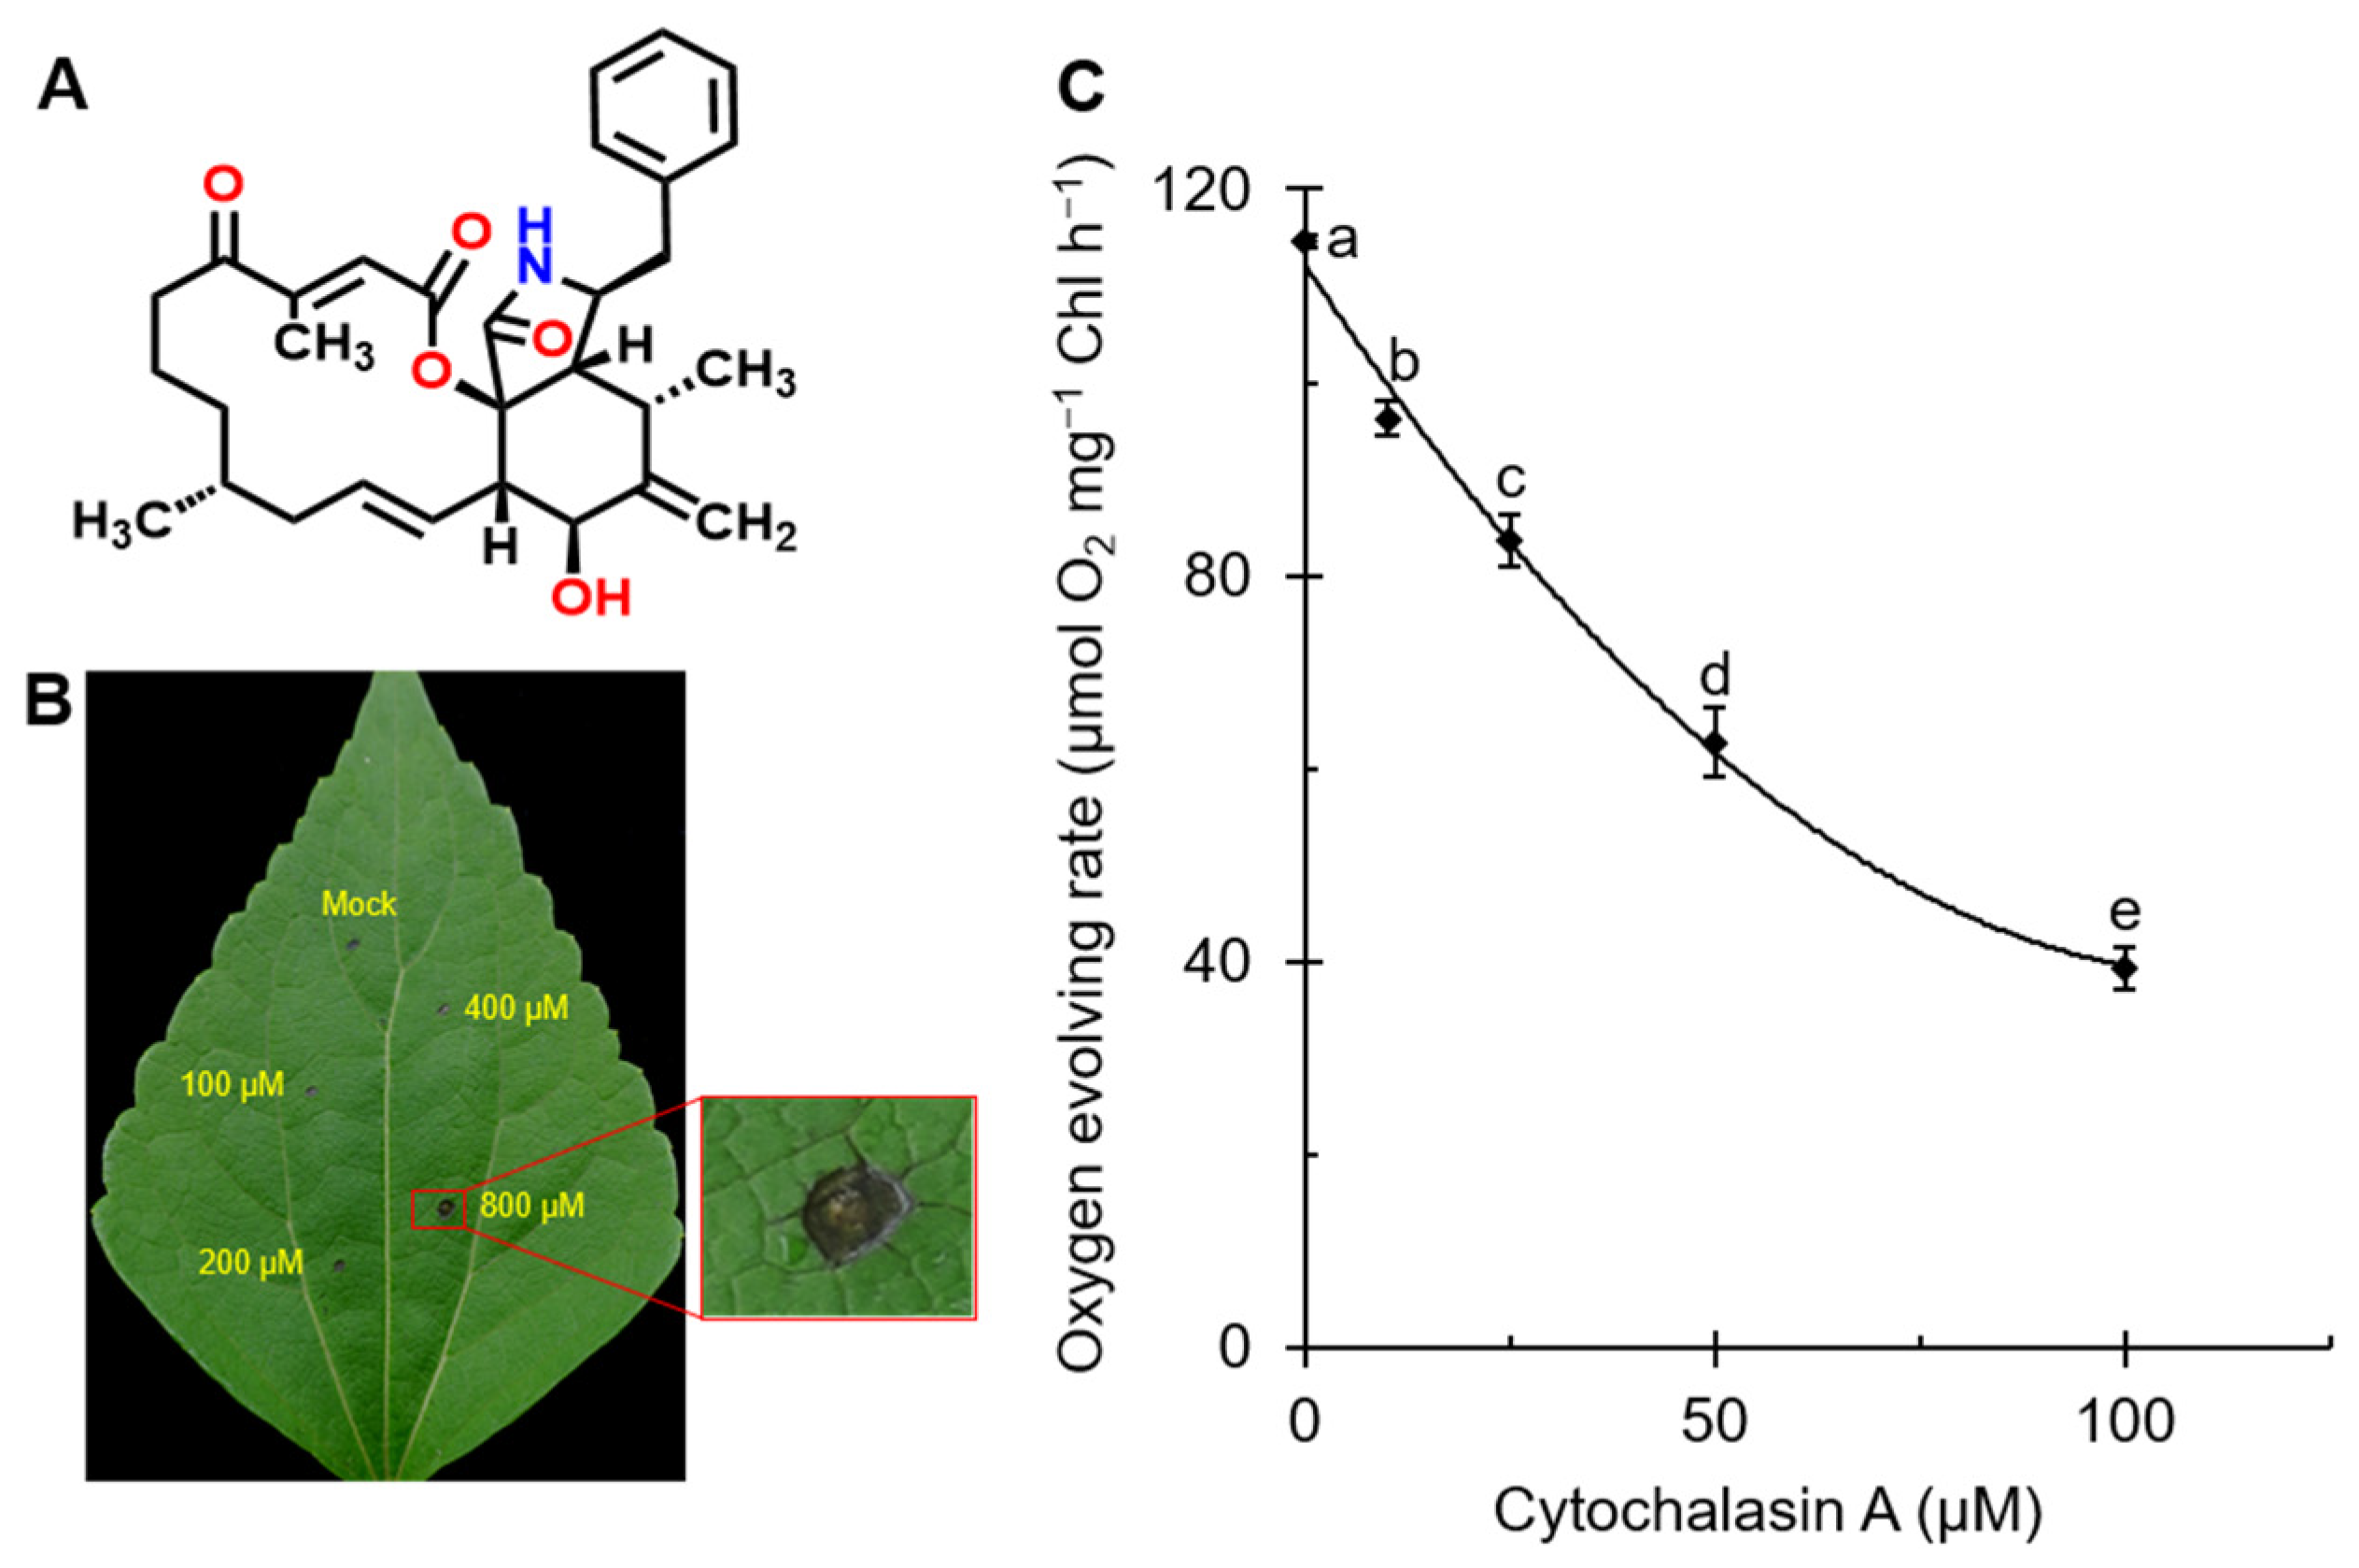
2.1. CA Caused Leaf Lesions in A. adenophora and Reduced the Rate of Oxygen Evolution in C. reinhardtii

CA, a fungal phytotoxin, had an inhibitory effect on the growth and viability of poplar suspension-cultured cells because the dry weight and oxygen consumption of cells treated with CA were strongly inhibited [35]. To estimate the phytotoxicity of CA, the damage formation in mature leaves of A. adenophora after treatment with different concentrations of CA was monitored. The monitored lesion formation is shown in Figure 1B. At the highest concentration of 800 μM, the largest diameter of visible lesions on the leaves was observed, with necrosis and browning of the leaves in the treated area. The formation of necrosis or chlorosis implies severe damage to photosynthetic tissues from chlorophyll breakdown [36]. This suggested that CA possibly impaired the photosynthetic activity of A. adenophora leaves.
To verify the effect of CA on photosynthetic apparatus, we measured the PSII oxygen evolution rate of C. reinhardtii cells incubated in different concentrations of CA. At a CA concentration of 100 μM, the rate of oxygen evolution was significantly reduced by approximately 64% (Figure 1C). The calculated I50 value (concentration required for 50% inhibition) was 58.5 μΜ. Diuron (3-(3′,4′-dichlorophenyl)-1,1-dimethylurea, DCMU), a classical PSII inhibitor, has been reported to completely inhibit the evolution of oxygen in C. reinhardtii cells at 1 μΜ [37] with an I50 value of 0.12 μM [38]. This suggests that CA has a good inhibitory effect on PSII, but is a weaker PSII inhibitor compared with diuron. In fact, diuron is a strong and specific PSII inhibitor, compared with which most natural photosynthetic inhibitors are less active [38]. It has been shown that the phytotoxin tenuazonic acid (TeA) and gliotoxin inhibit the rate of oxygen evolution with I50 values of 261 μM and 60 μM, respectively [36,39]. However, there are also stronger natural PSII inhibitors, such as sorgoleone, which have a similar ability to inhibit photosynthetic O2 evolution as diuron [40]. Thus, CA has an inhibitory effect on photosynthesis in plants and is a weaker PSII inhibitor.

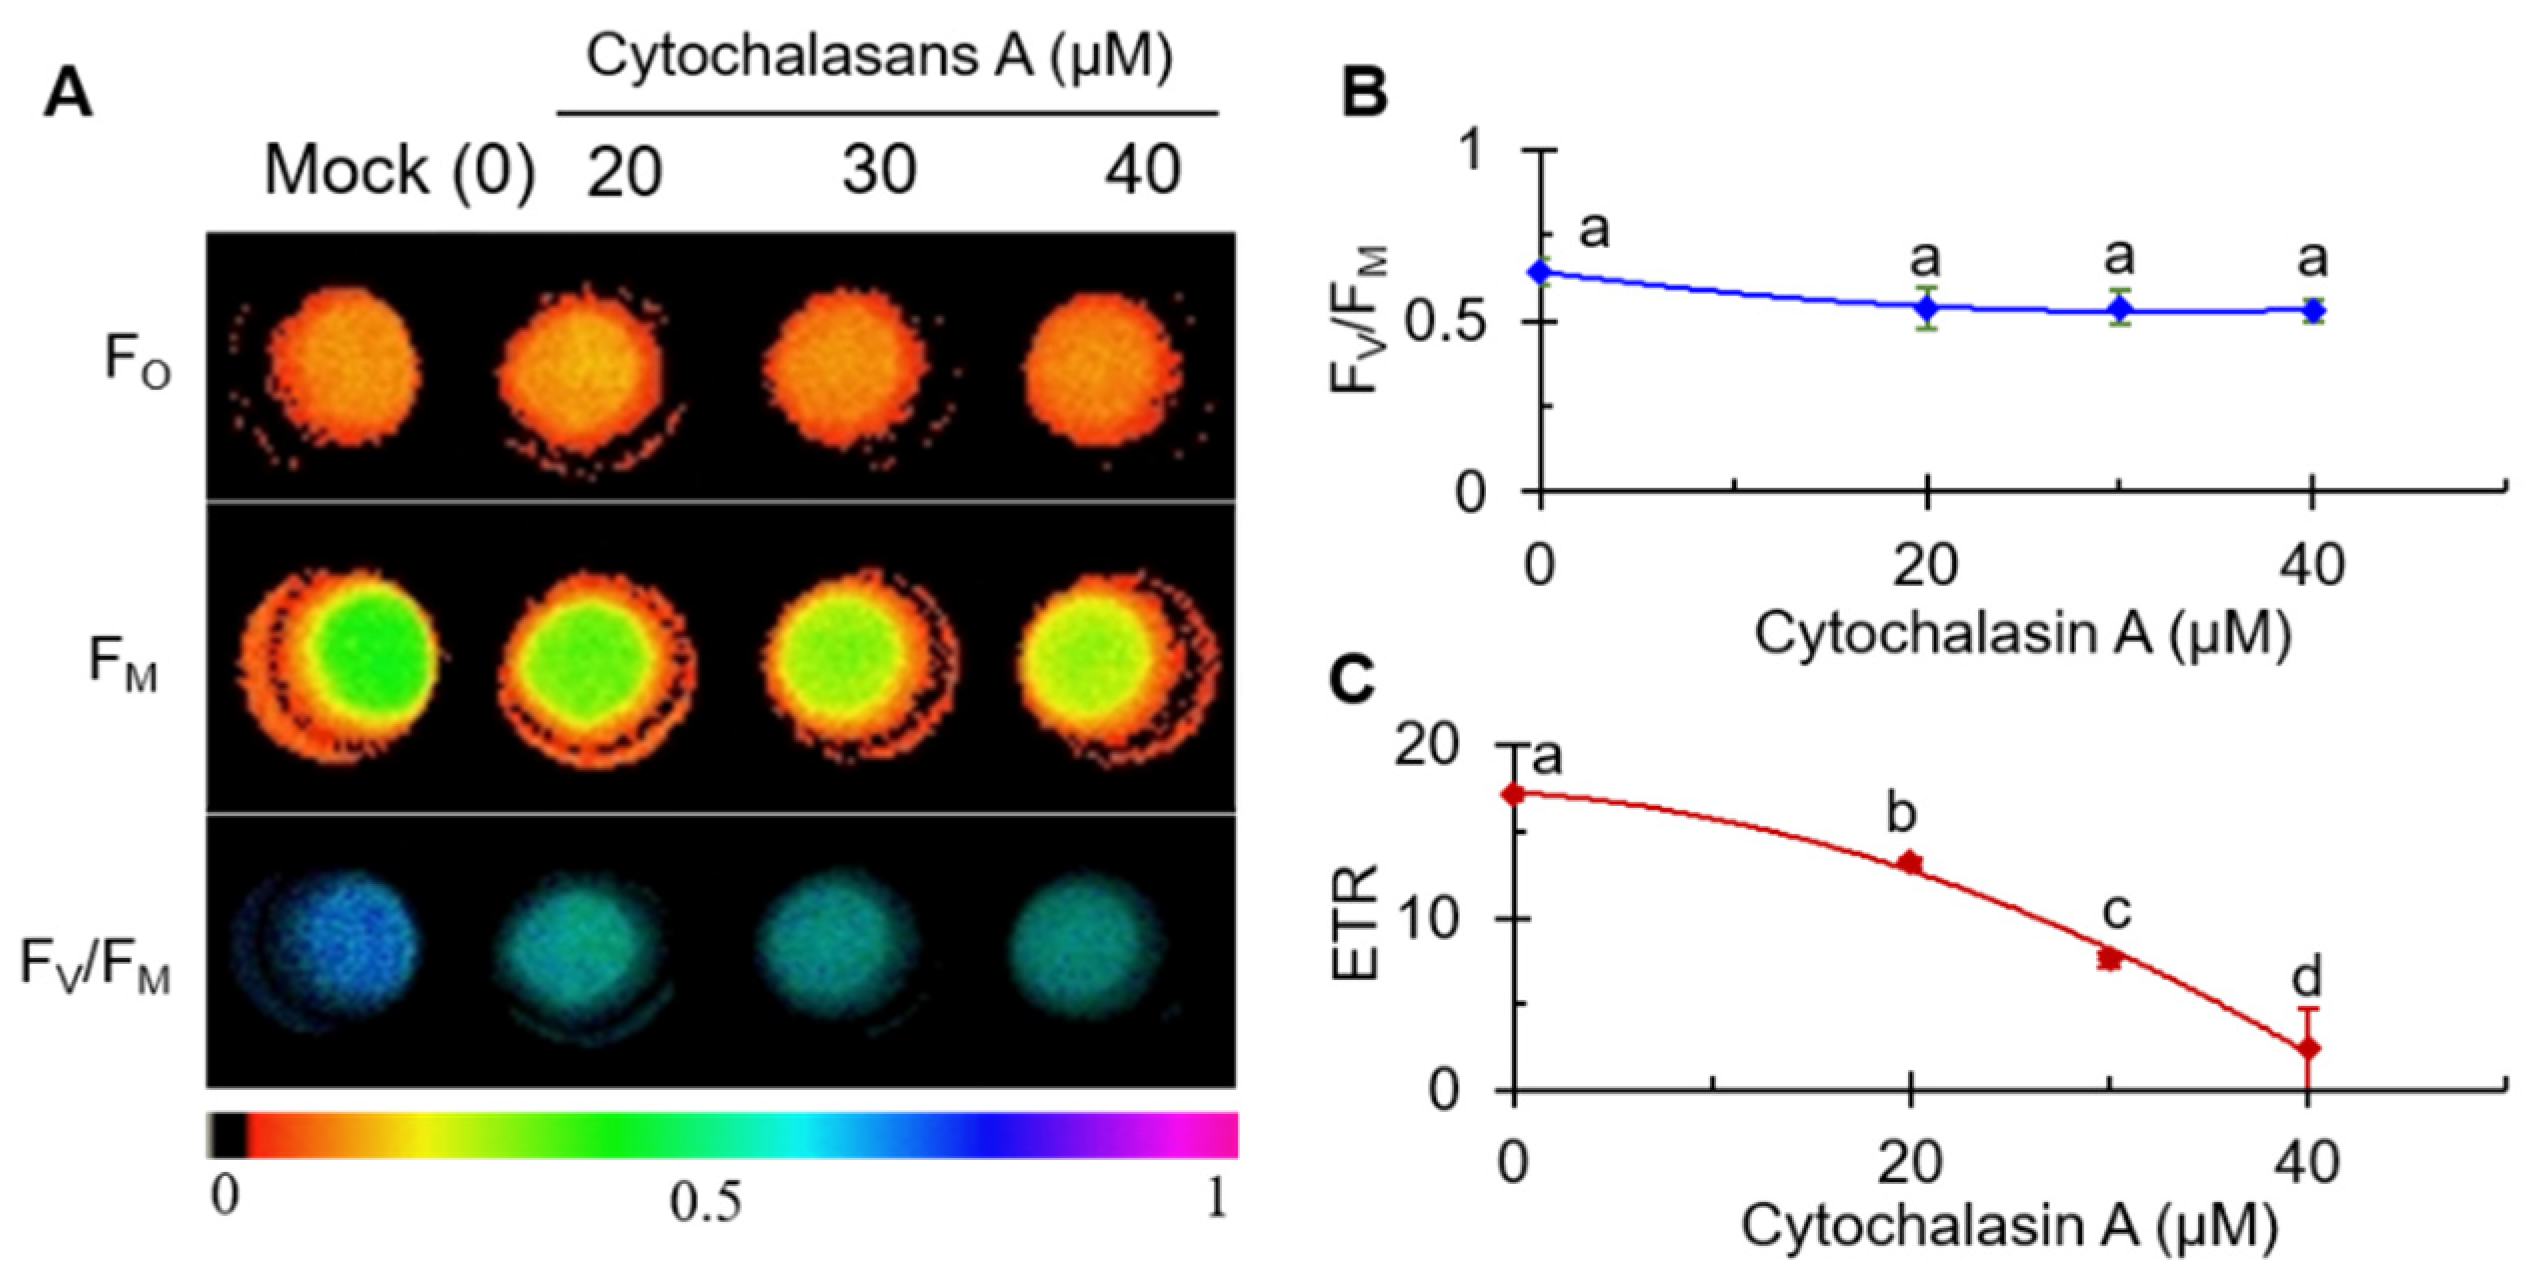
2.2. CA Inhibited Photosynthesis Activity of C. reinhardtii

Chl a fluorescence is very sensitive to stress-induced changes in photosynthesis. To further demonstrate the inhibition of photosynthetic activity by CA, the changes in fluorescence parameters of CA-treated C. reinhardtii cells were monitored by Imaging-PAM fluorometer. Figure 2A shows the color-coded images of FO, FM and FV/FM. FO, minimal fluorescence from dark-adapted leaf samples, indicates the level of fluorescence when QA is maximally oxidized, at which point the PSII centers are completely open [41]. Correspondingly, FM indicates the level of fluorescence when QA is maximally reduced, at which point the PSII centers closed [41]. FO usually represents phototropic pigment activity [42]; the decrease in FM may be correlated with the quenching of fluorescence due to the oxidation of the plastoquinone pool or the damage of the PSII antennae [43]. FV/FM represents the PSII maximum quantum yield. Under different concentration of CA treatments, images of FO remained relatively stable, while images of FM faded gradually. Under the treatment of CA, the FV/FM image fades from dark blue to light blue. The values of the fluorescence parameter FV/FM (Figure 2B) were slightly reduced but not significantly different. Electron transfer rate (ETR), a more sensitive [44] fluorescence parameter, showed significant concentration-dependent changes, with values decreasing with increasing CA concentration (Figure 2C). At the highest concentration of 40 μM CA, the ETR value was close to 0. The parameter values of ETR decreased approximately linearly, indicating that the inhibition of PSII electron transfer should be an important action site for CA on the photosynthetic apparatus.

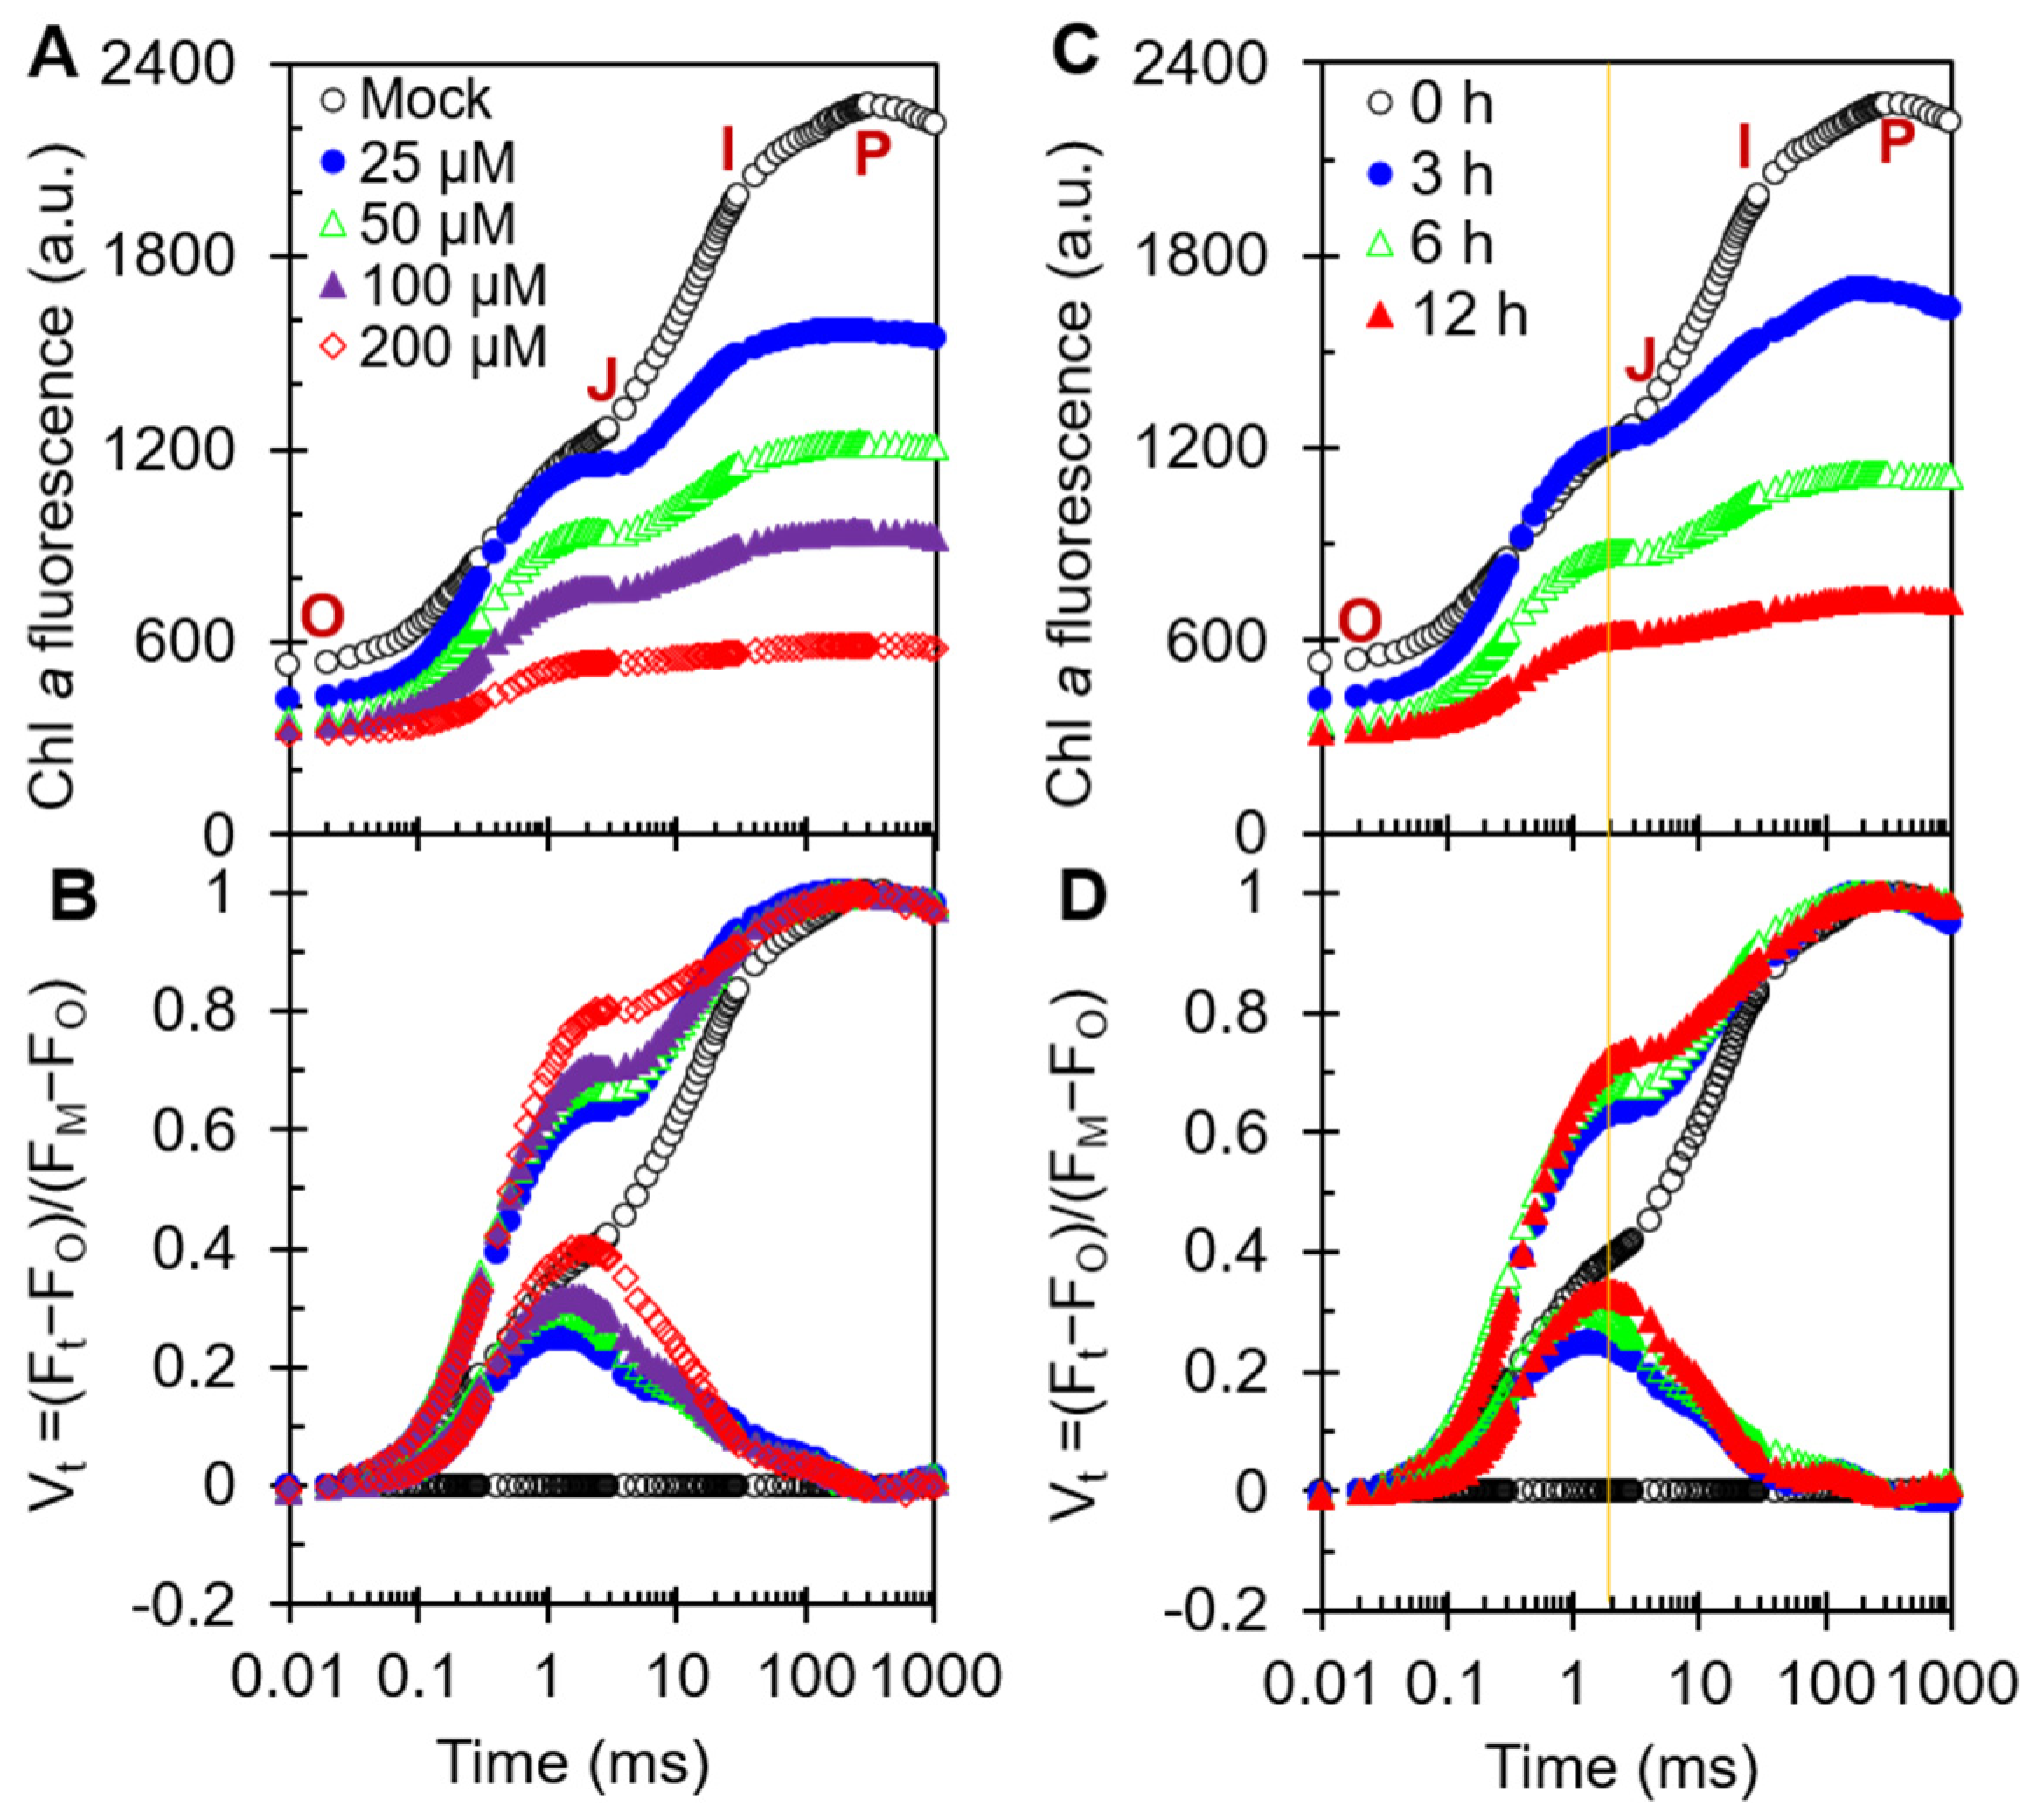
2.3. Fast Chl a Fluorescence Rise Kinetics OJIP of CA-Treated A. adenophora

For decades, Chl fluorescence rise kinetics has been widely used in studies of the structure and function of the photosynthetic apparatus because of its advantages of being fast, non-invasive and precise [41]. To further probe the accurate site of action of CA on PSII, we measured the fluorescence rise OJIP curves of CA-treated A. adenophora leaf discs (Figure 3). As shown in Figure 3A, the fluorescence rise curve of the control exhibited a typical polyphasic O-J-I-P shape. The fluorescence intensity increases from FO (O-step) to FM (P-step) and through two intermediate steps, FJ (J-step) and FI (I-step). The initial fluorescence FO at 20 μs, and the intermediate basic fluorescence data FJ and FI at 2 and 30 ms, respectively. Vt, representing relative variable fluorescence at time t, is calculated with the formula Vt = (Ft − FO)/(FM − FO). The detailed parameters and definitions were listed in Table 1, which is according to Strasser et al. [41] and Chen et al. [45]. Under CA treatment, the shape of the fluorescence rise transient curve changed remarkably. As the concentration of CA and treatment time increased, the FM decreased significantly and the I- and P-steps gradually disappeared (Figure 3A,C). The decrease of FM is generally related to increased fluorescence quenching and the damage of antenna pigment [43]. Here, we proposed that CA affected the structure of antenna pigment so as to decrease the photosynthesis capacity.
To explore the information behind OJIP curves, the fluorescence data were double-normalized by FO and FM, as relative variable fluorescence Vt = (Ft − FO)/(FM − FO) (top) and ΔVt = Vt(treatment) − Vt(control) (bottom) on logarithmic time scale (Figure 3B,D). Clearly, CA led to a concentration- and time-dependent rise of J-step, which is a classical phenomenon of the blockage of electron flow beyond the QA at the PSII acceptor side and the large accumulation of QA [41]. Treatment of A. adenophora leaf discs with the specific PSII inhibitor diuron resulted in a rapid rise in J-step to the same FM level at a concentration of 100 μM [38]. Apparently, the effect of CA on the kinetics of fluorescence rise is similar to that of diuron, mainly causing a significant increase in the J-peak.
The elevated level of the J-step and the decrease in FM suggest that CA not only blocked PSII electron flow beyond the QA, but also impaired the structure and function of the PSII antenna.

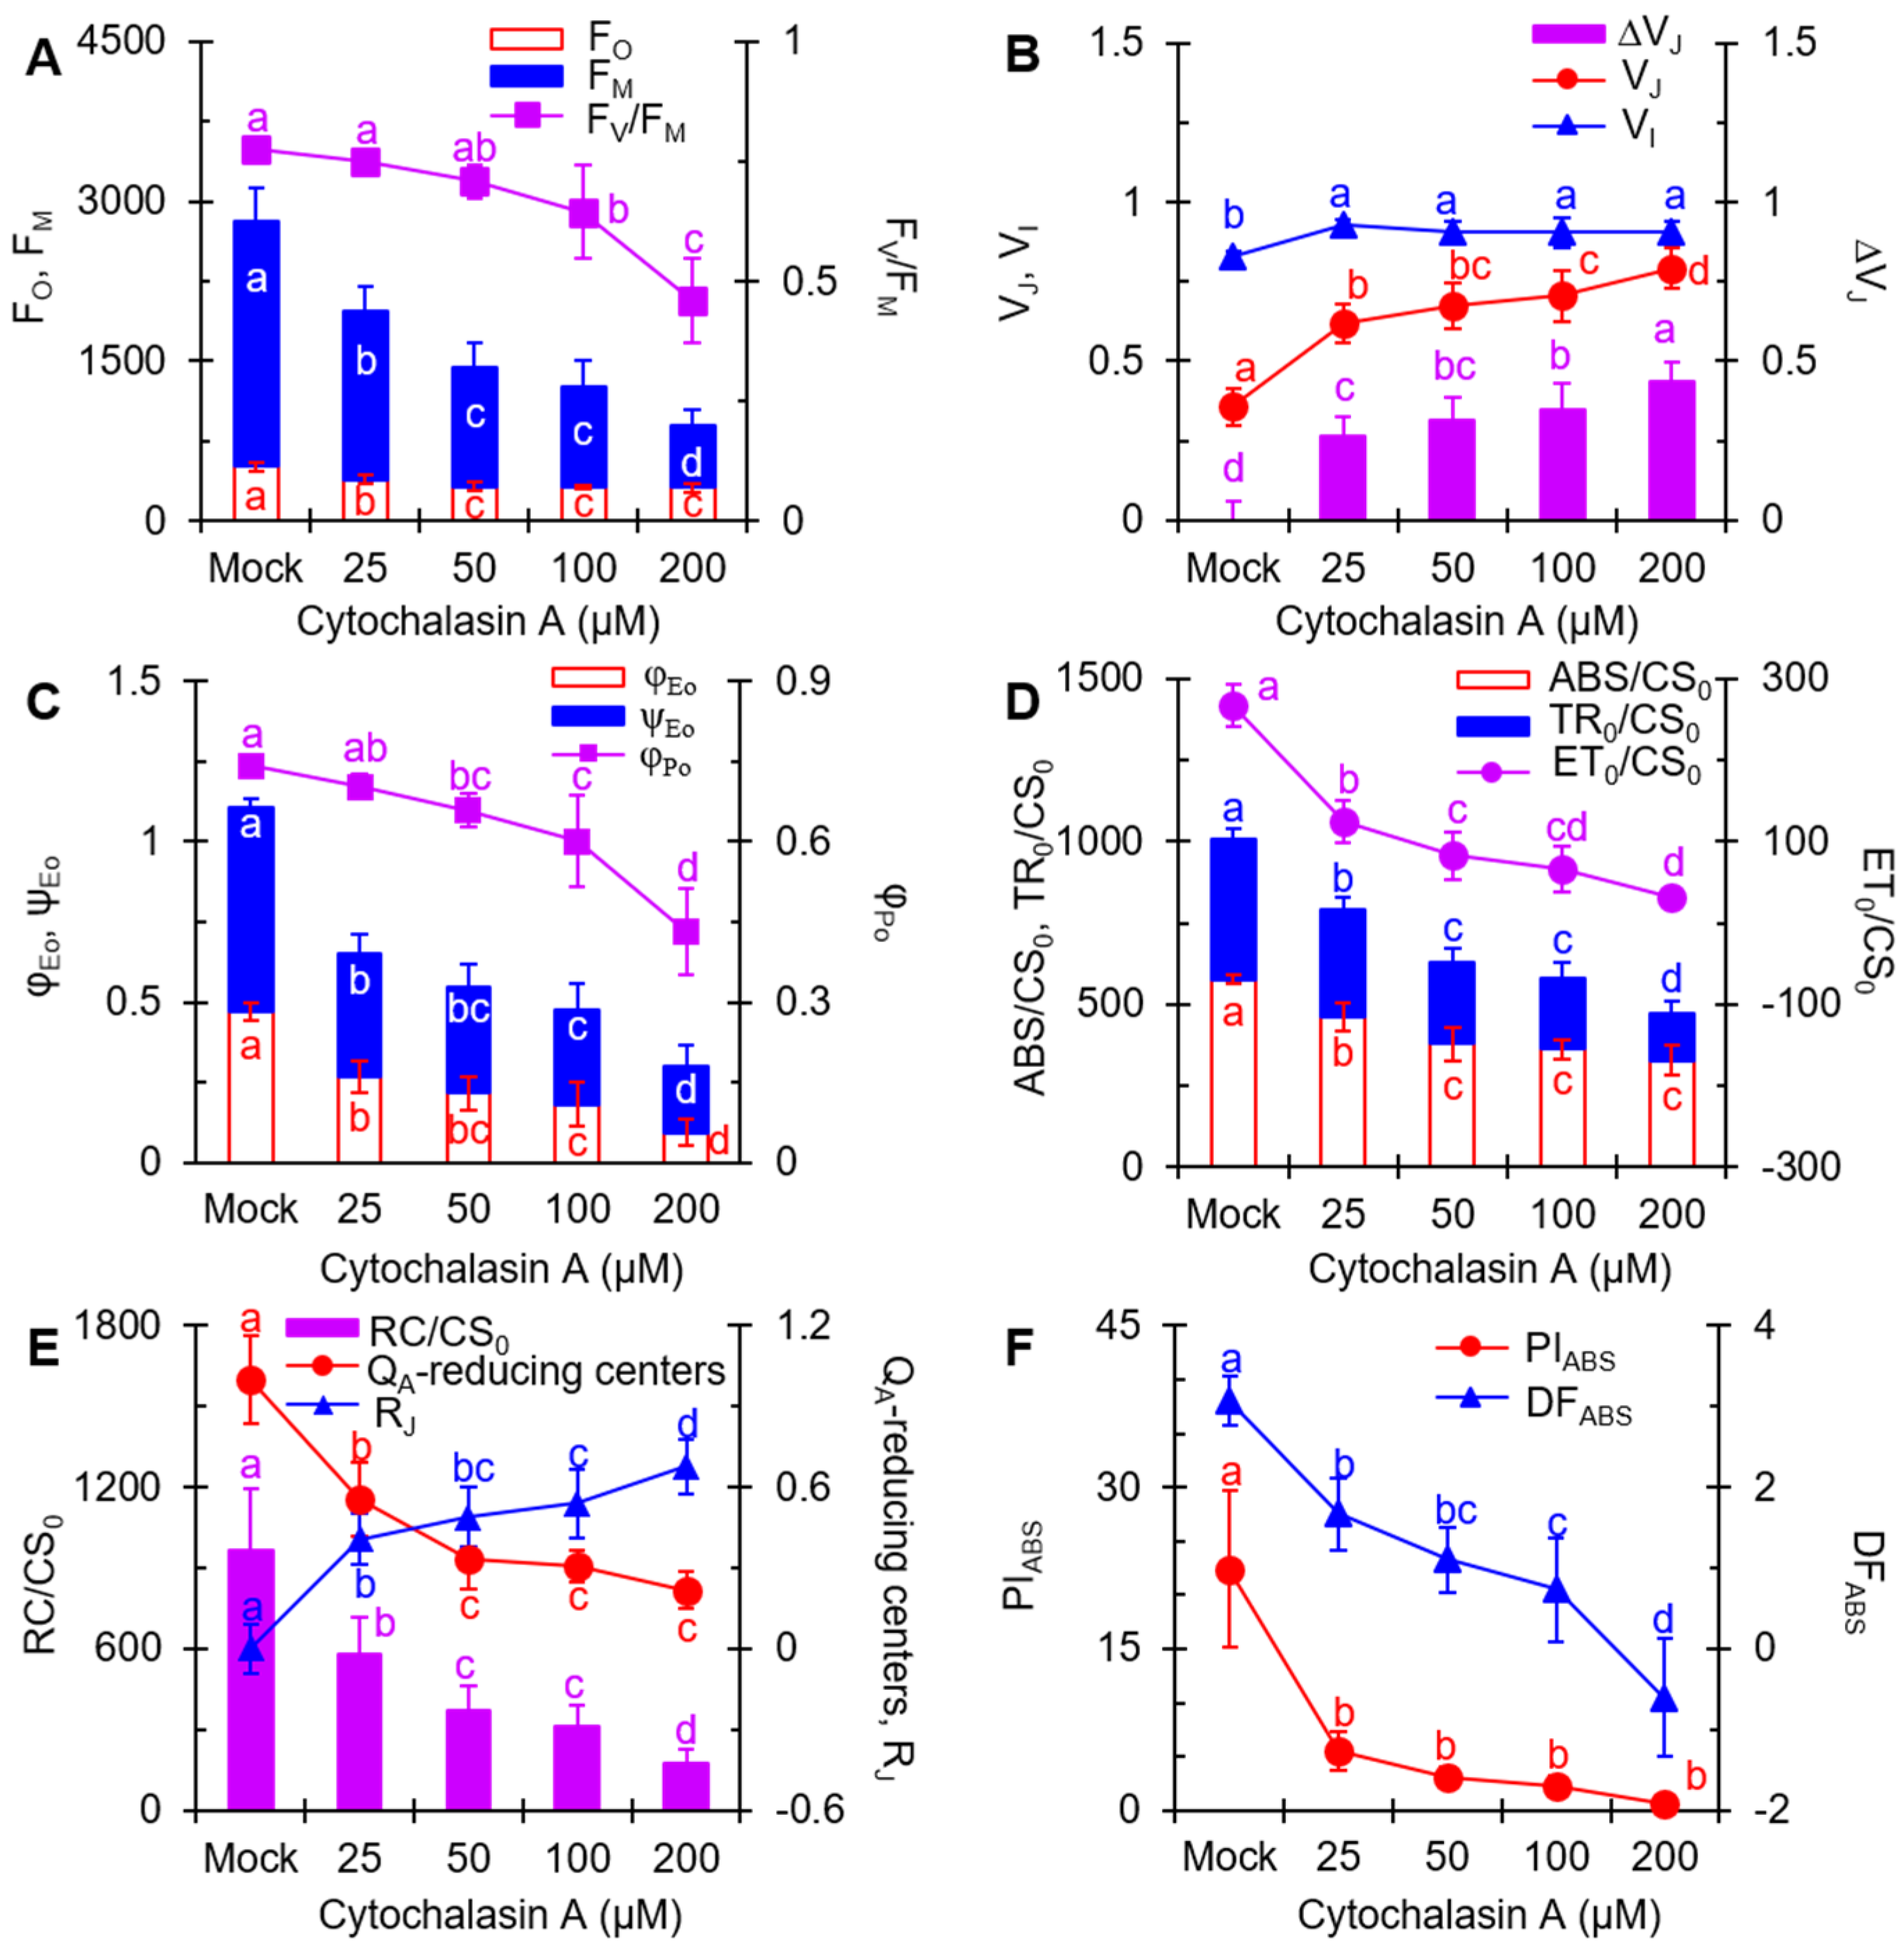
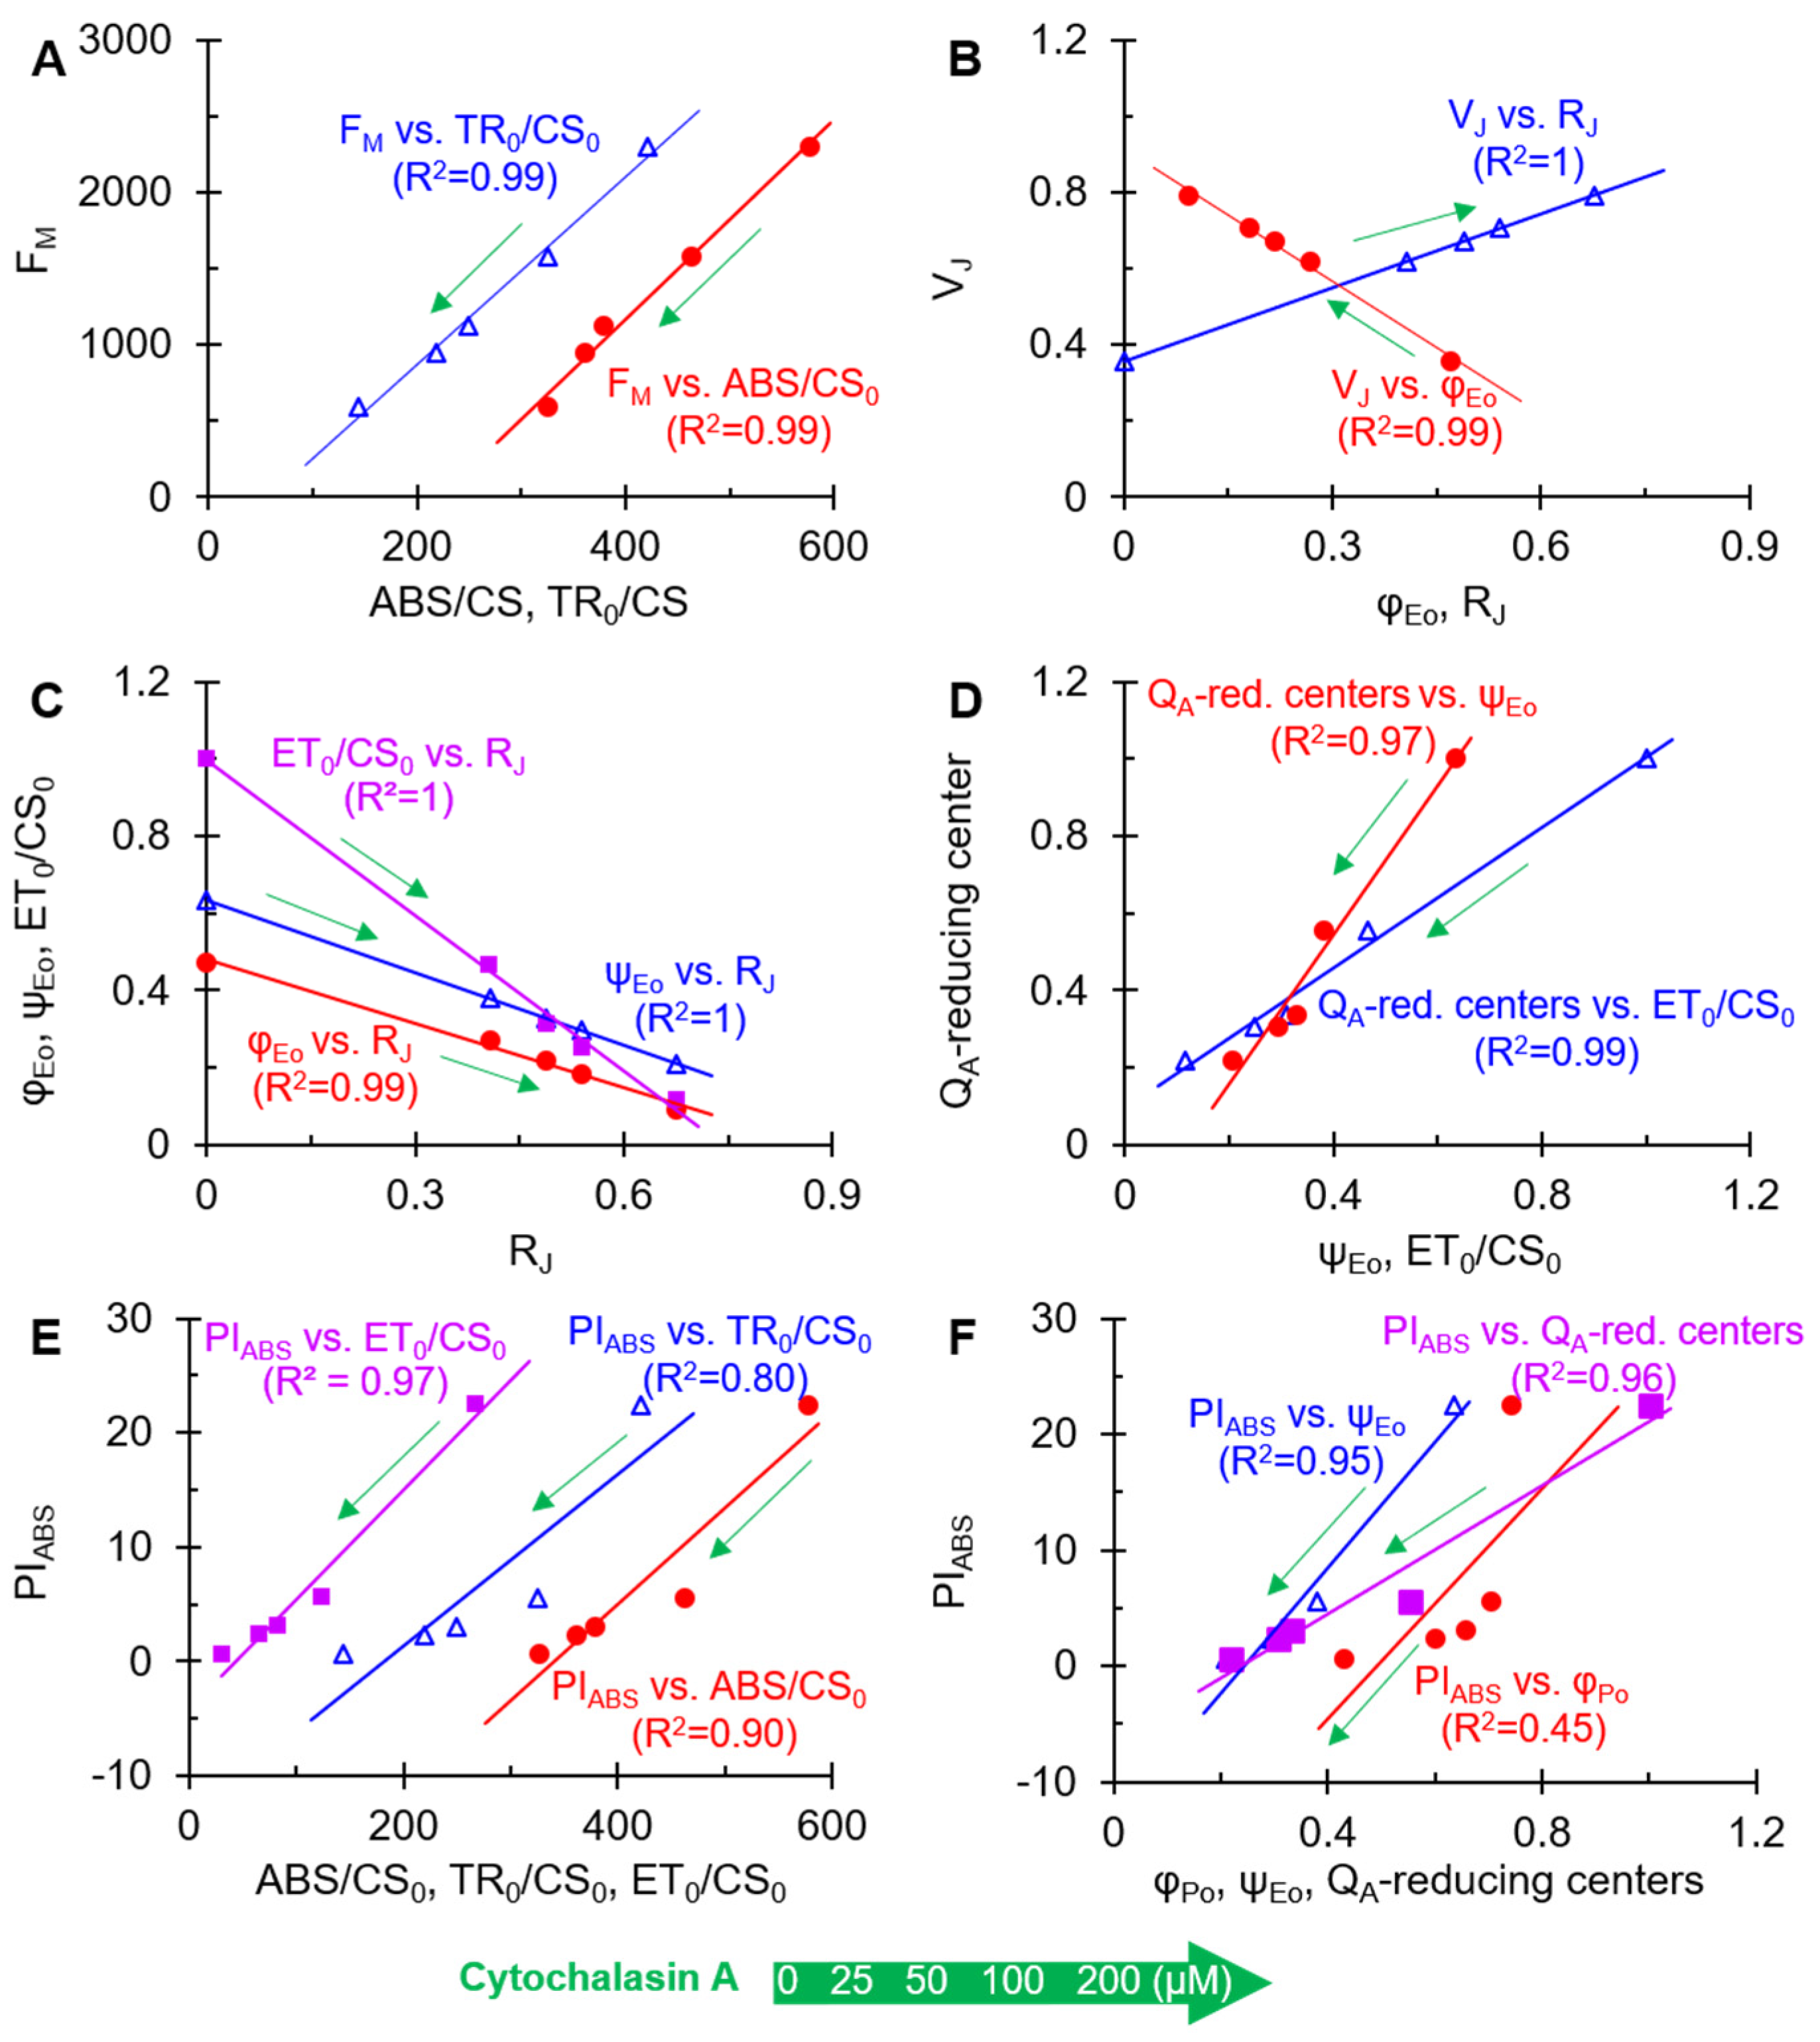
2.4. The JIP-Test Analysis

The JIP-test based on the Theory of Energy Fluxes in Biomembranes is a powerful tool for quantifying the fast Chl fluorescence rise OJIP curve, providing access to the vitality of a photosynthetic sample [41]. To further elucidate the effect of CA on PSII, some functional parameters selected from the JIP-test were analyzed. Definitions and specific formulas for certain parameters are shown in Table 1. Obviously, the increase in CA concentration had little effect on the FO but substantially reduced the FM values. The ratio of FV/FM showed a decline with the increase in CA treatment concentration (Figure 4A). This result is consistent with the results in Figure 2A,B. This implies that CA has a similar effect on the photosynthetic activity of A. adenophora and C. reinhardtii. We concluded that CA caused damage to the structure and function of the PSII antenna and thus inhibited plant photosynthetic activity.
The value of VJ (variable fluorescence at J-step) and ΔVJ increased with increasing CA concentration (Figure 4B). At 200 μM, the VJ value increased to 0.79, which was more than twice as high as that of the control (0.36). The increase in VJ value indicates that CA blocks PSII electron transport beyond QA. Additionally, the value of VI (variable fluorescence at I-step) was 12% higher than that of the control at a CA concentration of 25 μM, but no obvious change in the value of VI was observed as the CA concentration increased.
In Figure 4C, a dramatic drop was observed in the parameters φEo and ψEo, with a calculated I50 value of 83.25 μM and 103.86 μM for φEo and ψEo, respectively. The φEo denotes the quantum yield of PSII electron transfer, while ψEo shows the probability that a trapped exciton moves an electron into the electron transport chain beyond QA [41]. The decrease of φEo and ψEo values further supports that CA blocks the PSII electron transport beyond QA. By increasing the CA treatment concentrations, the values of φPo also decreased, suggesting that the maximum quantum yield of PSII primary photochemistry was suppressed by CA.
ABS/CS0 (absorption flux per excited leaf cross section), TR0/CS0 (light energy captured per unit leaf area) and ET0/CS0 (electron transport flux per leaf cross section) significantly declined under CA treatment [41] (Figure 4D). ABS/CS0 is available as a measure of average antenna size or chlorophyll concentration, and TR0/CS0 reflects the specific rate of exciton trapped per excited leaf cross-section by open reaction centers [46]. The decrease in ABS/CS0 and TR0/CS0 suggests that CA reduced the concentration of chlorophyll and disrupted the conformation of the antenna pigment assembly, thereby reducing the efficiency of light energy transfer between antenna pigment molecules and from PSII reaction centers. The quantum yield of electron transport is influenced, as shown by the decreases in ET0/CS0. The above results indicate that CA dramatically blocked the energy flux between photosynthetic structural units.
Since CA interrupts PSII electron flow from QA to QB, decreases chlorophyll concentration and disrupts the conformation of the antenna pigment assembly, an inactivation event is expected to occur in the PSII reaction center. The fraction of QA-reducing centers were calculated, QA-reducing centers = [(RC/CS)treatment/(RC/CS)control] · [(ABS/CS)treatment/(ABS/CS)control]. In Figure 4E, the marked decrease in QA-reducing centers suggests that CA did lead to a rapid closure of PSII reaction centers. A significant reduction in QA-reducing centers certainly results in an increase in non-QA-reducing centers, also known as heat sink centers or silent centers, which are radiators and are frequently used to protect the system from over-excitation and over-reduction, resulting in the generation of ROS [45]. The value of RC/CS0 (the density of QA-reducing reaction centers per excited leaf cross section) also exhibited a similar decreased tendency after CA-treatment. This indicated that CA caused damage to the PSII reaction centers and inhibited the activity of PSII.
It has been shown that the PSII reaction centers would become inactivated in the competitive substitution of the QB binding site in the D1 protein by PSII inhibitors, thus interrupting electron transport [41]. To investigate the binding of CA to the QB site of reaction centers, RJ was introduced to estimate the number of PSII reaction centers at the QB site populated by CA. The fluorescence parameter RJ could be derived from the equation RJ = [VJ(treatment) − VJ(control)]/[1 − VJ(control)] [45]. A visible concentration-dependent increase in RJ was observed after CA treatment (Figure 4E). The rise of RJ means that the increased CA molecules occupy the QB site of D1 protein, thus blocking the electron transfer from QA to QB. Therefore, CA-induced inactivation of the PSII reaction center probably results from the binding of CA to D1 protein.
PIABS, the performance index on absorption basis, is the most sensitive JIP-test parameter for the different stress treatments. Compared with mock, PIABS respectively decreased by 75% (25 μM), 86% (50 μM), 89% (100 μM) and 97% (200 μM) after 12 h of treatment with different concentrations of CA (Figure 4F). The other parameter DFABS showed a comparable downward trend. DFABS is derived from the equation DFABS = log(PIABS) and can be defined as the total driving force of photosynthesis in the observed system [41]. These results reflected that the overall photosynthetic activity and efficiency of the leaves showed a concentration-dependent decrease after CA treatment.
Altogether, CA might destroy the structure of antenna pigment (FO, FM, ABS) and inhibit the energy flux between antenna units (ABS/CS0, TR0/CS0 and ET0/CS0) as well as electron transport above QAEo and ψEo) by binding to the QB binding site of D1 protein (RJ) and thus lead to the dramatic decrease of overall photosynthesis activity (PIABS) in A. adenophora. To verify the primary site of action of CA on PSII, the correlations between some selected parameters are shown in Figure 5. As shown in Figure 5A, the data displayed a highly linear relationship between FM and ABS/CS0 or TR0/CS0 in the leaves treated with different concentrations of CA. It suggested that the CA-caused decrease of FM was induced by the concentration-dependent decrease of ABS/CS0 or TR0/CS0. So, the inhibition of CA on the efficiency of light energy transfer between antenna pigment molecules and from PSII reaction centers was the main reason for the decrease in FM. VJ showed a high negative correlation with φEo and a high positive correlation with RJ (Figure 5B), which suggested that CA occupied the QB sites in D1 protein to block the PSII electron transport beyond QA, thus leading to a large accumulation of QA as an increase of VJ. In addition, the linear relationship between the parameters RJ and ET0/CS0, φEo and ψEo further demonstrated that CA interferes with electron transport by occupying the QB-binding site (Figure 5C). Under CA treatment, the decrease of the parameter QA-reducing centers was correlated with ET0/CS0 and ψEo, respectively (Figure 5D). It indicated that CA caused the interruption of PSII electron transport beyond the QA, which resulted in the inactivation of the reaction centers.
To estimate the structural and functional contribution of PSII to PIABS, the relationships between PIABS and ET0/CS0, TR0/CS0 and ABS/CS0 are presented (Figure 5E). As a result, CA-caused PIABS decrease was highly related to the reduction of ABS/CS0and ET0/CS0, especially for ET0/CS0, but not TR0/CS0. In other words, CA-caused loss of PSII overall photosynthetic activity is mainly due to the decrease of PSII electron transport efficiency, and secondly attributed to chlorophyll concentration or the disruption of the antenna pigment assembly. This is strongly supported by the high linear correlation between PIABS and ψEo or QA-reducing centers in the presence of different concentrations of CA. However, there is not an evident linear relationship between φPo and PIABS (Figure 5F). Thus, the significant decrease of overall photosynthetic activity of PSII is really a result of antenna destruction, electron transfer interruption, and inactivation of PSII QA-reducing centers in the presence of CA.
In conclusion, CA acts in a way similar to the classical diuron-like herbicides, targeting mainly the QB site of the D1 protein and blocking PSII electron transport at the acceptor side to inhibit photosynthetic efficiency in plants.

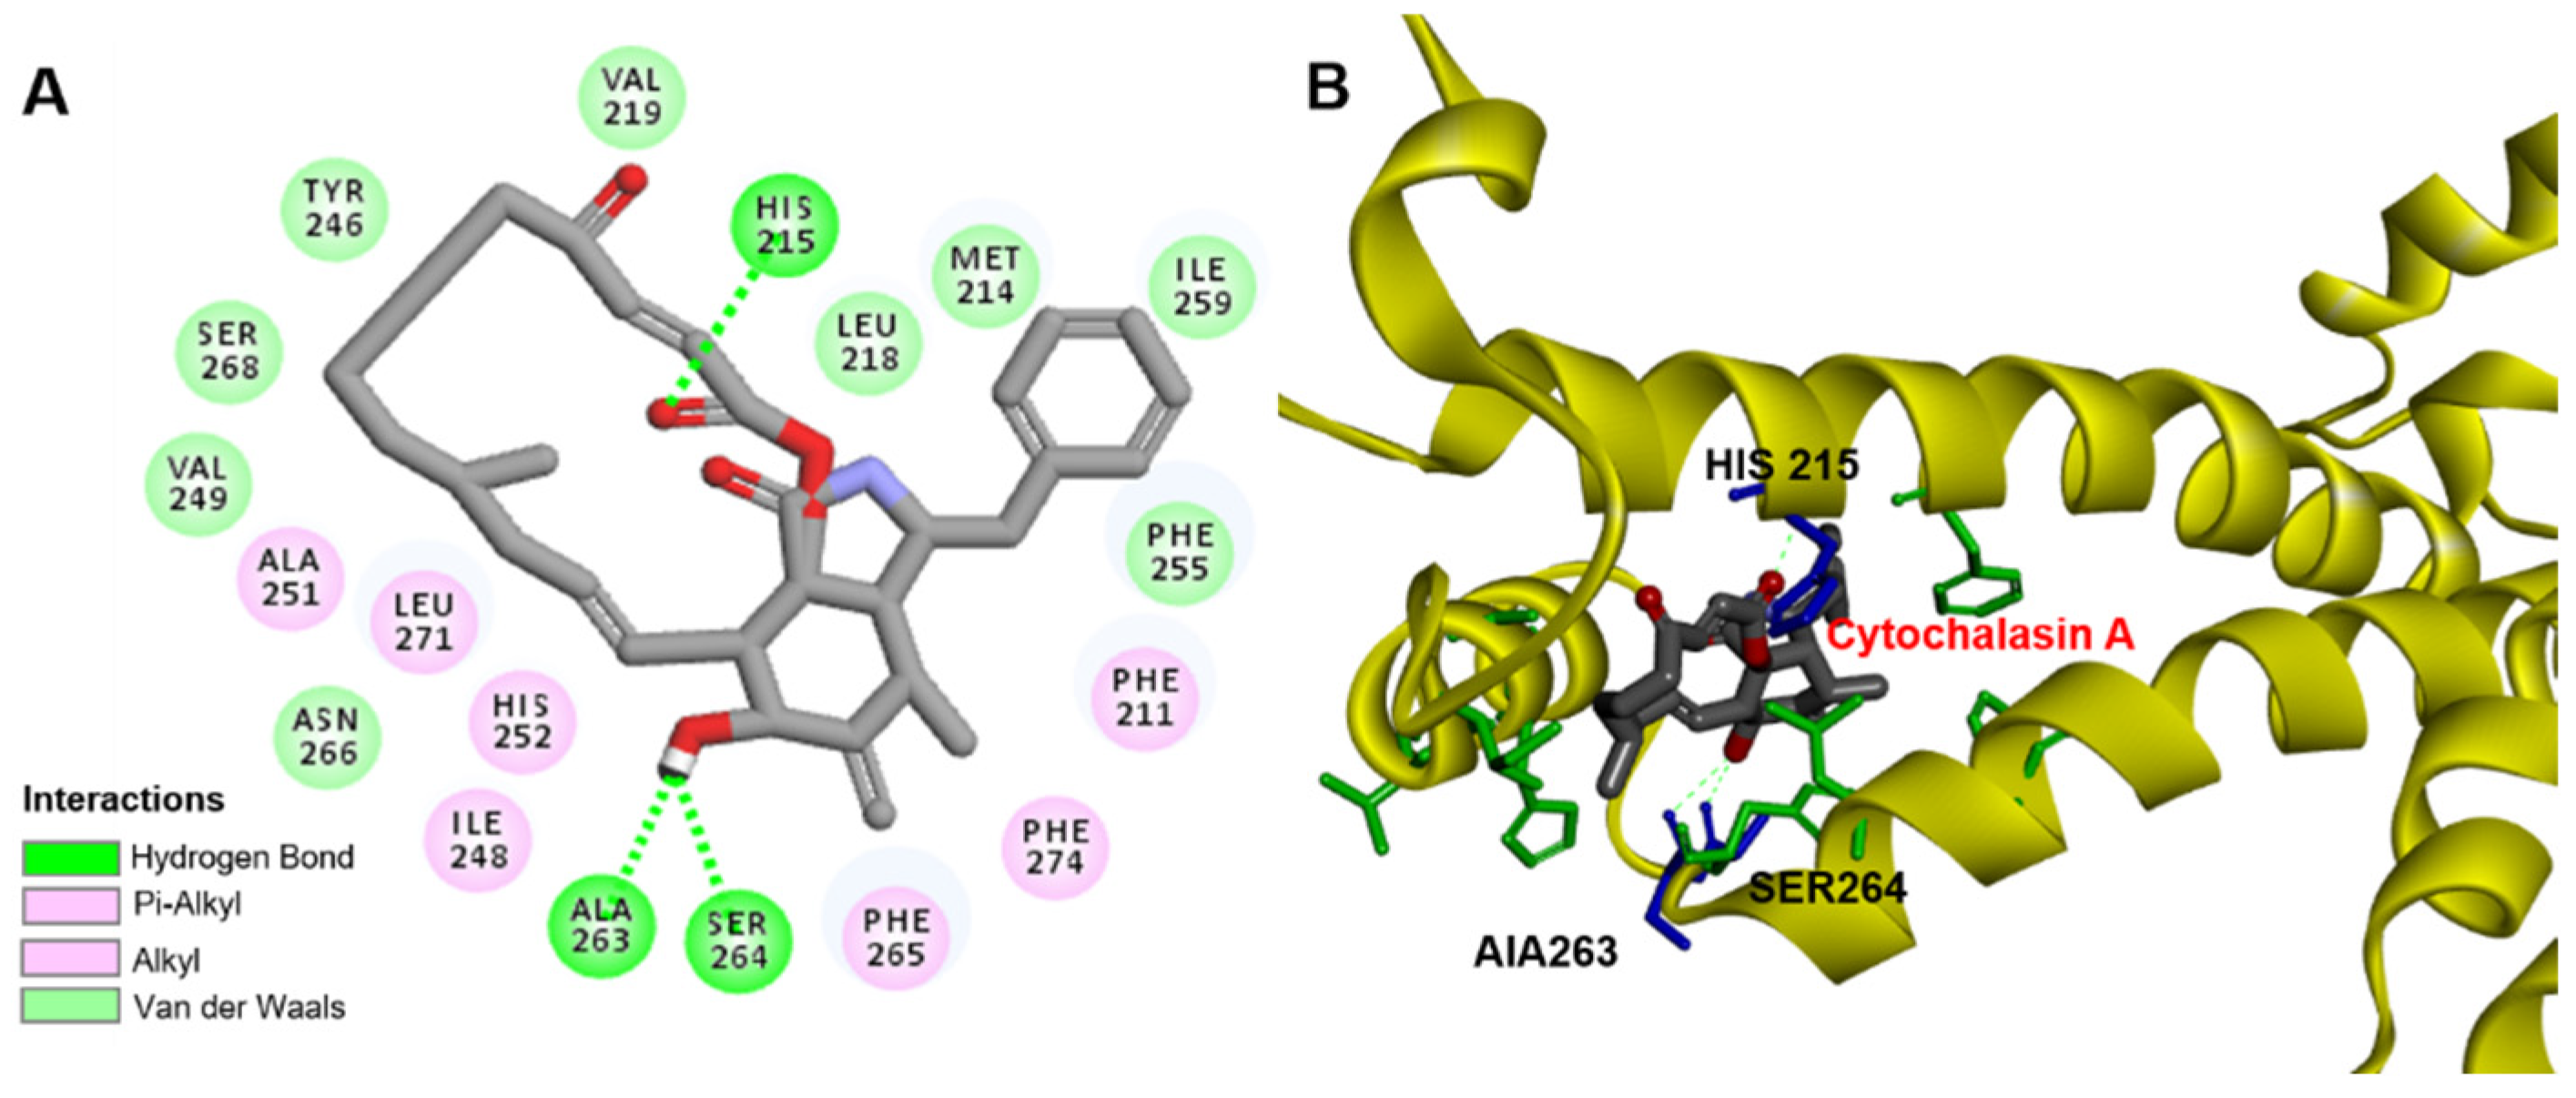
2.5. Modeling of CA Binding to D1 Protein

In oxygenated photosynthesis in plants, algae and cyanobacteria, PSII undergoes light-driven plastoquinone reduction by electrons from water. Nevertheless, PSII herbicides interrupt this process. Numerous previous studies have shown that herbicides targeting PSII inhibit electron transfer from QA to QB by competing with native plastoquinone for its QB binding niche in the D1 protein [32,47]. The D1 protein in higher plants contains mainly five transmembrane α-helices, and the QB binding site is located between the fourth and fifth transmembrane helices [32,38,48]. The amino acids that form the QB and herbicide-binding niche of D1 protein are from Phe211 to Leu275 [33].
To further verify whether CA binds to the QB site of D1 protein, CA was modeled to the QB site of A. adenophora D1 protein based on experimental and theoretical structural information provided by Discovery Studio (version 2016, BIOVIA, San Diego, CA, USA) [49] on the binding of D1 protein by PSII herbicides (Figure 6). The molecular model of CA binding to D1 protein showed that hydrogen bonds were formed between the ethylamino hydrogen (NH) of the residue D1-His215 and the O3 oxygen atom of CA, as well as between the C18-OH hydroxyl oxygen atom of CA and CO carbonyl oxygen atom of the residue D1-Ala263 or CO carbonyl oxygen atom of D1-Ser264, respectively. Their bonding distance was 2.48 Å, 2.44 Å and 2.35 Å, respectively (Figure 6A and Table 2). The residues D1-Phe211, D1-Phe265 and D1-Phe274 also formed, respectively, a Pi hydrophobic interaction with the C16, C17=CH2 and the C16 of CA with the bound distance of 3.97 Å, 3.83 Å and 3.86 Å (Table 2). Additionally, the alkyl hydrophobic interactions between CA and the residues D1-Ile248, D1-Leu251, D1-His252 and D1-Leu271 were also probably involved in the complex stabilization of CA binding to the QB site (Table 2). Figure 6B illustrates the docked pose of CA at the QB binding site of A. adenophora D1 protein. Hydrogen bonding with D1-Ser264 is a favorable orientation for the classical PSII herbicides atrazine and diuron [50]. Apparently, CA is not exactly the same as atrazine and diuron in the binding environment, although all target the QB site of the D1 protein.
It is well known that PSII inhibitor herbicides share the same action target D1 protein, but each herbicide has its own specific orientation in binding to the QB niche. The classic inhibitors of PSII can be classified as the urea/triazine, and phenolic inhibitors. Extensive studies with herbicide-tolerant mutants and crystal structure-based molecular modeling have shown that hydrogen bonding with D1-Ser264 is the key interaction for urea/triazine herbicides to bind D1 proteins, whereas the favorable orientation of phenolic herbicides to bind D1 proteins is through hydrogen bonding with His215 [32,48,51]. Here, D1-His215, D1-Ser264 and D1-Ala263 are thought to be involved in the binding pocket of CA and provide hydrogen bonds for CA (Figure 6B). As compared with the two types of PSII herbicides, the binding environment of CA in D1 protein overlaps but differs from theirs, and residue D1-Ala263 is a novel site of action. Overall, the binding orientation of CA to D1 protein appears to be more complex than that of classical herbicides to D1 protein.
Some natural products with herbicidal properties also exhibit complex binding orientations to the QB site. According to the constructed molecular model of patulin (PAT) [38] binding to D1 protein, D1-His252 provides a major hydrogen bond to the O2 carbon-based oxygen atom of PAT. This mode of binding to D1 proteins is not consistent with either urea/triazine family inhibitors or phenolic inhibitors and may be the result of differences in the characteristic groups. The molecular interaction model of TeA [50] and Arabidopsis D1 protein indicates that the residue Gly256 of D1 protein plays a key role in TeA binding to the QB niche of D1 protein. Apparently, this binding behavior is also different from that of classical herbicides. In this study, the molecular interaction model of CA binding to the QB site indicated that residues D1-His215, D1-Ala263 and D1-Ser264 were involved in the formation of hydrogen bonds, respectively, promoting the binding of CA to D1 protein. Compared with the classical PSII herbicides and natural PSII inhibitors mentioned above, CA has a unique binding orientation for residue D1-Ala263 at the QB site. Therefore, CA is a novel natural photosynthetic inhibitor with potential for future development as a bioherbicide. Further verification of the exact binding environment of CA, however, is required by crystallographic data and mutant experiments.

3. Materials and Methods

3.1. Plants and Chemicals

Invasive weed A. adenophora was germinated on a mixture of perlite-vermiculite−peat (0.5:1:3, v/v) at 20–25 °C under 200 μmol (photons) m−2 s−1 white light (day/night, 12 h/12 h) and 70% relative humidity in the greenhouse. After 180 days of growth, the leaves of plants were sampled.
C. reinhardtii wild-type strain was obtained from the Freshwater Algae Culture Collection at the Institute of Hydrobiology (FACHB-col-lection, Chinese Academy of Science, China). Cells were grown in liquid Tris-acetate-phosphate (TAP) medium at 25 °C under white light (100 μmol (photons) m−2 s−1) with a 12 h photoperiod and shaken once every 12 h. The total biomass was determined by optical density of cell suspensions in a spectrophotometer (UV-1800, Shimadzu, Kyoto, Japan) at 750 nm (A750). The cells of the logarithmic phase (approximately 3 or 4 days, A750 of about 0.65) were collected and washed twice with distilled water, then resuspended with buffer A. The buffer contained 20 mM HEPES-KOH (pH 7.5), 350 mM sucrose and 2.0 mM MgCl2. The cells were used for the subsequent experiments.
CA (CAS No. 14110-64-6) was purchased from Sigma-Aldrich (Shanghai, China), and other common chemical reagents used in this work were purchased from Aladdin (Shanghai, China). CA was prepared in 100% acetone and diluted in distilled water as required. The final concentration of acetone in each experiment did not exceed 10% (v/v).

3.2. Phytotoxicity Assessment

For the normal images of A. adenophora, intact detached-leaves from healthy plants of A. adenophora were washed with distilled water, dried with sterilized-filter papers, and transferred onto wet sterilized-filter papers in Petri dishes. Leaves were slightly punctured on their abaxial margin with a needle. The 20 μL droplet of 0 (mock, 10% acetone), 100, 200, 400 and 800 μM CA solutions were added onto the wound site of leaves. All samples were maintained at 25 °C for 12 h in a growth chamber, under approximate 200 μmol (photons) m−2 s−1 white light (day/night, 12 h/12 h). Results were recorded with a Canon G15 camera (Canon, Tokyo, Japan) and diameters of leaf necrotic lesions were determined with a vernier caliper (ROHS HORM 2002/95/EC, Xifeng, Qingyang, China).

3.3. Measurement of PSII Oxygen-Evolution Rate of C. reinhardtii

A Clark-type oxygen electrode (Hansatech Instruments Ltd., King’s Lynn, UK) was used to determine the oxygen evolution rate of C. reinhardtii according to [39]. Before measurements, CA was added to 2 mL cell suspensions (A750 of 0.65) to make final concentrations as indicated (0, 12.5, 25, 50 and 100 μM), and then the cells were incubated for 3 h in darkness at 25 °C. Treated cells containing 45 μg chlorophylls were added into the PSII reaction medium of 4.0 mL, which included 50 mM HEPES-KOH buffer (pH 7.6), 4 mM K3Fe(CN)6, 5 mM NH4Cl and 1 mM p-phenylenediamine. After the reaction mixture was illuminated with 400 μmol m−2 s−1 red light for 1 min, the oxygen evolution rate was recorded. The independent experiment was repeated three times.

3.4. Chl a Fluorescence Imaging

A MAXI-version of the pulse-modulated Imaging-PAM M-series fluorometer (Heinz Walz GmbH, Effeltrich, Germany) was used to determine the Chl fluorescence imaging [44]. Before measurements, samples were adapted for 0.5 h in the dark under the imaging system camera after focusing the camera. Under 0.25 μmol (photons) m−2 s−1 measuring light, 110 μmol (photons) m−2 s−1 actinic light and 6000 μmol (photons) m−2 s−1 saturation pulse light, fluorescence images were monitored. The following parameters were measured directly: FV/FM and ETR.
For the measurement of C. reinhardtii cells, 200 μL of suspensions (A750 of about 0.65) with 10% acetone (mock) and CA were added into the 96-well black microtiter plate to a final CA concentration of 20, 30 and 40 μM, respectively. The treated cells were incubated for 2.5 h at 25 °C under 100 μmol (photons) m−2 s−1 white light, and then samples were adapted in darkness for 0.5 h before fluorescence determination.

3.5. Chl a Fluorescence Kinetics OJIP Curves and JIP-Test

A plant efficiency analyzer (Handy PEA, Hansatech Instruments Ltd., King’s Lynn, Norfolk, UK) was used to measure the Chl a fluorescence kinetics OJIP curves. For the measurement, 7-mm diameter leaf discs of A. adenophora were washed with distilled water and incubated for 12 h in CA solutions with 0 (10% acetone, mock), 25, 50, 100 and 200 μM concentrations, respectively. Meanwhile, to verify the time-dependent effect of CA, leaf discs were also treated with 50 μM CA for 0, 3, 6 and 12 h, respectively. Samples were well adapted to darkness for 0.5 h prior to measurement. Raw fluorescence transients OJIP was transferred to a spreadsheet by Handy PEA V1.30 and BiolyzerHP3 software. The independent experiment was repeated three times with around 15 repetitions. The raw data of the fluorescence kinetics OJIP curves were analyzed using the JIP-test [41,52]. Detailed JIP-test parameters containing formulas, equations and definitions are listed in Table 1, which are according to Strasser et al. [41] and Chen et al. [45].

3.6. Modeling of CA in D1 Protein of A. adenophora

The target D1 protein of A. adenophora can be provided on the basis of the amino acid sequence (reference sequence no. YP 004564352.1). The sequence of amino acid was obtained from NCBI, in FASTA format. Evolutionary related protein structures were searched for by the BLAST databases through the SWISS-MODEL Template Library (SMTL) [53]. Searched templates of D1 protein were estimated using Global Model Quality Estimate (GMQE) and Quaternary Structure Quality Estimate (QSQE) and ranked by the expected quality of the resulting models. The protein structures of top-ranked templates were selected from the Protein Data Bank (PDB) and built the homology model of A. adenophora D1 protein by the Protein Module of Discovery Studio. The chemical structure of CA was constructed with the software of ChemBioDraw Ultra 14.0 (CambridgeSoft, Cambridge, MA, USA), and the Chem3D Pro 14.0 (CambridgeSoft, Cambridge, MA, USA) was used to minimize energy. The docking was performed by DS-CDocker in Discovery Studio 2016 (BIOVIA, San Diego, CA, USA). The polar was added to the protein during energy minimization and molecular refinement.

3.7. Statistical Analysis

One-way ANOVA was carried out and means were separated by DUNCAN LSD at 95% using SPSS Statistics 20.0.

4. Conclusions

CA is a natural mycobacterial metabolite that is widely known for its targeting of actin microfilaments to produce a series of interesting physiological phenomena. Our study reveals some interesting effects of CA on plant PSII and finds that CA has potential herbicidal activity. Based on the analysis of Chl a fluorescence rise kinetics and PSII oxygen evolution rate, CA inhibits photosynthesis by occupying the QB site in the D1 protein, thus blocking the electron transfer from QA to QB. The loss of overall photosynthetic activity of PSII is mainly due to the reduction of electron transfer efficiency, the destruction of antenna pigments and the inactivation of PSII reaction centers in the presence of CA. This mode of action is similar to that of the classical PSII herbicide diuron. The molecular docking model of CA binding to A. adenophora D1 protein further suggests that the direct target of CA is the QB site of D1 protein in PSII. It is proposed that CA forms potential hydrogen bonds with residues D1-His215, D1-Ala263 and D1-Ser264, respectively. Among them, D1-Ala263 is a novel site of action of CA different from the urea/triazine and the phenolic inhibitors. The inhibitory effect of CA on PSII allows CA to be used directly as a PSII inhibitor in various studies in the future. Considering the high development costs of chemical herbicides and the prevalence of resistant weeds, the unique binding of CA to D1 protein provides a new idea for the design of novel and efficient herbicide molecules to effectively manage weeds.

Author Contributions

S.C. designed the experiments. M.J., Q.Y., H.W., X.W. and Y.G. carried out experiments. S.C., Y.G., H.W., M.J., R.J.S., S.Q. and X.W. analyzed the data. M.J., H.W., Y.G., J.S. and Z.L. wrote the paper. S.C. revised the manuscript and prepared the final version. All authors have read and agreed to the published version of the manuscript.

Funding

This research was funded by the Jiangsu Agriculture Science and Technology Innovation Fund (CX(21)3093), the Fundamental Research Funds for the Central Universities (KYZ201530) and Foreign Expert Project (G2021145011L).

Data Availability Statement

Not applicable.

Acknowledgments

The authors thank editors and reviewers for their hard work and kind comments for this paper.

Conflicts of Interest

The authors declare no conflict of interest.

References

  1. Green, J.M.; Owen, M.D. Herbicide-resistant crops: Utilities and limitations for herbicide-resistant weed management. J. Agric. Food Chem. 2011, 59, 5819–5829. [Google Scholar] [CrossRef] [PubMed]
  2. Kaur, S.; Singh, H.P.; Mittal, S.; Batish, D.R.; Kohli, R.K. Phytotoxic effects of volatile oil from Artemisia scoparia against weeds and its possible use as a bioherbicide. Ind. Crops Prod. 2010, 32, 54–61. [Google Scholar] [CrossRef]
  3. Huang, H.; Morgan, C.M.; Asolkar, R.N.; Koivunen, M.E.; Marrone, P.G. Phytotoxicity of sarmentine isolated from long pepper (Piper longum) fruit. J. Agric. Food Chem. 2010, 58, 9994–10000. [Google Scholar] [CrossRef] [PubMed]
  4. Harding, D.P.; Raizada, M.N. Controlling weeds with fungi, bacteria and viruses: A review. Front. Plant Sci. 2015, 6, 659. [Google Scholar] [CrossRef] [PubMed] [Green Version]
  5. Scherlach, K.; Boettger, D.; Remme, N.; Hertweck, C. The chemistry and biology of cytochalasans. Nat. Prod. Rep. 2010, 27, 869–886. [Google Scholar] [CrossRef] [PubMed]
  6. Skellam, E. The biosynthesis of cytochalasans. Nat. Prod. Rep. 2017, 34, 1252–1263. [Google Scholar] [CrossRef]
  7. Himes, R.H.; Houston, L.L. The action of cytochalasin A on the in vitro polymerization of brain tubulin and muscle G-actin. J. Supramol. Struct. 1976, 5, 81–90. [Google Scholar] [CrossRef]
  8. Peterson, J.R.; Mitchison, T.J. Small Molecules, big Impact: A history of chemical Inhibitors and the cytoskeleton. Chem. Biol. 2002, 9, 1275–1285. [Google Scholar] [CrossRef] [Green Version]
  9. MacLean-Fletcher, S.; Pollard, T.D. Mechanism of action of cytochalasin B on actin. Cell 1980, 20, 329–341. [Google Scholar] [CrossRef]
  10. Brown, S.S.; Spudich, J.A. Mechanism of action of cytochalasin: Evidence that it binds to actin filament ends. J. Cell Biol. 1981, 88, 487–491. [Google Scholar] [CrossRef]
  11. Cooper, J.A. Effects of cytochalasin and phalloidin on actin. J. Cell Biol. 1987, 105, 1473–1478. [Google Scholar] [CrossRef] [PubMed] [Green Version]
  12. Shepro, D.; Belamarich, F.A.; Robblee, L.; Chao, F.C. Antimotility effect of cytochalasin B observed in mammalian clot retraction. J. Cell Biol. 1970, 47, 544–547. [Google Scholar] [CrossRef] [PubMed] [Green Version]
  13. Rampal, A.L.; Pinkofsky, H.B.; Jung, C.Y. Structure of cytochalasins and cytochalasin B binding sites in human erythrocyte membranes. Biochemistry 1980, 19, 679–683. [Google Scholar] [CrossRef]
  14. Nemeth, E.F.; Douglas, W.W. Effects of microfilament-active drugs, phalloidin and the cytochalasins A and B, on exocytosis in mast cells evoked by 48/80 or A23187. Naunyn-Schmiedeberg’s Arch. Pharmacol. 1978, 302, 153–163. [Google Scholar] [CrossRef] [PubMed]
  15. Lin, S.; Lin, D.C.; Spudich, J.A.; Kun, E. Inhibition of mitochondrial contraction by cytochalasin B. FEBS Lett. 1973, 37, 241–243. [Google Scholar]
  16. Gandalovicova, A.; Rosel, D.; Fernandes, M.; Vesely, P.; Heneberg, P.; Cermak, V.; Petruzelka, L.; Kumar, S.; Sanz-Moreno, V.; Brabek, J. Migrastatics-anti-metastatic and anti-invasion drugs: Promises and challenges. Trends Cancer 2017, 3, 391–406. [Google Scholar] [CrossRef] [Green Version]
  17. Trendowski, M.; Mitchell, J.M.; Corsette, C.M.; Acquafondata, C.; Fondy, T.P. Chemotherapy with cytochalasin congeners in vitro and in vivo against murine models. Investig. New Drug 2015, 33, 290–299. [Google Scholar] [CrossRef] [Green Version]
  18. Wagner, G.; Haupt, W.; Laux, A. Reversible inhibition of chloroplast movement by cytochalasin B in the green alga mougeofia. Science 1972, 176, 808–809. [Google Scholar] [CrossRef]
  19. Izutani, Y.; Takagi, S.; Nag, R. Orientation movements of chloroplasts in Vallisneriu epidermal cells: Different effects of light at low-and high-fluence rate. Photochem. Photobiol. 1990, 51, 105–111. [Google Scholar] [CrossRef]
  20. Gestel, K.V.; Kohler, R.H.; Verbelen, J.P. Plant mitochondria move on F-actin, but their positioning in the cortical cytoplasm depends on both F-actin and microtubules. J. Exp. Bot. 2002, 53, 659–667. [Google Scholar] [CrossRef]
  21. Quader, H.; Hofmann, A.; Schnepf, E. Reorganization of the endoplasmic reticulum in epidermal cells of onion bulb scales after cold stress: Involvement of cytoskeletal elements. Planta 1989, 177, 273–280. [Google Scholar] [CrossRef] [PubMed]
  22. Boevink, P.; Oparka, K.; Cruz, S.S.; Martin, B.; Betteridge, A.; Hawes, C. Stacks on tracks: The plant Golgi apparatus traffics on an actin/ER network. Plant J. 1998, 15, 441–447. [Google Scholar] [CrossRef] [PubMed] [Green Version]
  23. Nebenfuhr, A.; Gallagher, L.A.; Dunahay, T.G.; Frohlick, J.A.; Mazurkiewicz, A.M.; Meehl, J.B.; Staehelin, L.A. Stop-and-go movements of plant Golgi stacks are mediated by the acto-myosin system. Plant Physiol. 1999, 121, 1127–1141. [Google Scholar] [CrossRef] [PubMed] [Green Version]
  24. Mano, S.; Nakamori, C.; Hayashi, M.; Kato, A.; Kondo, M.; Nishimura, M. Distribution and characterization of peroxisomes in Arabidopsis by visualization with GFP: Dynamic morphology and actin-dependent movement. Plant Cell Physiol. 2002, 43, 331–341. [Google Scholar] [CrossRef] [PubMed] [Green Version]
  25. Kalachova, T.; Leontovycova, H.; Iakovenko, O.; Pospichalova, R.; Marsik, P.; Kloucek, P.; Janda, M.; Valentova, O.; Kocourkova, D.; Martinec, J.; et al. Interplay between phosphoinositides and actin cytoskeleton in the regulation of immunity related responses in Arabidopsis thaliana seedlings. Environ. Exp. Bot. 2019, 167, 103867. [Google Scholar] [CrossRef]
  26. Leontovycova, H.; Kalachova, T.; Trda, L.; Pospichalova, R.; Lamparova, L.; Dobrev, P.I.; Malinska, K.; Burketova, L.; Valentova, O.; Janda, M. Actin depolymerization is able to increase plant resistance against pathogens via activation of salicylic acid signalling pathway. Sci. Rep. 2019, 9, 10397. [Google Scholar] [CrossRef] [Green Version]
  27. Evidente, A.; Andolfi, A.; Vurro, M.; Zonno, M.C.; Motta, A. Cytochalasins Z1, Z2 and Z3, three 24-oxal[14]cytochalasans produced by Pyrenophora semeniperda. Phytochemistry 2002, 60, 45–53. [Google Scholar] [CrossRef]
  28. Berestetskiy, A.; Dmitriev, A.; Mitina, G.; Lisker, I.; Andolfi, A.; Evidente, A. Nonenolides and cytochalasins with phytotoxic activity against Cirsium arvense and Sonchus arvensis: A structure-activity relationships study. Phytochemistry 2008, 69, 953–960. [Google Scholar] [CrossRef]
  29. Konig, G.M.; Wright, A.D.; Aust, H.J.; Draeger, S.; Schulz, B. Geniculol, a new biologically active diterpene from the endophytic fungus Geniculosporium sp. J. Nat. Prod. 1999, 62, 155–157. [Google Scholar] [CrossRef]
  30. Kshirsagar, A.; Reid, A.J.; McColl, S.M.; Saunders, V.A.; Whalley, A.J.S.; Evans, E.H. The effect of fungal metabolites on leaves as detected by chlorophyll fluorescence. New Phytol. 2001, 151, 451–457. [Google Scholar] [CrossRef]
  31. Shen, J.R. The structure of photosystem II and the mechanism of water oxidation in photosynthesis. Annu. Rev. Plant Biol. 2015, 66, 23–48. [Google Scholar] [CrossRef] [PubMed]
  32. Oettmeier, W. Herbicide resistance and supersensitivity in photosystem II. Cell. Mol. Life Sci. 1999, 55, 1255–1277. [Google Scholar] [CrossRef] [PubMed]
  33. Trebst, A. The Mode of Action of Triazine Herbicides in Plants; Elsevier: San Diego, CA, USA, 2008; pp. 101–110. [Google Scholar]
  34. Battaglino, B.; Grinzato, A.; Pagliano, C. Binding properties of photosynthetic herbicides with the QB site of the D1 protein in plant photosystem II: A combined functional and molecular docking study. Plants 2021, 10, 1501. [Google Scholar] [CrossRef] [PubMed]
  35. Vurro, M.; Ellis, B.E. Effect of fungal toxins on induction of phenylalanine ammonia-lyase activity in elicited cultures of hybrid poplar. Plant Sci. 1997, 126, 29–38. [Google Scholar] [CrossRef]
  36. Guo, Y.; Cheng, J.; Lu, Y.; Wang, H.; Gao, Y.; Shi, J.; Yin, C.; Wang, X.; Chen, S.; Strasser, R.J.; et al. Novel action targets of natural product gliotoxin in photosynthetic apparatus. Front. Plant Sci. 2020, 10, 1688. [Google Scholar] [CrossRef] [Green Version]
  37. Xiao, W.; Wang, H.; Liu, W.; Wang, X.; Guo, Y.; Strasser, R.J.; Qiang, S.; Chen, S.; Hu, Z. Action of alamethicin in photosystem II probed by the fast chlorophyll fluorescence rise kinetics and the JIP-test. Photosynthetica 2020, 58, 358–368. [Google Scholar] [CrossRef]
  38. Guo, Y.; Liu, W.; Wang, H.; Wang, X.; Qiang, S.; Kalaji, H.M.; Strasser, R.J.; Chen, S. Action mode of the mycotoxin patulin as a novel natural photosystem II Inhibitor. J. Agric. Food Chem. 2021, 69, 7313–7323. [Google Scholar] [CrossRef]
  39. Chen, S.; Xu, X.; Dai, X.; Yang, C.; Qiang, S. Identification of tenuazonic acid as a novel type of natural photosystem II inhibitor binding in QB-site of Chlamydomonas reinhardtii. Biochim. Biophys. Acta 2007, 1767, 306–318. [Google Scholar] [CrossRef] [Green Version]
  40. Nimbal, C.I.; Yerkes, C.N.; Weston, L.A.; Weller, S.C. Herbicidal activity and site of action of the natural product sorgoleone. Pestic. Biochem. Phys. 1996, 54, 73–83. [Google Scholar] [CrossRef]
  41. Strasser, R.J.; Tsimilli-Michael, M.; Srivastava, A. Analysis of the chlorophyll a fluorescence transient. In Chlorophyll a Fluorescence: A Signature of Photosynthesis; Papageorgiou, G.C., Ed.; Springer: Dordrecht, The Netherlands, 2004; Volume 19, pp. 321–362. [Google Scholar]
  42. Krause, G.H.; Weis, E. Chlorophyll fluorescence and photosynthesis: The basics. Annu. Rev. Plant Physiol. Plant Mol. Biol. 1991, 42, 313–349. [Google Scholar] [CrossRef]
  43. Toth, S.Z.; Schansker, G.; Strasser, R.J. In intact leaves, the maximum fluorescence level FM is independent of the redox state of the plastoquinone pool: A DCMU-inhibition study. Biochim. Biophys. Acta 2005, 1708, 275–282. [Google Scholar] [CrossRef] [PubMed]
  44. Gao, Y.; Liu, W.; Wang, X.; Yang, L.; Han, S.; Chen, S.; Strasser, R.J.; Valverde, B.E.; Qiang, S. Comparative phytotoxicity of usnic acid, salicylic acid, cinnamic acid and benzoic acid on photosynthetic apparatus of Chlamydomonas reinhardtii. Plant Physiol. Biochem. 2018, 128, 1–12. [Google Scholar] [CrossRef] [PubMed]
  45. Chen, S.; Strasser, R.J.; Qiang, S. In vivo assessment of effect of phytotoxin tenuazonic acid on PSII reaction centers. Plant Physiol. Biochem. 2014, 84, 10–21. [Google Scholar] [CrossRef] [PubMed]
  46. Chen, S.; Yang, J.; Zhang, M.; Strasser, R.J.; Qiang, S. Classification and characteristics of heat tolerance in Ageratina adenophora populations using fast chlorophyll a fluorescence rise O-J-I-P. Environ. Exp. Bot. 2016, 122, 126–140. [Google Scholar] [CrossRef]
  47. Kyle, D.J. The 32000 dalton QB protein of photosystem II. Photochem. Photobiol. 1985, 41, 107–116. [Google Scholar] [CrossRef]
  48. Xiong, J.; Subramaniam, S.; Govindjee. Modeling of the D1/D2 proteins and cofactors of the photosystem II reaction center: Implications for herbicide and bicarbonate binding. Protein Sci. 1996, 5, 2054–2073. [Google Scholar] [CrossRef]
  49. Sun, H. Homology modeling and ligand-based molecule design. In A Practical Guide to Rational Drug Design; Sun, H., Ed.; Elsevier: Amsterdam, The Netherlands, 2016; pp. 109–160. [Google Scholar]
  50. Wang, H.; Yao, Q.; Guo, Y.; Zhang, Q.; Wang, Z.; Strasser, R.J.; Valverde, B.E.; Chen, S.; Qiang, S.; Kalaji, H.M. Structure-based ligand design and discovery of novel tenuazonic acid derivatives with high herbicidal activity. J. Adv. Res. 2021, 40, 29–44. [Google Scholar] [CrossRef]
  51. Takahashi, R.; Hasegawa, K.; Takano, A.; Noguchi, T. Structures and binding sites of phenolic herbicides in the QB pocket of photosystem II. Biochemistry 2010, 49, 5445–5454. [Google Scholar] [CrossRef] [PubMed]
  52. Strasser, R.J.; Tsimilli-Michael, M.; Qiang, S.; Goltsev, V. Simultaneous in vivo recording of prompt and delayed fluorescence and 820-nm reflection changes during drying and after rehydration of the resurrection plant Haberlea rhodopensis. Biochim. Biophys. Acta Bioenerg. 2010, 1797, 1313–1326. [Google Scholar] [CrossRef] [Green Version]
  53. Waterhouse, A.; Bertoni, M.; Bienert, S.; Studer, G.; Tauriello, G.; Gumienny, R.; Heer, F.T.; de Beer, T.A.P.; Rempfer, C.; Bordoli, L.; et al. SWISS-MODEL: Homology modelling of protein structures and complexes. Nucleic Acids Res. 2018, 46, W296–W303. [Google Scholar] [CrossRef]
Figure 1. (A) Chemical structure of cytochalasin A (C29H35NO5, MW = 477.6). (B) Lesion formation of A. adenophora leaves treated with mock (10% acetone) and 100, 200, 400 and 800 μM cytochalasin A. (C) Effect of cytochalasin A on oxygen evolving rate of C. reinhardtii cells. Data shown are mean values ± SE of three independent measurements with around 15 repetitions. The different lowercase letters (a, b, c, d, e) indicate to be statistical significance at 0.05 level.
Plants 11 02797 g001
Figure 2. Effects of cytochalasin A on color fluorescence imaging of FO, FM and FV/FM (A), the value of the maximum quantum yield of PSII (FV/FM) (B), and electron transport rate (ETR) (C) of C. reinhardtii cells. Fluorescence images were indicated by color code in the order of black (0) through red, orange, yellow, green, blue, violet to purple (1). The number codes above images are marked from 0 to 1, showing the changes. Each value is the average ± SE of three independent experiments with around 15 repetitions. The different lowercase letters (a, b, c, d) indicate to be statistical significance at 0.05 level.
Plants 11 02797 g002
Figure 3. Effects of cytochalasin A on fast chlorophyll a fluorescence rise kinetics OJIP of A. adenophora leaf discs. (A,B) Raw Chl a fluorescence rise kinetics and its variable changes normalized by FO and FM as Vt = (Ft − FO)/(FM − FO) (top) and ∆Vt = Vt(treatment) − Vt(control) (bottom) in a logarithmic time scale of A. adenophora treated with different concentrations (0, 25, 50, 100 and 200 μM) of cytochalasin A for 12 h. (C,D) Raw Chl a fluorescence rise kinetics and its variable changes normalized by FO and FM as Vt = (Ft − FO)/(FM − FO) (top) and ∆Vt = Vt(treatment) − Vt(control) (bottom) in a logarithmic time scale of A. adenophora treated with 50 μM cytochalasin A for different time periods (0, 3, 6 and 12 h). Each curve is the average of three independent experiments with around 15 repetitions.
Plants 11 02797 g003
Figure 4. Changes of selected JIP-test fluorescence parameters of A. adenophora leaf discs treated with different concentrations of cytochalasin A. (A) FO, FM and FV/FM. (B) VJ, VI and ∆VJ. (C) φEo, ψEo and φPo. (D) ABS/CS0, TR0/CS0 and ET0/CS0. (E) RC/CS0, QA-reducing centers, RJ. (F) PIABS and D.F. Each curve is the average of three independent experiments with around 15 repetitions. The different lowercase letters (a, b, c, d) indicate to be statistical significance at 0.05 level.
Plants 11 02797 g004
Figure 5. Analysis of the linear relationship between different selected JIP-test parameters after A. adenophora leaf discs were treated with different concentrations of cytochalasin A for 12 h. (A) The ABS/CS and TR0/CS versus FM. (B) The φEo and RJ versus VJ. (C) The RJ versus φEo, ψEo and ET0/CS0. (D) The ψEo and ET0/CS0 versus QA-reducing centers. (E) The ABS/CS0, TR0/CS0 and ET0/CS0 versus PIABS (F) The φPo, ψEo and QA-reducing centers versus PIABS. Each curve is the average of three independent experiments with around 15 repetitions.
Plants 11 02797 g005
Figure 6. The simulated modeling of cytochalasin A binding to D1 protein of A. adenophora. (A) Hydrogen bonding interactions for cytochalasin A binding to D1 protein. (B) Stereo view of cytochalasin A binding environment of D1 protein. Here, carbon atoms are shown in grey, nitrogen atoms in blue, oxygen in red and hydrogen atoms in white. The possible hydrogen bonds are indicated by dashed lines.
Plants 11 02797 g006
Table 1. Formulae and explanation of the technical data of the OJIP curves and the selected JIP-test parameters used in this study 1.
Technical Fluorescence Parameters
Ftfluorescence at time t after onset of actinic illumination
FO ≅ F20μsminimal fluorescence, when all PSII RCs are open
FL ≡ F150μsfluorescence intensity at the L-step (150 μs) of OJIP
FK ≡ F300μsfluorescence intensity at the K-step (300 μs) of OJIP
FJ ≡ F2msfluorescence intensity at the J-step (2 ms) of OJIP
FI ≡ F30msfluorescence intensity at the I-step (30 ms) of OJIP
FP (= M)maximal fluorescence, at the peak P of OJIP
Fv ≡ Ft − FOvariable fluorescence at time t
Vt ≡ (Ft − FO)/(FM − FO)relative variable fluorescence at time t
VJ = (FJ − FO)/(FM − FO)relative variable fluorescence at the J-step
VI = (FI − FO)/(FM − FO)relative variable fluorescence at the I-step
Quantum efficiencies or flux ratios
φPo = PHI(P0) = TR0/ABS = 1 − FO/FMmaximum quantum yield for primary photochemistry
ψΕo = PSI0 = ET0/TR0 = (1 − VJ)probability that an electron moves further than QA
φEo = PHI(E0) = ET0/ABS = (1 − FO/FM) (1 − VJ)quantum yield for electron transport (ET)
Phenomenological energy fluxes (per excited leaf cross-section-CS)
ABS/CS = Chl/CSabsorption flux per CS
TR0/CS = φPo·(ABS/CS)trapped energy flux per CS
ET0/CS = φPo·ψΕo·(ABS/CS)electron transport flux per CS
Density of reaction center (QA-reducing PSII reaction center–RC)
RC/CS = φPo·(VJ/M0)·(ABS/CS)density of QA-reducing PSII RCs per CS
QA-reducing centers = (RC/RCreference)·(ABS/ABSreference)
= [(RC/CS)treatment/(RC/CS)control]·[(ABS/CS)treatment/(ABS/CS)control]
fraction of QA-reducing PSII RCs
RJ = (ψΕo(control) − ψΕo(treatment))/ψΕo(control)
= (VJ(treatment) − VJ(control))/(1 − VJ(control))
number of PSII RCs with QB-site filled by PSII inhibitor
Performance indexes
P I A B S γ RC 1 γ RC · φ Po 1 φ Po · Ψ Eo 1 Ψ Eo performance index for energy conservation from photons absorbed by PSII to the reduction of intersystem electron acceptors
Phenomenological energy fluxes (per excited leaf cross-section-CS)
DF ABS = log PI ABS = log RC ABS + log ( ϕ Po 1 ϕ Po ) + log ( ψ Eo 1 ψ Eo ) driving force on absorption basis
1 Subscript “0” (or “o” when written after another subscript) indicates that the parameter refers to the onset of illumination, when all RCs are assumed to be open.
Table 2. Possible bonding interactions for CA binding to the D1 protein of A. adenophora.
CA Chemical StructureDonorAcceptorInteractionsBound Distance (Å)
Plants 11 02797 i001D1-Phe 211CAC16-CH3Pi Hydrophobic3.97
D1-His 215 NHCA O3Hydrogen Bond2.48
D1-Ile 248CA C10-CH3Alkyl Hydrophobic3.72
D1-Leu 251CA C11Alkyl Hydrophobic3.77
D1-His 252CA C10-CH3Alkyl Hydrophobic3.81
CA C18-OHD1-Ala 263 COHydrogen Bond2.44
CA C18-OHD1-Ser 264 COHydrogen Bond2.35
D1-Phe 265CA C17=CH2Pi Hydrophobic3.83
D1-Leu 271CA C11Alkyl Hydrophobic3.91
D1-Phe 274CA C16-CH3Pi Hydrophobic3.86
Publisher’s Note: MDPI stays neutral with regard to jurisdictional claims in published maps and institutional affiliations.

