
Evaluation of Salicornia bigelovii Germplasm for Food Use in Egypt and the United Arab Emirates Based on Agronomic Traits and Nutritional Composition
 , , , , and
Abstract
:1. Introduction
2. Materials and Methods
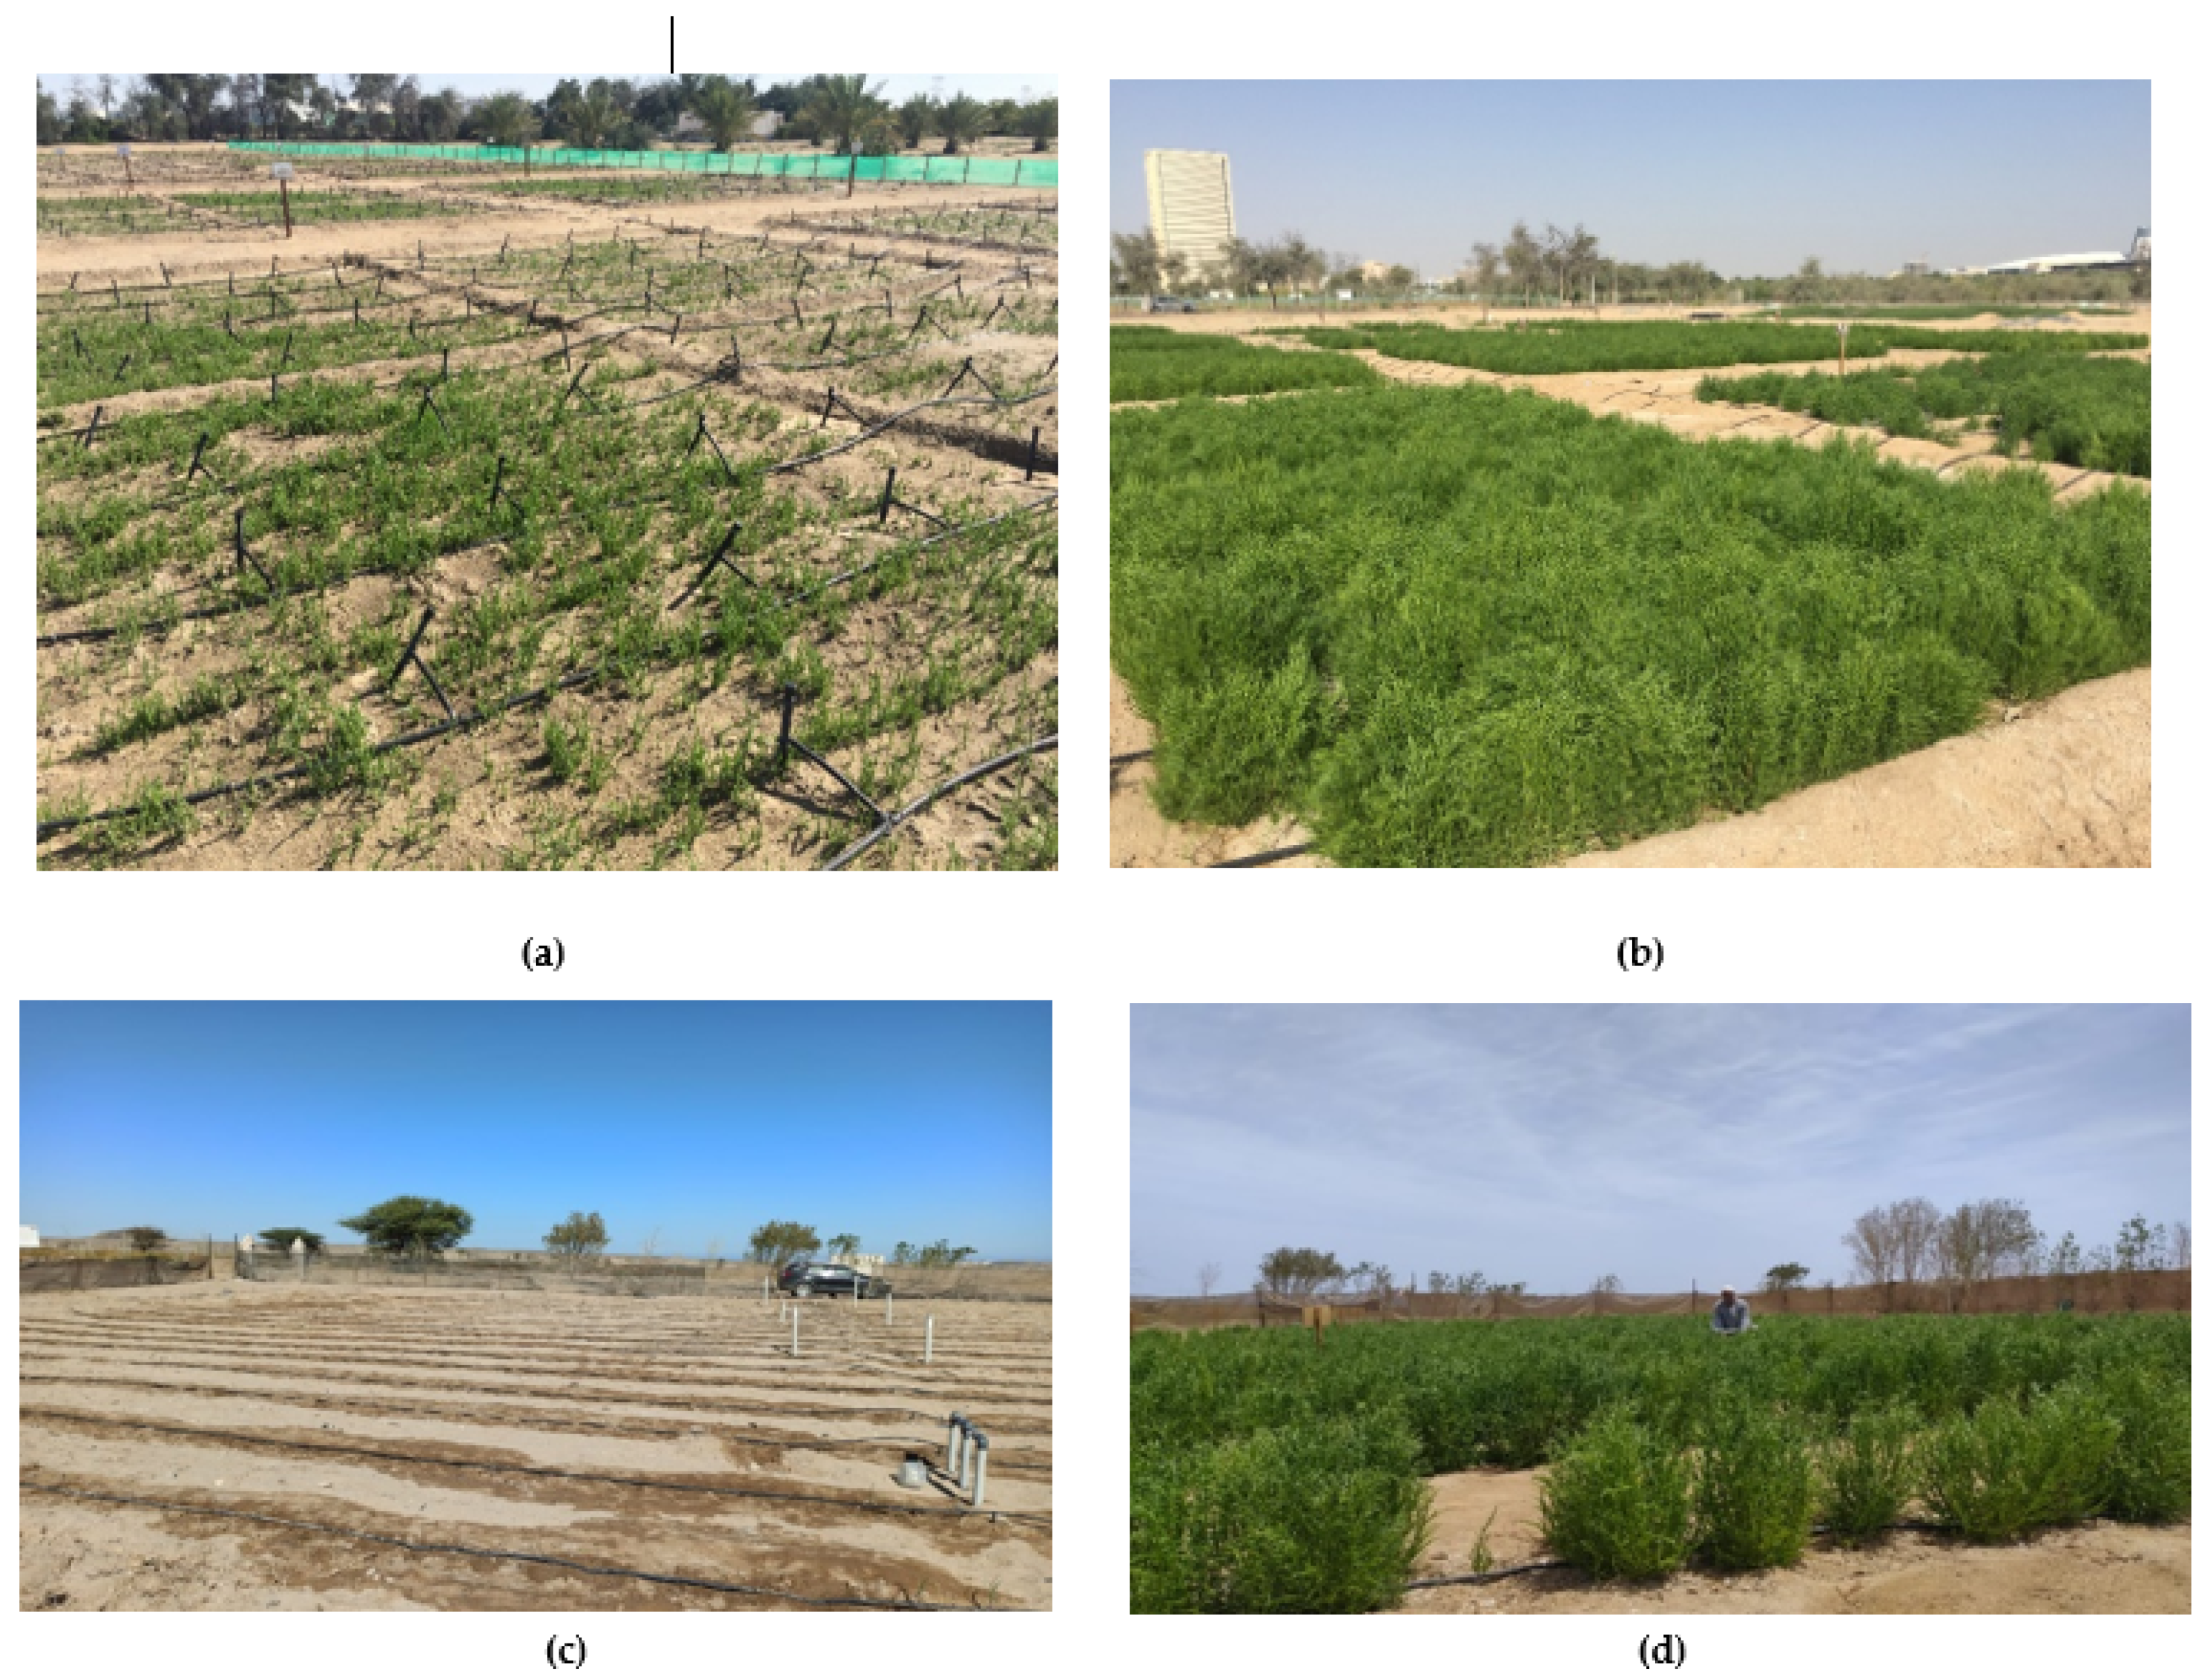
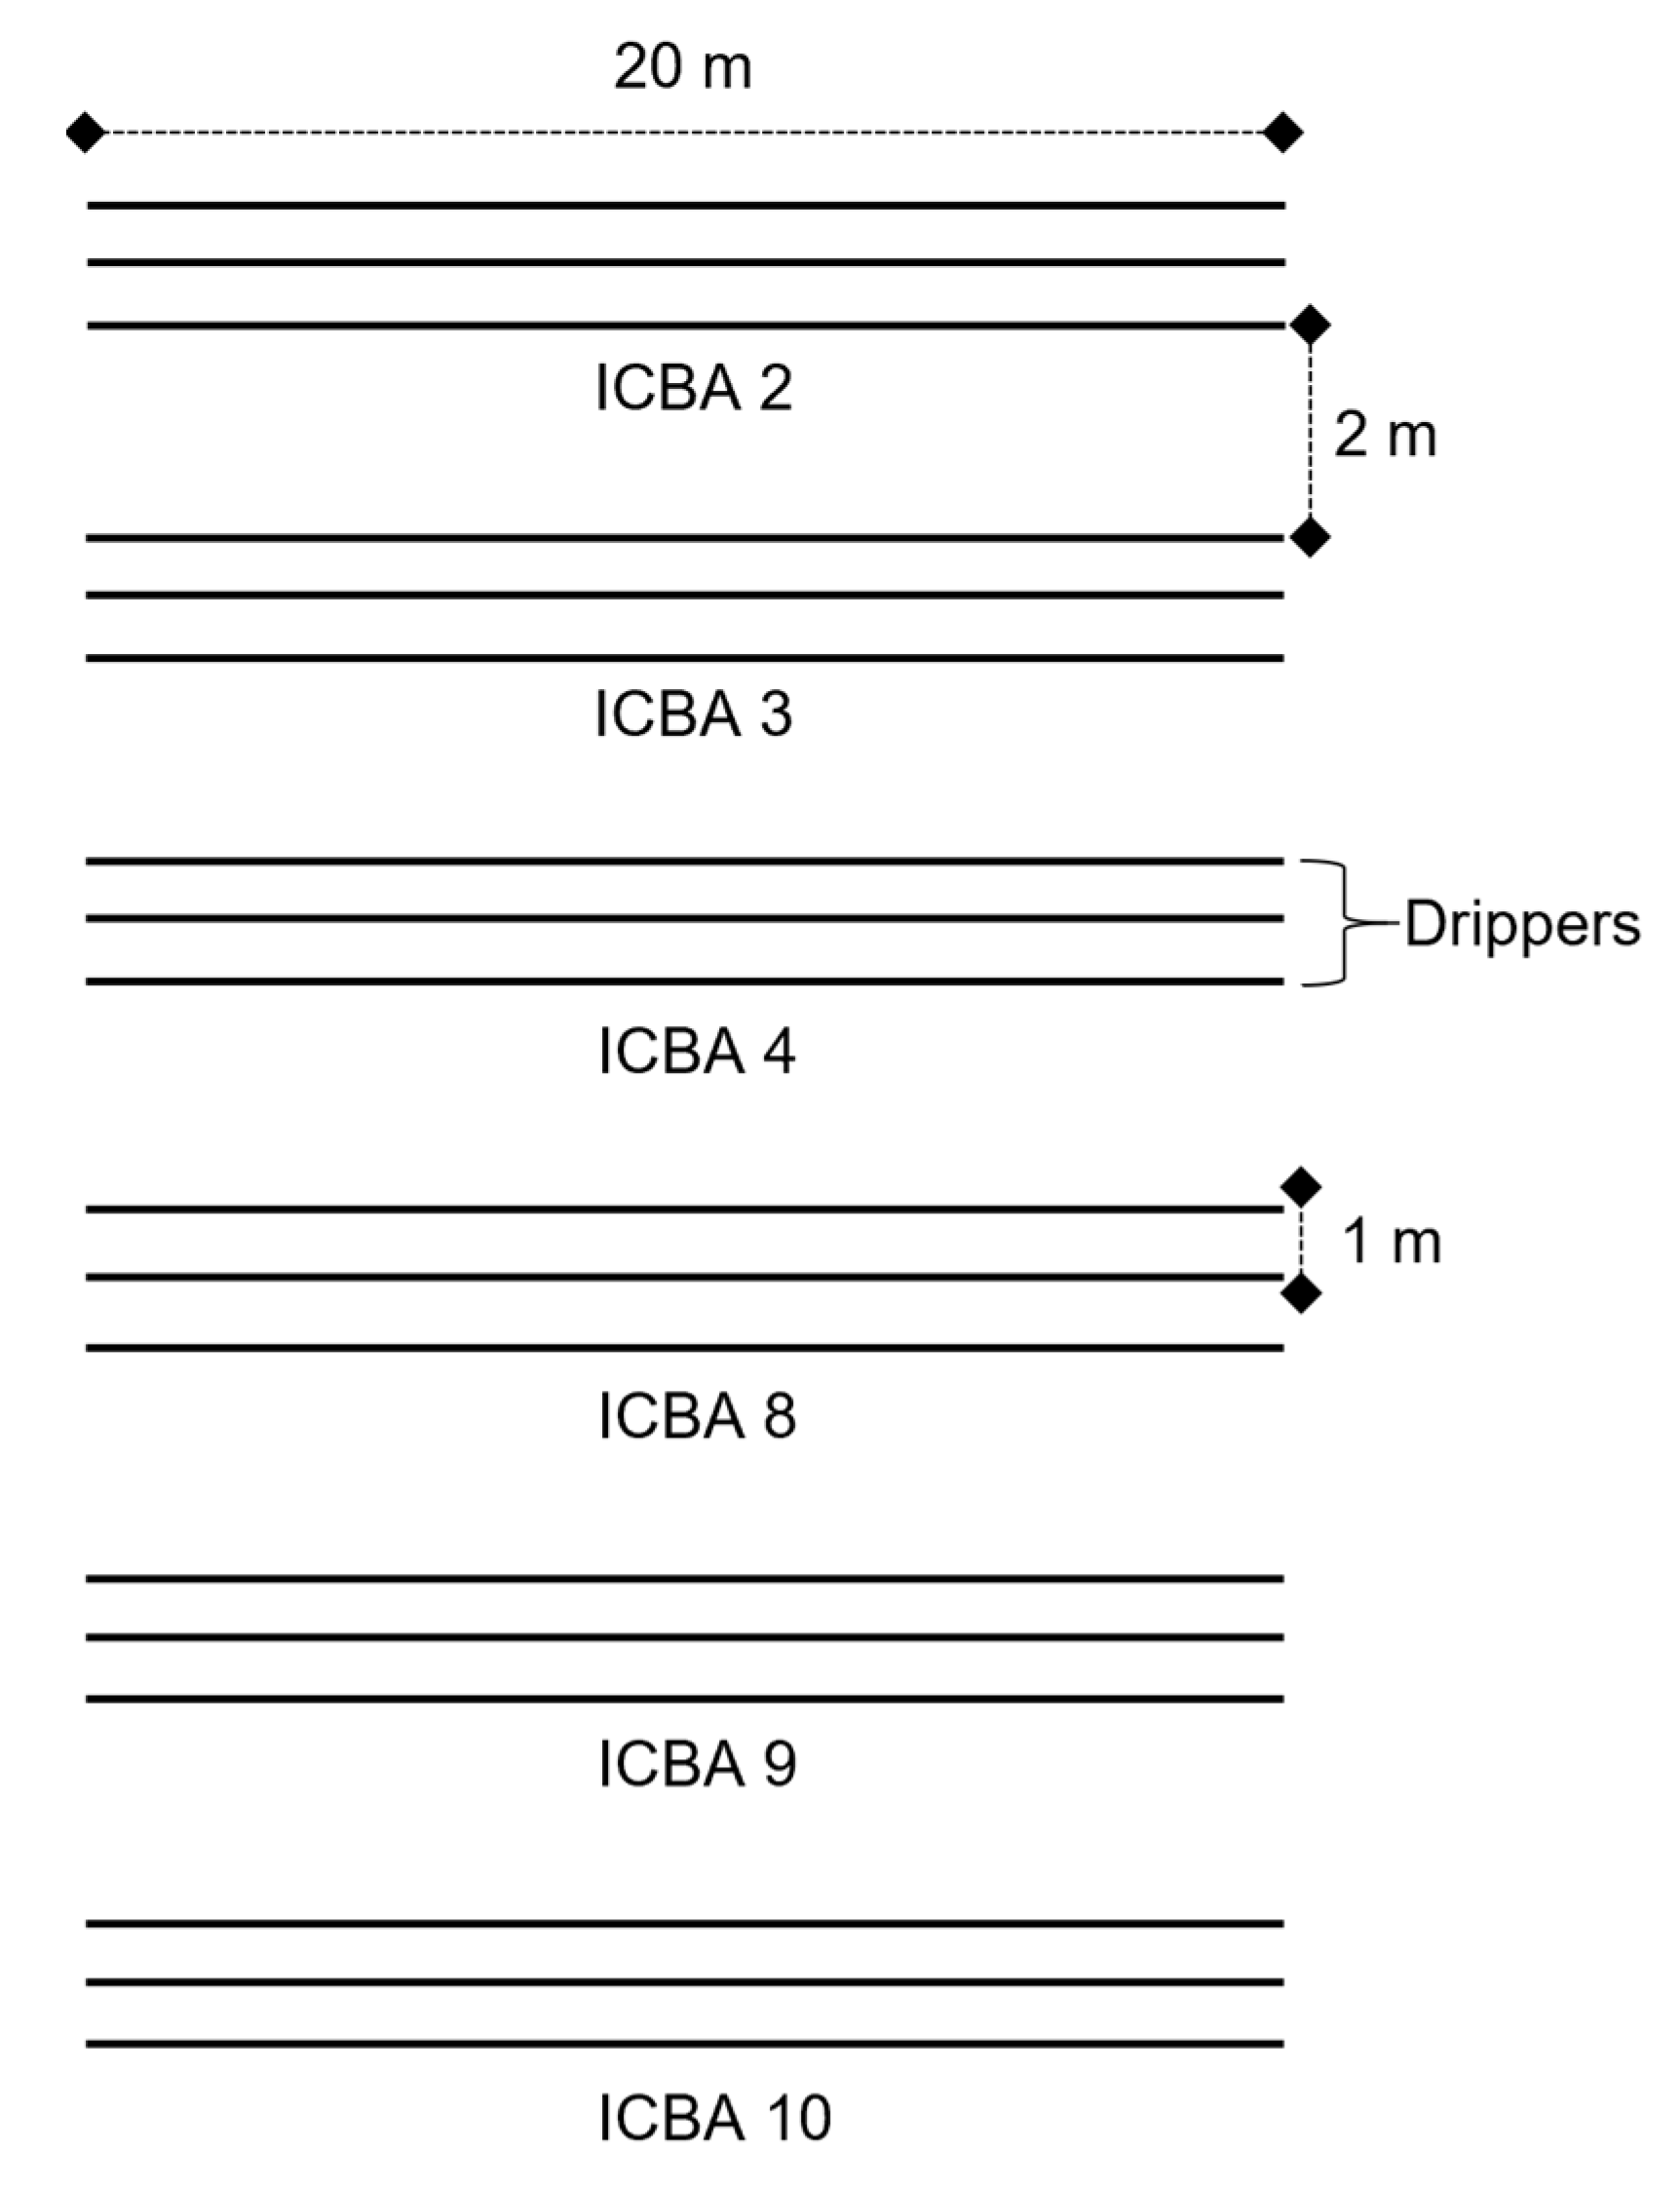
2.1. Plant Material and Field Trials
2.2. Plot Data
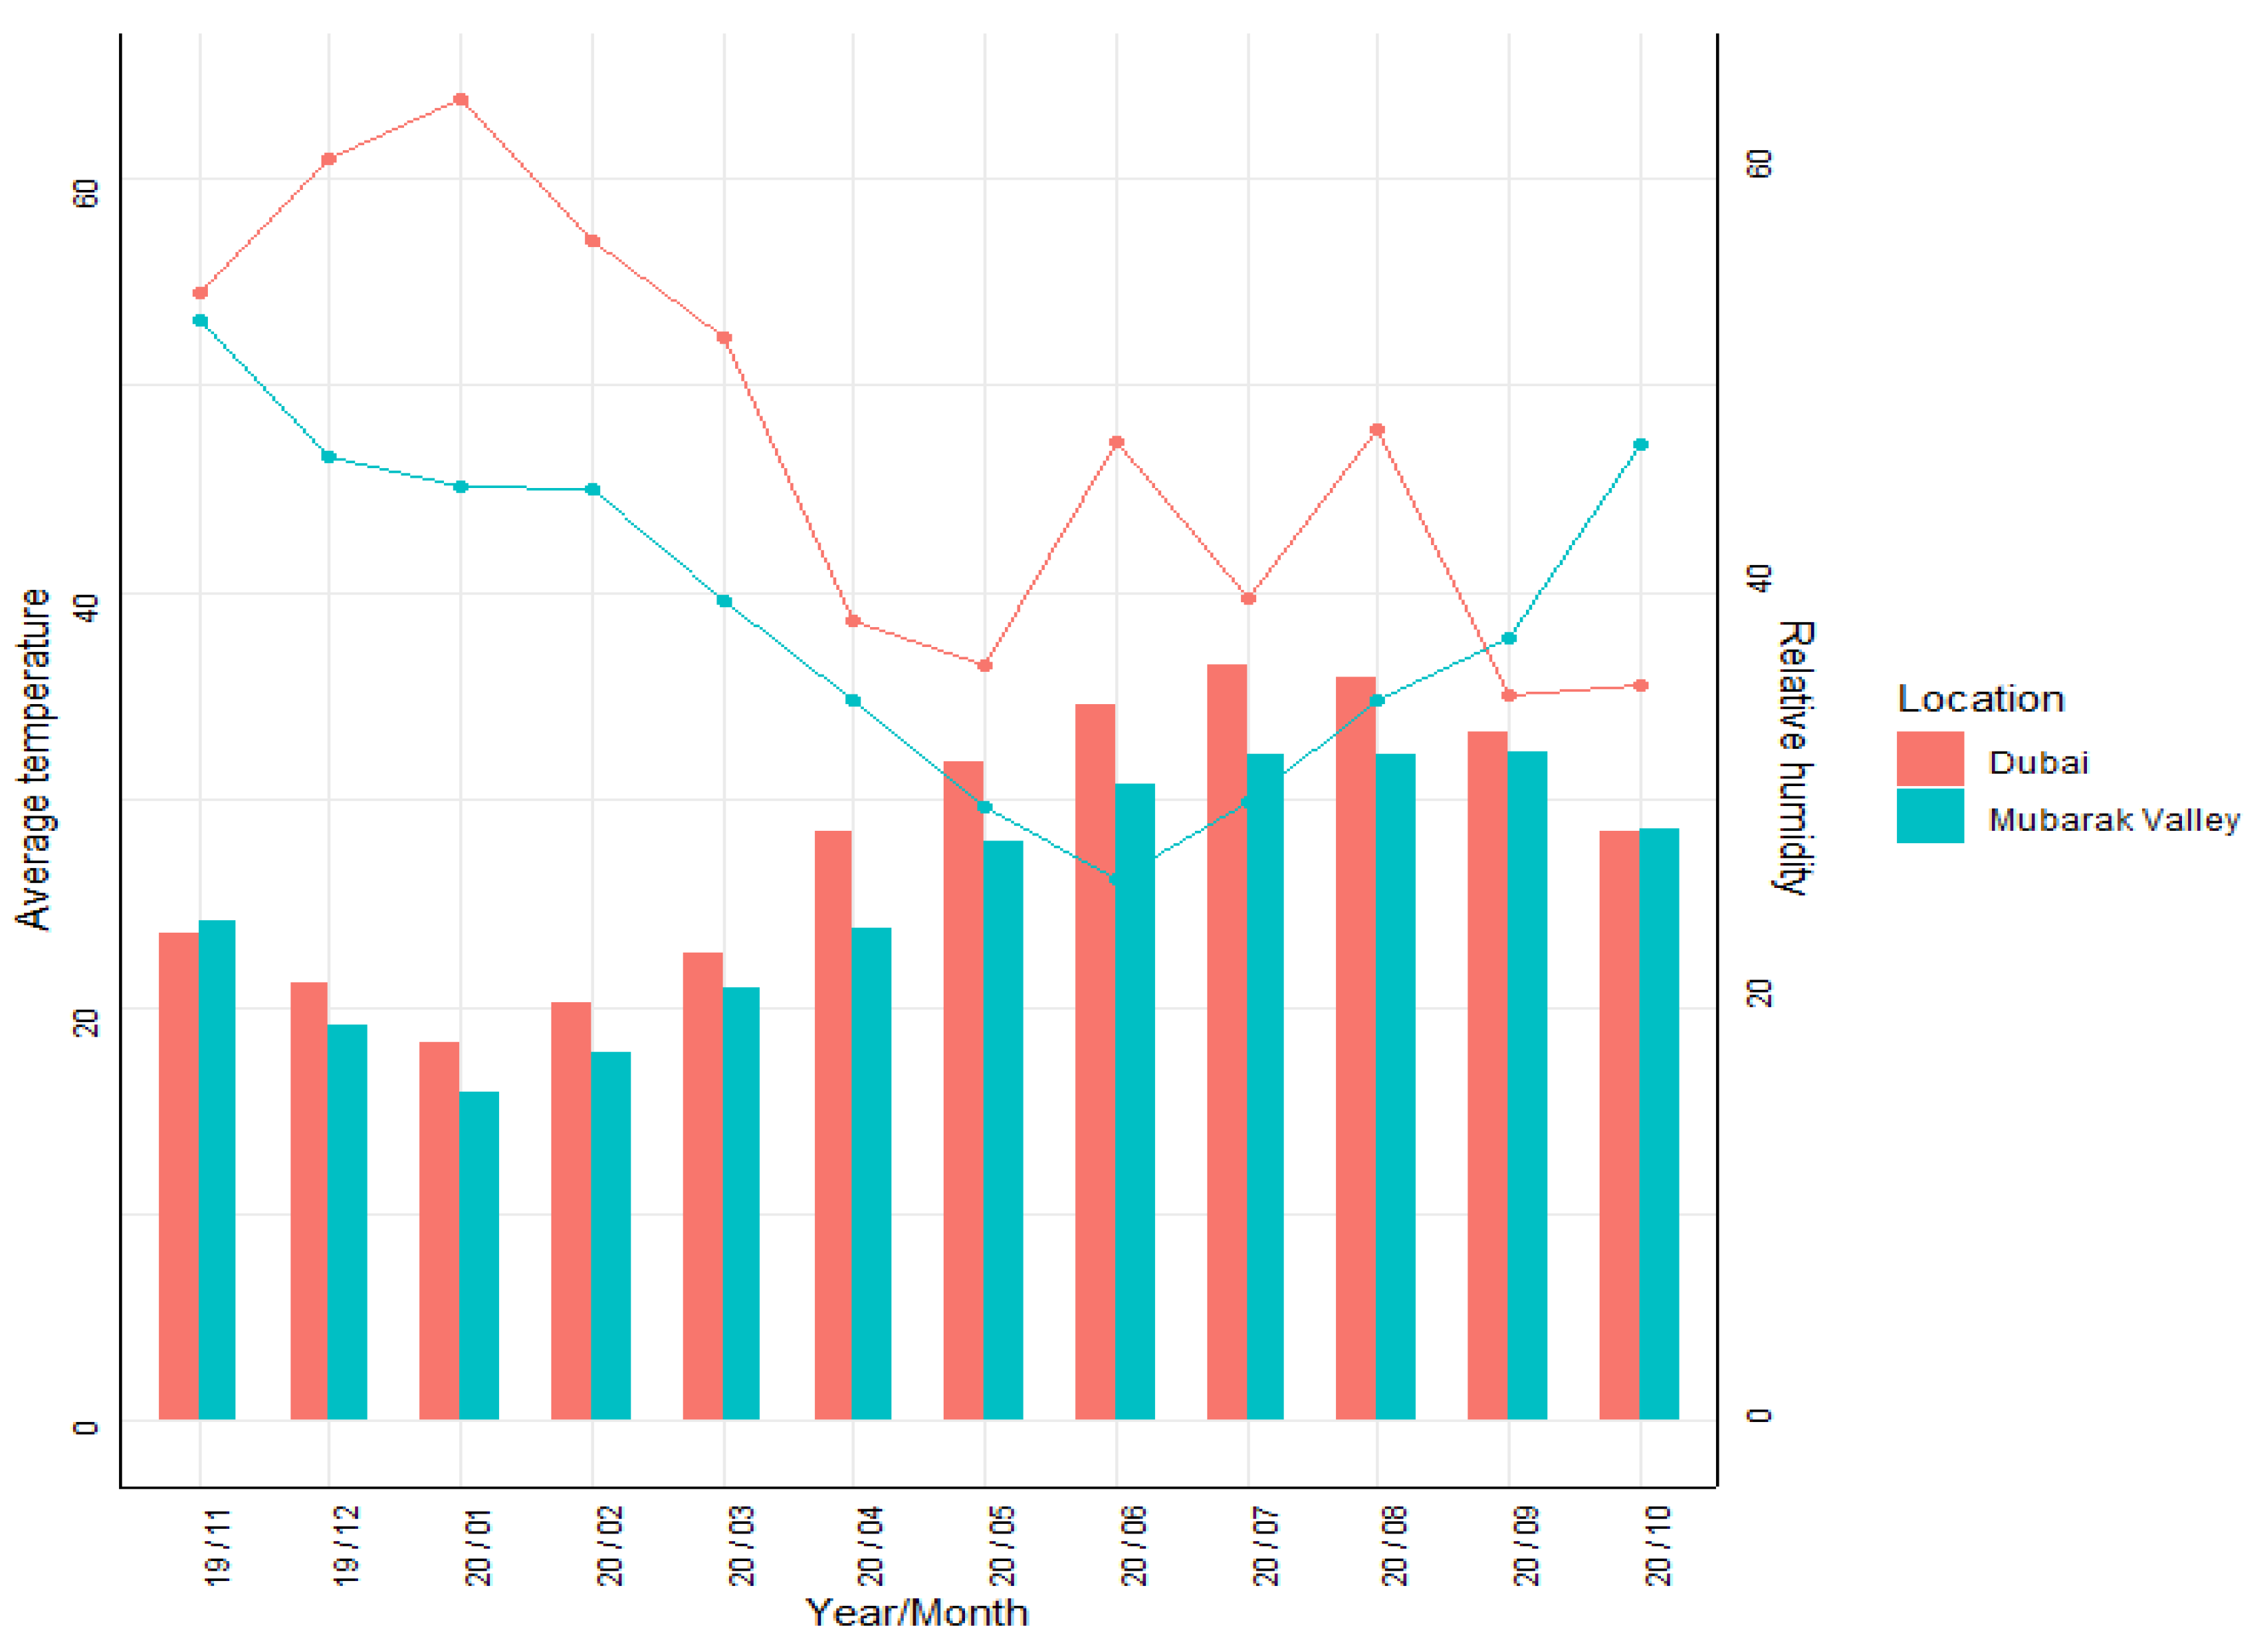
2.3. Climatic Data
2.4. Soil and Water Analysis
2.5. Analysis of the Chemical Composition of Shoots and Seeds
2.6. Statistical Analysis
3. Results
3.1. Climatic Data
3.2. Water and Soil Analyses
3.2.1. Water analysis
3.2.2. Soil Analysis
3.3. Salicornia bigelovii Agronomic Measurements
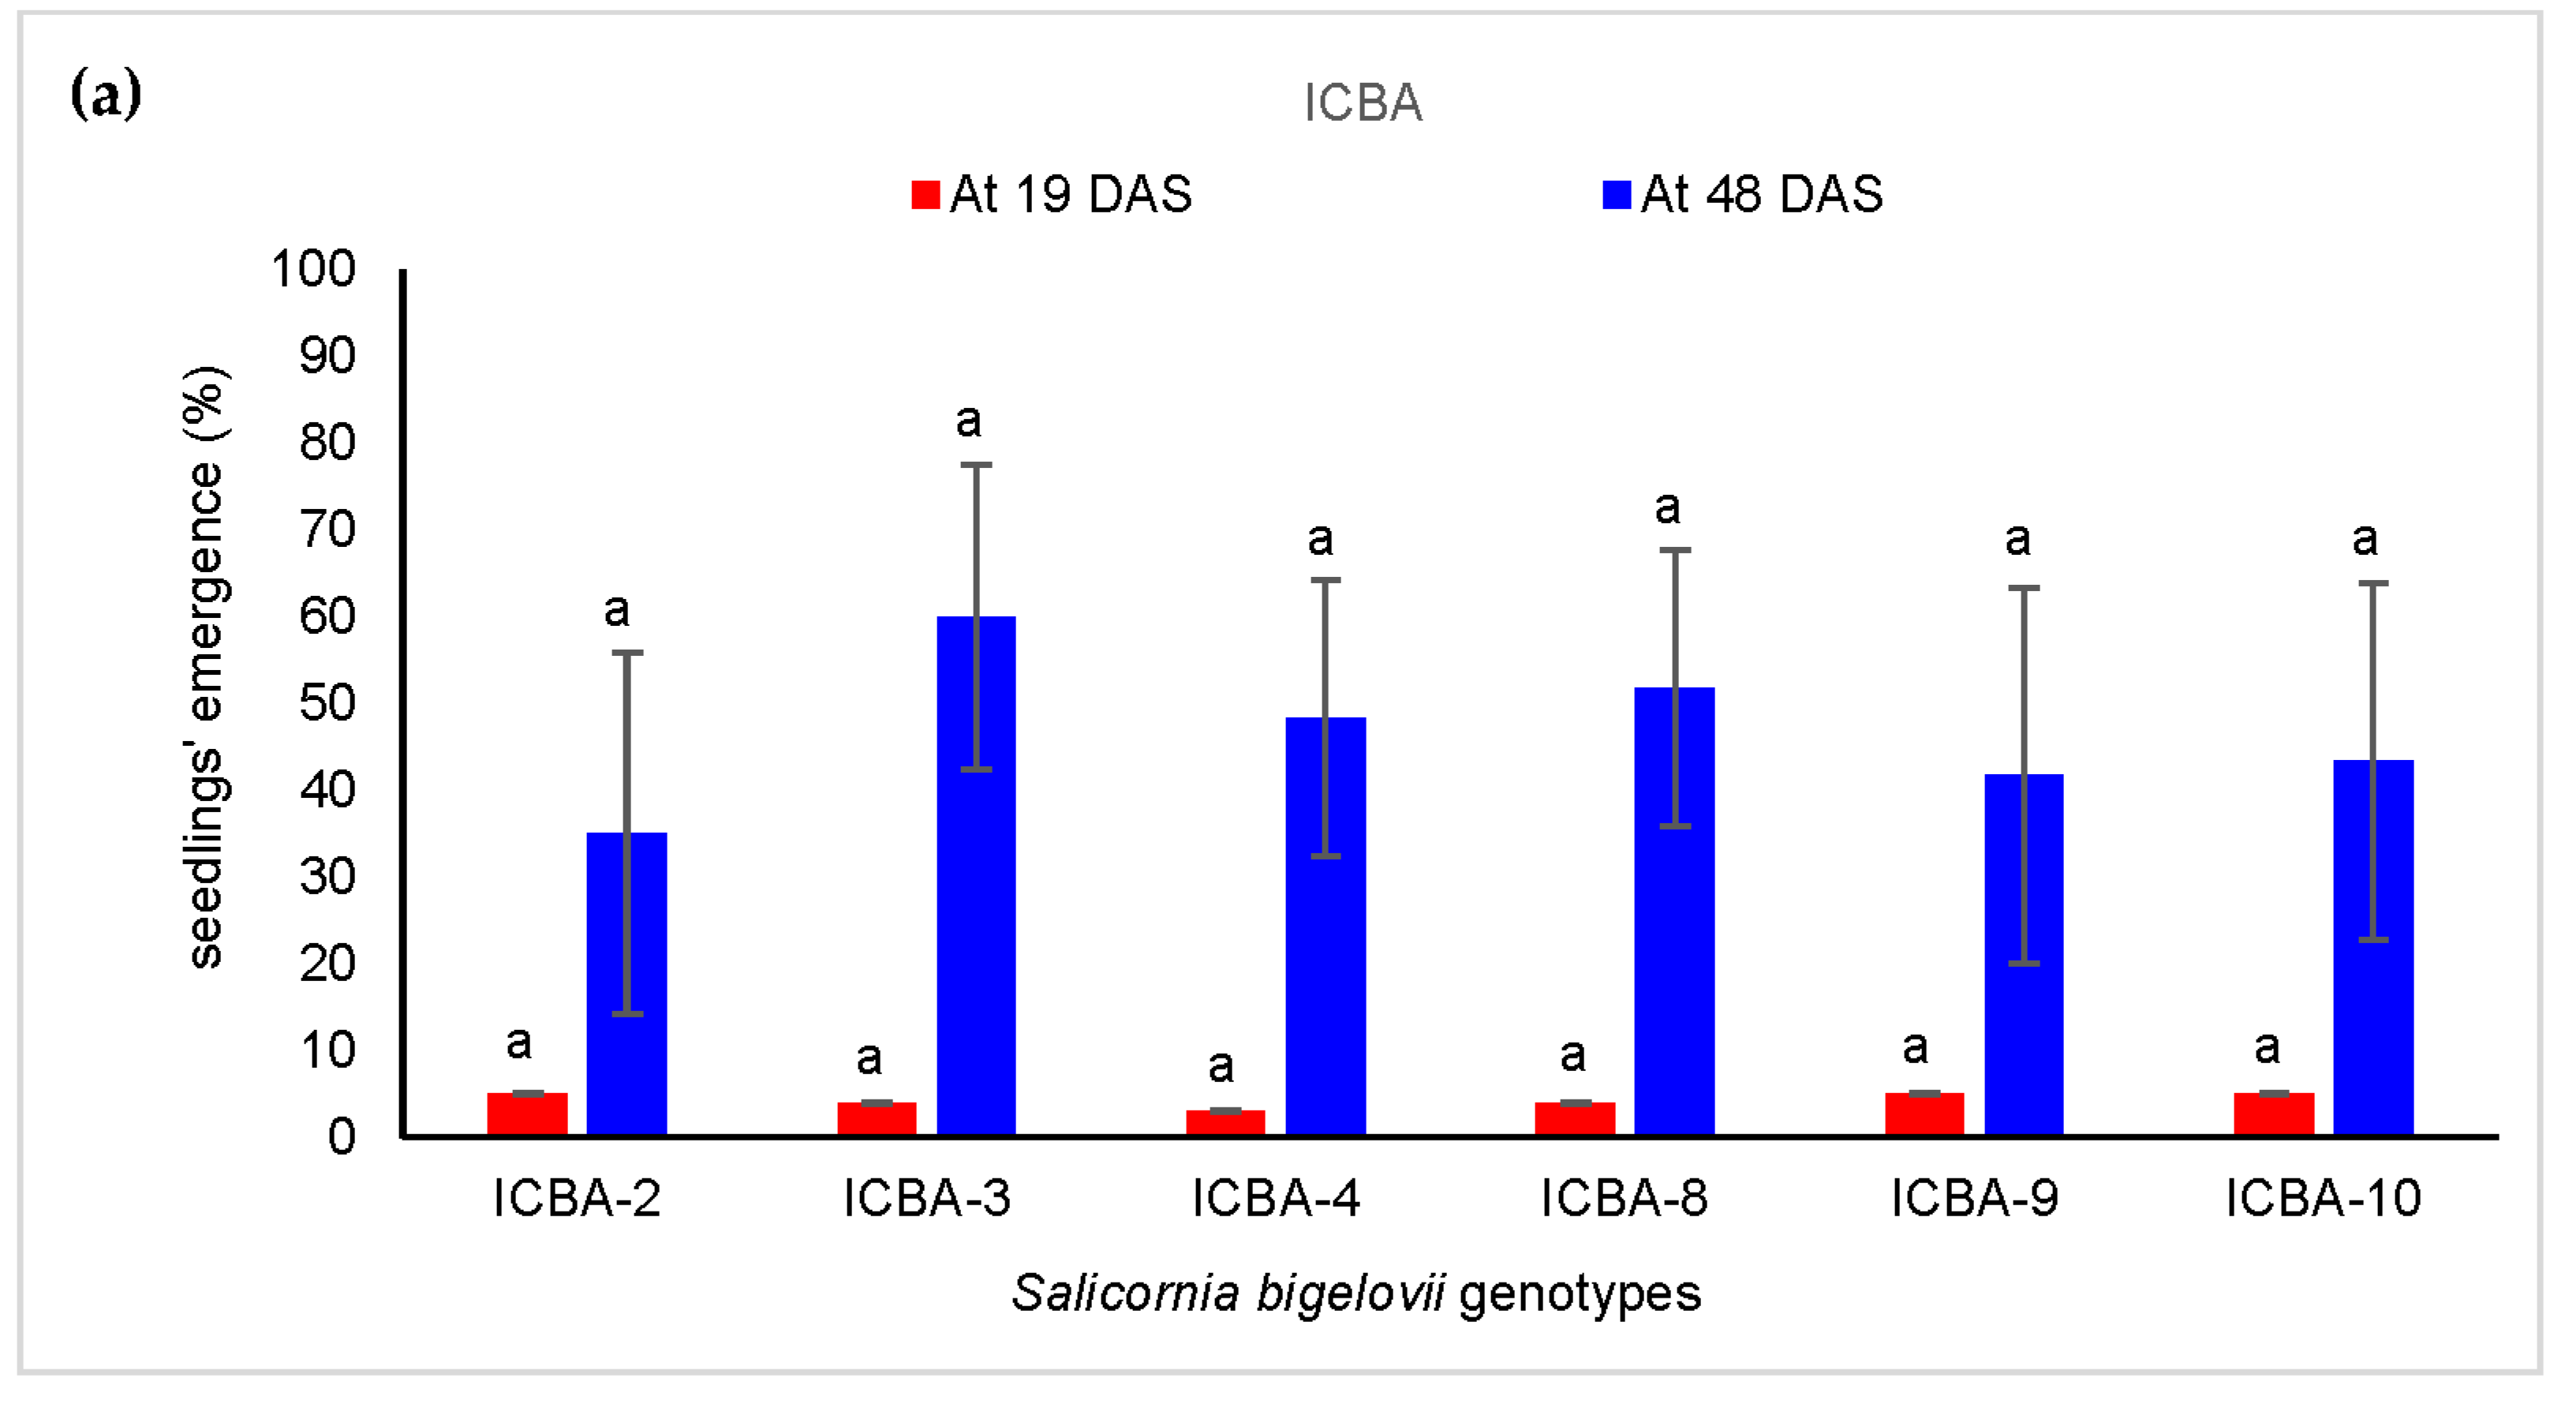
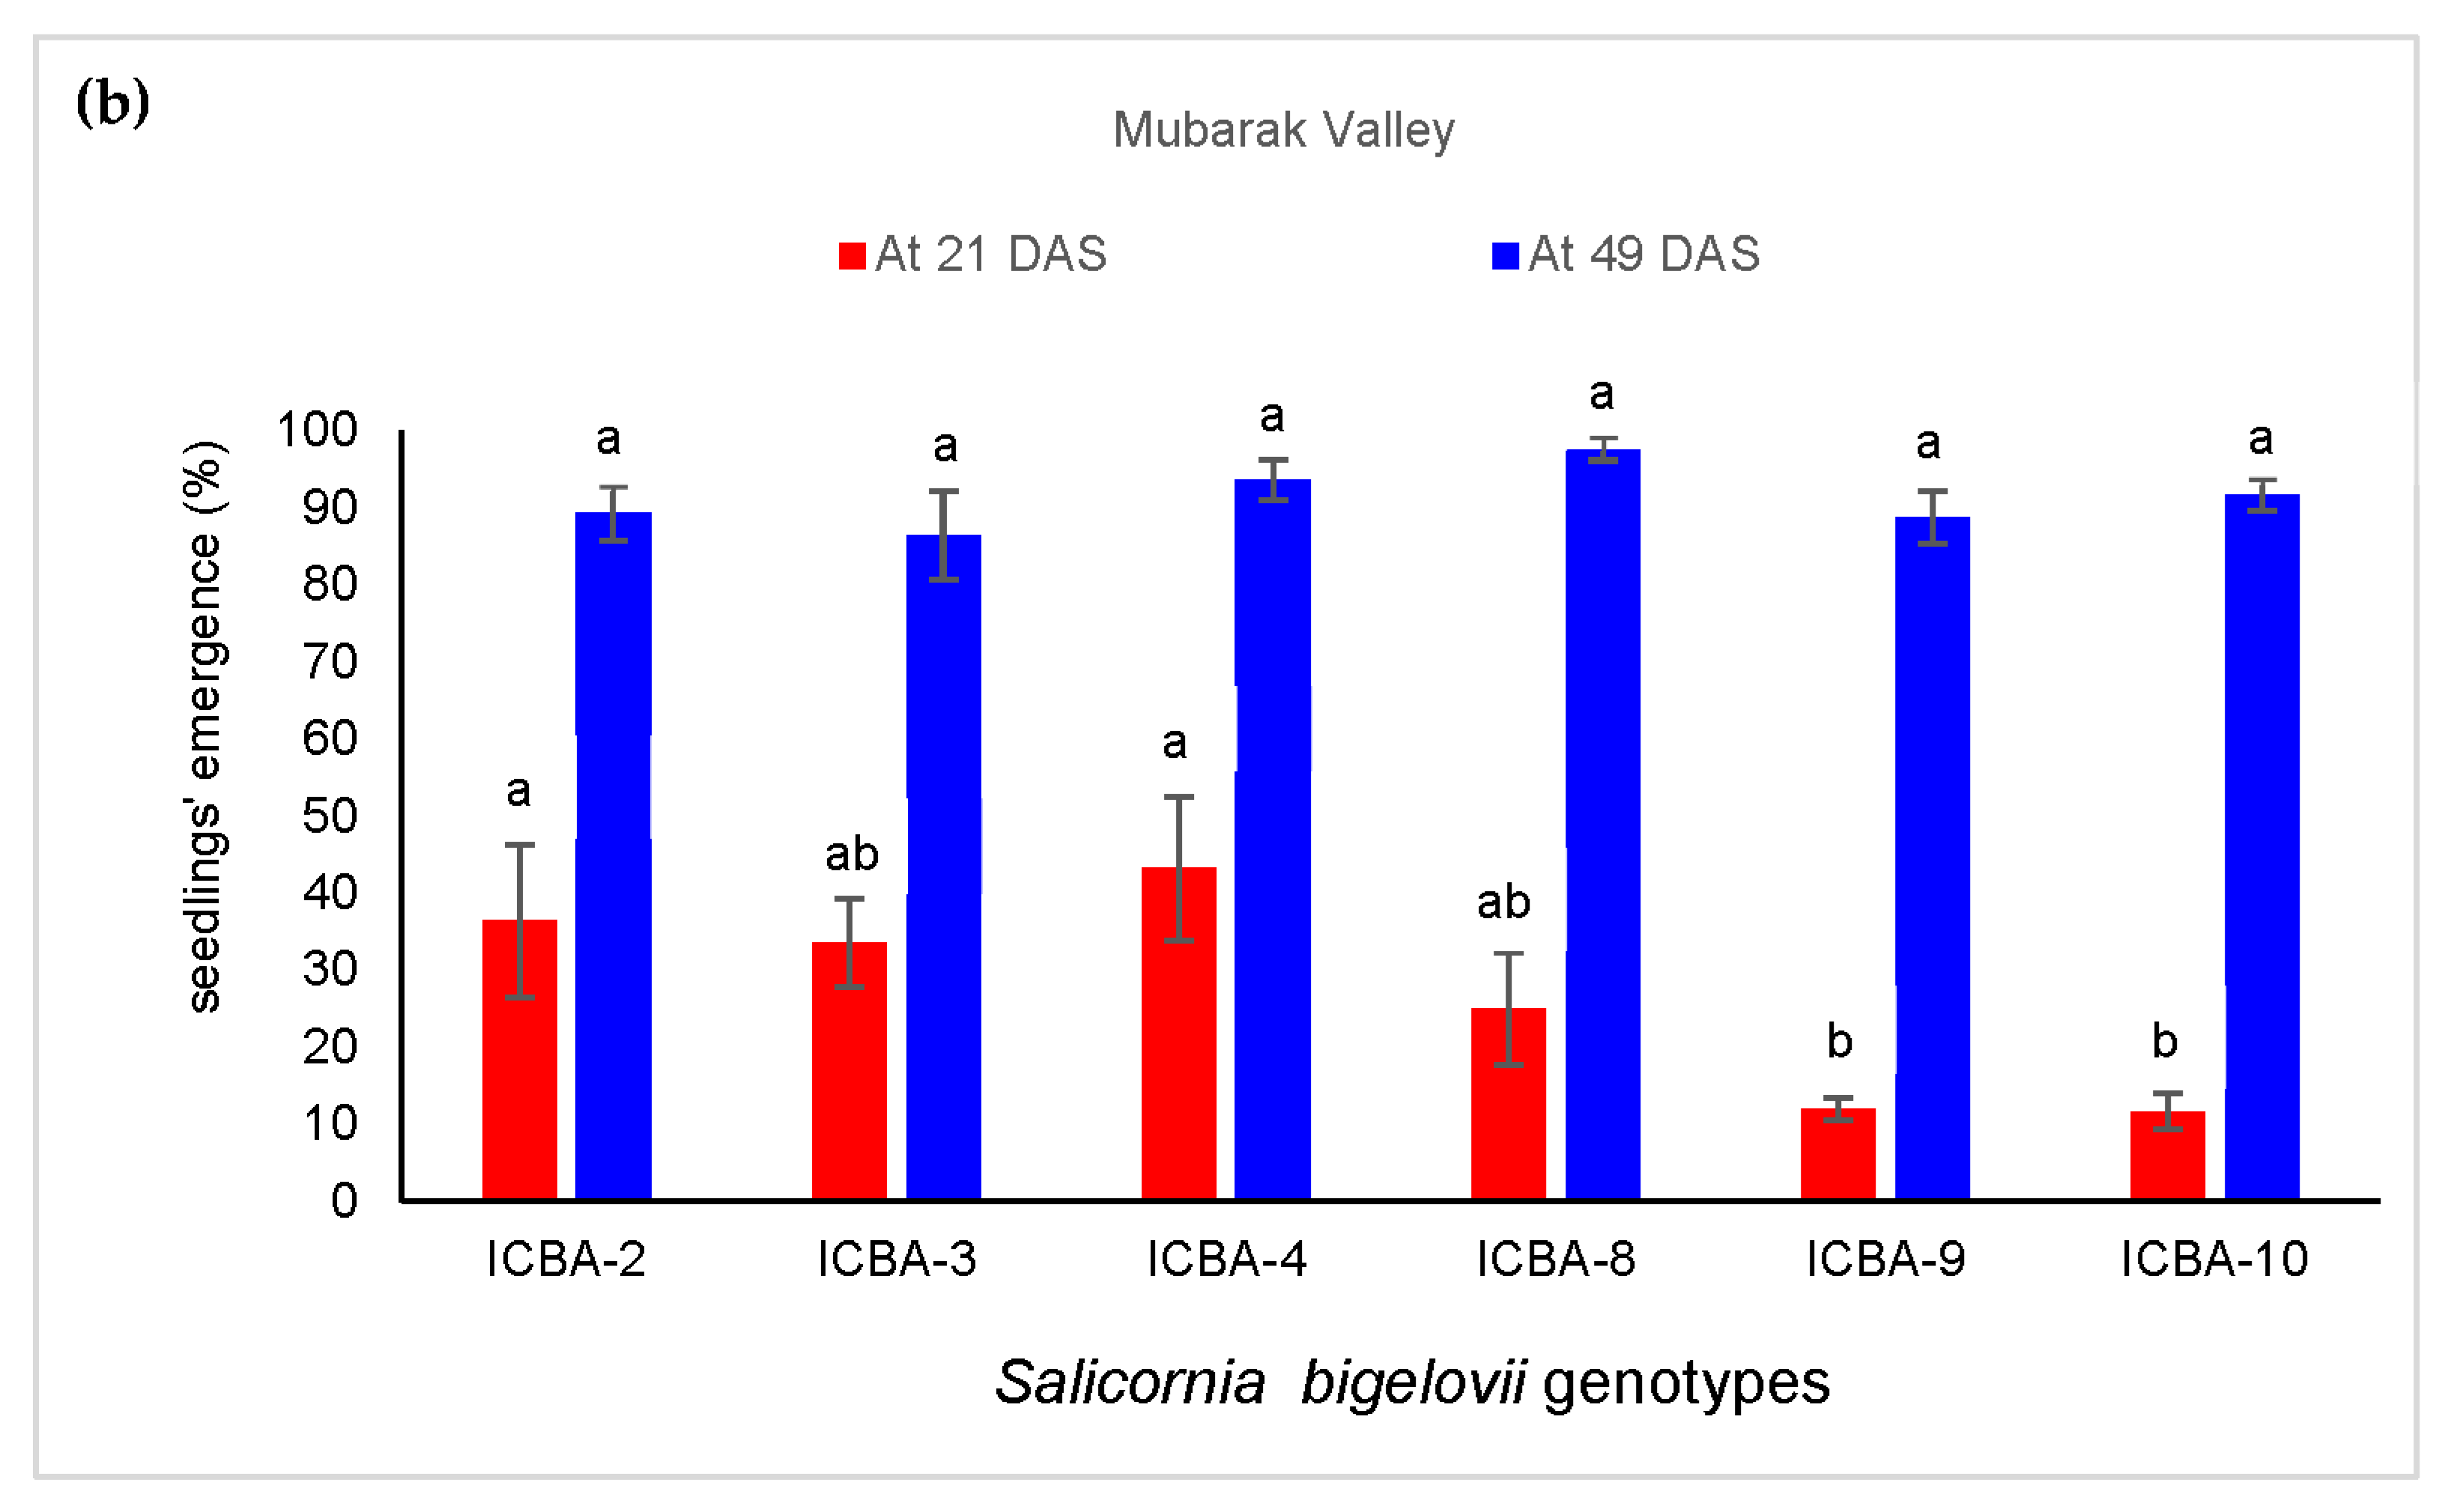
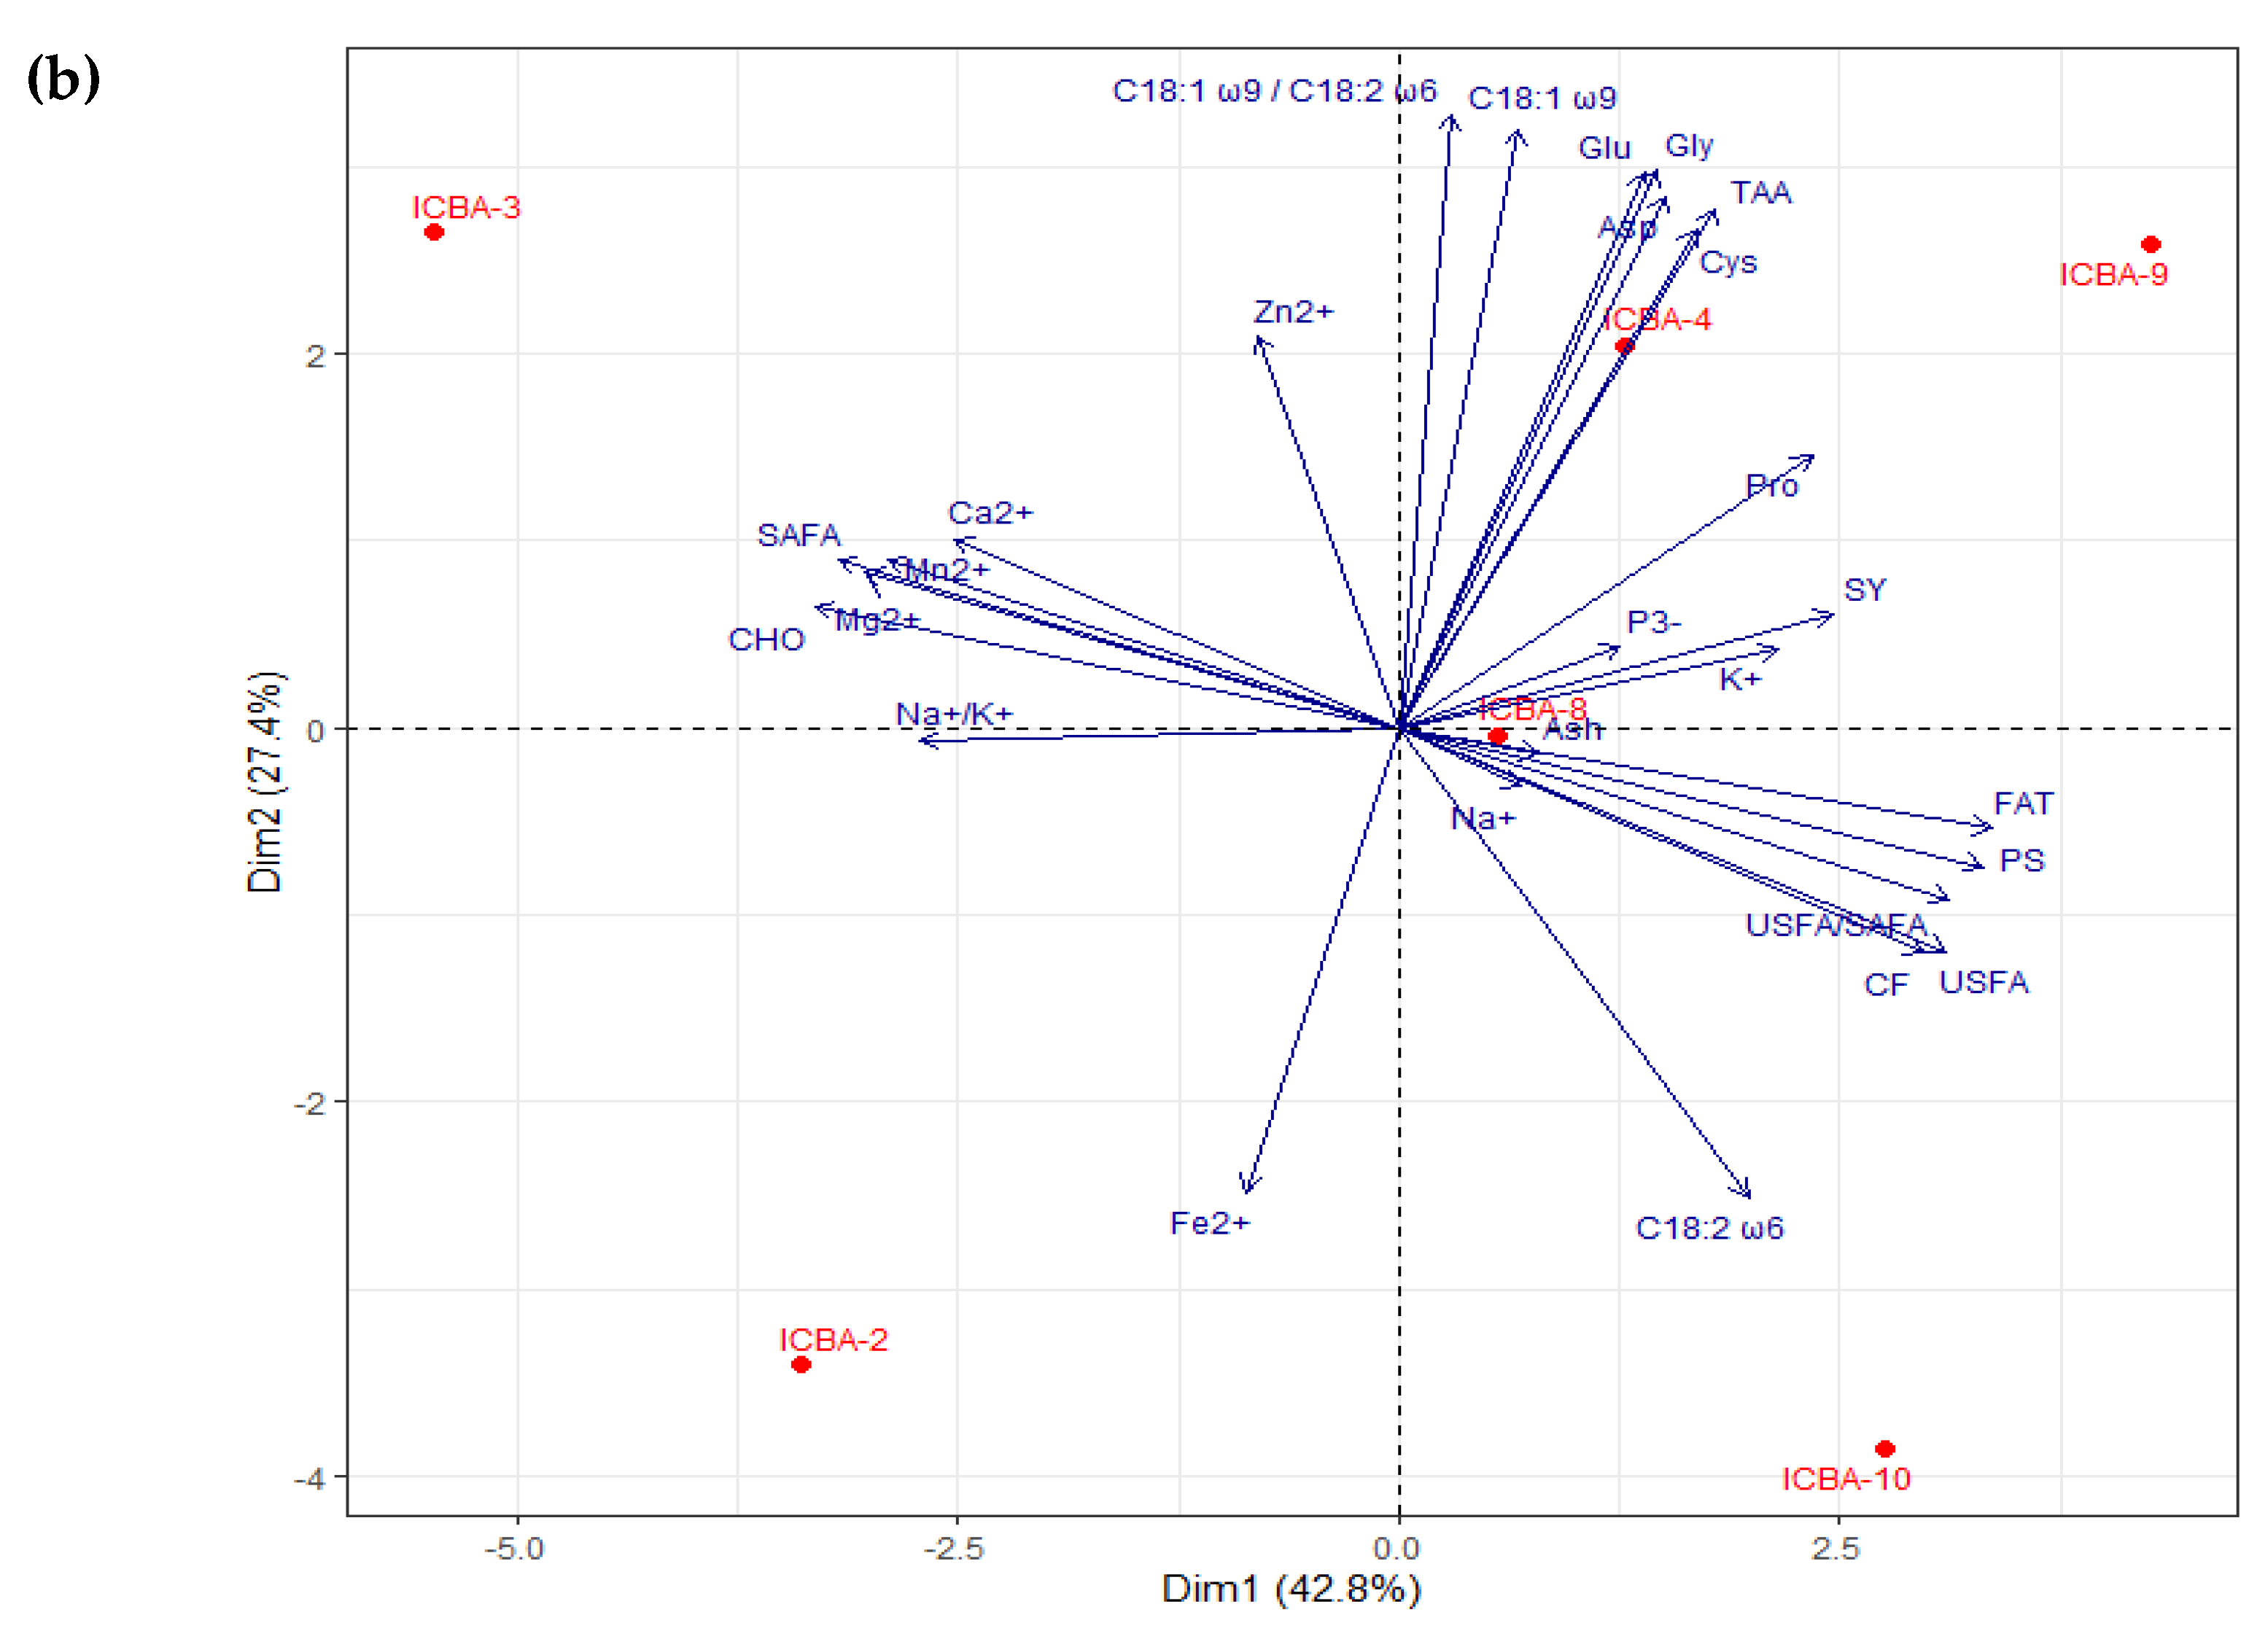
3.3.1. Seedlings’ Emergence
3.3.2. Growth and Yield Parameters
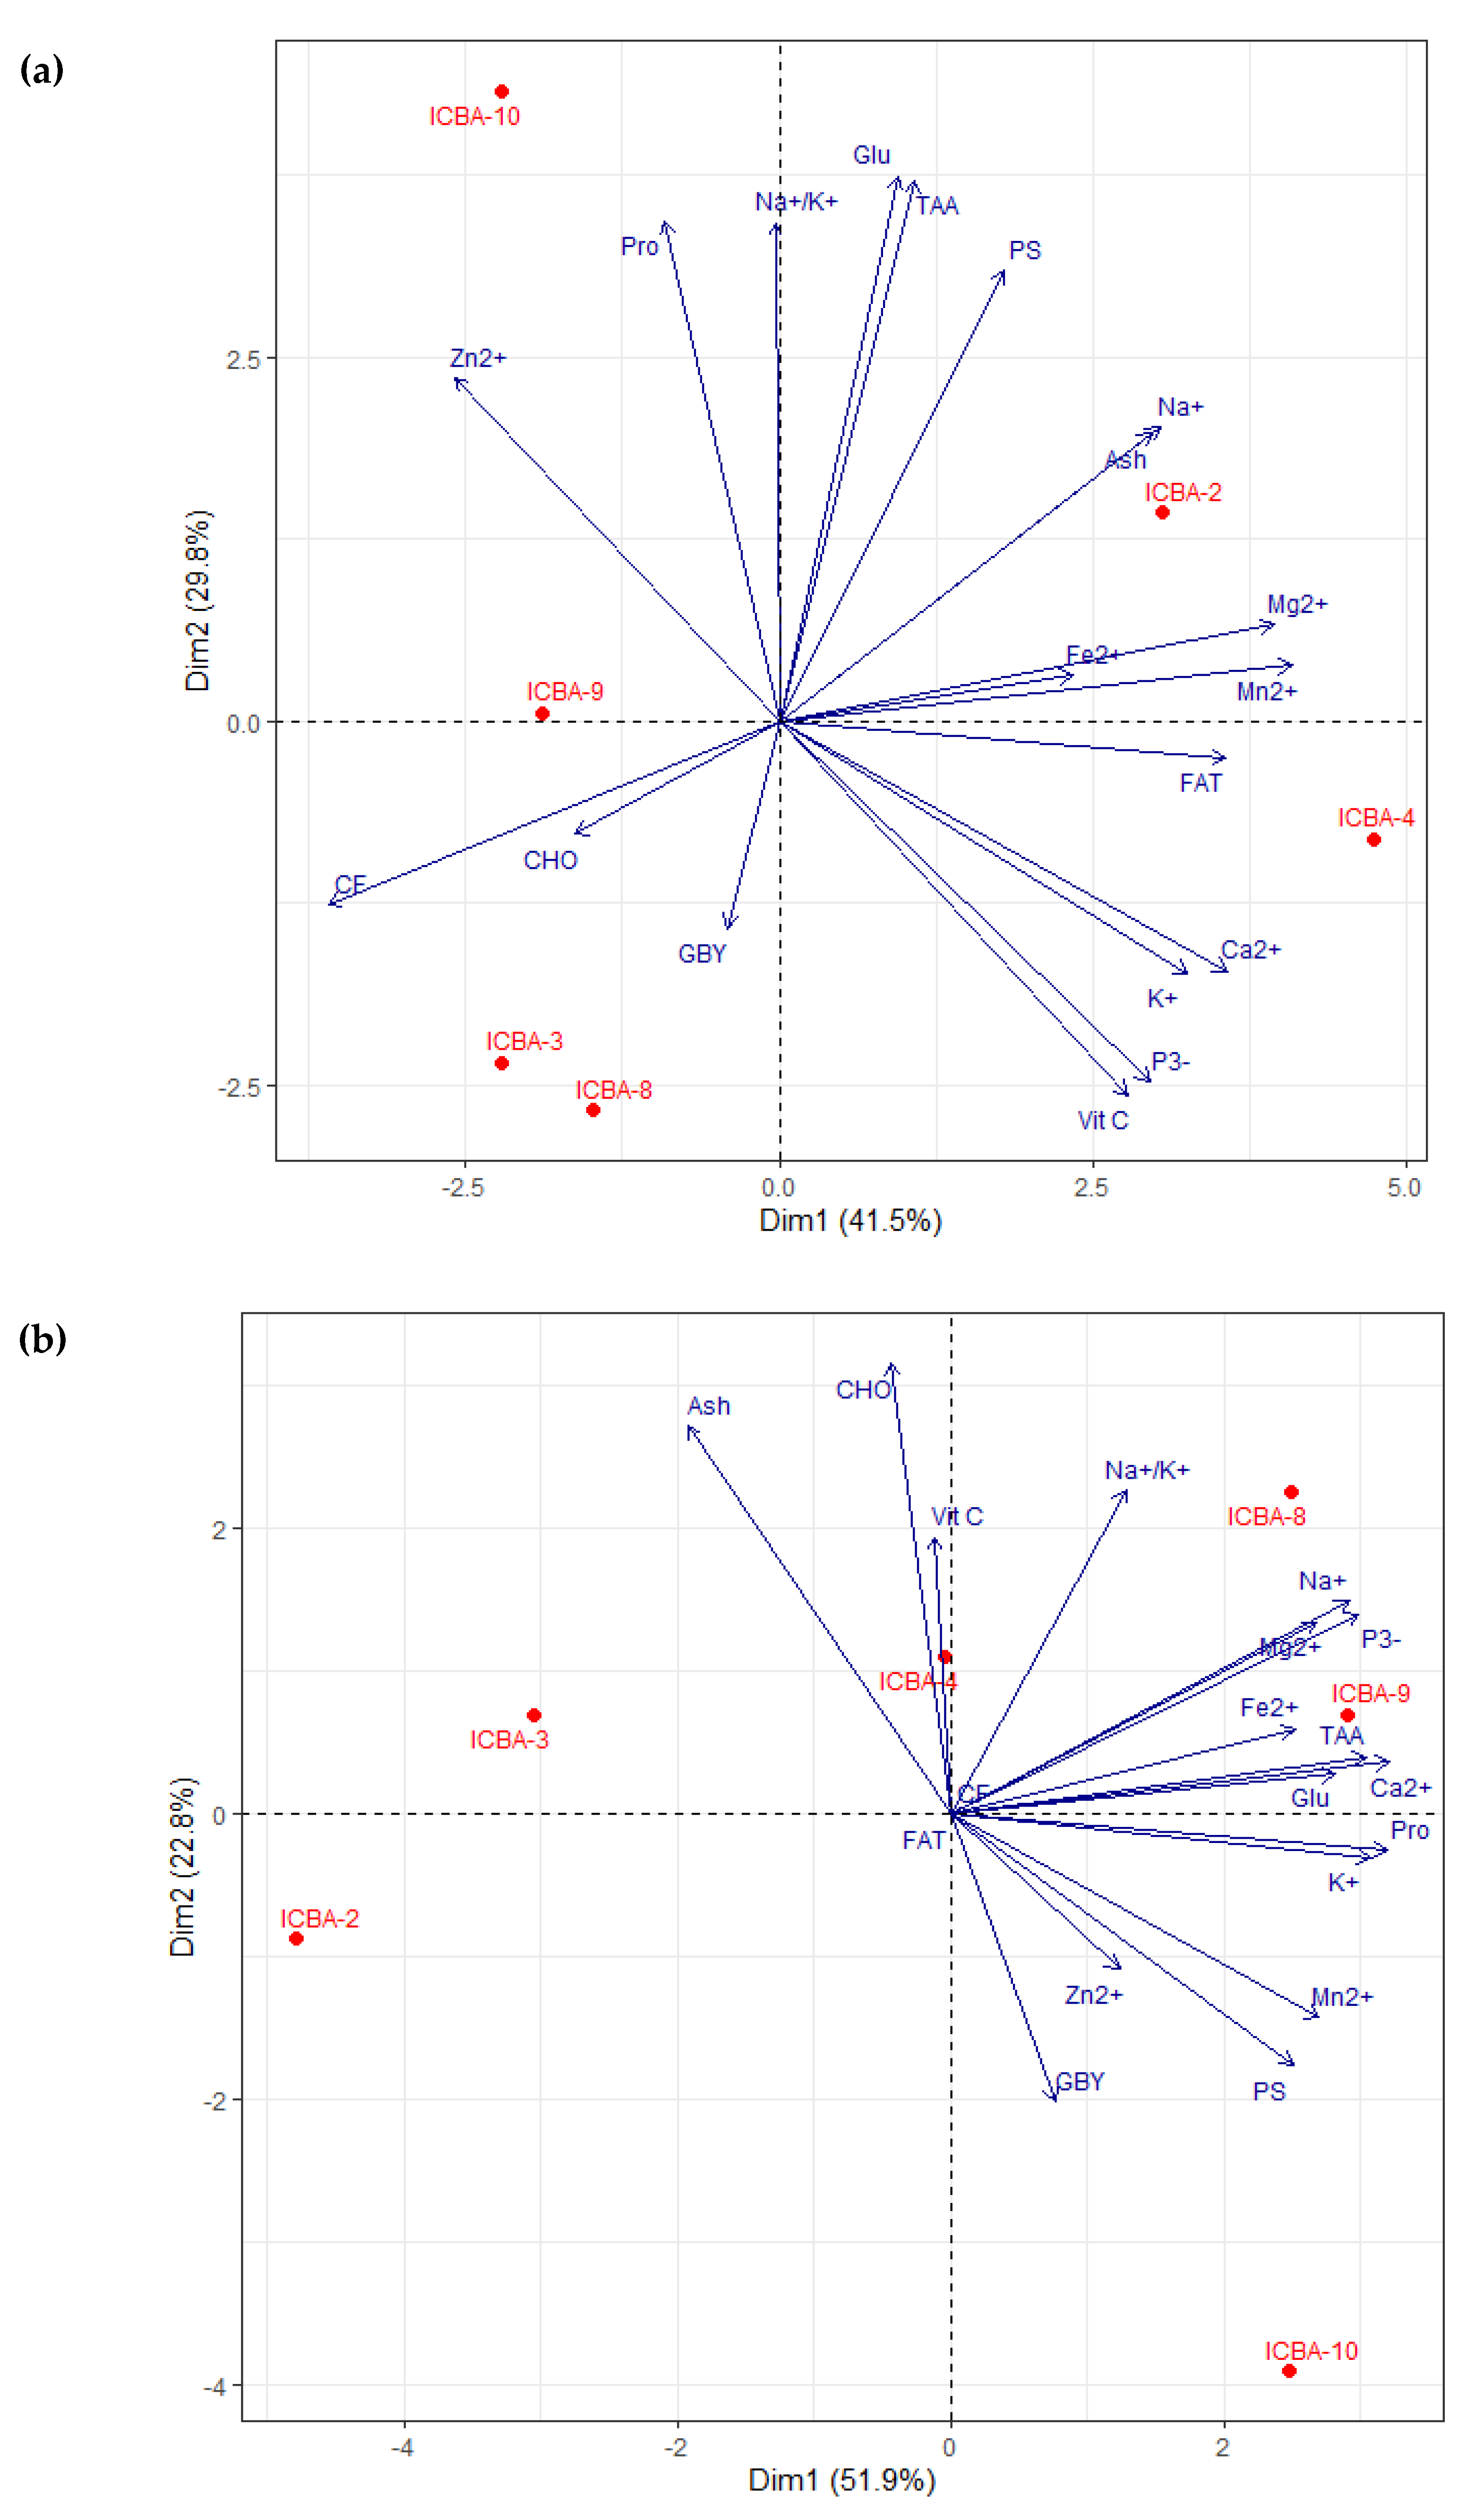
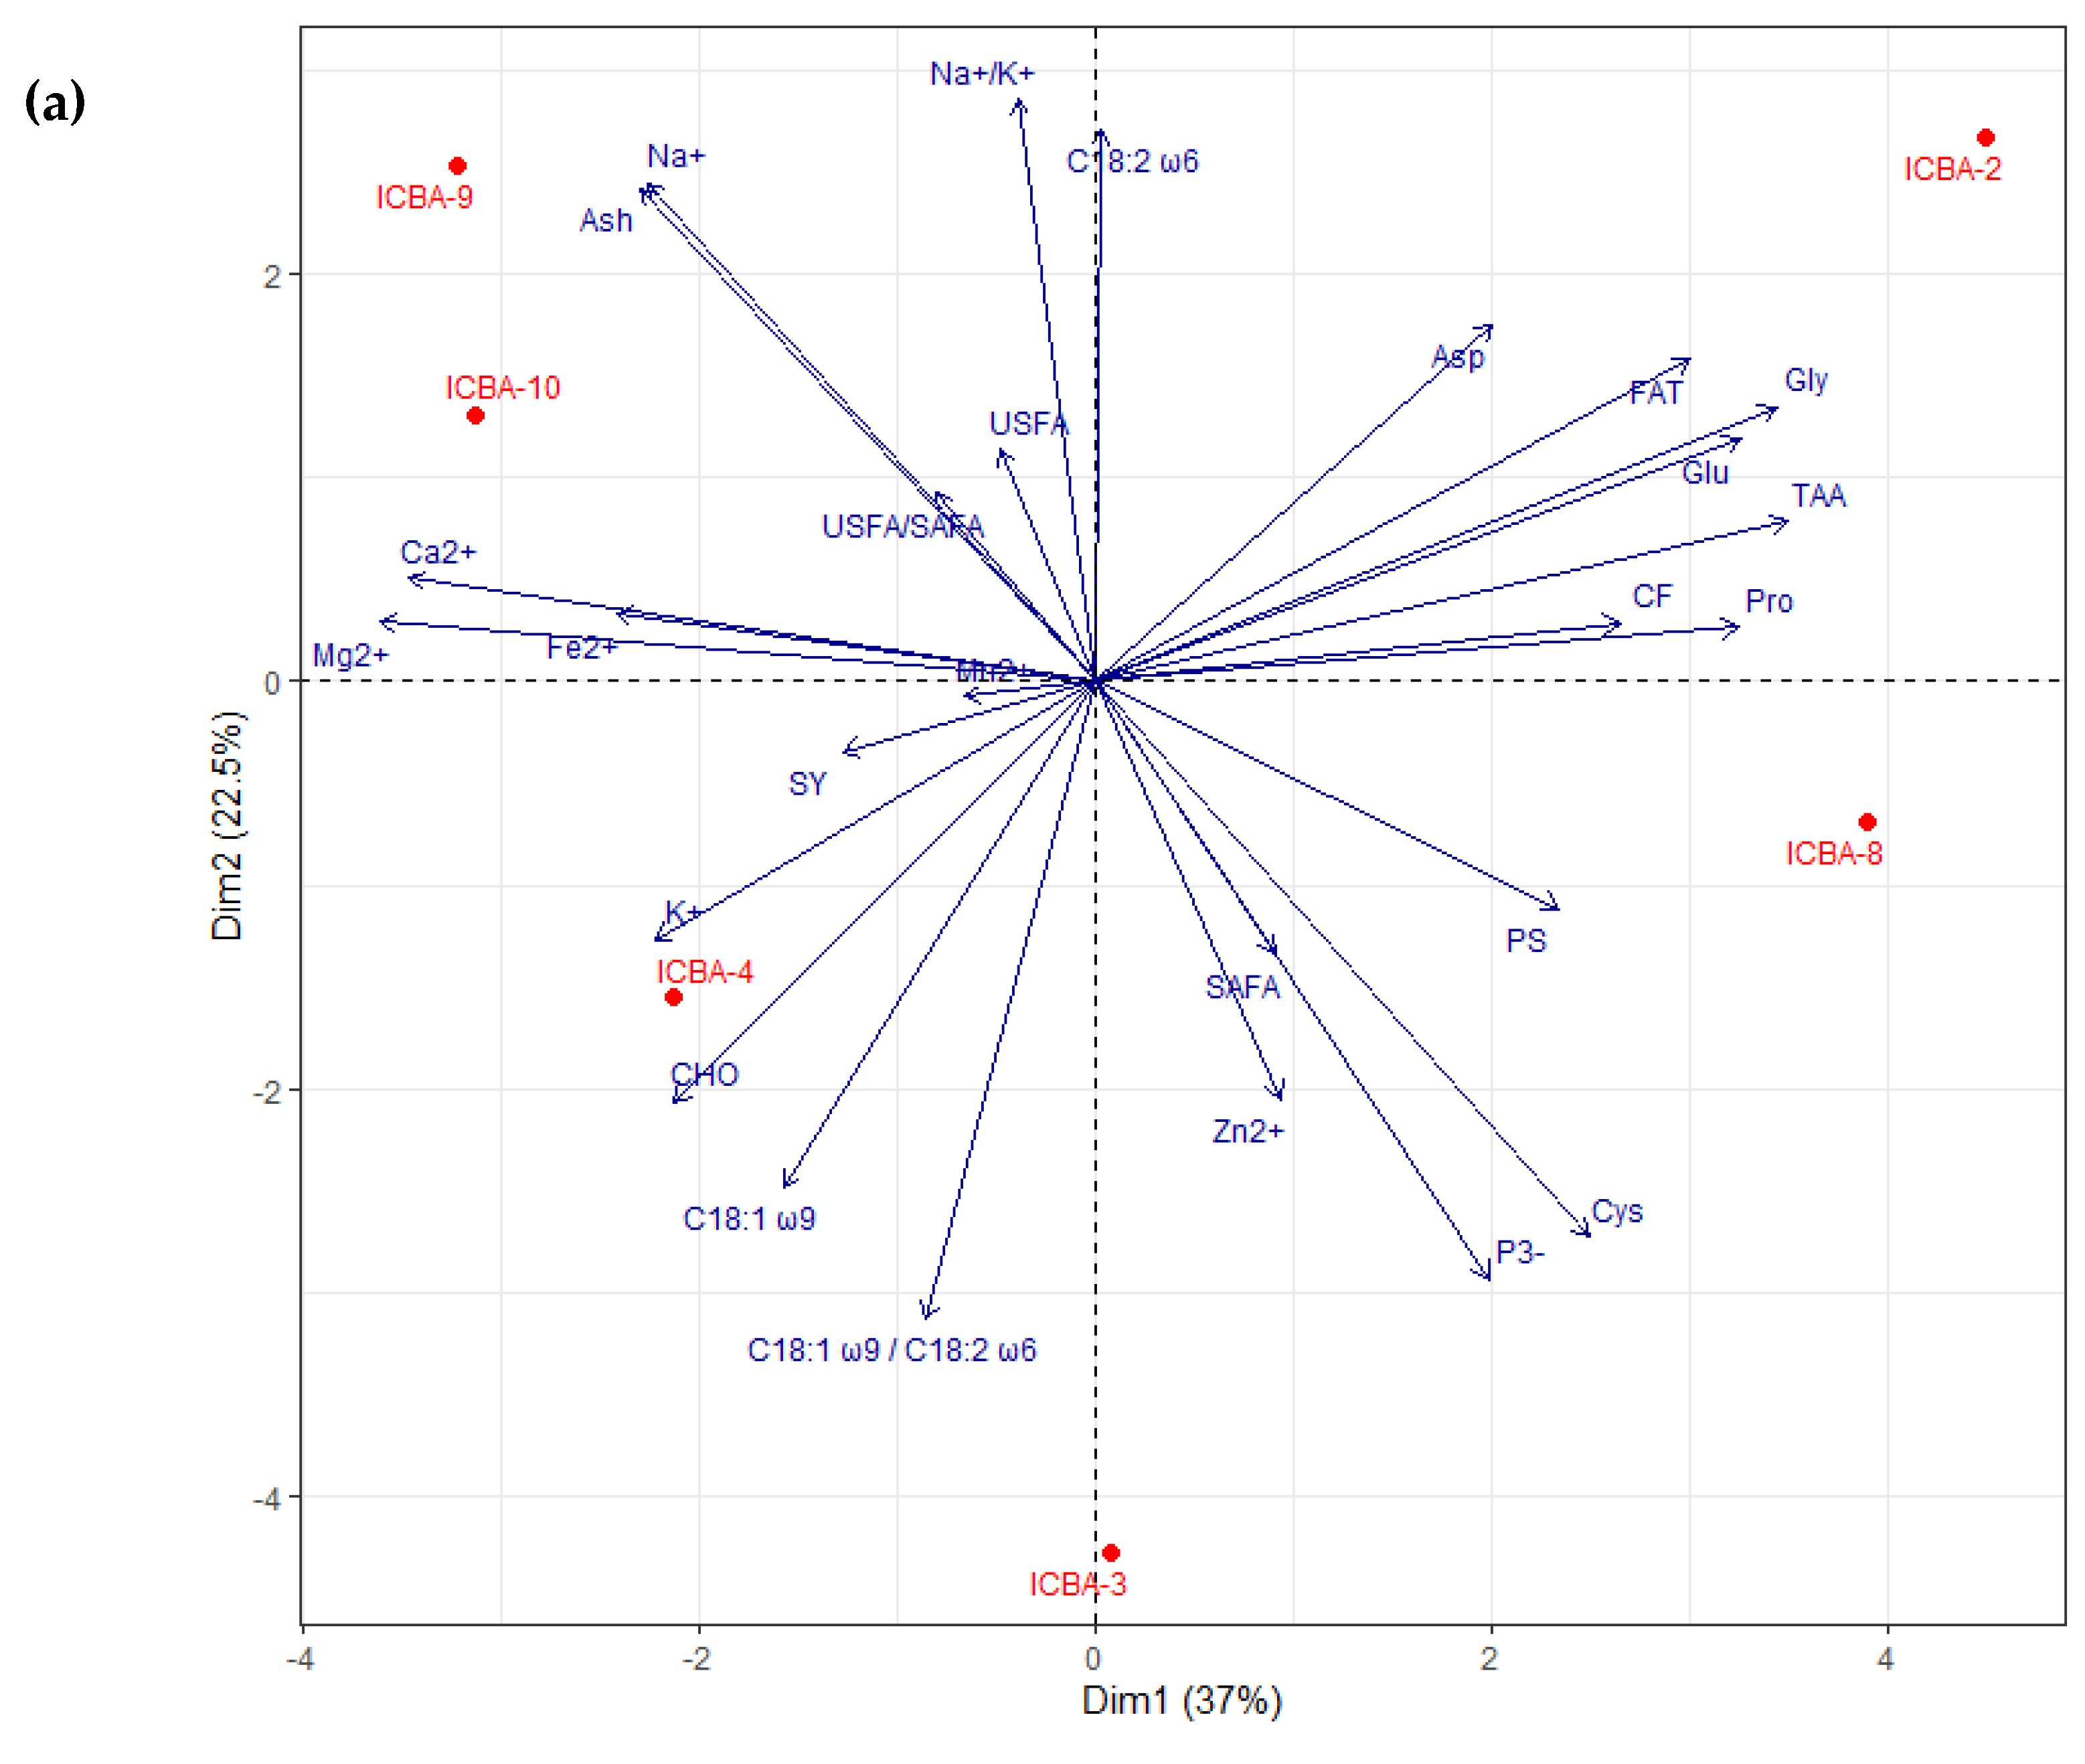
3.4. Evaluation of the Nutritional Composition of Shoots and Seeds through PCA
3.4.1. Nutritional Analysis of Shoots
3.4.2. Nutritional Analysis of Seeds
3.4.3. Fatty Acids Content in Shoots and Seeds
4. Discussion
4.1. Climatic Conditions
4.2. Water and Soil Analysis
4.3. S. bigelovii Seedlings’ Emergence
4.4. S. bigelovii Growth Parameters
4.5. Assessment of the Nutritional Profile of S. bigelovii Shoots
4.6. Assessment of the Nutritional Profile of S. bigelovii Seeds
4.7. Differences in S. bigelovii Genotypes in Terms of Performance and Nutritional Composition
5. Conclusions
Supplementary Materials
Author Contributions
Funding
Data Availability Statement
Acknowledgments
Conflicts of Interest
Appendix A


Appendix B

| Locations Salicornia bigelovii Genotypes Parameters | ICBA (ECw = 26 dSm−1) | Mubarak Valley (ECw = 6.6 dSm−1) | |||||||||||||
|---|---|---|---|---|---|---|---|---|---|---|---|---|---|---|---|
| ICBA-2 | ICBA-3 | ICBA-4 | ICBA-8 | ICBA-9 | ICBA-10 | Average | ICBA-2 | ICBA-3 | ICBA-4 | ICBA-8 | ICBA-9 | ICBA-10 | Average | ||
| Proximate composition (g/100g FW) | WC | 88.9 | 89.5 | 88.0 | 88.9 | 85.3 | 88.6 | 88.2 | 90.3 | 89.7 | 89.5 | 89.5 | 90.3 | 91.4 | 90.1 |
| FAT | 0.2 | 0.1 | 0.4 | 0.1 | 0.2 | 0.1 | 0.2 | 0.2 | 0.2 | 0.2 | 0.2 | 0.2 | 0.2 | 0.2 | |
| PS | 1.1 | 0.2 | 1.1 | 0.8 | 0.8 | 1.3 | 0.9 | 1.0 | 1.2 | 1.2 | 1.2 | 1.3 | 1.5 | 1.2 | |
| CF | 0.1 | 0.3 | 0.1 | 0.2 | 0.2 | 0.2 | 0.2 | 0.1 | 0.1 | 0.1 | 0.1 | 0.1 | 0.1 | 0.1 | |
| CHO | 4.8 | 5.4 | 4.9 | 5.7 | 9.1 | 4.7 | 5.8 | 4.4 | 4.6 | 4.9 | 4.9 | 4.4 | 3.8 | 4.5 | |
| Ash | 4.9 | 4.5 | 5.5 | 4.3 | 4.4 | 5.1 | 4.8 | 4.1 | 4.2 | 4.1 | 4.1 | 3.7 | 3.1 | 3.9 | |
| Micronutrients (mg/100g FW) | Na+ | 1668.9 | 1515.1 | 1693.6 | 1331.9 | 1425.2 | 1593.1 | 1538.0 | 2774 | 3254 | 3370 | 3937 | 3870 | 3371 | 3429.3 |
| K+ | 285.4 | 275.6 | 318.6 | 293.1 | 254.9 | 262.7 | 281.7 | 144.0 | 146.7 | 171.4 | 170.3 | 167.4 | 175.1 | 162.5 | |
| Na+/K+ | 5.8 | 5.5 | 5.3 | 4.5 | 5.6 | 6.1 | 5.5 | 19.3 | 22.2 | 19.7 | 23.1 | 23.1 | 19.3 | 21.1 | |
| Ca2+ | 163.3 | 157.8 | 178.0 | 155.6 | 158.4 | 144.9 | 159.7 | 83.3 | 98.1 | 99.6 | 117.4 | 115.4 | 112.2 | 104.3 | |
| Mg2+ | 118.9 | 91.7 | 120.1 | 97.7 | 103.5 | 97.3 | 104.9 | 71.5 | 71.5 | 75.8 | 88.0 | 91.4 | 76.4 | 79.1 | |
| Fe2+ | 1.8 | 1.3 | 1.4 | 1.3 | 1.5 | 1.2 | 1.4 | 1.3 | 1.8 | 1.6 | 2.0 | 2.7 | 1.9 | 1.9 | |
| Mn2+ | 0.3 | 0.2 | 0.3 | 0.2 | 0.2 | 0.2 | 0.2 | 0.2 | 0.2 | 0.3 | 0.4 | 0.3 | 0.5 | 0.3 | |
| Zn2+ | 0.7 | 0.7 | 0.7 | 0.9 | 0.9 | 1.1 | 0.8 | 0.2 | 0.1 | 0.1 | 0.2 | 0.2 | 0.2 | 0.2 | |
| P3- | 32.1 | 31.55 | 37.6 | 33.5 | 24.9 | 24.8 | 30.7 | 11.5 | 12.9 | 14.2 | 15.9 | 14.8 | 13.9 | 13.9 | |
| Vit C | 22.5 | 15 | 25 | 25 | 15 | 7.5 | 18.3 | 0.8 | 0.2 | 0.5 | 0.8 | 0.7 | 0.1 | 0.5 | |
| Vit B1 | ND | ND | ND | ND | ND | ND | 0.05 | 0.03 | 0.05 | 0.06 | 0.04 | 0.03 | 0.04 | ||
| Vit B2 | ND | 0.03 | 0.03 | 0.05 | ND | ND | 0.04 | 0.04 | 0.04 | 0.04 | 0.04 | 0.05 | 0.04 | ||
| Locations Salicornia bigelovii Genotypes Amino Acids (mg/100g FW) | ICBA (ECw = 26 dSm−1) | Mubarak Valley (ECw = 6.6 dSm−1) | |||||||||||||
|---|---|---|---|---|---|---|---|---|---|---|---|---|---|---|---|
| ICBA2 | ICBA3 | ICBA4 | ICBA8 | ICBA9 | ICBA10 | Average | ICBA2 | ICBA3 | ICBA4 | ICBA8 | ICBA9 | ICBA10 | Average | ||
| Essential Amino acids | His | 32.5 | 17.0 | 23.1 | 33.1 | 17.7 | 58.5 | 30.3 | 26 | 25 | 28 | 38 | 32 | 26 | 29.2 |
| Ile | 82.0 | ND | 51.5 | 14.1 | 33.0 | ND | 45.2 | 35 | 36 | 42 | 41 | 40 | 42 | 39.3 | |
| Leu | 107.0 | 49.2 | 79.9 | 55.1 | 66.0 | 84.0 | 73.5 | 59 | 61 | 72 | 71 | 70 | 71 | 67.3 | |
| Lys | 99.5 | 56.4 | 96.9 | 76.7 | 64.3 | 195.5 | 98.2 | 38 | 39 | 46 | 47 | 46 | 47 | 43.8 | |
| Met | 10.0 | 10.0 | 10.0 | 10.0 | 10.0 | 30.0 | 13.3 | 10 | 10 | 13 | 15 | 14 | 15 | 12.8 | |
| Phe | 87.0 | 40.2 | 52.5 | 24.2 | 40.8 | 25.8 | 45.1 | 39 | 41 | 48 | 47 | 48 | 47 | 45.0 | |
| Thr | 30.0 | 40.0 | 40.0 | 80.0 | 70.0 | 120.0 | 63.3 | 30 | 33 | 42 | 39 | 40 | 38 | 37.0 | |
| Val | 112.0 | 56.3 | 45.7 | 33.5 | 65.1 | 126.0 | 73.1 | 40 | 41 | 49 | 47 | 46 | 47 | 45.0 | |
| Non-Essential Amino acids | Ala | 60.0 | 40.0 | 100.0 | 130.0 | ND | 80.0 | 82.0 | 40 | 41 | 48 | 48 | 46 | 47 | 45.0 |
| Arg | 30.9 | 30.0 | 72.2 | 62.7 | 43.5 | 72.0 | 51.9 | 41 | 42 | 50 | 50 | 48 | 47 | 46.3 | |
| Asp | ND | ND | ND | ND | ND | ND | 70 | 69 | 85 | 84 | 81 | 83 | 78.7 | ||
| Cys | ND | ND | ND | ND | ND | ND | 12 | 8 | 8 | 14 | 9 | 15 | 11.0 | ||
| Ser | 50.0 | 30.0 | 40.0 | 100.0 | 20.0 | 50.0 | 48.3 | 25 | 31 | 41 | 37 | 40 | 35 | 34.8 | |
| Glu | 240.0 | 66.0 | 114.0 | 51.9 | 156.0 | 219.0 | 141.2 | 91 | 96 | 120 | 113 | 112 | 114 | 107.7 | |
| Gly | 40.0 | 20.0 | 40.0 | ND | 10.0 | 90.0 | 40.0 | 39 | 40 | 47 | 47 | 46 | 46 | 44.2 | |
| Pro | 47.0 | 31.2 | 37.4 | 43.3 | 29.7 | 98.5 | 47.8 | 33 | 33 | 38 | 38 | 39 | 39 | 36.7 | |
| Tyr | 89.0 | 35.1 | 51.8 | 15.8 | 58.0 | 19.6 | 44.9 | 6 | 5 | 6 | 5 | 5 | 6 | 5.5 | |
| TAA | 1116.9 | 521.4 | 854.8 | 730.3 | 684.0 | 1268.9 | 862.7 | 634 | 651 | 783 | 781 | 762 | 765 | 729.3 | |
| Locations Salicornia bigelovii Genotypes Parameters | ICBA (ECw = 26 dSm−1) | Mubarak Valley (ECw = 6.6 dSm−1) | |||||||||||||
|---|---|---|---|---|---|---|---|---|---|---|---|---|---|---|---|
| ICBA2 | ICBA3 | ICBA4 | ICBA8 | ICBA9 | ICBA10 | Average | ICBA2 | ICBA3 | ICBA4 | ICBA8 | ICBA9 | ICBA10 | Average | ||
| Proximate composition (g/100g) | WC | 3.7 | 2.8 | 3.5 | 3.2 | 3.6 | 3.3 | 3.4 | 4.1 | 4.6 | 4.3 | 4.2 | 3.8 | 3.5 | 4.1 |
| FAT | 20.9 | 18.2 | 19.0 | 19.5 | 18.6 | 18.1 | 19.1 | 18.7 | 17.9 | 20.4 | 20.7 | 21.1 | 21.5 | 20.1 | |
| PS | 18.8 | 18.2 | 18.2 | 18.8 | 15.9 | 18.4 | 18.1 | 20.0 | 18.5 | 22.5 | 23.5 | 25.5 | 26.5 | 22.8 | |
| CF | 8.2 | 7.3 | 7.5 | 9.7 | 7.2 | 7.9 | 8.0 | 9.1 | 8.3 | 9.5 | 9.9 | 9.6 | 9.9 | 9.4 | |
| CHO | 43.7 | 50.5 | 47.2 | 46.6 | 49.5 | 46.7 | 47.4 | 42.3 | 44.5 | 37.0 | 35.5 | 34.1 | 32.1 | 37.6 | |
| Ash | 4.7 | 3.0 | 4.6 | 2.2 | 5.2 | 5.6 | 4.2 | 5.8 | 6.2 | 6.4 | 6.2 | 5.9 | 6.5 | 6.2 | |
| Micronutrients (mg/100g) | Na+ | 1820 | 1124 | 1760 | 820 | 2004 | 2192 | 1620.0 | 1367 | 1421 | 1450 | 1415 | 1375 | 1467 | 1415.8 |
| K+ | 748.0 | 1026.1 | 1290.7 | 1155.5 | 1024.9 | 1273.5 | 1086.5 | 954 | 1123 | 1259 | 1210 | 1153 | 1305 | 1167.3 | |
| Na+/K+ | 2.4 | 1.1 | 1.4 | 0.7 | 2.0 | 1.7 | 1.6 | 1.4 | 1.3 | 1.2 | 1.2 | 1.2 | 1.1 | 1.2 | |
| Ca2+ | 311.9 | 446.7 | 459.7 | 368.1 | 569.3 | 622.1 | 463.0 | 259.8 | 739.1 | 239.6 | 222.3 | 206.5 | 315.0 | 330.4 | |
| Mg2+ | 365.9 | 424.1 | 476.4 | 384.5 | 481.5 | 521.9 | 442.4 | 543.5 | 624.7 | 548.3 | 550.7 | 488.2 | 523.2 | 546.4 | |
| Fe2+ | 9.1 | 12.7 | 9.1 | 10.2 | 13.4 | 15.5 | 11.7 | 15.7 | 10.7 | 7.8 | 18.8 | 6.1 | 15.3 | 12.4 | |
| Mn2+ | 3.0 | 3.0 | 3.3 | 3.3 | 3.2 | 3.1 | 3.1 | 9.6 | 14.6 | 9.2 | 9.8 | 7.8 | 9.3 | 10.1 | |
| Zn2+ | 7.0 | 7.3 | 8.4 | 8.0 | 5.6 | 7.4 | 7.3 | 10.0 | 11.2 | 12.6 | 10.4 | 9.9 | 9.5 | 10.6 | |
| P3- | 449.6 | 477.5 | 466.4 | 467.0 | 399.2 | 423.7 | 447.2 | 245 | 365 | 340 | 380 | 335 | 410 | 345.8 | |
| Vit C | 50 | 50 | 50 | 50 | 50 | 50 | 50 | ND | ND | ND | ND | ND | ND | ||
| Vit B1 | 0.6 | 0.5 | 0.9 | 0.6 | 0.8 | 0.7 | 0.7 | ND | ND | ND | ND | ND | ND | ||
| Vit B2 | 0.4 | 0.2 | 0.2 | 0.2 | 0.3 | 0.3 | 0.3 | 0.7 | 0.4 | 1.0 | ND | ND | ND | ||
| Locations Salicornia bigelovii Genotypes Amino Acids (mg/100g) | ICBA (ECw = 26 dSm−1) | Mubarak Valley (ECw = 6.6 dSm−1) | |||||||||||||
|---|---|---|---|---|---|---|---|---|---|---|---|---|---|---|---|
| ICBA2 | ICBA3 | ICBA4 | ICBA8 | ICBA9 | ICBA10 | Average | ICBA2 | ICBA3 | ICBA4 | ICBA8 | ICBA9 | ICBA10 | Average | ||
| Essential Amino acids | His | 350 | 270 | 270 | 320 | 220 | 270 | 283.3 | 290 | 382 | 390 | 308 | 510 | 242 | 353.7 |
| Ile | 440 | 390 | 380 | 420 | 350 | 400 | 396.7 | 187 | 237 | 267 | 227 | 322 | 205 | 240.8 | |
| Leu | 880 | 730 | 750 | 850 | 680 | 750 | 773.3 | 457 | 591 | 668 | 586 | 884 | 457 | 607.2 | |
| Lys | 490 | 500 | 440 | 520 | 520 | 500 | 495.0 | 490 | 591 | 593 | 514 | 850 | 405 | 573.8 | |
| Met | 130 | 110 | 90 | 120 | 70 | 80 | 100.0 | 109 | 141 | 174 | 150 | 247 | 96 | 152.8 | |
| Phe | 690 | 490 | 510 | 630 | 400 | 520 | 540.0 | 44 | 112 | 77 | 123 | 303 | 114 | 128.8 | |
| Thr | 450 | 380 | 380 | 430 | 350 | 390 | 396.7 | 186 | 251 | 255 | 241 | 358 | 181 | 245.3 | |
| Val | 530 | 460 | 460 | 510 | 440 | 490 | 481.7 | 228 | 280 | 332 | 275 | 400 | 222 | 289.5 | |
| Non-Essential Amino acids | Ala | 490 | 430 | 400 | 490 | 440 | 460 | 451.7 | 561 | 1060 | 797 | 930 | 1147 | 567 | 843.7 |
| Arg | 340 | 290 | 290 | 320 | 200 | 300 | 290.0 | 777 | 141 | 1656 | 124 | 1936 | 786 | 903.3 | |
| Asp | 1020 | 940 | 820 | 1050 | 1000 | 970 | 966.7 | 980 | 1304 | 1422 | 1246 | 1922 | 949 | 1303.8 | |
| Cys | 90 | 100 | 90 | 100 | 80 | 80 | 90.0 | 208 | 1602 | 1800 | 1557 | 1937 | 1322 | 1404.3 | |
| Ser | 830 | 680 | 700 | 780 | 580 | 660 | 705.0 | 666 | 916 | 1002 | 854 | 1276 | 645 | 893.2 | |
| Glu | 2560 | 2280 | 2120 | 2580 | 2260 | 2310 | 2351.7 | 2032 | 2788 | 2973 | 2525 | 3831 | 2031 | 2696.7 | |
| Gly | 420 | 310 | 320 | 400 | 320 | 310 | 346.7 | 1550 | 1982 | 2247 | 1978 | 2723 | 1479 | 1993.2 | |
| Pro | 570 | 520 | 490 | 530 | 470 | 510 | 515.0 | 302 | 223 | 427 | 251 | 576 | 281 | 343.3 | |
| Tyr | 440 | 320 | 320 | 430 | 260 | 310 | 346.7 | 638 | 735 | 590 | 728 | 1034 | 606 | 721.8 | |
| TAA | 10720 | 9200 | 8830 | 10480 | 8640 | 9310 | 9530.0 | 9705 | 13336 | 15670 | 12617 | 20256 | 10588 | 13694.0 | |
| Locations Salicornia bigelovii Genotypes Fatty Acids (%) | ICBA (ECw = 26 dSm−1) | Mubarak Valley (ECw = 6.6 dSm−1) | ||||||||||||
| ICBA2 | ICBA3 | ICBA4 | ICBA8 | ICBA9 | ICBA10 | Average | ICBA2 | ICBA3 | ICBA4 | ICBA8 | ICBA9 | ICBA10 | Average | |
| Mono-unsaturated | ||||||||||||||
| Myristoleic acid (C14:1) | ND | ND | ND | ND | ND | ND | 1.2 | 1.1 | ND | ND | 0.7 | ND | ||
| OA (C18:1 ω9) | 16.6 | 19.8 | 20.5 | 16.7 | 15.9 | 19.5 | 18.2 | 0.7 | 9.0 | 9.2 | 10.3 | 11.2 | 1.2 | 6.9 |
| Palmitoleic acid (C16:1 ω7) | ND | ND | ND | ND | ND | ND | 1.2 | ND | 0.8 | ND | ND | 0.9 | ||
| Gadoleic acid (C20:1) | ND | ND | ND | 1.2 | ND | ND | ND | ND | ND | ND | ND | ND | ||
| Erucic acid (C22:1) | ND | ND | ND | ND | ND | ND | 1.0 | ND | ND | 0.9 | ND | ND | ||
| Nervonic acid (C24:1) | ND | ND | ND | ND | ND | ND | ND | ND | 1.4 | ND | ND | 0.8 | ||
| Poly-unsaturated | ||||||||||||||
| LA (C18:2 ω6) | 57.0 | 48.4 | 57.4 | 56.3 | 55.9 | 56.6 | 55.3 | 55.6 | 39.1 | 46.3 | 46.1 | 54.9 | 62.2 | 50.7 |
| ALA (C18:3 ω3) | 1.5 | 1.6 | 1.6 | 3.0 | 2.0 | 1.5 | 1.9 | ND | ND | ND | ND | ND | ND | |
| EPA (C20:5 ω3) | 0.9 | 1.1 | 1.1 | 0.3 | 1.1 | 0.8 | 0.9 | ND | ND | ND | ND | ND | ND | |
| DHA (C22:6 ω3) | 1.1 | 1.1 | 1.1 | 1.1 | 1.1 | 0.8 | 1.0 | ND | ND | ND | ND | ND | ND | |
| Tetracosahexaenoic (C24:6) | ND | ND | ND | ND | ND | ND | 1.6 | 1.0 | 4.1 | 2.3 | 2.2 | 3.0 | ||
| Pentacosatrienoic (C25:3) | ND | ND | ND | ND | ND | ND | 1.2 | 0.9 | 2.2 | 1.1 | 1.0 | 1.6 | ||
| Saturated | ||||||||||||||
| Capric acid (C10:0) | ND | ND | ND | ND | ND | ND | 2.9 | 1.1 | 4.0 | 1.6 | 1.4 | 1.8 | 2.1 | |
| Lauric acid (C12:0) | ND | ND | ND | ND | ND | ND | 6.6 | 16.9 | 0.5 | 4.8 | ND | ND | ||
| MA (C14:0) | 0.7 | 0.5 | 0.5 | 0.9 | 0.7 | 0.7 | 0.7 | 3.0 | 6.9 | 3.0 | 3.4 | 1.5 | 1.6 | 3.2 |
| PA (C16:0) | 14.0 | 15.4 | 12.7 | 12.1 | 12.7 | 14.1 | 13.5 | 23.5 | 20.8 | 25.3 | 25.4 | 22.7 | 25.6 | 23.9 |
| Heptadecanoic acid (C17:0) | ND | ND | ND | ND | ND | ND | ND | ND | ND | ND | ND | ND | ||
| SA (C18:0) | 6.7 | 6.6 | 4.9 | 5.3 | 6.3 | 5.0 | 5.8 | 2.6 | 3.2 | 3.9 | 4.1 | 4.4 | 3.3 | 3.6 |
| Arachidic acid (C20:0) | 0.6 | 1.3 | 1.1 | 1.4 | 0.9 | 0.8 | 1.0 | ND | ND | ND | ND | ND | ND | |
| Lignoceric acid (C24:0) | 1.1 | 1.2 | 1.2 | 1.2 | 1.1 | 0.8 | 1.1 | ND | ND | ND | ND | ND | ND | |
| Total unsaturated (USFA) | 77.1 | 72 | 81.7 | 78.6 | 76 | 79.2 | 77.4 | 62.5 | 51.1 | 64 | 60.7 | 70 | 69.7 | 63.0 |
| Total saturated (SAFA) | 23.1 | 25 | 20.4 | 20.9 | 21.7 | 21.4 | 22.1 | 38.6 | 48.9 | 36.7 | 39.3 | 30 | 32.3 | 37.6 |
| USFA/SAFA | 3.3 | 2.9 | 4.0 | 3.8 | 3.5 | 3.7 | 3.5 | 1.6 | 1.0 | 1.7 | 1.5 | 2.3 | 2.2 | 1.7 |
| OA/LA | 0.3 | 0.4 | 0.4 | 0.3 | 0.3 | 0.3 | 0.3 | 0.01 | 0.2 | 0.2 | 0.2 | 0.2 | 0.02 | 0.1 |
| Part of the Plant Salicornia bigelovii Genotypes Fatty Acids (%) | Shoots | Seeds | ||||||||||||
|---|---|---|---|---|---|---|---|---|---|---|---|---|---|---|
| ICBA2 | ICBA3 | ICBA4 | ICBA8 | ICBA9 | ICBA10 | Average | ICBA2 | ICBA3 | ICBA4 | ICBA8 | ICBA9 | ICBA10 | Average | |
| Mono-unsaturated | ||||||||||||||
| Myristoleic acid (C14:1) | ND | ND | ND | ND | ND | ND | 1.2 | 1.1 | ND | ND | 0.7 | ND | ||
| Pentadecenoic acid (cis-10) (C15:1 ω6) | ND | 0.9 | ND | ND | ND | ND | ND | ND | ND | ND | ND | ND | ||
| Palmitoleic acid (C16:1 ω7) | ND | 0.8 | 0.5 | 0.3 | 0.6 | ND | 1.2 | ND | 0.8 | ND | ND | 0.9 | ||
| Trans-palmitoleic acid (C16:1 ω9) | 5.8 | 3.4 | 6.3 | 6.5 | 5.8 | 4.1 | 5.3 | ND | ND | ND | ND | ND | ND | |
| OA (C18:1 ω9) | 3.2 | 17.7 | 3.3 | 2.5 | 5.0 | 5.2 | 6.1 | 0.7 | 9.0 | 9.2 | 10.3 | 11.2 | 1.2 | 6.9 |
| Vaccenic acid (C18:1 ω7) | 0.5 | 0.7 | 0.5 | 0.4 | 0.5 | 0.6 | 0.5 | ND | ND | ND | ND | ND | ND | |
| Gondoic acid (C20:1 ω9) | ND | 0.3 | ND | ND | ND | ND | ND | ND | ND | ND | ND | ND | ||
| Erucic acid (C22:1) | ND | ND | ND | ND | ND | ND | 1.0 | ND | ND | 0.9 | ND | ND | ||
| Nervonic acid (C24:1) | ND | ND | ND | ND | ND | ND | ND | ND | 1.4 | ND | ND | 0.8 | ||
| Poly-unsaturated | ||||||||||||||
| LA (C18:2 ω6) | 25.4 | 14.8 | 22.5 | 24.0 | 26.0 | 25.0 | 22.9 | 55.6 | 39.1 | 46.3 | 46.1 | 54.9 | 62.2 | 50.7 |
| ALA (C18:3 ω3) | 32.3 | 17.4 | 34.3 | 34.9 | 30.8 | 29.1 | 29.8 | ND | ND | ND | ND | ND | ND | |
| Eicosadienoic acid (C20:1 ω7) | ND | 0.6 | ND | ND | ND | 2.4 | ND | ND | ND | ND | ND | ND | ||
| Tetracosahexaenoic (C24:6) | ND | ND | ND | ND | ND | ND | 1.6 | 1.0 | 4.1 | 2.3 | 2.2 | 3.0 | 2.4 | |
| Pentacosatrienoic (C25:3) | ND | ND | ND | ND | ND | ND | 1.2 | 0.9 | 2.2 | 1.1 | 1.0 | 1.6 | 1.3 | |
| Saturated | ||||||||||||||
| Capric acid (C10:0) | ND | ND | ND | ND | ND | ND | 2.9 | 1.1 | 4.0 | 1.6 | 1.4 | 1.8 | 2.1 | |
| Lauric acid (C12:0) | ND | 0.3 | 0.2 | ND | 0.1 | ND | 6.6 | 16.9 | 0.5 | 4.8 | ND | ND | ||
| Tridecanoic acid (C13:0) | ND | 0.3 | 0.7 | 0.5 | 0.5 | ND | ND | ND | ND | ND | ND | ND | ||
| MA (C14:0) | 1.0 | 1.2 | 1.1 | 0.9 | 1.0 | 0.9 | 1.0 | 3.0 | 6.9 | 3.0 | 3.4 | 1.5 | 1.6 | 3.2 |
| Pentadecenoic acid (C15:0) | 0.8 | 1.7 | 0.7 | 0.9 | 1.2 | 3.6 | 1.5 | ND | ND | ND | ND | ND | ND | |
| PA (C16:0) | 22.9 | 29.9 | 21.5 | 21.0 | 21.0 | 21.9 | 23.0 | 23.5 | 20.8 | 25.3 | 25.4 | 22.7 | 25.6 | 23.9 |
| Heptadecanoic acid (C17:0) | 2.5 | 1.6 | 2.4 | 2.4 | 2.3 | 0.6 | 2.0 | ND | ND | ND | ND | ND | ND | |
| SA (C18:0) | 1.7 | 3.7 | 1.8 | 1.6 | 1.8 | 2.1 | 2.1 | 2.6 | 3.2 | 3.9 | 4.1 | 4.4 | 3.3 | 3.6 |
| Arachidic acid (C20:0) | 0.5 | 0.7 | 0.6 | 0.7 | 0.7 | 0.6 | 0.6 | ND | ND | ND | ND | ND | ND | |
| Behenic acid (C22:0) | 1.9 | 1.4 | 1.6 | 1.7 | 1.3 | 1.2 | 1.5 | ND | ND | ND | ND | ND | ND | |
| Total unsaturated (USFA) | 67.2 | 56.6 | 67.4 | 68.6 | 68.7 | 66.4 | 54.8 | 62.5 | 51.1 | 64 | 60.7 | 70 | 69.7 | 63 |
| Total saturated (SAFA) | 31.3 | 40.8 | 30.6 | 29.7 | 29.9 | 30.9 | 27.1 | 38.6 | 48.9 | 36.7 | 39.3 | 30 | 32.3 | 37.6 |
| USFA/SAFA | 2.1 | 1.4 | 2.2 | 2.3 | 2.3 | 2.1 | 2.1 | 1.6 | 1.0 | 1.7 | 1.5 | 2.3 | 2.2 | 1.7 |
| OA/LA | 0.1 | 1.2 | 0.2 | 0.1 | 0.2 | 0.2 | 0.3 | 0.01 | 0.2 | 0.2 | 0.2 | 0.2 | 0.02 | 0.1 |
Appendix C
| S. bigelovii Shoots | |||||
|---|---|---|---|---|---|
| Parameters | ICBA | Mubarak Valley | |||
| PCA Dim1 (41.5%) | PCA Dim2 (29.8%) | PCA Dim1 (51.9%) | PCA Dim2 (22.8%) | ||
| Yield parameter | GBY | −0.100 | −0.341 | 0.229 | −0.601 |
| Proximate Composition | FAT | 0.856 | −0.061 | 0.001 | 0.001 |
| PS | 0.429 | 0.745 | 0.749 | −0.525 | |
| CF | −0.864 | −0.303 | 0.001 | 0.001 | |
| CHO | −0.390 | −0.186 | −0.130 | 0.941 | |
| Ash | 0.713 | 0.475 | −0.575 | 0.811 | |
| Micronutrients | Na+ | 0.728 | 0.486 | 0.870 | 0.447 |
| K+ | 0.782 | −0.416 | 0.914 | −0.090 | |
| Na+/K+ | −0.008 | 0.822 | 0.381 | 0.678 | |
| Ca2+ | 0.858 | −0.412 | 0.957 | 0.109 | |
| Mg2+ | 0.948 | 0.160 | 0.798 | 0.401 | |
| Fe2+ | 0.561 | 0.077 | 0.751 | 0.179 | |
| Mn2+ | 0.981 | 0.093 | 0.804 | −0.425 | |
| Zn2+ | −0.621 | 0.567 | 0.367 | −0.324 | |
| P3- | 0.708 | −0.594 | 0.890 | 0.417 | |
| VIT C | 0.668 | −0.617 | −0.037 | 0.578 | |
| Aminoacids | Glu | 0.226 | 0.900 | 0.841 | 0.084 |
| Pro | −0.219 | 0.825 | 0.952 | −0.076 | |
| TAA | 0.260 | 0.891 | 0.908 | 0.120 | |
| S. bigelovii Seeds | |||||
|---|---|---|---|---|---|
| ICBA | Egypt | ||||
| Parameters | PCA Dim1 (37%) | PCA Dim2 (22.5%) | PCA Dim1 (42.8%) | PCA Dim2 (27.4%) | |
| Yield parameter | SY | −0.341 | −0.092 | 0.707 | 0.175 |
| Proximate Composition | FAT | 0.803 | 0.422 | 0.965 | −0.155 |
| PS | 0.627 | −0.298 | 0.951 | −0.213 | |
| CF | 0.709 | 0.078 | 0.856 | −0.345 | |
| CHO | −0.568 | −0.551 | −0.953 | 0.185 | |
| Ash | −0.613 | 0.647 | 0.227 | −0.040 | |
| Micronutrients | Na+ | −0.604 | 0.655 | 0.199 | −0.090 |
| K+ | −0.595 | −0.338 | 0.618 | 0.122 | |
| Na+/K+ | −0.106 | 0.764 | −0.781 | −0.019 | |
| Ca2+ | −0.927 | 0.136 | −0.725 | 0.291 | |
| Mg2+ | −0.965 | 0.078 | −0.869 | 0.239 | |
| Fe2+ | −0.647 | 0.089 | −0.249 | −0.713 | |
| Mn2+ | −0.178 | −0.019 | −0.835 | 0.257 | |
| Zn2+ | 0.250 | −0.549 | −0.229 | 0.600 | |
| P3- | 0.532 | −0.784 | 0.360 | 0.125 | |
| Aminoacids | Asp | 0.536 | 0.469 | 0.435 | 0.816 |
| Cys | 0.666 | −0.730 | 0.484 | 0.764 | |
| Glu | 0.871 | 0.318 | 0.399 | 0.852 | |
| Gly | 0.920 | 0.360 | 0.418 | 0.857 | |
| Pro | 0.869 | 0.072 | 0.672 | 0.420 | |
| TAA | 0.936 | 0.212 | 0.515 | 0.798 | |
| Fatty acids | C18:1 ω9 | −0.421 | −0.664 | 0.194 | 0.918 |
| C18:2 ω6 | 0.009 | 0.725 | 0.568 | −0.721 | |
| USFA | −0.129 | 0.305 | 0.890 | −0.342 | |
| SAFA | 0.243 | −0.358 | −0.915 | 0.259 | |
| USFA/SAFA | −0.215 | 0.247 | 0.897 | −0.264 | |
| C18:1 ω9 / C18:2 ω6 | −0.228 | −0.836 | 0.083 | 0.941 | |
References
- Martens, M. Food and Water Security in the Middle East and North Africa. 2017. Available online: https://www.nato-pa.int/download-file?filename=sites/default/files/2017-11/2017 - 176 STC 17 E bis- FOOD AND WATER SECURITY MENA - MARTENS REPORT.pdf (accessed on 3 June 2022).
- Dornier, I.C.; Alseiari, F.; Mansouri, S.; Kharusi, T.; Zaabi, M.; Mehairi, A.; Darawsha, T.; Issa, A.; Masri, S.; Elhag, I.; et al. Groundwater Atlas of Abu Dhabi Emirate. 2019. Available online: https://www.researchgate.net/publication/337857829_GROUNDWATER_ATLAS_OF_ABU_DHABI_EMIRATE (accessed on 30 September 2022).
- Hereher, M.E.; El-Ezaby, K.H. Soil and water quality assessment along the Red Sea coast, Egypt. Int. J. Environ. Stud. 2012, 69, 65–77. [Google Scholar] [CrossRef]
- Jones, E.; Qadir, M.; van Vliet, M.T.H.; Smakhtin, V.; Kang, S.-M. The state of desalination and brine production: A global outlook. Sci. Total Environ. 2019, 657, 1343–1356. [Google Scholar] [CrossRef] [PubMed]
- Giwa, A.; Dufour, V.; Al Marzooqi, F.; Al Kaabi, M.; Hasan, S.W. Brine management methods: Recent innovations and current status. Desalination 2017, 407, 1–23. [Google Scholar] [CrossRef]
- Walschot, M.; Luis, P.; Liégeois, M. The challenges of reverse osmosis desalination: Solutions in Jordan. Water Int. 2020, 45, 112–124. [Google Scholar] [CrossRef]
- Panta, S.; Flowers, T.; Lane, P.; Doyle, R.; Haros, G.; Shabala, S. Halophyte agriculture: Success stories. Environ. Exp. Bot. 2014, 107, 71–83. [Google Scholar] [CrossRef]
- Rozema, J.; Schat, H. Salt tolerance of halophytes, research questions reviewed in the perspective of saline agriculture. Environ. Exp. Bot. 2013, 92, 83–95. [Google Scholar] [CrossRef] [Green Version]
- Shabala, S. Learning from halophytes: Physiological basis and strategies to improve abiotic stress tolerance in crops. Ann. Bot. 2013, 112, 1209–1221. [Google Scholar] [CrossRef] [PubMed]
- Flowers, T.J.; Galal, H.K.; Bromham, L. Evolution of halophytes: Multiple origins of salt tolerance in land plants. Funct. Plant Biol. 2010, 37, 604–612. [Google Scholar] [CrossRef]
- Flowers, T.J.; Colmer, T.D. Salinity tolerance in halophytes. New Phytol. 2008, 179, 945–963. [Google Scholar] [CrossRef] [PubMed]
- Glenn, E.P.; Anday, T.; Chaturvedi, R.; Martinez-Garcia, R.; Pearlstein, S.; Soliz, D.; Nelson, S.G.; Felger, R.S. Three halophytes for saline-water agriculture: An oilseed, a forage and a grain crop. Environ. Exp. Bot. 2013, 92, 110–121. [Google Scholar] [CrossRef]
- Ventura, Y.; Sagi, M. Halophyte crop cultivation: The case for salicornia and sarcocornia. Environ. Exp. Bot. 2013, 92, 144–153. [Google Scholar] [CrossRef]
- Flowers, T.J.; Colmer, T.D. Plant salt tolerance: Adaptations in halophytes. Ann. Bot. 2015, 115, 327–331. [Google Scholar] [CrossRef] [Green Version]
- Glenn, E.P.; Brown, J.J.; Blumwald, E. Salt tolerance and crop potential of halophytes. CRC Crit. Rev. Plant Sci. 1999, 18, 227–255. [Google Scholar] [CrossRef]
- Swingle, R.S.; Glenn, E.P.; Squires, V. Growth performance of lambs fed mixed diets containing halophyte ingredients. Anim. Feed Sci. Technol. 1996, 63, 137–148. [Google Scholar] [CrossRef]
- Bresdin, C.; Glenn, E.P.; Brown, J.J. Comparison of Seed Production and Agronomic Traits of 20 Wild Accessions of Salicornia bigelovii Torr. Grown Under Greenhouse Conditions. In Halophytes for Food Security in Dry Lands; Elsevier Inc.: Amsterdam, The Netherlands, 2016. [Google Scholar] [CrossRef]
- Martinez-Garcia, R. Physiological Studies of the Halophyte Salicornia bigelovii: A Potential Food and Biofuel Crop for Integrated Aquaculture-Agriculture Systems; The University of Arizona: Tucson, AZ, USA, 2010; ISBN 1124372431. [Google Scholar]
- Barreira, L.; Resek, E.; Rodrigues, M.J.; Rocha, M.I.; Pereira, H.; Bandarra, N.; da Silva, M.M.; Varela, J.; Custódio, L. Halophytes: Gourmet food with nutritional health benefits? J. Food Compos. Anal. 2017, 59, 35–42. [Google Scholar] [CrossRef]
- Patel, S. Salicornia: Evaluating the halophytic extremophile as a food and a pharmaceutical candidate. In 3 Biotech; Springer: Berlin/Heidelberg, Germany, 2016; Volume 6, pp. 1–10. [Google Scholar] [CrossRef] [Green Version]
- Ventura, Y.; Wuddineh, W.A.; Myrzabayeva, M.; Alikulov, Z.; Khozin-Goldberg, I.; Shpigel, M.; Samocha, T.M.; Sagi, M. Effect of seawater concentration on the productivity and nutritional value of annual Salicornia and perennial Sarcocornia halophytes as leafy vegetable crops. Sci. Hortic. (Amst.) 2011, 128, 189–196. [Google Scholar] [CrossRef]
- Lu, D.; Zhang, M.; Wang, S.; Cai, J.; Zhou, X.; Zhu, C. Nutritional characterization and changes in quality of Salicornia bigelovii Torr. during storage. LWT-Food Sci. Technol. 2010, 43, 519–524. [Google Scholar] [CrossRef]
- Lyra, D.-A.; Lampakis, E.; Al Muhairi, M.; Bin Tarsh, F.M.; Hamyd Dawoud, M.A.; Al Khawaldeh, B.; Moukayed, M.; Plewa, J.; Cobre, L.; Al Masjedi, O.S.; et al. From Desert Farm to Fork. In Future of Sustainable Agriculture in Saline Environments; CRC Press: Boca Raton, FL, USA, 2021; pp. 181–200. [Google Scholar] [CrossRef]
- Glenn, E.P.; Leary, J.W.O.; Watson, M.C.; Thompson, T.L.; Kuehl, R.O. Salicornia bigelovii Torr.: An Oilseed Halophyte for Seawater Irrigation. Am. Assoc. Adv. Sci. 1991, 251, 1065–1067. [Google Scholar] [CrossRef]
- Coronado, D.L.L.; Maria, M. Nutritive Value of Atriplex Deserticola and Salicornia Forage for Ruminants; The University of Arizona: Tucson, AZ, USA, 1991. [Google Scholar]
- Glenn, E.P.; Coates, W.E.; Riley, J.J.; Kuehl, R.O.; Swingle, R.S. Salicornia bigelovii Torr.: A seawater-irrigated forage for goats. Anim. Feed Sci. Technol. 1992, 40, 21–30. [Google Scholar] [CrossRef]
- Al-Owaimer, A.N. Effect of dietary halophyte Salicornia bigelovii torr on carcass characteristics, minerals, fatty acids and amino acids profile of camel meat. J. Appl. Anim. Res. 2000, 18, 185–192. [Google Scholar] [CrossRef]
- Anwar, F.; Bhanger, M.I.; Nasir, M.K.A.; Ismail, S. Analytical Characterization of Salicornia bigelovii Seed Oil Cultivated in Pakistan. J. Agric. Food Chem. 2002, 50, 4210–4214. [Google Scholar] [CrossRef]
- Zerai, D.B.; Glenn, E.P.; Chatervedi, R.; Lu, Z.; Mamood, A.N.; Nelson, S.G.; Ray, D.T. Potential for the improvement of Salicornia bigelovii through selective breeding. Ecol. Eng. 2010, 36, 730–739. [Google Scholar] [CrossRef]
- Attia, F.M.; Alsobayel, A.A.; Kriadees, M.S.; Al-Saiady, M.Y.; Bayoumi, M.S. Nutrient composition and feeding value of Salicornia bigelovii torr meal in broiler diets. Anim. Feed. Sci. Technol. 1997, 65, 257–263. [Google Scholar] [CrossRef]
- Abdal, M.S. Salicornia production in Kuwait. World Appl. Sci. J. 2009, 6, 1033–1038. [Google Scholar]
- Muñoz Sabater, J. ERA5-Land Hourly Data from 1981 to Present. 2019. Available online: https://cds.climate.copernicus.eu/cdsapp#!/dataset/reanalysis-era5-land?tab=overview (accessed on 3 June 2022).
- Page, A.L.; Miller, R.H.; Keeney, D.R. Methods of Soil Analysis Part 2: Chemical and Microbiological Properties, 2nd ed.; Agronomy 920; American Society of Agronomy Inc.; Soil Science Society of America Inc.: Madison, WI, USA, 1982. [Google Scholar]
- Sparks, D.L. Methods of Soil Analysis. Part 3, Chemical Methods; Soil Science Society of America: Madison, WI, USA, 1996. [Google Scholar]
- RICHARDS, L.A. Diagnosis and Improvement of Saline and Alkali Soils. Soil Sci. 1954, 78, 154. Available online: https://journals.lww.com/soilsci/Fulltext/1954/08000/Diagnosis_and_Improvement_of_Saline_and_Alkali.12.aspx. (accessed on 3 June 2022). [CrossRef]
- Swift, E.H.; Myron Arcand, G.; Lutwack, R.; Meier, D.J. Determination of Chloride. Anal. Chem. 1950, 22, 306–308. [Google Scholar] [CrossRef]
- Dahnke, W.C.; Johnson, G.V. Testing soils for available nitrogen. Soil Test. Plant Anal. 1990, 3, 127–139. [Google Scholar] [CrossRef]
- Soltanpour, P.N.; Workman, S. Modification of the NH4 HCO3-DTPA soil test to omit carbon black. Commun. Soil Sci. Plant Anal. 1979, 10, 1411–1420. [Google Scholar] [CrossRef]
- Gavlak, R.; Horneck, D.; RO, M. Particle Size Analysis: Hydrometer Method. Soil, Plant and Water Reference Methods for the Western Region. 2005, p. 128130. Available online: https://www.naptprogram.org/files/napt/western-states-method-manual-2005.pdf (accessed on 3 June 2022).
- Kopp, J.F. Methods for Chemical Analysis of Water and Wastes; Environmental Monitoring and Support Laboratory, Environmental Protection Agency: Cincinnati, OH, USA, 1979. [Google Scholar]
- Faithfull, N.T. Methods in Analysis Agricultural Chemical: A Practical Handbook; CABI Publishing: Wallingford, UK, 2002. [Google Scholar]
- Heald, W.R. Calcium and magnesium. In Methods of Soil Analysis, Part 2: Microbiological and Biochemical Properties; American Society of Agronomy: Madison, WI, USA, 1965; p. 999. Available online: https://acsess.onlinelibrary.wiley.com/doi/book/10.2134/agronmonogr9.2 (accessed on 3 June 2022).
- Piper, C.S. Soil and plant Analysis; Scientific Publishers: New Delhi, India, 2017. [Google Scholar]
- Jackson, M.L. Soil Chemical Analysis: Advanced Course; UW-Madison Libraries Parallel Press: Madison, WI, USA, 2005; ISBN 1893311473. [Google Scholar]
- Pierce, W.C.; Haenisch, E.L. Quantitative Analysis, 3rd ed.; John Wily & Sons, Inc.: New York, NY, USA, 1948. [Google Scholar]
- Apha, A. Standard Methods for the Examination of Water and Wastewater; American Public Health Association: Washington, WA, USA, 1998. [Google Scholar]
- Armstrong, F.A.J. Determination of Nitrate in Water Ultraviolet Spectrophotometry. Anal. Chem. 1963, 35, 1292–1294. [Google Scholar] [CrossRef]
- HACH Application note for DR3900 Labratory Spectrophotometer for Water Analysis. 2022. Available online: https://au.hach.com/spectrophotometers/dr3900-laboratory-spectrophotometer-for-water-analysis/family-downloads?productCategoryId=22218653565 (accessed on 3 June 2022).
- Official Methods of Analysis. AOAC. Agricultural Chemical, Contaminants, Drugs, 15th ed.; Helrich, K., Ed.; AOAC: Arlington, VA, USA, 1990; Available online: https://law.resource.org/pub/us/cfr/ibr/002/aoac.methods.1.1990.pdf (accessed on 3 June 2022).
- Isaac, R.A.; Johnson, W.C. Elemental analysis of plant tissue by plasma emission spectroscopy: Collaborative study. J. Assoc. Off. Anal. Chem. 1985, 68, 499–505. [Google Scholar] [CrossRef]
- Siew, W.L.; Tang, T.S.; Tan, Y.A. PORIM Test Methods Vol. 1; Palm Oil Research Institute of Malaysia: Kuala Lumpur, Malaysia, 1995. [Google Scholar]
- Jumat, S.; Mamot, S.; Suria, R.; Mohamad, A. Oil and Fat Analysis; Bangi Penerbit UKM: Bangi, Malaysia, 2006. [Google Scholar]
- Bauder, T.A.; Waskom, R.M.; Sutherland, P.L.; Davis, J.G. Irrigation Water Quality Criteria Crop Series Irrigation, Fact Sheet No. 0506; Colorado State University: Fort Collins, CO, USA, 2011. [Google Scholar]
- Wilcox, L.V.; Blair, G.Y.; Bower, C.A. Effect of bicarbonate on suitability of water for irrigation. Soil Sci. 1954, 77, 259–266. [Google Scholar] [CrossRef]
- EShimojimaa, E.; Yoshioka, R.; Tamagawa, I. Salinization owing to evaporation from bare-soil surfaces and its influences on the evaporation. J. Hydrol. 1996, 178, 109–136. [Google Scholar] [CrossRef]
- Lyra, D.A.; Al-Shihi, R.M.S.; Nuqui, R.; Robertson, S.M.; Christiansen, A.; Ramachandran, S.; Ismail, S.; Al-Zaabi, A.M. Multidisciplinary studies on a pilot coastal desert modular farm growing Salicornia bigelovii in united arab emirates. In Ecophysiology, Abiotic Stress Responses and Utilization of Halophytes; Springer: Berlin/Heidelberg, Germany, 2019; pp. 327–345. [Google Scholar] [CrossRef]
- Lyra, D.A.; Ismail, S.; Brown, J.J. Crop Potential of Six Salicornia bigelovii Populations Under Two Salinity Water Treatments Cultivated in a Desert Environment: A Field Study. In Emerging Research in Alternative Crops; Springer: Berlin/Heidelberg, Germany, 2020; pp. 313–333. [Google Scholar] [CrossRef]
- Robertson, S.M.; Lyra, D.A.; Mateo-Sagasta, J.; Ismail, S.; Akhtar, M.J.U. Financial analysis of halophyte cultivation in a desert environment using different saline water resources for irrigation. In Ecophysiology, Abiotic Stress Responses and Utilization of Halophytes; Spinger: Berlin/Heidelberg, Germany, 2019; pp. 347–364. [Google Scholar] [CrossRef]
- Guo, J.; Du, M.; Tian, H.; Wang, B. Exposure to High Salinity During Seed Development Markedly Enhances Seedling Emergence and Fitness of the Progeny of the Extreme Halophyte Suaeda salsa. Front. Plant Sci. 2020, 11, 01291. [Google Scholar] [CrossRef] [PubMed]
- Khan, M.A.; Gul, B. Ecophysiology of High Salinity Tolerant Plants; Springer: Berlin/Heidelberg, Germany, 2006; pp. 10–30. [Google Scholar] [CrossRef]
- Ajmal Khan, M.; Gul, B.; Weber, D.J. Germination responses of Salicornia rubra to temperature and salinity. J. Arid Environ. 2000, 45, 207–214. [Google Scholar] [CrossRef]
- Ruan, C.J.; da Silva, J.A.T.; Mopper, S.; Pei, Q.; Lutts, S. Halophyte Improvement for a Salinized World. CRC. Crit. Rev. Plant Sci. 2010, 29, 329–359. [Google Scholar] [CrossRef]
- Rueda-Puente, E.O.; García-Hernández, J.L.; Preciado-Rangel, P.; Murillo-Amador, B.; Tarazón-Herrera, M.A.; Flores-Hernández, A.; Holguin-Peña, J.; Aybar, A.N.; Barrón Hoyos, J.M.; Weimers, D.; et al. Germination of Salicornia bigelovii ecotypes under stressing conditions of temperature and salinity and ameliorative effects of plant growth-promoting bacteria. J. Agron. Crop Sci. 2007, 193, 167–176. [Google Scholar] [CrossRef]
- Ungar, I.A. Germination Ecology of Halophytes; Springer: Berlin/Heidelberg, Germany, 1982; pp. 143–154. [Google Scholar] [CrossRef]
- Zaman, M.; Shahid, S.A.; Heng, L. Irrigation Systems and Zones of Salinity Development. In Guideline for Salinity Assessment, Mitigation and Adaptation Using Nuclear and Related Techniques; Springer: Berlin/Heidelberg, Germany, 2018; pp. 91–111. [Google Scholar] [CrossRef]
- Garza-Torres, R.; Troyo-Diéguez, E.; Nieto-Garibay, A.; Lucero-Vega, G.; Magallón-Barajas, F.J.; García-Galindo, E.; Fimbres-Acedo, Y.; Murillo-Amador, B. Environmental and management considerations for adopting the halophyte Salicornia bigelovii torr. as a sustainable seawater-irrigated crop. Sustainability 2020, 12, 707. [Google Scholar] [CrossRef] [Green Version]
- Katschnig, D.; Broekman, R.; Rozema, J. Salt tolerance in the halophyte Salicornia dolichostachya Moss: Growth, morphology and physiology. Environ. Exp. Bot. 2012, 92, 32–42. [Google Scholar] [CrossRef]
- Yala, F.; O’Leary, J.W. Growth and Physiology of Salicornia bigelovii Torr. at Suboptimal Salinity. Bot. Gaz. 1995, 156, 197–205. [Google Scholar] [CrossRef]
- Elsebaie, E.M. Oil and Fatty Acids Composition in Glasswort (Salicornia fruticosa) Seeds. IOSR J. Appl. Chem. 2013, 4, 6–9. [Google Scholar]
- Briens, M.; Larher, F. Osmoregulation in halophytic higher plants: A comparative study of soluble carbohydrates, polyols, betaines and free proline. Plant Cell Environ. 1982, 5, 287–292. [Google Scholar] [CrossRef]
- Díaz, F.; Benes, S.; Grattan, S. Field performance of halophytic species under irrigation with saline drainage water in the San Joaquin Valley of California. Agric. Water Manag. 2013, 118, 59–69. [Google Scholar] [CrossRef]
- Yousif, B.S.; Nguyen, N.T.; Fukuda, Y.; Hakata, H.; Okamoto, Y.; Masaoka, Y.; Saneoka, H. Effect of salinity on growth, mineral composition, photosynthesis and water relations of two vegetable crops; New Zealand spinach (Tetragonia tetragonioides) and water spinach (Ipomoea aquatica). Int. J. Agric. Biol. 2010, 12, 211–216. [Google Scholar]
- Parks, G.E.; Dietrich, M.A.; Schumaker, K.S. Increased vacuolar Na+/H+ exchange activity in Salicornia bigelovii Torr. in response to NaCl. J. Exp. Bot. 2002, 53, 1055–1065. [Google Scholar] [CrossRef] [PubMed]
- Tikhomirova, N.A.; Ushakova, S.A.; Tikhomirov, A.A.; Kalacheva, G.S.; Gros, J.-B. Possibility of Salicornia europaea use for the human liquid wastes inclusion into BLSS intrasystem mass exchange. Acta Astronaut. 2008, 63, 1106–1110. [Google Scholar] [CrossRef]
- Bertin, R.L.; Gonzaga, L.V.; Borges, G.; Azevedo, M.S.; Maltez, H.F.; Heller, M.; Micke, G.A.; Tavares, L.B.B.; Fett, R. Nutrient composition and, identification/quantification of major phenolic compounds in Sarcocornia ambigua (Amaranthaceae) using HPLC–ESI-MS/MS. Food Res. Int. 2014, 55, 404–411. [Google Scholar] [CrossRef] [Green Version]
- Koyro, H.-W.; Eisa, S.S. Effect of salinity on composition, viability and germination of seeds of Chenopodium quinoa Willd. Plant Soil 2008, 302, 79–90. [Google Scholar] [CrossRef]
- Yuan, F.; Guo, J.; Shabala, S.; Wang, B. Reproductive physiology of halophytes: Current standing. Front. Plant Sci. 2019, 9, 1–13. [Google Scholar] [CrossRef]
- Liu, Q.; Liu, R.; Ma, Y.; Song, J. Physiological and molecular evidence for Na+ and Cl− exclusion in the roots of two Suaeda salsa populations. Aquat. Bot. 2018, 146, 1–7. [Google Scholar] [CrossRef]
- Shaddad, M.A.; Radi, A.F.; Abdel-Rahman, A.M.; Azooz, M.M. Response of seeds of Lupinus termis and Vicia faba to the interactive effect of salinity and ascorbic acid or pyridoxine. Plant Soil 1990, 122, 177–183. [Google Scholar] [CrossRef]
- Song, J.; Feng, G.; Tian, C.; Zhang, F. Strategies for adaptation of Suaeda physophora, Haloxylon ammodendron and Haloxylon persicum to a saline environment during seed-germination stage. Ann. Bot. 2005, 96, 399–405. [Google Scholar] [CrossRef] [PubMed] [Green Version]
- Glenn, E.P.; Jed Brown, J.; O’Leary, J.W. Irrigating Crops with Seawater. Sci. Am. 1998, 279, 76–81. [Google Scholar] [CrossRef]
- Joshi, A.J.; Mali, B.S.; Hinglajia, H. Salt tolerance at germination and early growth of two forage grasses growing in marshy habitats. Environ. Exp. Bot. 2005, 54, 267–274. [Google Scholar] [CrossRef]
- Islam, M.N.; Wilson, C.A.; Watkins, T.R. Nutritional Evaluation of Seashore Mallow Seed, Kosteletzkya virginica. J. Agric. Food Chem. 1982, 30, 1195–1198. [Google Scholar] [CrossRef] [PubMed]
- Szymansky, C.M.; Muscolo, A.; Yeo, M.; Colville, L.; Clatworthy, I.; Salge, T.; Seal, C.E. Elemental localisation and a reduced glutathione redox state protect seeds of the halophyte Suaeda maritima from salinity during over-wintering and germination. Environ. Exp. Bot. 2021, 190, 104569. [Google Scholar] [CrossRef]
- Marcone, M.F. Batis maritima (Saltwort/Beachwort): A nutritious, halophytic, seed bearings, perennial shrub for cultivation and recovery of otherwise unproductive agricultural land affected by salinity. Food Res. Int. 2003, 36, 123–130. [Google Scholar] [CrossRef]
- Toderich, K.N.; Mamadrahimov, A.A.; Khaitov, B.B.; Karimov, A.A.; Soliev, A.A.; Nanduri, K.R.; Shuyskaya, E.V. Differential Impact of Salinity Stress on Seeds Minerals, Storage Proteins, Fatty Acids, and Squalene Composition of New Quinoa Genotype, Grown in Hyper-Arid Desert Environments. Front. Plant Sci. 2020, 11, 1–15. [Google Scholar] [CrossRef]
- Zhao, Y.; Yang, Y.; Song, Y.; Li, Q.; Song, J. Analysis of storage compounds and inorganic ions in dimorphic seeds of euhalophyte Suaeda salsa. Plant Physiol. Biochem. 2018, 130, 511–516. [Google Scholar] [CrossRef]
- Baâtour, O.; Kaddour, R.; Mahmoudi, H.; Tarchoun, I.; Bettaieb, I.; Nasri, N.; Mrah, S.; Hamdaoui, G.; Lachaâl, M.; Marzouk, B. Salt effects on Origanum majorana fatty acid and essential oil composition. J. Sci. Food Agric. 2011, 91, 2613–2620. [Google Scholar] [CrossRef]
- El-Araby, R.; Rezk, A.I.; El-Enin, S.A.A.; Nofal, O.A.; El-Nasharty, A.B. Comparative evaluation of Salicornia bigelovii oil planted under different treatments. Bull. Natl. Res. Cent. 2020, 44, 1–10. [Google Scholar] [CrossRef]
- Davis, J.P.; Price, K.; Dean, L.L.; Sweigart, D.S.; Cottonaro, J.; Sanders, T.H. Peanut Oil Stability and Physical Properties Across a Range of Industrially Relevant Oleic Acid/Linoleic Acid Ratios. Peanut Sci. 2016, 43, 1–11. [Google Scholar] [CrossRef]
- Simopoulos, A.P. Omega-3 fatty acids and antioxidants in edible wild plants. Biol. Res. 2004, 37, 263–277. [Google Scholar] [CrossRef] [PubMed]


| Experiments on Salicornia bigelovii | ICBA—UAE | Mubarak Valley—Egypt |
|---|---|---|
| Irrigation system | Bubblers | Drippers |
| Experimental design | RCBD | 3 lines per genotype= 18 lines in total |
| Sowing date | 15th of November 2019 | 20 December 2019 |
| Plant-to-plant spacing | Continuous sowing | 20 cm |
| Compost added | Yes | No |
| S. bigelovii Seedlings’ émergence | 19 and 48 DAS * (4 December 2019 and 2 January 2020 respectively) | 21 and 49 DAS (9 January and 7 February 2020 respectively) |
| Number of plants | 8 quadrats × 1 measurement per quadrat (1 m2)= 8 measurements per genotype in total | 1 measurement per row (2 m2) × 3 rows = 3 measurements per genotype in total |
| Plant height (cm) | 7 June 2020 8 quadrats × 3 plants per quadrat (1 m2)= 24 measurements per genotype in total | 10 June 2020 3 plants per row (2 m2) × 3 rows = 9 measurements per genotype in total |
| Green biomass yield (GBY) (kgm−2) | 7 June 2020 8 quadrats × 1 measurement per quadrat (1 m2)= 8 measurements per genotype in total | 10 June 2020 1 measurement per row (2 m2) × 3 rows= 3 measurements per genotype in total |
| Seed yield (SY) (gm−2) | Late August 8 quadrats × 1 measurement per quadrat (1 m2)= 8 measurements per genotype in total | Early September 1 measurement per row (2 m2) × 3 rows= 3 measurements per genotype in total |
| Tmin | Tmax | RH | Rainfall | |||||
|---|---|---|---|---|---|---|---|---|
| Dubai | MV | Dubai | MV | Dubai | MV | Dubai | MV | |
| Jan. | 13.6 | 13.5 | 23.9 | 21.2 | 62.7 | 49.8 | 10.3 | 1.4 |
| Feb. | 14.4 | 14.5 | 26.2 | 22.8 | 57.5 | 45.1 | 9.3 | 0.2 |
| Mar. | 16.7 | 17.1 | 29.9 | 25.5 | 52.0 | 39.7 | 11.4 | 0.3 |
| Apr. | 20.5 | 20.4 | 35.2 | 28.7 | 41.6 | 33.5 | 4.8 | 0.1 |
| May. | 23.8 | 24.2 | 40.1 | 32.1 | 36.9 | 29.6 | 0.8 | 0.2 |
| Jun. | 26.4 | 27.0 | 42.1 | 34.4 | 41.7 | 27.9 | 0.2 | 0.0 |
| Jul. | 29.3 | 28.2 | 43.3 | 35.6 | 41.2 | 30.8 | 0.8 | 0.0 |
| Aug. | 29.4 | 28.7 | 43.2 | 35.9 | 41.6 | 33.0 | 1.5 | 0.0 |
| Sep. | 26.8 | 26.8 | 40.7 | 33.9 | 47.2 | 37.9 | 0.5 | 0.0 |
| Oct. | 23.3 | 23.5 | 36.6 | 30.7 | 51.7 | 47.1 | 1.1 | 1.5 |
| Nov. | 19.3 | 19.3 | 30.5 | 26.4 | 56.1 | 53.1 | 3.9 | 0.8 |
| Dec. | 15.5 | 15.6 | 25.9 | 22.8 | 62.8 | 51.8 | 9.2 | 1.2 |
| Parameters | |
|---|---|
| Proximate Composition Units: g/100 g | Water content (WC); Fat (FAT); Protein (PS); Crude Fiber (CF); Carbohydrates (CHO); Total Ash content (Ash) |
| Micronutrients Units: mg/100 g | Sodium (Na+); Potassium (K+); Magnesium (Mg2+); Manganese (Mn2+); Calcium (Ca2+); Phosphorus (P3−); Iron (Fe2+); Zinc (Zn2+); Vitamin C (VIT C); Vitamin B1 (VIT B1); Vitamin B2 (VIT B2) |
| Amino acids Units: mg/100 g | Essential amino acids: Histidine (His); Isoleucine (Ile); Leucine (Leu); Lysine (Lys); Methionine (Met); Phenylalanine (Phe); Threonine (Thr); Valine (Val) |
| Non-Essential amino acids: Alanine (Ala); Arginine (Arg); Aspartic acid (Asp); Cysteine (Cys); Glutamic acid (Glu); Glycine (Gly); Proline (Pro); Serine (Ser); Tyrosine (Tyr) | |
| Fatty Acids (%) * | Mono-unsaturated fatty acids (MUFA): Myristoleic acid (C14:1); Pentadecenoic acid (cis-10) (C15:1 ω6); Palmitoleic acid (C16:1 ω7); Trans-palmitoleic acid (C16:1 ω9); Oleic acid (OA) (C18:1 ω9); Vaccenic acid (C18:1 ω7); Gadoleic acid (C20:1); Gondoic acid (C20:1 ω9); Erucic acid (C22:1); Nervonic acid (C24:1) Poly–unsaturated fatty acids (PUFA): Linoleic acid (LA) (C18:2 ω6); A-Linolenic acid (ALA) (C18:3 ω3); EPA (C20:5 ω3); Eicosadienoic acid (C20:1 ω7); DHA (C22:6 ω3); Tetracosahexaenoic (C24:6); Pentacosatrienoic (C25:3) Saturated fatty acids (SAFA): Capric acid (C10:0); Lauric acid (C12:0); Tridecanoic acid (C13:0); Myristic acid (MA) (C14:0); Pentadecenoic acid (C15:0); Palmitic acid (PA) (C16:0); Heptadecanoic acid (C17:0); Stearic acid (SA) (C18:0); Arachidic acid (C20:0); Lignoceric acid (C24:0) |
| Parameters | Groundwater at ICBA | Groundwater at Mubarak Valley |
|---|---|---|
| ECw (dS/m) | 26.0 | 6.6 |
| pH | 7.4 | 7.4 |
| Anions (meq.L−1) | ||
| HCO3− | 1.94 | 2.2 |
| Cl− | 204.0 | 54.3 |
| SO42− | 53.1 | 8.5 |
| NO3− | 37.5 | 0.1 |
| PO43− | <0.01 | <1.5 |
| Cations (meq.L−1) | ||
| Ca2+ | 41.7 | 19.5 |
| Mg2+ | 45.0 | 8.0 |
| Na+ | 210.0 | 37.3 |
| K+ | 3.3 | 0.2 |
| NH4+ | 1.10 | 2.45 |
| Micronutrients (meq.L−1) | ||
| B | <0.01 | 0.01 |
| Cu | <0.01 | <0.2 |
| Fe | <0.01 | 0.124 |
| Mn | <0.01 | 0.083 |
| Zn | <0.01 | 0.02 |
| Parameters | ICBA’s Experimental Station | Mubarak Valley | ||||||
|---|---|---|---|---|---|---|---|---|
| Before the Experiment | After the Experiment | Before the Experiment | After the Experiment | |||||
| Surface Soil 1 | Subsurface 2 | Surface Soil | Subsurface | Surface Soil | Subsurface | Surface Soil | Subsurface | |
| pH | 7.4 | 7.5 | 7.6 | 7.7 | 7.9 | 7.9 | 7.7 | 8.0 |
| ECe (dS/m) | 3.5 | 3.2 | 12.3 | 14.5 | 1.9 | 2.6 | 28.2 | 8.9 |
| Saturation Percent (SP%) | 26.4 | 23.4 | 23.3 | 21.7 | 24.0 | 25.0 | 25.0 | 23.0 |
| Anions (meq.L−1) | ||||||||
| SO42− | 77.6 | 50.2 | 89.0 | 54.0 | 2.0 | 3.4 | 109.7 | 53.1 |
| Cl− | 98.0 | 53.4 | 278.0 | 126.0 | 35.1 | 27.8 | 211.3 | 49.2 |
| HCO3− | 2.1 | 1.5 | 2.3 | 1.4 | 0.9 | 0.9 | 2.4 | 1.7 |
| Cations (meq.L−1) | ||||||||
| Na+ | 111.1 | 54.7 | 246.8 | 117.3 | 19.1 | 16.9 | 37.2 | 31.7 |
| K+ | 5.6 | 5.6 | 6.2 | 5.2 | 0.4 | 0.5 | 2.4 | 1.7 |
| Mg2+ | 22.6 | 6.7 | 44.2 | 26.2 | 8.5 | 5.3 | 82.0 | 22.8 |
| Ca2+ | 65.4 | 27.7 | 77.0 | 32.7 | 10.0 | 9.4 | 62.1 | 37.9 |
| Available nutrients (mg.kg−1 soil) | ||||||||
| N | 1.1 | 0.6 | 2.4 | 3.0 | 144.0 | 103.5 | 81.0 | 67.0 |
| K | 36.5 | 28.4 | 58.9 | 47.0 | 165.6 | 96.8 | 107.0 | 104.5 |
| P | 8.7 | 3.4 | 12.1 | 7.7 | 8.0 | 5.5 | 0.0 | 0.0 |
| Cu | 1.2 | 0.8 | 2.4 | 3.0 | 0.1 | 0.2 | 0.1 | 0.1 |
| Fe | 1.5 | 1.3 | 6.7 | 2.8 | 1.0 | 0.7 | 0.6 | 0.7 |
| Mn | 0.5 | 0.4 | 1.1 | 0.5 | 1.8 | 0.5 | 0.3 | 0.3 |
| Zn | 0.5 | 0.6 | 0.8 | 0.7 | 0.3 | 0.5 | 0.2 | 0.2 |
| Soil texture | Sand | Silt Loam | ||||||
| Sand (%) | 96.5 | 38.5 | ||||||
| Silt (%) | 2.4 | 53.0 | ||||||
| Clay (%) | 1.1 | 8.5 | ||||||
| ICBA | ||||
|---|---|---|---|---|
| Salicornia bigelovii genotypes | Number of plants per m2 | Plant height (cm) | Green biomass (kgm−2) | Seed yield (gm−2) |
| ICBA-2 | 55 ± 16.4 a | 50.5 ± 1.9 a | 9.5 ± 1.3 ab | 69.4 ± 13.5 a |
| ICBA-3 | 62 ± 16.4 a | 52.1 ± 1.9 a | 10.9 ± 1.3 ab | 67.4 ± 14.2 a |
| ICBA-4 | 50 ± 16.4 a | 48.7 ± 1.9 a | 9.2 ± 1.3 ab | 96.2 ± 14.2 a |
| ICBA-8 | 59 ± 16.4 a | 53.4 ± 1.9 a | 12.2 ± 1.3 b | 94.7 ± 14.2 a |
| ICBA-9 | 39 ± 16.4 a | 48.1 ± 1.9 a | 6.2 ± 1.3 a | 58.7 ± 14.8 a |
| ICBA-10 | 23 ± 16.4 a | 52.2 ± 1.9 a | 10.9 ± 1.3 ab | 116.3 ± 14.2 a |
| Overall mean | 50.9 | 50.8 | 9.81 | 83.77 |
| F-test for genotypes | *NS | NS | * | NS |
| Mubarak Valley | ||||
| ICBA-2 | 38 ± 1 a | 55.5 ± 0.5 bc | 7.4 ± 0.4 ab | 62.9 ± 5.6 c |
| ICBA-3 | 33 ± 6 a | 58.0 ± 1.7 ab | 5.4 ± 0.3 bc | 68.6 ± 3.6 bc |
| ICBA-4 | 26 ± 3 a | 53.0 ± 0.6 cd | 5.0 ± 0.4 c | 85.7 ± 5.0 ab |
| ICBA-8 | 38 ± 8 a | 50.0 ± 0.6 d | 6.2 ± 0.5 abc | 91.4 ± 4.6 a |
| ICBA-9 | 43 ± 5 a | 55.0 ± 0.3 bc | 7.6 ± 0.5 a | 80.0 ± 2.8 abc |
| ICBA-10 | 45 ± 3 a | 60.0 ± 1.3 a | 7.7 ± 0.5 a | 82.9 ± 4.4 ab |
| Overall mean | 37 | 55.2 | 6.5 | 78.6 |
| Ftest for genotypes | NS | ** | * | * |
Publisher’s Note: MDPI stays neutral with regard to jurisdictional claims in published maps and institutional affiliations. |
© 2022 by the authors. Licensee MDPI, Basel, Switzerland. This article is an open access article distributed under the terms and conditions of the Creative Commons Attribution (CC BY) license (https://creativecommons.org/licenses/by/4.0/).
Share and Cite
Lyra, D.-A.; Raman, A.; Hozayen, A.; Zaaboul, R.; Abou-Zaid, F.O.; El-Naggar, A.; Mansoor, S.; Mahmoudi, H.; Ammar, K. Evaluation of Salicornia bigelovii Germplasm for Food Use in Egypt and the United Arab Emirates Based on Agronomic Traits and Nutritional Composition. Plants 2022, 11, 2653. https://doi.org/10.3390/plants11192653
Lyra D-A, Raman A, Hozayen A, Zaaboul R, Abou-Zaid FO, El-Naggar A, Mansoor S, Mahmoudi H, Ammar K. Evaluation of Salicornia bigelovii Germplasm for Food Use in Egypt and the United Arab Emirates Based on Agronomic Traits and Nutritional Composition. Plants. 2022; 11(19):2653. https://doi.org/10.3390/plants11192653
Chicago/Turabian StyleLyra, Dionysia-Angeliki, Anitha Raman, Aly Hozayen, Rashyd Zaaboul, Fouad O. Abou-Zaid, Ahmed El-Naggar, Sherine Mansoor, Henda Mahmoudi, and Khalil Ammar. 2022. "Evaluation of Salicornia bigelovii Germplasm for Food Use in Egypt and the United Arab Emirates Based on Agronomic Traits and Nutritional Composition" Plants 11, no. 19: 2653. https://doi.org/10.3390/plants11192653