Article

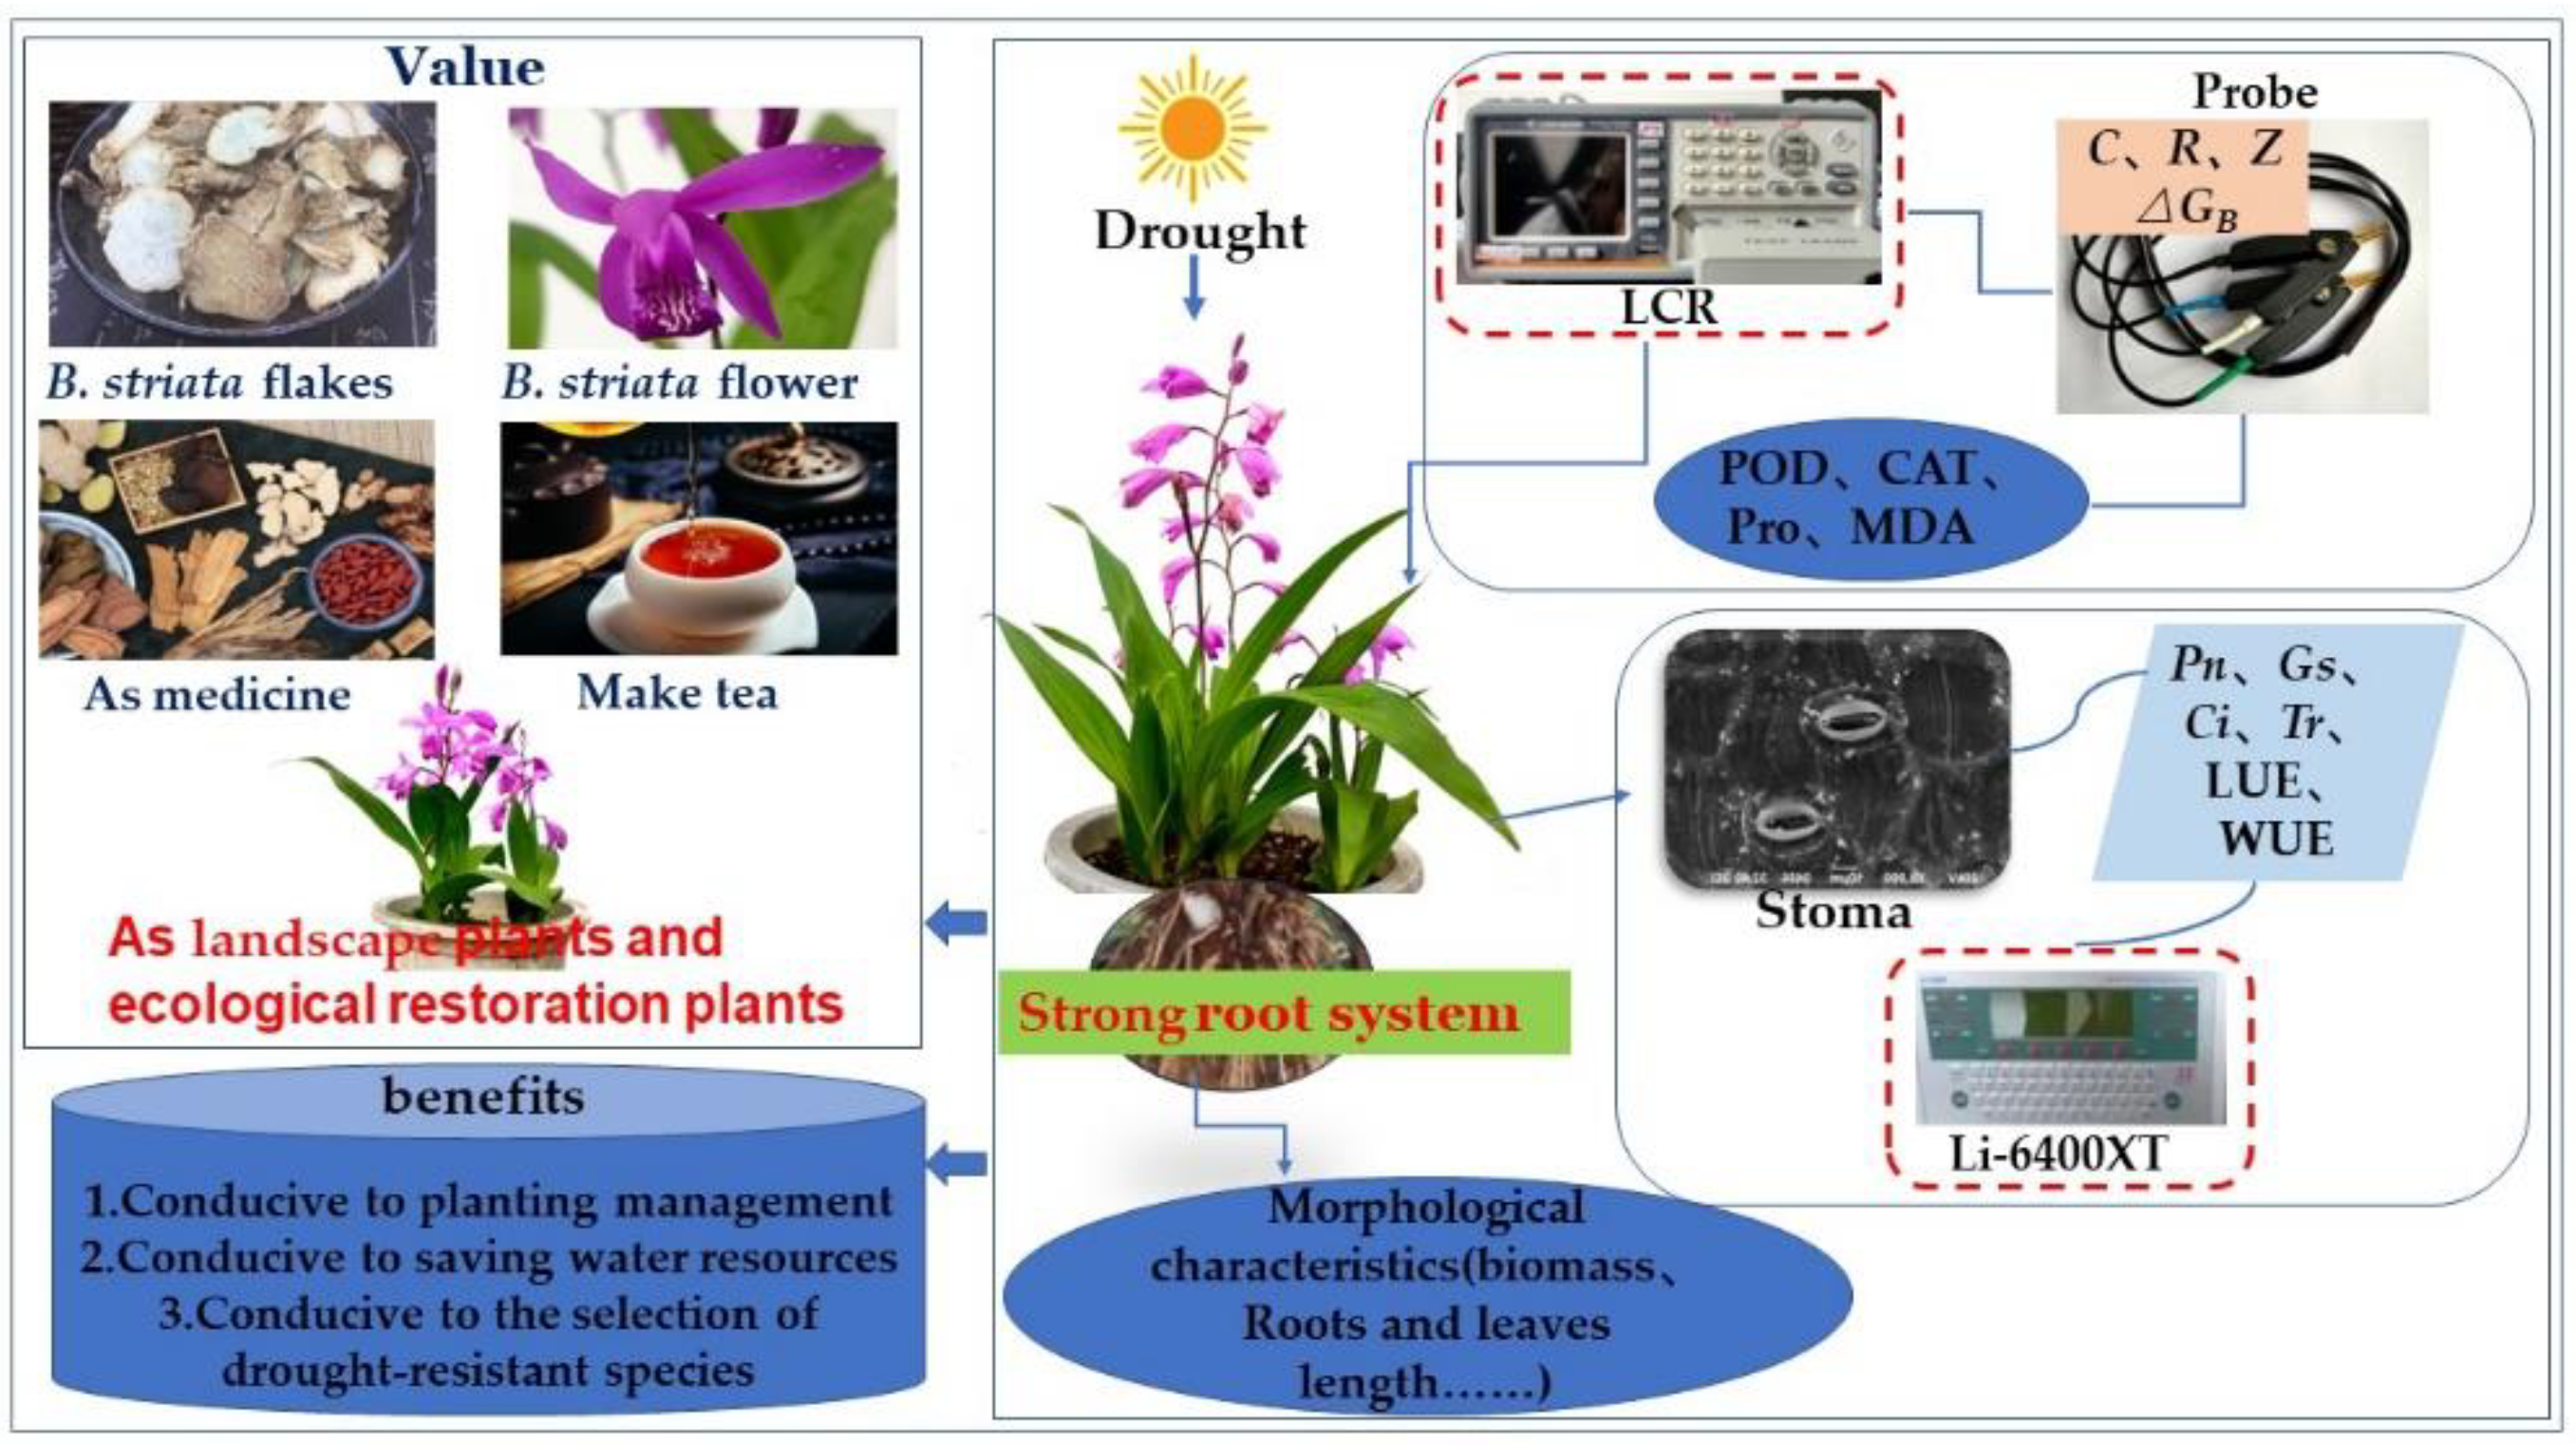
Response of Bletilla striata to Drought: Effects on Biochemical and Physiological Parameter Also with Electric Measurements

1
Key Laboratory for Information System of Mountainous Area and Protection of Ecological Environment of Guizhou Province, Guizhou Normal University, Guiyang 550001, China
2
State Key Laboratory of Environmental Geochemistry, Institute of Geochemistry, Chinese Academy of Sciences, Guiyang 550081, China
*
Authors to whom correspondence should be addressed.
These authors contributed equally to this work and should be considered co-first authors.
Plants 2022, 11(17), 2313; https://doi.org/10.3390/plants11172313
Submission received: 14 July 2022 / Revised: 29 August 2022 / Accepted: 30 August 2022 / Published: 4 September 2022
(This article belongs to the Section Plant Response to Abiotic Stress and Climate Change)

Abstract

:
In heterogeneous landscapes with temporary water deficit characteristics in southwestern China, understanding the electrophysiological and morphological characteristics of Bletilla striata under different water conditions can help to better evaluate its suitability for planting plants in specific locations and guide planting and production. Using B. striata seedlings as experimental materials, the maximum field capacity (FC) was 75–80% (CK: control group), 50–60% FC (LS: light drought stress), 40–45% FC (MS: moderate drought stress), and 30–35% FC (SS: severe drought stress). In terms of physiological response, the activities of peroxidase (POD) and catalase (CAT) decreased under drought conditions, but the activity was well under the LS treatment, and the contents of proline (Pro) and malondialdehyde (MDA) increased. In terms of morphological responses, under drought conditions, root lengths of the rhizomes (except the LS treatment) were significantly reduced, the leaf lengths were reduced, and the biomass was significantly reduced. The stomatal size reached the maximum under the LS treatment, and the stomatal density gradually decreased with the increase in drought degree. In terms of electrophysiological responses, drought significantly decreased the net photosynthetic rate (PN) of B. striata, stomatal conductance (gs), and transpiration rate (Tr), but effectively increased the water use efficiency (WUE). The effective thickness of leaves of B. striata increased under drought conditions, and drought promoted the formation of leaf morphological diversity. Our results showed that drought stress changed the physiological and morphological characteristics of B. striata, and under light drought conditions had higher physiological activity, good morphological characteristics, higher cellular metabolic energy and ecological adaptability. Appropriate drought can promote the improvement of the quality of B. striata, and it can be widely planted in mildly arid areas.

1. Introduction

The degree and duration of drought affect the survival and development of plants [1,2,3], so the ability of plants to withstand water stress is crucial. With global climate change, drought has become an important factor for restricting global economic development and leads to declines in crop yields [4,5,6]. The response and adaptive characteristics of plants to the environment in the early stage of growth are important prerequisites for screening suitable pioneer plant populations and building a robust, stable and complex ecosystem. Ecological restoration species often choose species with strong drought resistance and growth ability, and water deficit prevents plants from maintaining normal growth, especially in the seedling stage of plants [7]. Therefore, those plants that use less water to grow are preferentially selected for land reclamation in arid areas. Drought reduces the morphological and physiological traits, reduces the leaf water potential [7] and saps movement due to alternation of xylem anatomical features in the plants, increases the content of osmotic substances in plants [8], affects the plant lactones [2], cell ion state, osmotic pressure [8,9], and reduces plant photosynthetic rate [5,10].
The mechanism of drought tolerance is very complex and when activated at different stages of plant development, it involves many physiological and biochemical processes at the cell, tissue, organ and whole plant level [6,11]. At the morphological level, drought has the greatest impact on stems and roots. Since roots are the only organ for plants to obtain water from soil, root length, leaf size and leaf biomass are common morphological traits related to drought resistance [12]. Under drought conditions, plants usually limit the number and area of leaves, thereby reducing biomass to maintain the water budget balance [13]. Biomass and root length are the most intuitive responses of plants to drought stress [3,14]. Deep and thick roots are conducive to water absorption [15,16], while small and thick leaves are more conducive to reducing leaf surface temperature [12,17]. In response to drought, plants evolved antioxidants and secondary metabolites to improve drought resistance [7]. For example, Pro plays an important role as an effective regulatory substance in plants, which can prevent cell dehydration and increase the concentration of cell fluid [18]. In addition, osmoregulation may provide seedlings with an ecological advantage to maintain plant metabolic activity under suboptimal conditions when roots have not yet reached deep soil moisture [19]. Drought stress reduces photosynthesis by reducing the unit leaf area and photosynthetic rate, which is mainly due to stomatal closure or metabolic disorders. Higher WUE is associated with stomatal conductance and stomatal opening and closing to reduce transpiration [16]. In this study, we investigated the medicinal value [20] and ornamental value of orchid Bletilla striata (Thunb. ex A. Murray) Rchb. f. (Figure 1), which is rich in polysaccharides and has the effects of hemostasis, swelling, and enhancement of body functions [21], is mainly used as a biomaterial in the medical field [22], and has a well-developed root system, and is often used for ecological restoration in the Karst area of Southwest China.
Electrophysiological indicators can represent the drought tolerance of plants and are widely used to detect the drought tolerance of plants [23]. Electrophysiology is an experimental method for electrical measurement and manipulation of living cells, living tissues and individuals. The earliest research on plant electrophysiology was made in 1873 by Sanderson, who discovered the transmission of electrical signals in the sensitive hairs of Dionaea Muscipula [24]. When plants are exposed to environmental or external stimuli, the electrical signals generated by plants are a direct response to environmental and external stimuli [25,26]. The plant defense strategy starts from the plasma membrane of plant cells. Biotic and abiotic interference induces chemical interactions of volatile organic compounds, triggering plant signal molecules, and imbalance of ion flux generated by plant plasma membrane in the sensing area. Such different charge distributions generate changes in the transmembrane potential [27]. When plants are subjected to water stress [28], the effects of these stressors on plants can be expressed by the plant electrical signals [29,30,31]. For example, leaf water potential [28], photosynthetic characteristics [23] and physiological capacitance (C) [24] of plants under drought stress were measured to quickly detect the growth state of plants under drought [5,28]. On the other hand, the energy required for plant growth and development is called the metabolizable energy of plant cells [32], which is the main form of energy to sustain life activities [33]. It reflects a series of assimilation and alienation processes in plants, including hydrogen exchange, assimilation and utilization of inorganic matter, synthesis and transformation of organic matter and energy, and all other physiological and biochemical processes in the body [34]. Plant action potential, physiological capacitance and physiological resistance (R) [24] and other indicators are important parameters for the study of plant electrophysiology. Using the Nernst equation, the chemical energy in cells can be expressed in the form of electrical energy. The changes of electrophysiological indicators reflect the changes in the metabolic energy of plant leaf cells to a certain extent, and can also reflect the ability of plants to resist stress under different stress [23,26,28]. Therefore, the electrophysiological characteristics of plants can be used to judge the adverse reactions of plants under adverse environmental conditions [25,35,36], which provides another method for the determination of the drought resistance of plants [37].
Karst habitats are highly heterogeneous, with high porosities of stratified limestone and low water retention capacities, which cause them to be highly susceptible to drought and pose a threat to plant growth [38]. In the context of decreasing global water resources, determining the optimal soil moisture content, and the corresponding status of B. striata can ensure precise irrigation amounts to maximize water conservation. Therefore, this study analyzed the response characteristics of B. striata seedlings to different drought treatments, established the correlation between the electrophysiological signals, plant physiology and morphological indicators of B. striata, and explored the adaptation strategies of B. striata seedlings to the drought environments. This research will help to more comprehensively understand their growth characteristics and drought tolerance under limited soil moisture conditions, thereby helping to establish a stable vegetation ecosystem in water-scarce environment in Karst areas and provide a reference for the selection of ecological restoration plants.

2. Results

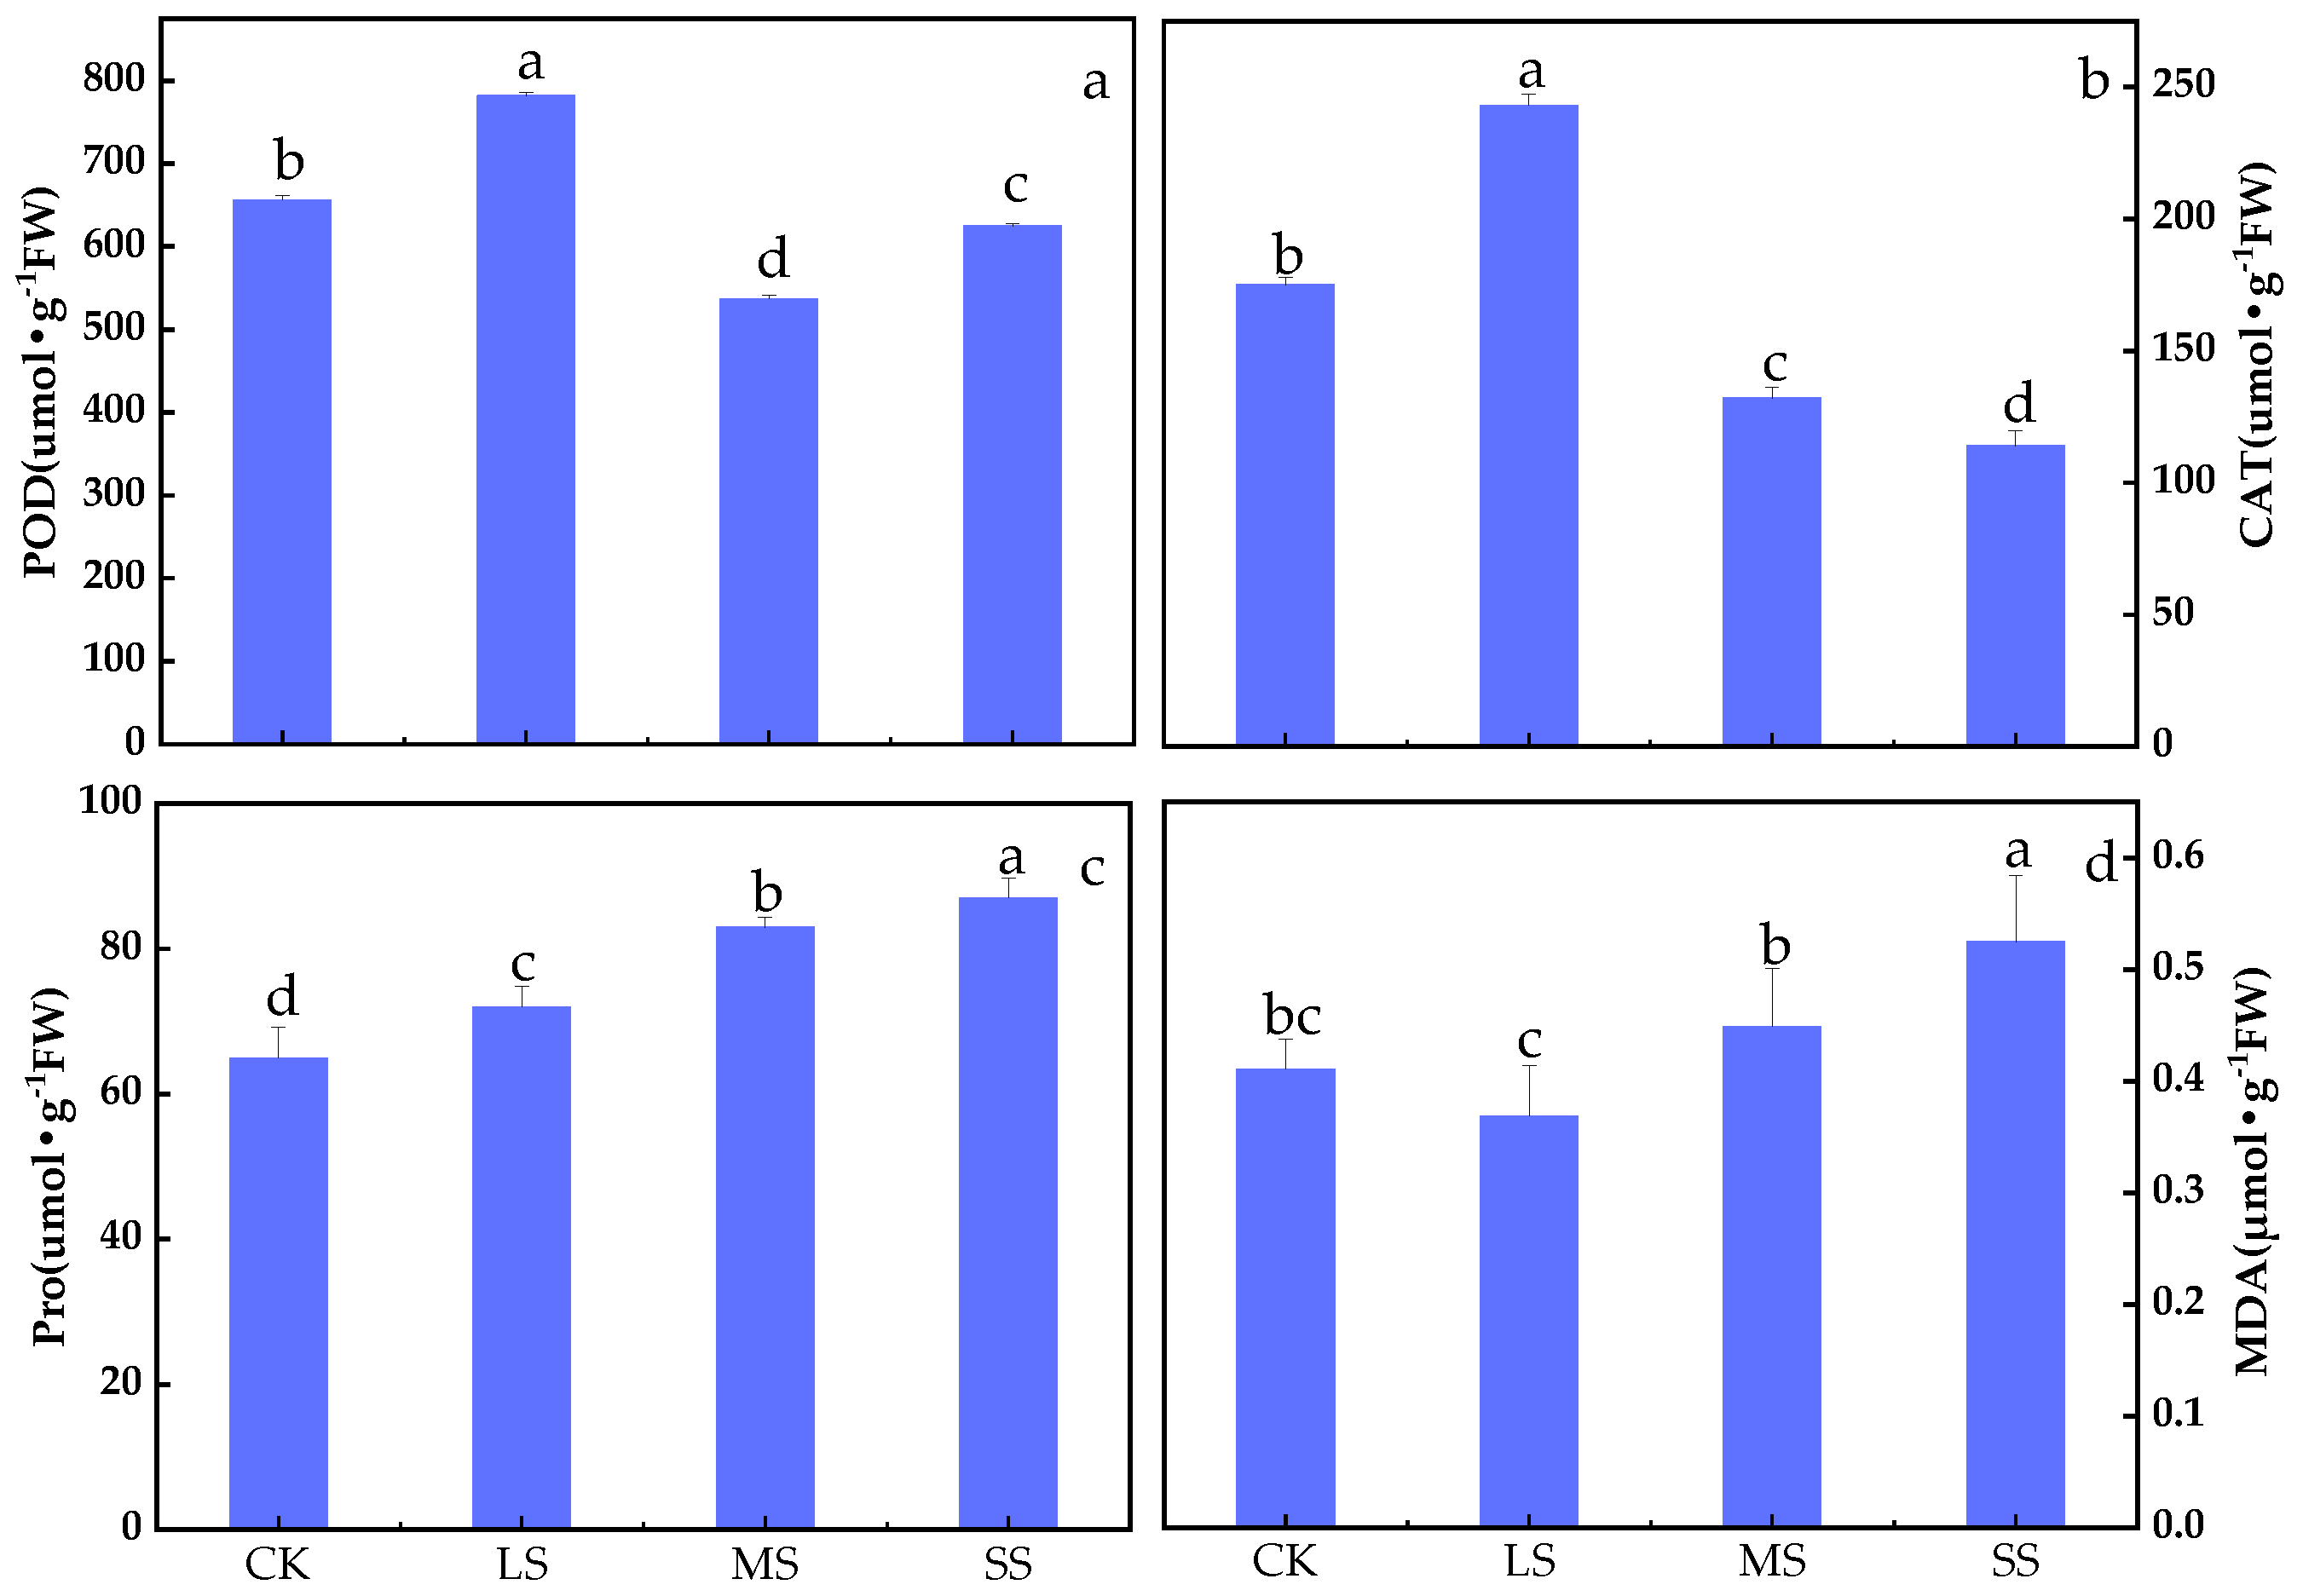
2.1. B. striata Enzyme Activity Analysis

B. striata POD activity increased under the LS treatment and decreased under the SS treatment (Figure 2a). Compared with CK, the POD activity of B. striata was highest under the LS treatment (p < 0.01) and was significantly lower under the MS and SS treatments (p < 0.01).
Figure 2b shows that the CAT activity of B. striata decreased (p < 0.01) with increasing drought. Compared with the CK, the LS treatment had the highest activity of B. striata CAT (p < 0.01), and the CAT activity was lowest under the SS treatment (p < 0.01), which showed that drought stress decreased the CAT activity.
Drought stress promoted the production of B. striata Pro (p < 0.01). Figure 2c shows that the B. striata Pro contents exhibited a gradual increase with increasing drought, with the highest Pro contents occurring in the SS treatment group and the lowest Pro contents occurring in the CK.
Figure 2d shows that the B. striata MDA contents gradually increased (p < 0.05). Compared with the CK, the LS treatment had a lowest MDA content, but the difference relative to the CK was nonsignificant (p > 0.05). The SS treatment had a highest MDA content, and the differences between the CK, LS and MS treatments were significant (p < 0.05).

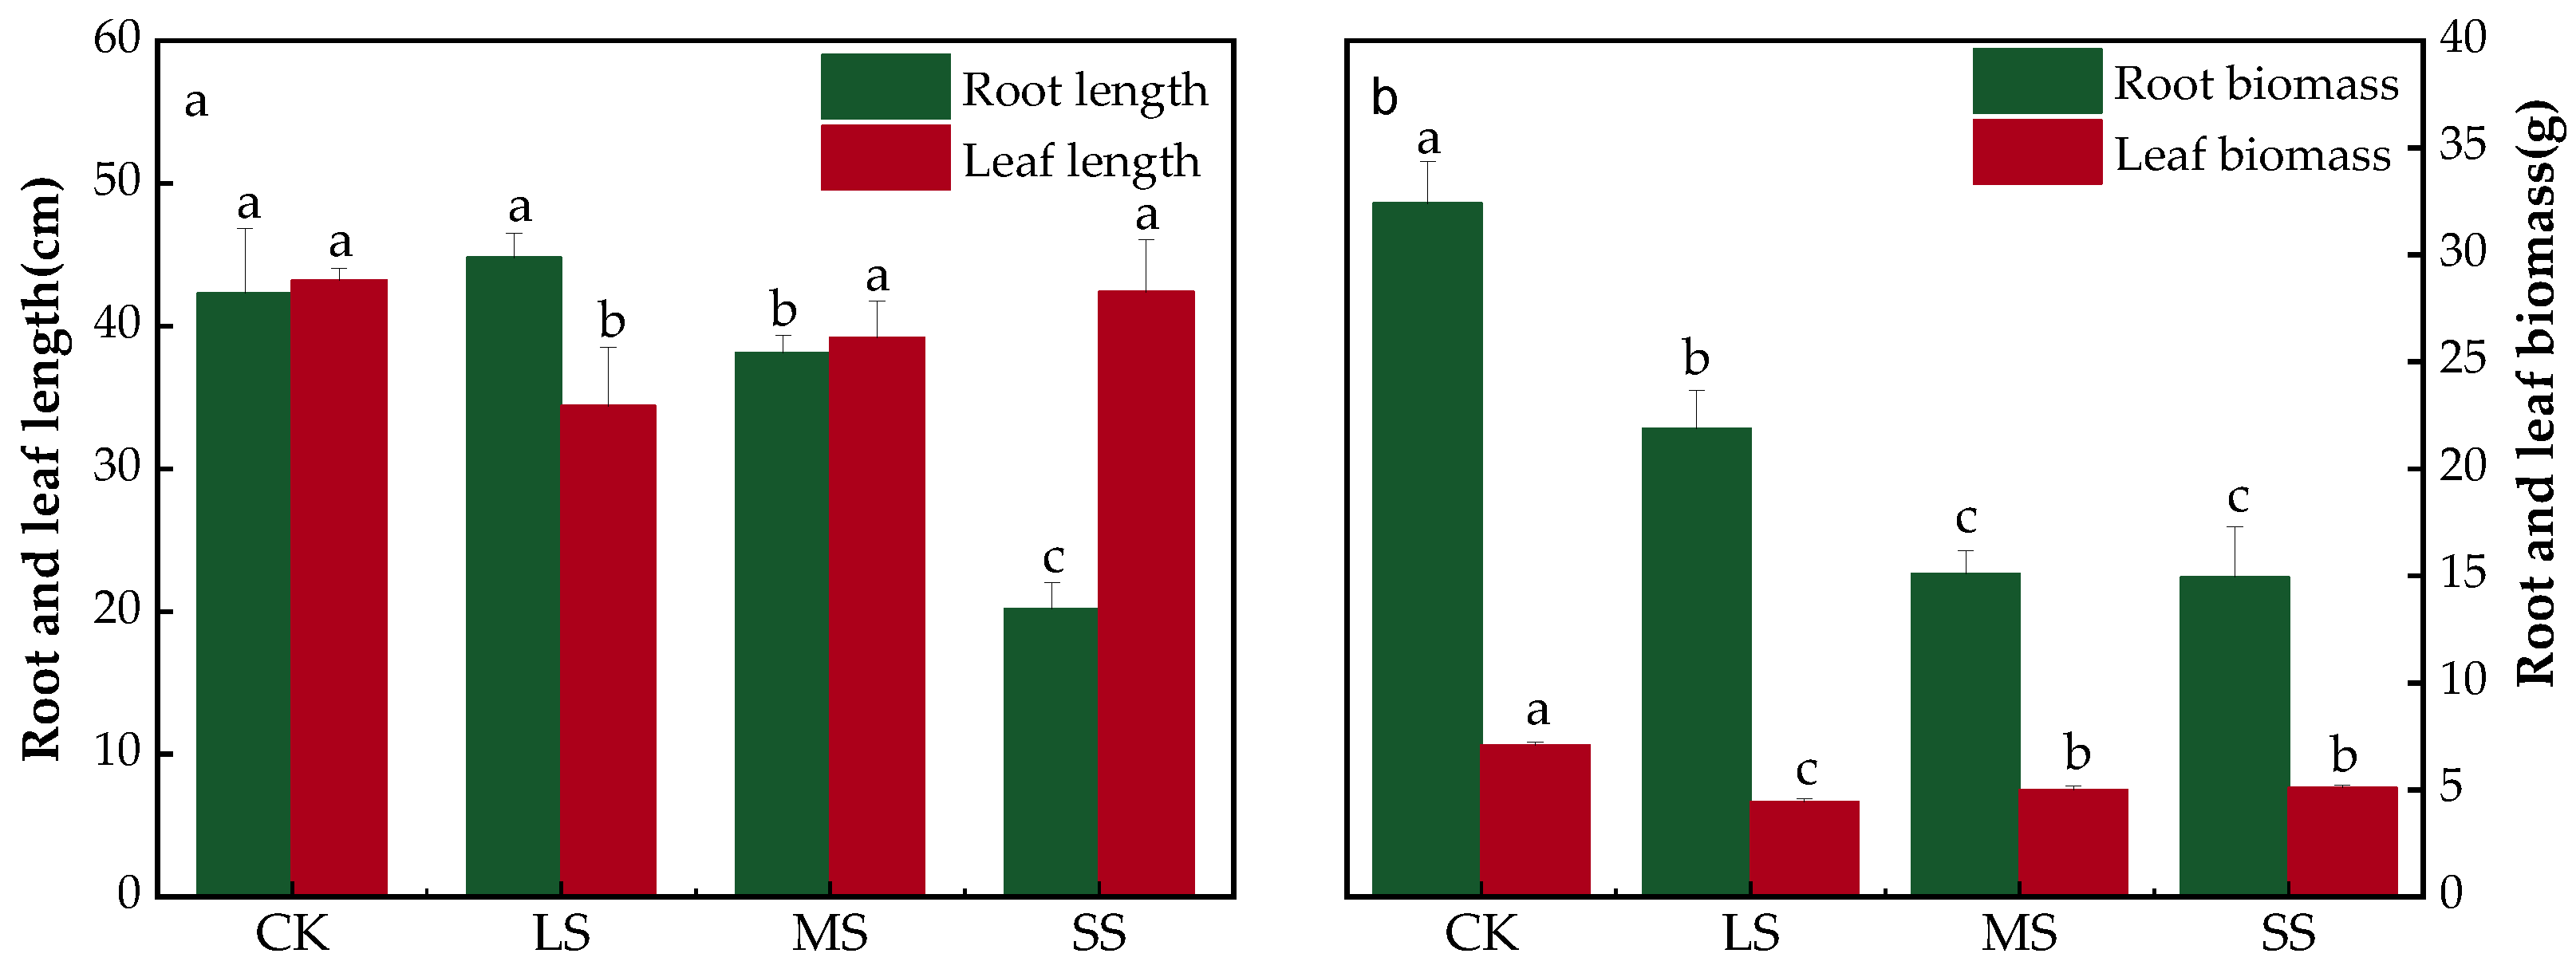
2.2. B. striata Root Lengths and Biomass Analysis

Drought stress significantly inhibited the elongation of B. striata root lengths. Compared with the CK, the root lengths of B. striata were elongated under the LS treatment, but the difference was nonsignificant (p > 0.05), while the root lengths became shorter under the MS (p < 0.05) and SS treatments (p < 0.01), which were significantly different from the CK (Figure 3a). Drought stress significantly inhibited B. striata leaf lengths (p < 0.05). Compared with the CK, the lengths of B. striata leaves became shorter in the LS, MS and SS treatments, but with an intensification in drought conditions, the lengths of leaves exhibited an elongation trend, and the overall performance was in the order of SS > MS > LS (Figure 3a).
Drought stress significantly reduced the biomass of the roots and leaves of B. striata (p < 0.01). Compared to the CK, the biomass of B. striata significantly decreased under the LS, MS and SS treatments (p < 0.05) (Figure 3b).

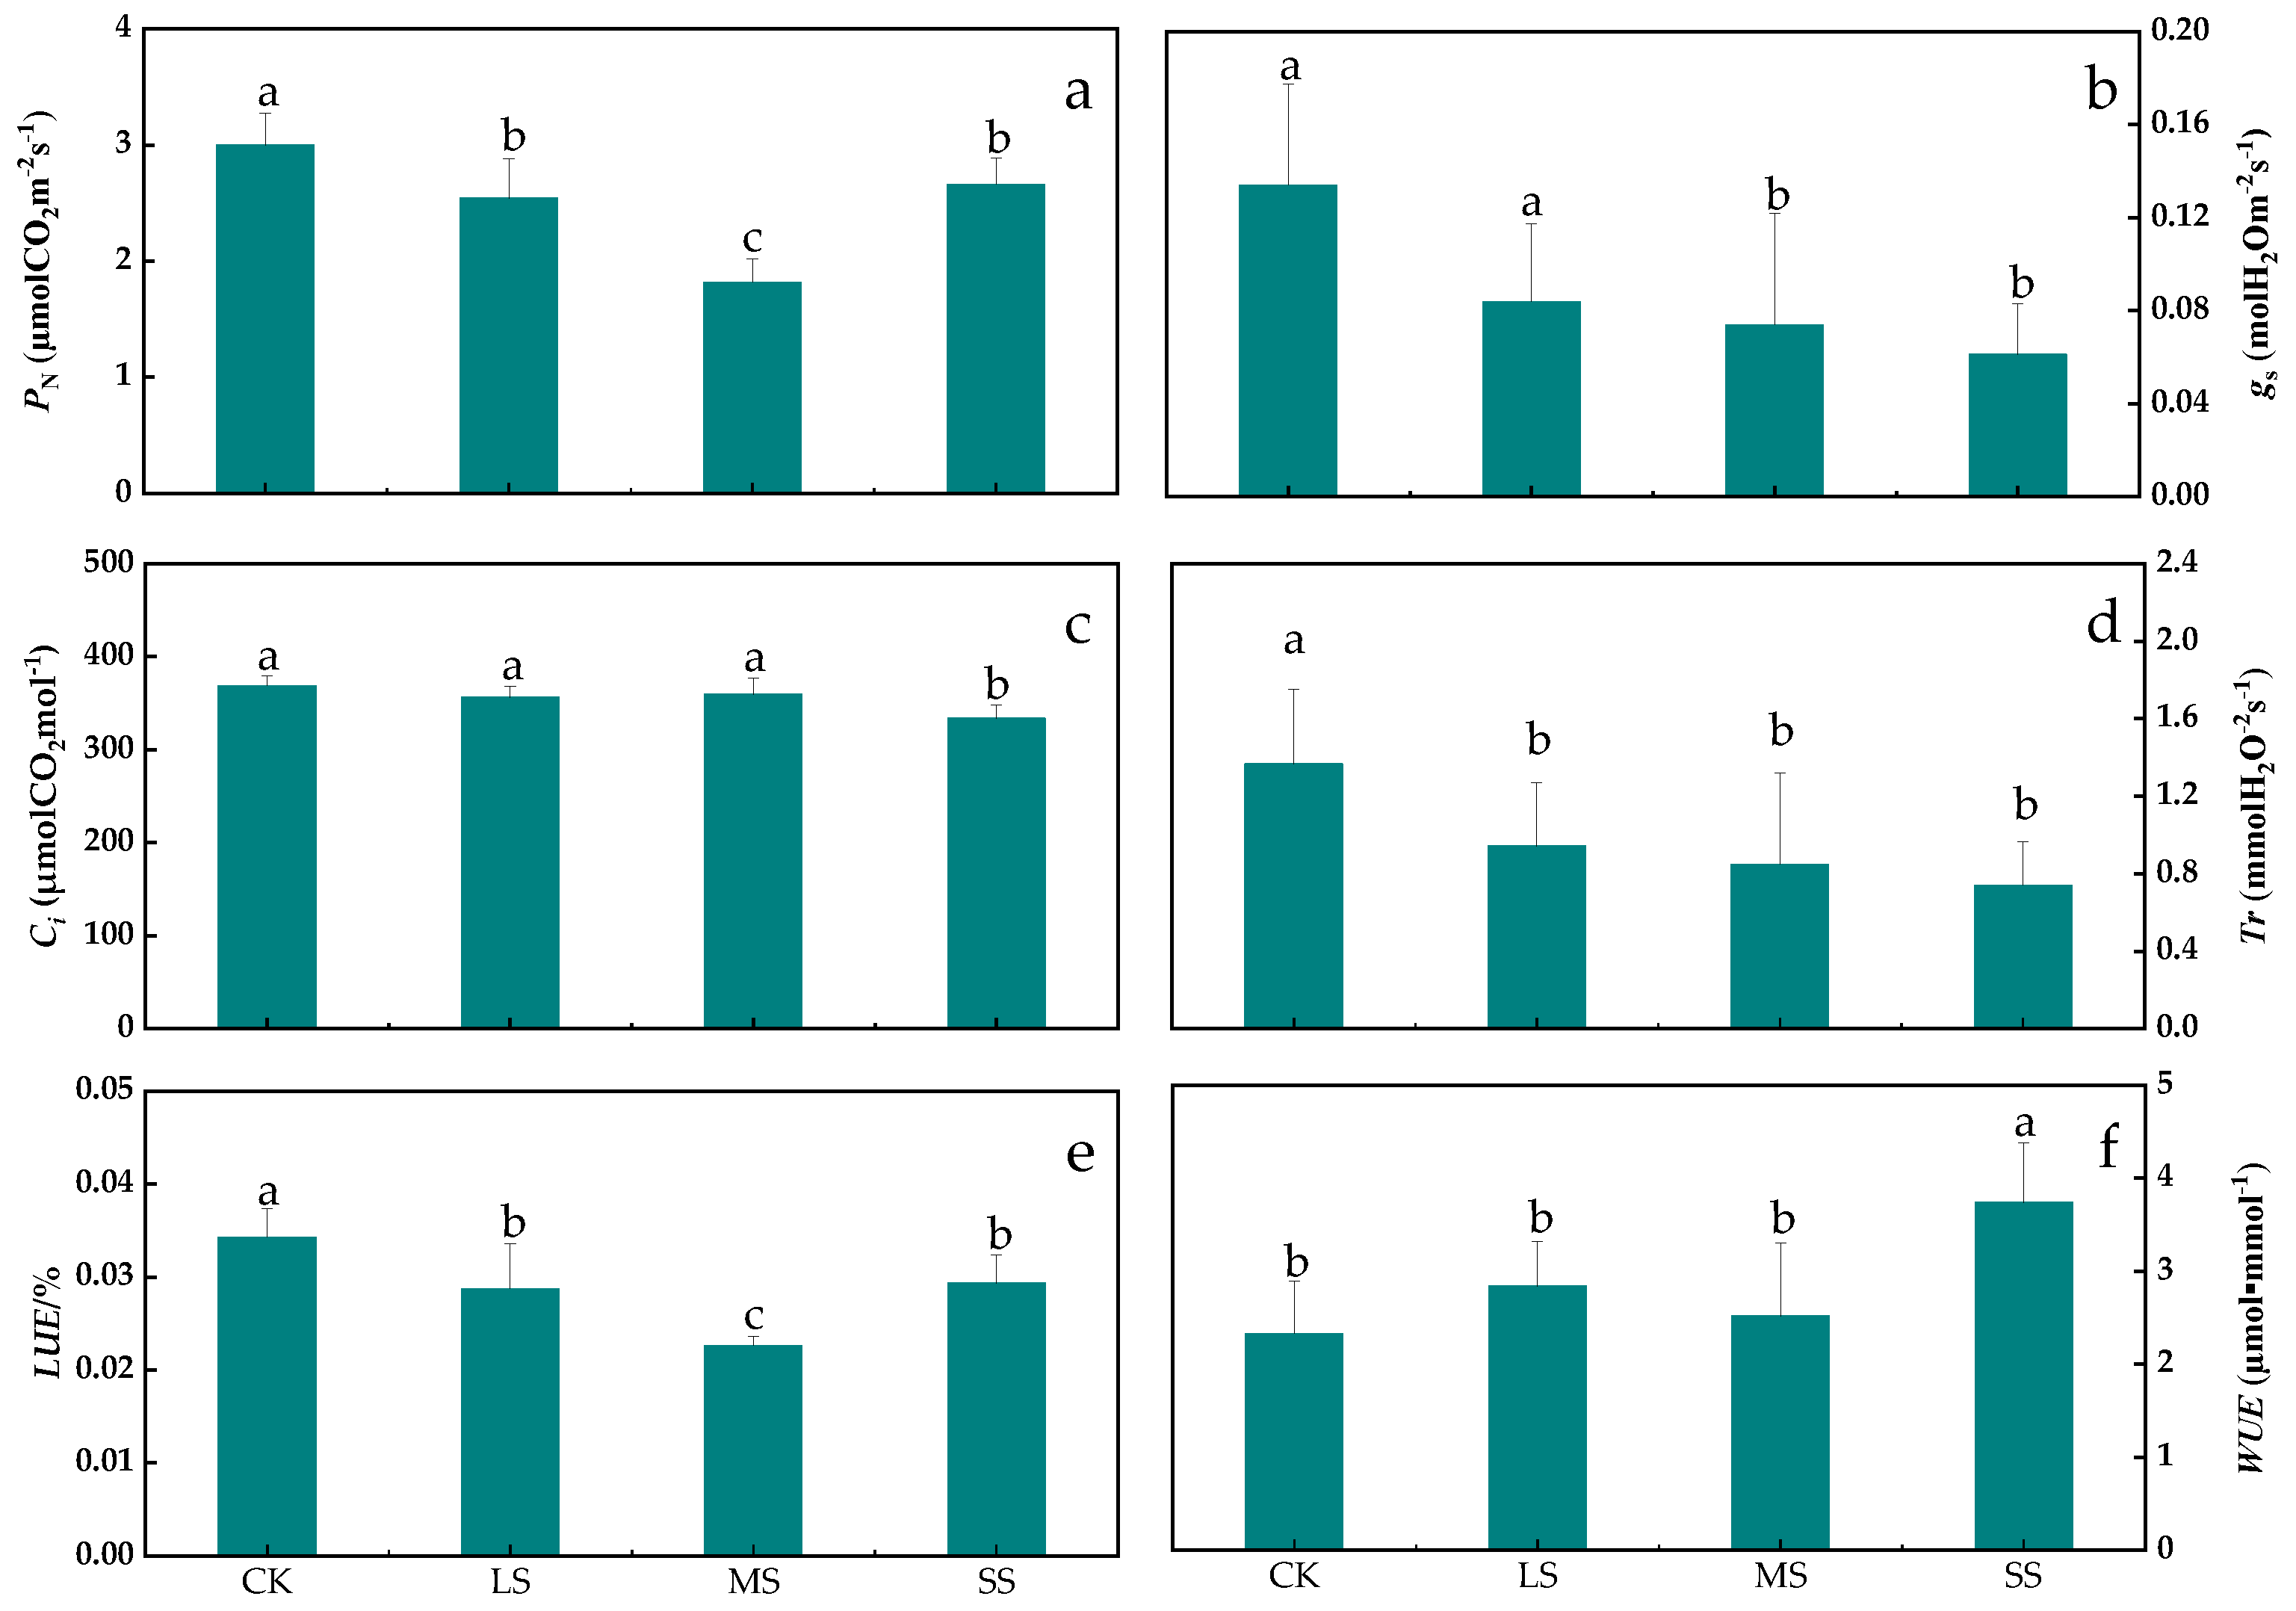
2.3. Analysis of B. striata Photosynthetic Characteristics

Drought affected the photosynthetic characteristics of B. striata to different degrees (Figure 4). Drought stress significantly affected the PN of B. striata (p < 0.01). The PN under the LS, MS, and SS treatments were significantly lower than that under the CK, with the highest rate occurring under the SS treatment and the lowest rate occurring under the MS treatment (Figure 4a). Drought stress significantly reduced the gs of B. striata (p < 0.05), while the gs was highest for the LS treatment, but was not significantly different from that of the CK and was lowest for the SS treatment, which was significantly different from the CK (Figure 4b). Drought stress significantly reduced the intercellular CO2 concentrations (Ci) in B. striata (p < 0.01); the Ci in the LS, MS and SS treatment were lower than that in the CK, while the lowest value was for SS treatment, which differed significantly from the CK, LS, and MS treatments, and indicated that drought stress began to suppress the Ci (Figure 4c). The B. striata Tr gradually decreased with increasing drought gradients (p < 0.05); the B. striata Tr under the LS, MS and SS treatments were significantly lower than that for the CK, and this result indicated that drought stress caused it to reduce Tr to retain leaf water (Figure 4d).
Drought stress significantly reduced the light use efficiency (LUE) of B. striata (p < 0.01). The LUE under the LS, MS and SS treatment were significantly lower than that of the CK; the highest LUE was observed for the SS treatment and the lowest was observed for the MS treatment, which was significantly different from that of the CK (Figure 4e). Drought stress significantly affected the B. striata WUE (p < 0.05) and when compared to the CK, both of the WUE under the drought adversity treatments were higher than that under the CK, while the highest WUE occurred for the SS treatment (Figure 4f).

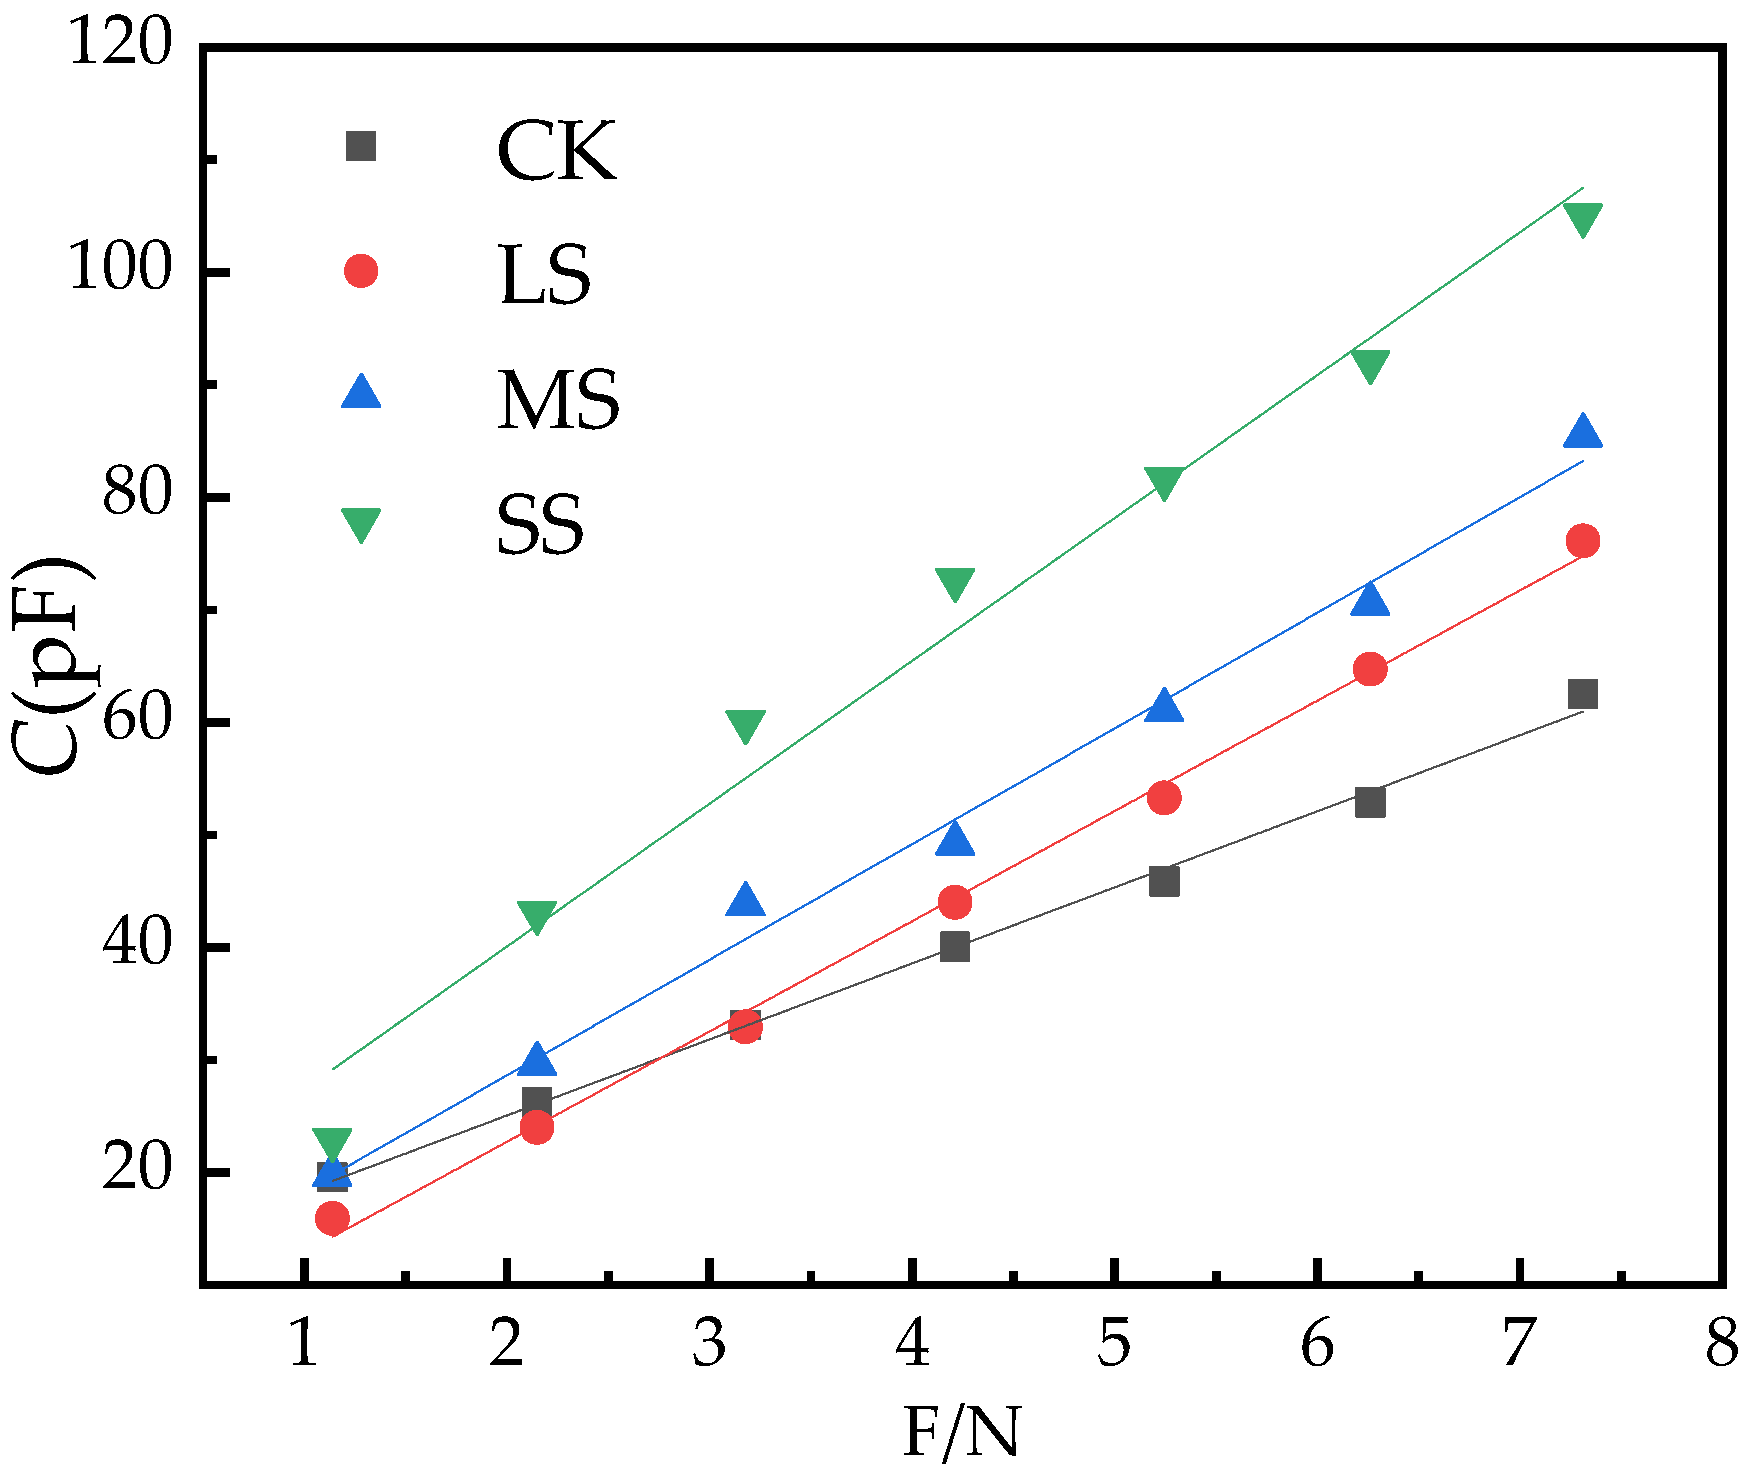
2.4. B. striata Physiological Capacitance Model

As the clamping force F increases, the C of the B. striata leaves increases, and the C changes linearly with the clamping force (Figure 5).
Origin 2018 was used to dynamically fit the experimental data, obtain the parameters of   x 0   and h in the equation C = x 0 + h F , obtain the function parameters and equations of the C of the leaves and the clamping force F, and obtain the statistical data of the equation fit. The values of R2, n and p are shown in Table 1.

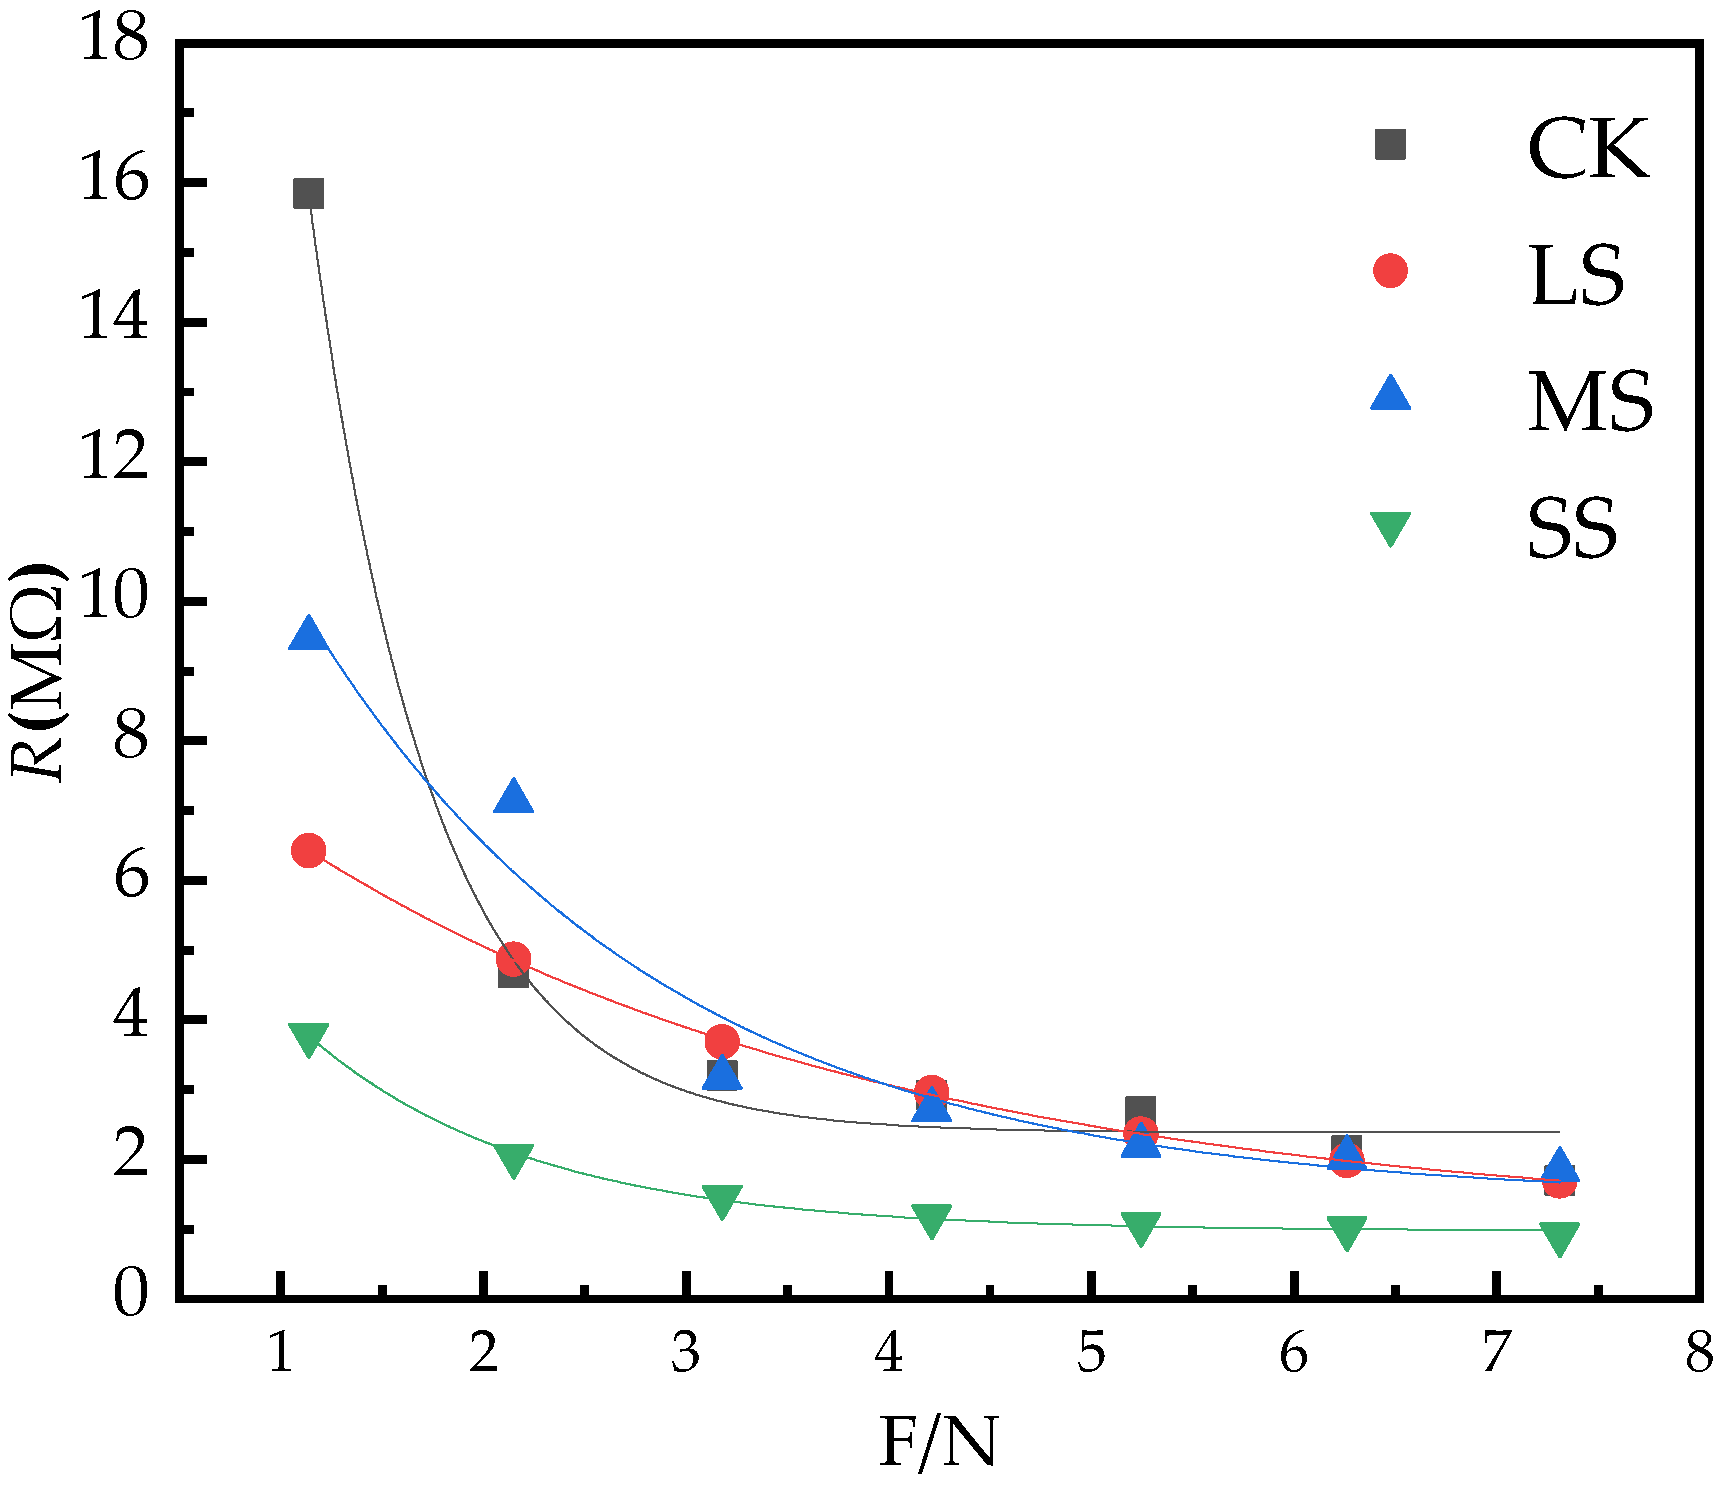
2.5. B. striata Physiological Resistance Model

As the clamping force F increases, the R of the B. striata leaves decrease, and the R decreases exponentially with the change of the clamping force F relationship (Figure 6).
Using Origin 2018 to dynamically fit the experimental data, the parameters of y0, k1 and b1 in the equation R = y0 + e b 1 F are obtained, and the R of the B. striata leaves are obtained as a function of the clamping force F parameters and equations; at the same time, the equation-fitting statistics R2, n and p values are obtained (Table 2).

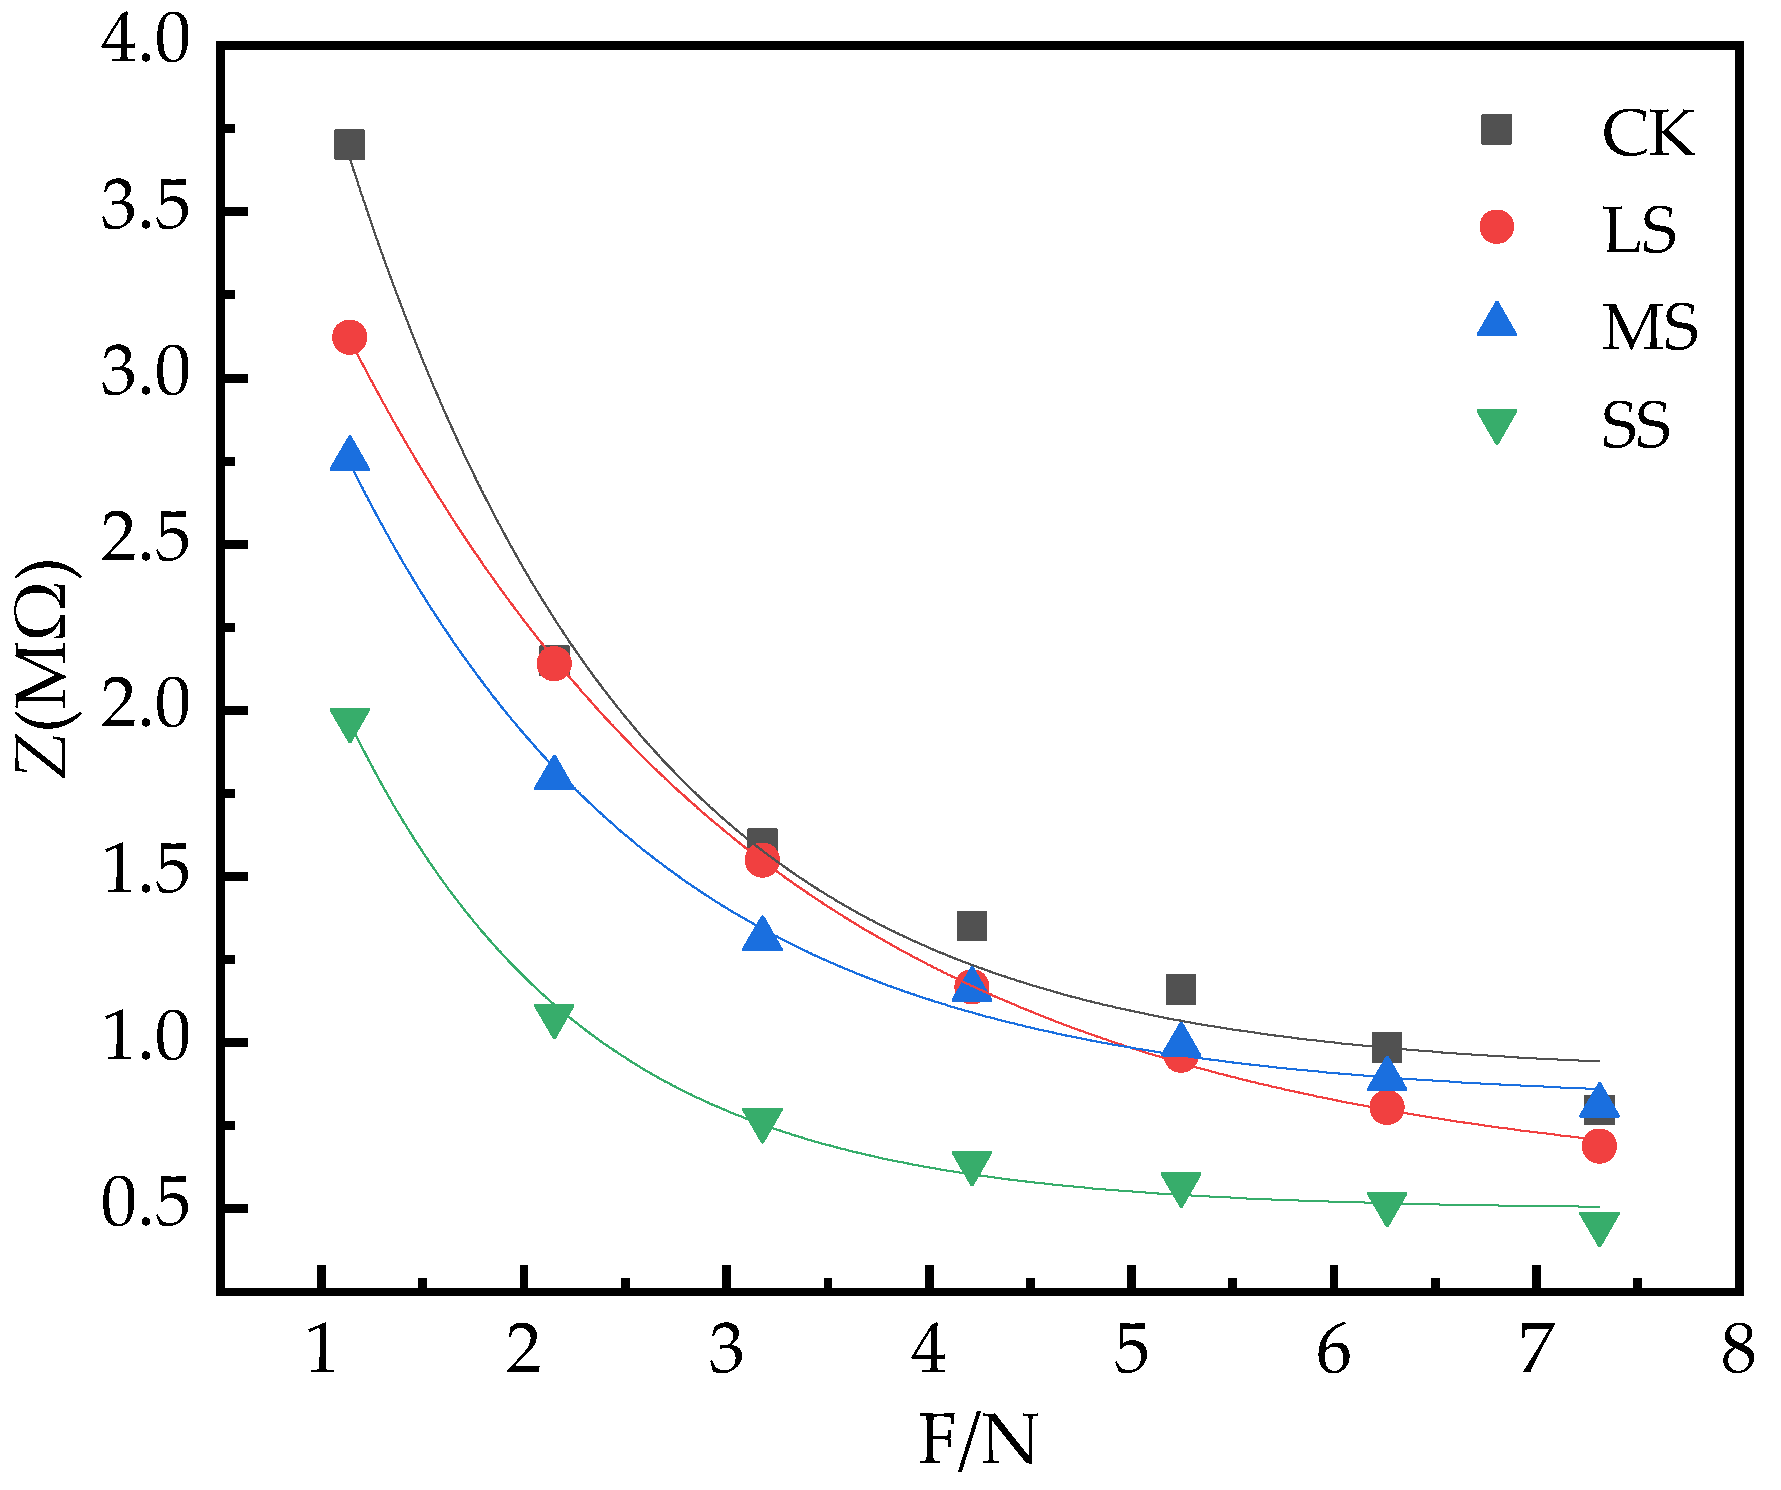
2.6. B. striata Physiological Impedance (Z) Model

As the clamping force F increases, the Z of the leaf decreases, and the Z decreases exponentially with the change of the clamping force F (Figure 7).
Origin 2018 was used to dynamically fit the experimental data, and obtain the parameters of p0, k2 and b2 in the equation Z = p0 +     e b 2 F , and obtain the Z of B. striata leaves as a function of the clamping force F parameters and equations, and simultaneously obtain the R2, n and p values that the equations fit the statistical data (Table 3).

2.7. Cell Metabolic Energy Analysis

Compared with CK, the d of LS, MS and SS treatment increased (Table 4). ΔGR-E, ΔGZ-E, ΔGR, ΔGZ and ΔGB showed a trend of first increasing and then decreasing with the aggravation of drought. Among them, the ΔGR-E, ΔGZ-E, ΔGR, ΔGZ and ΔGB of LS were larger than CK, MS and SS treatments (Table 4).

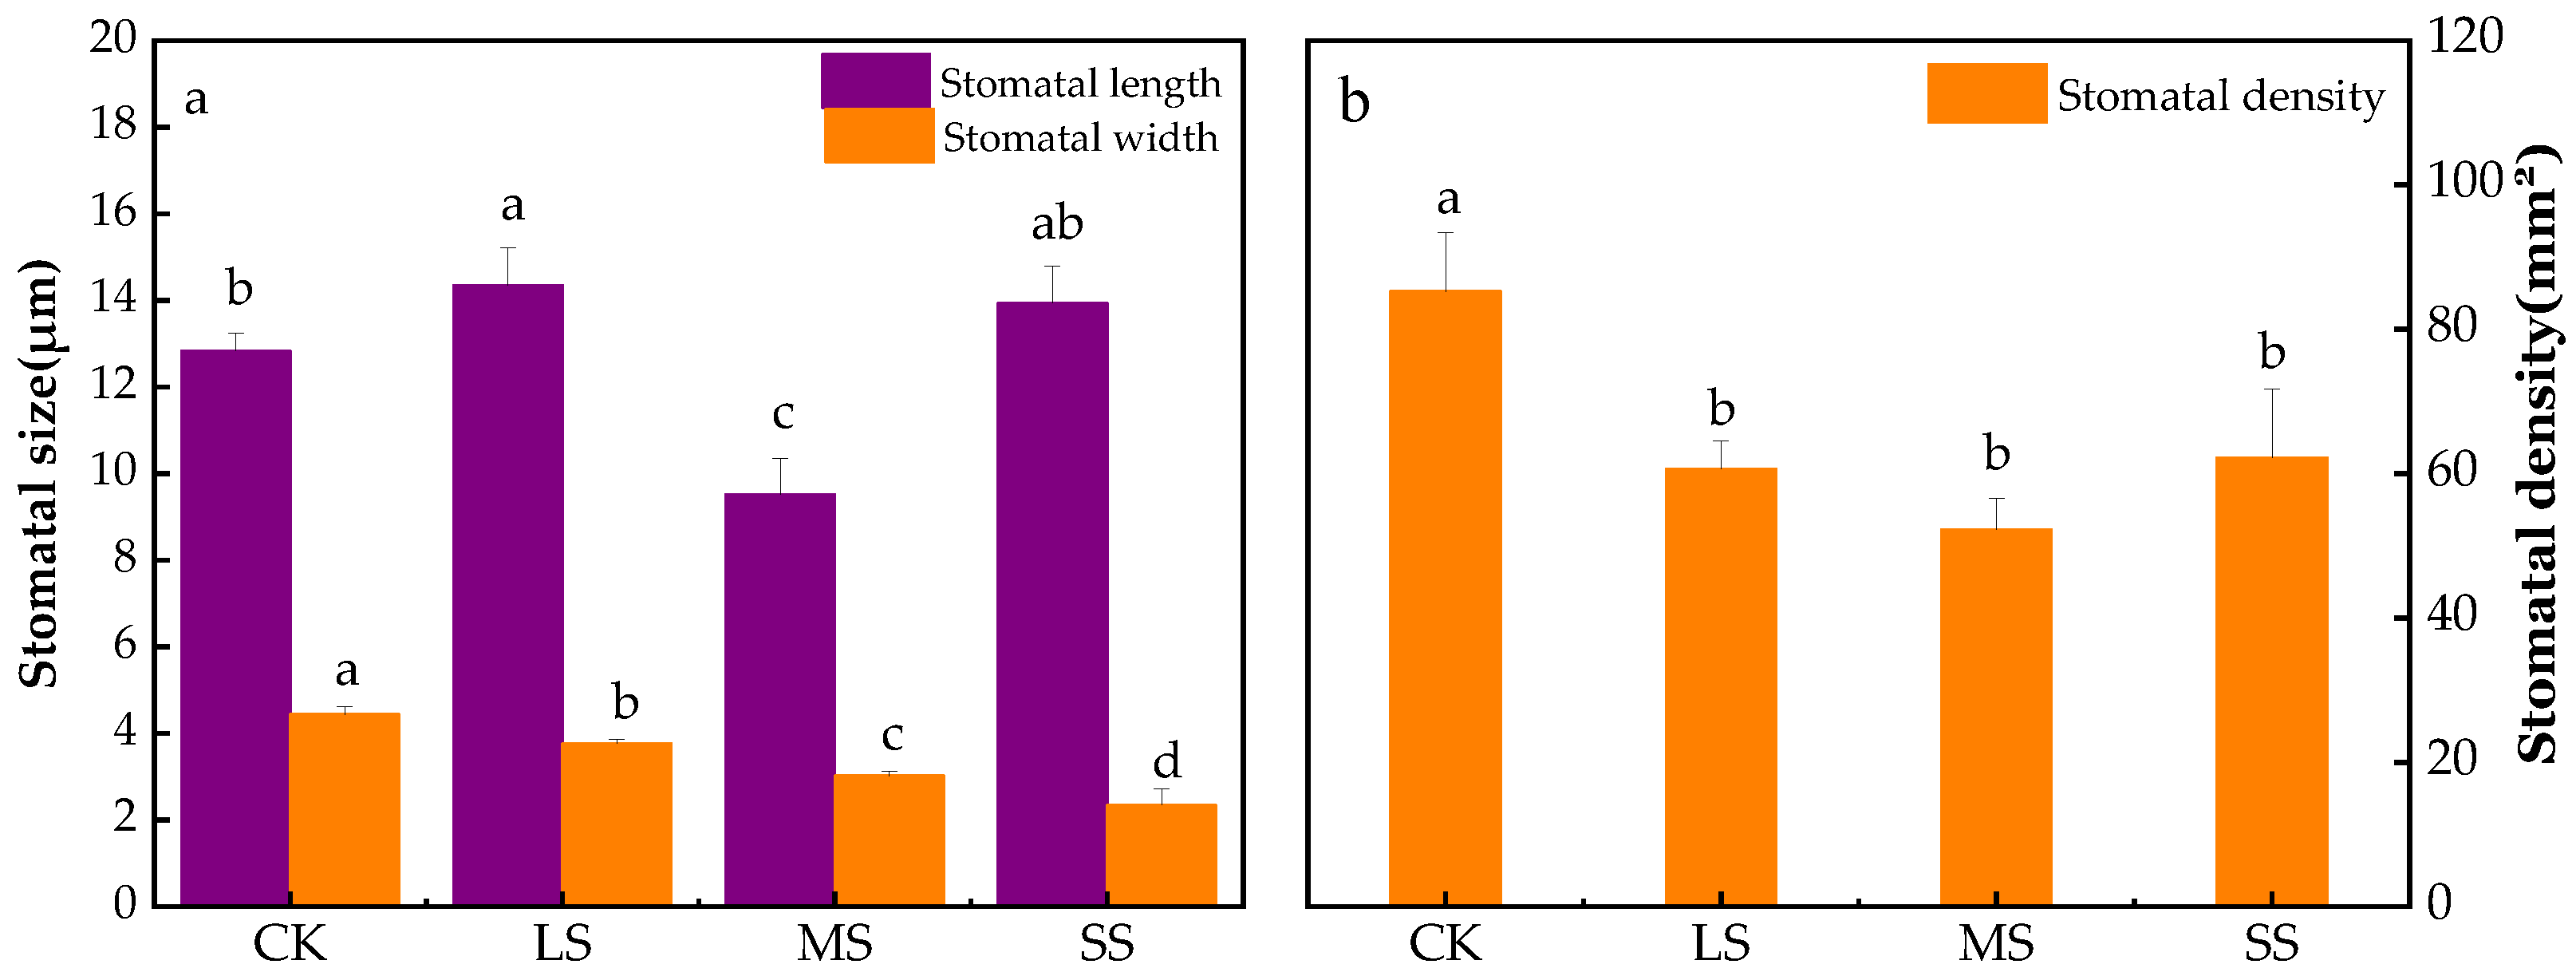
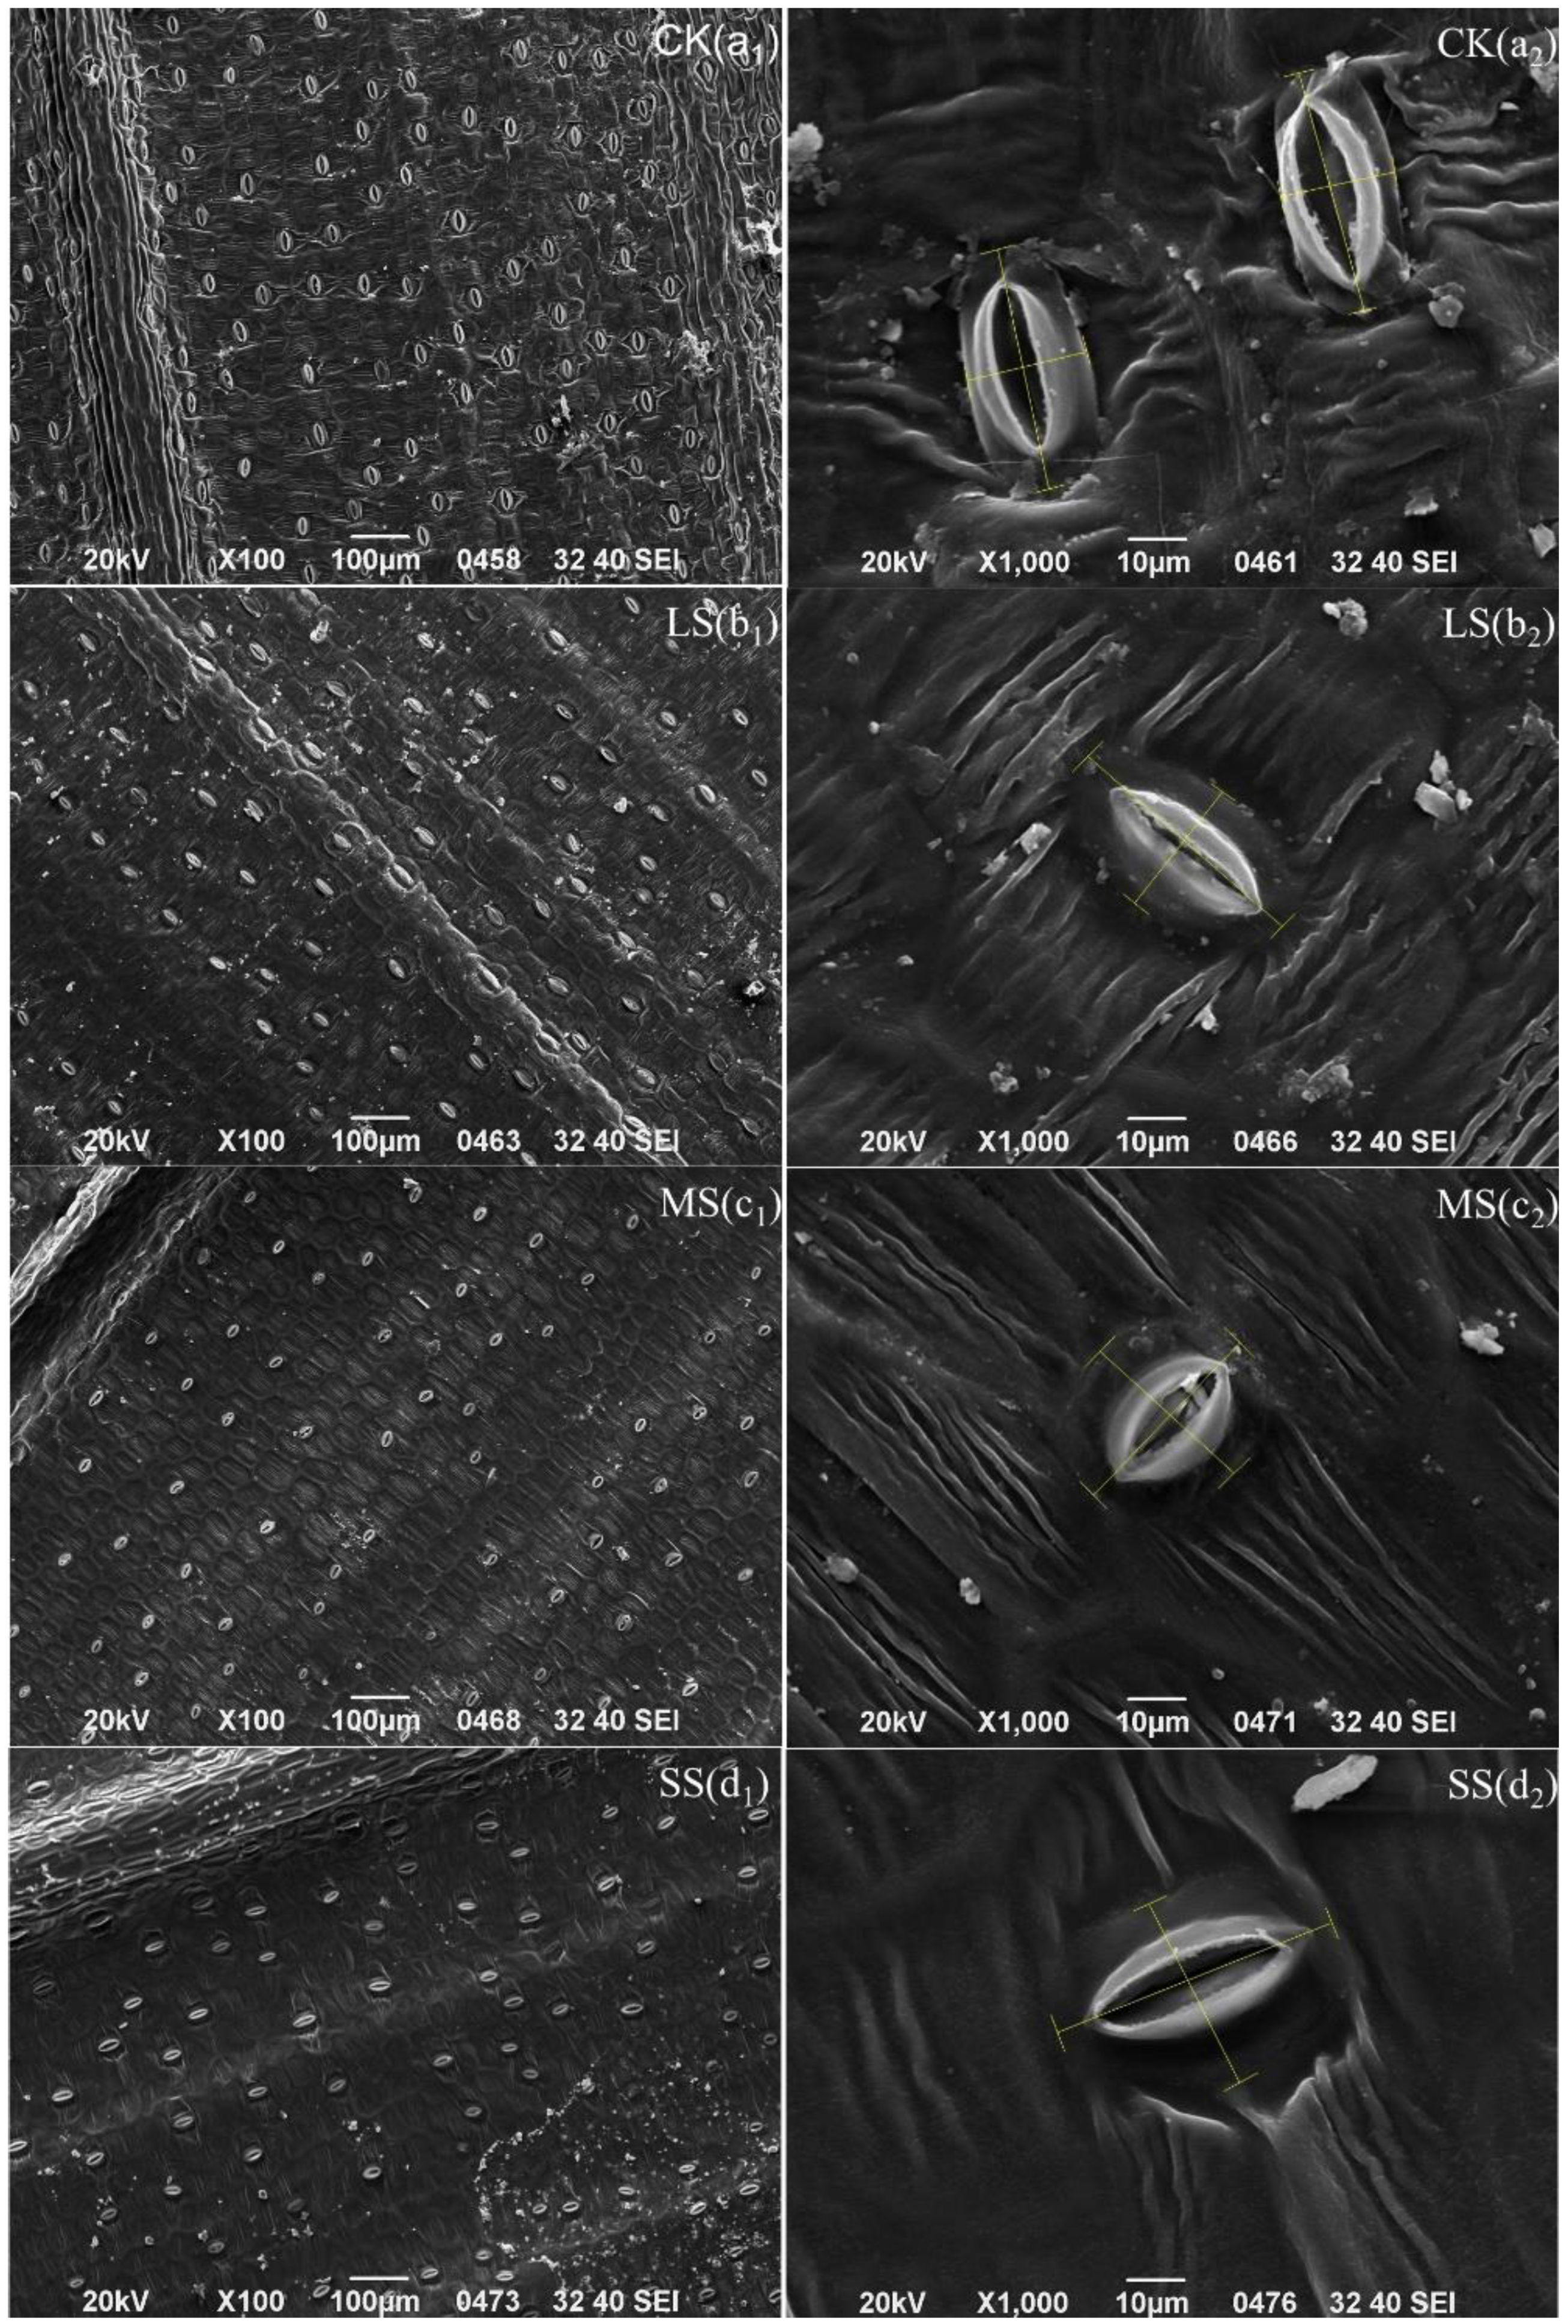
2.8. B. striata Stomatal Feature Analysis

The B. striata stomatal density of the CK was significantly higher than those of the LS, MS and SS (Figure 8 and Figure 9), while the stomatal lengths of the CK were smaller than those of the LS and SS, but the stomatal widths were significantly higher than those of the remaining treatments. Figure 9(a1,a2) shows that the veins on the back of the B. striata leaves in the CK were clear, with a dorsal texture distribution of the leaf veins, and the back pattern was more regular and pentagonal, while the stomata were distributed inversely according to the leaf veins. The leaf surfaces showed no obvious tomenta, the keratin layer was smooth, the stomata were not sunken, with a large air hole opening and closing, the stomata were surrounded by rough and uninterrupted annular or pinnate striate projections, and the stomatal apparatus projected from the epidermis and exhibited an oval shape.
The veins in the lower abaxial part of the leaves of the B. striata LS treatment were clear, the dorsal texture was distributed by the leaf veins, the back pattern was irregular and pentagonal, and the leaf surfaces had no obvious tomenta. The distribution of the B. striata stomata was more regular in the LS, and the density of the leaf stomata decreased in the LS treatment compared to the CK group (p < 0.05) (Figure 8 and Figure 9), partial stomatal closure occurred, and the stomata became narrower and longer but were shorter in width (Figure 8 and Figure 9). Wrinkling of the epidermal part of the leaf was observed in addition to a smooth and flat inner source of the arch cover inside the air hole, and the exogenous stratum corneum bulged into ridged thickening and unsmoothed into feathery interrupted enclosing stomata (Figure 9(b1,b2)).
Compared with the CK, the B. striata stomatal density of the MS treatment was significantly lower (p < 0.01), partial closure of the stomata was present, the stomatal lengths and widths were significantly shorter, the stomata were sunken with smooth and flat inner sources of the arch covers inside the air holes, the exogenous cuticle was thickened and raised into ridges, which were unevenly interrupted by plumes that surrounded the stomata, and there were increased numbers of pentagonal grain folds (Figure 9(c1,c2)).
In the SS treatment, the pattern on the back of the B. striata leaves was irregularly diamond-shaped or no longer had a specific shape, and the surface texture of the leaves gradually disappeared and crumpled significantly. The stomata near the leaf veins all showed certain degrees of shrinkage and disappearance, the stomata became narrower and longer, the stomatal widths were significantly lower than those of the CK, LS and MS treatment, and the stomatal sagging and closure were significantly higher in the SS treatment. The stomatal densities were significantly lower than that of the CK, but were higher than those of the LS and MS treatment; the stomata were closed, the inner arch cover was smooth and flat on the inner source, and the outer cuticle was thickened and raised into a ridge and was uneven into a feathery interruption that surrounded the stomata (Figure 9(d1,d2)).

3. Discussion

3.1. Response of B. striata Enzyme Activities to Drought Stress

Drought stress affects photosynthesis in plants [5,10,16], and this disturbance can lead to oxidative stress responses and the accumulation of reactive oxygen species (ROS) in plant cells. ROS is ubiquitous in cells, and its production is limited to chloroplasts, mitochondria and peroxisomes [39]. One of the initial responses of plants to water deficit is the formation of ROS [40,41], expressed as membrane peroxidation [42]; among them, H2O2 is an important signalling molecule in ROS and plays a role as a signalling molecule in the process of plant stress [43]. Plants produce ROS when exposed to the stress conditions, such as drought stress [44], which forced the plants to produce antioxidants [39,41,44], flavonoids, and secondary metabolites which play a role in protecting the plant by detoxifying ROS and protecting the plant from abnormal conditions (i.e., stress) and protein and amino acid stabilization [7,45]. POD and CAT are important protective enzymes in plants that can effectively scavenge H2O2 (1O2), (•OH) and (O2) radicals to prevent membrane lipid peroxidation when plants are stressed by the external environment [45,46]. Under drought stress, the increase in Pro in leaves of B. striata was significant (Figure 2c), which is a general response of plants to abiotic stress. Pro is a compatible solute that acts as a penetrant and hydroxyl radical scavenger to protect cells from stress damage [39,43]. In response to drought, oxidative damage (MDA) increased in the leaves of B. striata, and decreased under mild drought conditions (Figure 2d). To some extent, the production of MDA can be used to indicate the resilience of plants [47,48].

3.2. Morphological Characteristics of B. striata under Drought Environments

The water deficit treatment of B. striata revealed decreases in root biomass and leaf biomass when compared to the CK group (Figure 2), which was similar to a previous study on Vatairea macrocarpa (Benth.) [49]. In response to drought stress, plants usually limit the number and areas of leaves, which thus reduces the biomass and water balance at the expense of yield loss [13]. At the morphological level, drought has the greatest effects on stems and roots, and since roots are the only organs of plants that obtain water from the soil, the biomass quantities and root lengths are the most intuitive responses of plants to drought stress [3], and deep and thick root systems facilitate water uptake [15,16]. Unlike the results of previous studies [15,16], no elongation trends in root lengths were observed in this study with the deepening of drought, which may be related to the growth morphology of B. striata. B. striata roots are stem tubers, and when subjected to drought stress, the plant water is mainly stored in the stem tubers. To maintain the normal physiological functions, such as leaf photosynthesis, the water stored in the stem tubers is exported to the aboveground part of the leaves, so any root length growth is not obvious. However, these roots can withstand prolonged drought and produce new functional root systems after rehydration.

3.3. Response of B. striata Photosynthetic Characteristics to Drought Stress

Drought stress affects the ultrastructure of leaves, especially the characteristics of stomata. Stomatal control is the main physiological mechanism of plant drought resistance, which protects plants from irreversible damage caused by hydraulic failure and carbon starvation by regulating photosynthesis and transpiration [7,50], and is closely related to the physiological activities of plants such as photosynthesis, transpiration and respiration [16]. Stomatal closure is widely considered to be the main determinant of photosynthesis reduction under drought conditions [51,52]. Stomatal density and size are related to transpiration unit leaf area, but the contribution of stomatal morphology varies with environmental conditions, and smaller stomatal size may be beneficial under some conditions [53]. The reasons for stomatal opening, closing, and partial opening may alter transpiration rates at the leaf canopy level. Stomatal width was significantly correlated with Tr (Figure 10), and the decrease in stomatal width in B. striata may also be the main cause of PN inhibition and gas exchange limitation [16,54]. In this study, drought stress significantly inhibited B. striata’s stomatal length, stomatal width and stomatal density (Figure 8a and Figure 9), however, under SS treatment, the stomatal density was abnormally higher than that of LS and MS treatment. In the case of smaller stomatal morphology, B. striata benefits from changes in stomatal morphology by increasing the number of stomata to obtain more CO2 [16], while reducing transpiration.
Many internal and external factors can lead to gs adjustment, which Cowan and Farquhar have previously proposed to ensure that CO2 intake is much greater than evaporation [53,55]. This critical process at the plant–environment interface becomes critical when soil moisture conditions are limited. In the present study, the decrease in gs was one of the main factors for the decrease in PN. Correlation analysis showed that B. striata gs was positively correlated with Ci (Figure 10), and under limited Ci conditions, the photosynthetic carbon metabolism changed, and light reactions led to the accumulation of photosynthetic electron transport components, a decrease in molecular oxygen, an increase in ROS, and ROS caused B. striata photosynthetic organ damage [16] and a decrease in the photosynthetic rate.
A higher WUE was associated with gs and stomatal opening to reduce transpiration [16,55], and the correlation analysis showed that the gs values were highly positively correlated with the Tr (Figure 10). In B. striata, a decrease in gs was associated with a decrease in the Tr and also with a decrease in water loss. The first choice of plants when coping with drought is to close the stomata; when the stomata are closed, little CO2 is absorbed, and transpiration is reduced [55]. In the present study, the B. striata Tr decreased when compared to those of the CK (Figure 4d), while the gs and WUE values decreased, which was similar to the results of a previous study on Hibiscus rosa-sinensis under drought stress [56]. The water-deficient treatment of B. striata exhibited a higher WUE (Figure 4f), which indicated that B. striata, when facing drought conditions, adjusts the amount of water loss by opening and closing the stomata and sacrificing CO2 absorption, which thereby increasing the instantaneous WUE, which also explains the higher WUE (Figure 4f) and the larger numbers of closed stomata (Figure 9(d1,d2)) under severe drought conditions.

3.4. Response of B. striata Electrophysiology to Drought Stress

The amount of water in plants affects the elasticity vulnerability of plant leaf cells. When plants are subjected to different degrees of environmental stress, the water status of cells will change immediately, and the electrical signal of plants will also change [23]. In general, the greater the effective thickness of the plant, the larger the vesicles, the more mature the leaves, and the stronger the water storage capacity [57]. In the present study, the effective thickness of the leaves of B. striata increased with the increase in the drought degree, and the main reason may be that large vesicles were formed to store more water to cope with drought. Therefore, electrophysiological indicators can reflect the leaf water status of plants [23,26]. The electrical change in plant photosynthesis is an electrical reaction caused by metabolic changes, showing differences in oxygen production and carbon dioxide consumption, and potential differences between different parts. Therefore, changes in electrophysiological indicators can reflect changes in photosynthesis and metabolism of plants. In this study, the characteristics of electrophysiological parameters changed significantly. With the increase in drought, the physiological capacitance of B. striata gradually increased (Figure 5), PN decreased, transpiration decreased, and WUE increased. The changes in photosynthetic indices reflected the unique relationship between physiological impedance and photosynthetic index of B. striata; the greater the soil water deficit, the greater the physiological capacitance, and the lower the gs, Tr and LUE of plants. Under drought conditions, the reduction in water availability usually results in the limited uptake of total nutrients by crops, thereby reducing the tissue concentration of plants [16]. The physiological capacitance and physiological resistance [26,28] are significant differences, so there are differences in the metabolic energy of plant cells. The process of material and energy distribution during plant growth and development and the adaptive mechanism of plants under stress are closely related to the source–sink relationship and plant cell metabolizable energy is another expression of plant physiological activity. From Table 4, it can be seen that the highest cellular metabolic energy of B. striata leaves under LS treatment, leaf cells maintain sufficiently high energy reserves to eliminate ROS, allowing the plant to adjust its metabolism and generate an appropriate adaptive response [44]. Therefore, B. striata under light drought conditions has a more flexible source–sink relationship, and has a strong adaptability to drought conditions. The change characteristics of its cellular metabolizable energy may be an effective stress marker under environmental constraints. Such changes in physiology, photosynthetic properties, cellular metabolic energy, and stomatal characteristics of B. striata allow them to better adapt to a wider range of environmental stresses.

4. Materials and Methods

4.1. Experimental Materials and Experimental Design

The experiments were conducted at the Guizhou Normal University campus (106°43′08″ E, 26°35′31″ N), with an altitude of 1096 m, average annual temperature of 15.0 °C, annual sunshine duration of 1252.8 h and average annual relative humidity of 82%; the soil used for the experiment consisted of yellow loam. B. striata tissue culture seedlings were purchased from Guizhou Anlong Biotechnology Co., Ltd. (Guizhou, China). The pot planting method was adopted (pot height 12 cm, pot bottom diameter 8 cm, and pot mouth diameter 15 cm); the annual B. striata seedlings with consistent growth were selected as the test materials and were randomly divided into the following four groups, the maximum field capacity (FC) was 75–80%, 50–60% FC, 40–45% FC, 30–35% FC, which were recorded as control group (CK), light drought stress (LS), moderate drought stress (MS) and severe drought stress (SS); each group consisted of 5 pots with 1 plant per pot; each pot was weighed to maintain the relative soil moisture content within the defined range [52]. This process took 3 weeks. The soil water contents were tested every day to replenish any deficient amounts.

4.2. POD Activity Assay

POD, CAT, Pro, and MDA were measured using UV-Visible spectrophotometers (UV-Vis Spectrophotometer 6010, Agilent Technologies Shanghai Co.). Measurements of POD activity was performed according Thongsook [58] and Mou [59], with appropriate adjustments. Catalyzed by peroxidase, H2O2 oxidizes guaiacol to a brown product, which has a maximum absorbance at 470 nm. B. striata leaves (0.5 g) were ground into a homogenate in an ice mortar with phosphate buffer, transferred the homogenate into a centrifuge tube and centrifuged at 8000 r/min for 15 min at 4 °C. The supernatant was transferred to a volumetric flask, the volume fixed at 25 mL and stored at low temperature. The enzyme solution boiled in hot water was used as a control, and the enzyme reaction system consisted of 3 mL of 0.05 mol/L pH = 7.0 phosphate buffer, 1.0 mL of 0.3% H2O2, 1.0 mL of 0.2% guaiacol and 0.1 mL of enzyme solution. The absorbance was measured at 470 nm, with A470 in each minute. A change of 0.01 was considered as 1 unit of peroxidase activity.

4.3. CAT Activity Assay

H2O2 has a strong absorption at the wavelength of 240 nm, and the activity of catalase can be measured by measuring the rate of change of absorbance. First, 0.5 g of leaves were added to 0.1 mol/L pH = 7.0 phosphate buffer and ground into a homogenate, centrifuged to take the supernatant, 0.2 mL enzyme solution was added, 1.5 mL pH = 7.8 phosphoric acid, 1 mL distilled water, 0.3 mL 0.1 mol/L H2O2, the absorbance was recorded at 240 nm. One unit of CAT activity was defined as the amount of enzyme that used 1 μmol H2O2 min−1 [60].

4.4. Pro Content Assay

Pro was determined by the colorimetric method using hydrated ninhydrin. When plant samples were extracted with nitro salicylic acid, Pro was free in the salicylic acid solution, and the solution turned red after heating with acidic ninhydrin. Then the pigment was transferred with toluene, colorimetry was performed at 520 nm, and then the amount of Pro was checked from the standard curve [61].

4.5. MDA Content Assay

MDA content was determined by the thiobarbituric acid (TBA) colorimetric method [55]. B. striata leaf samples (0.5 g) were added to 5% trichloroacetic acid (TCA) to grind into a homogenate, the homogenate was centrifuged at 8000 r/min for 20 min, and the supernatant was the sample extract. Next, 1 mL of supernatant was placed in a test tube, 2 mL of 0.67% TBA was added, and the mixture was mixed well and boiled for 30 min in a 100 °C water bath. The liquid was centrifuged at 10,000 r/min, and the supernatant was transferred to a cuvette, subtract the absorbance at 600 nm from the absorbance at 532 nm [60,62,63].

4.6. B. striata Biomass and Growth Parameters Assay

The roots length and leaves length of B. striata were measured by tape measure, accurate to 0.01; the fresh weight of B. striata roots and fresh weight of leaves were measured by analytical balance, accurate to 0.01.

4.7. B. striata Photosynthetic Parameters Assay

Using the American portable photosynthetic system Li-6400XT (LI-COR Inc., Lincoln, NE, USA), three pots of each plant of CK, LS, MS, and SS groups of B. striata were selected for the determination of photosynthetic parameters in October 2019. The PN, gs, Ci, Tr, WUE and LUE of the B. striata leaves were recorded during the measurements of the photosynthetic parameters in sunny and well-lit daytime periods at 10:00–11:00 am. The average atmospheric temperature during the measurement period was 21.19 °C, the average atmospheric CO2 concentration was 283.95 μmol·mol−1, and the average atmospheric relative humidity was 32.43%.

4.8. Establishment of Electrophysiological Model and Acquisition of Cell Metabolic Energy

Using an LCR tester (model 3532-50, HIOKI, Nagano, Japan), referring to Wu [57], the physiological capacitance, physiological resistance, and physiological impedance of the B. striata leaves were measured. The effect of the LCR tester on plants The best measurement frequency is 3 KHz, and the best measurement voltage is 1.5 V. The specific effective thickness d (10−12 m) of B. striata leaf was calculated based on C, R, Z, the unit metabolic energy of plant leaf cell based on R ΔGR-E (J/m), and the unit metabolism of plant leaf cell based on Z energy ΔGZ-E (J/m), plant leaf cell metabolic energy ΔGR (10−12 J) based on R, plant leaf cell metabolic energy ΔGZ (10−12 J) based on R, and plant leaf cell metabolic energy ΔGB (10−12 J).

4.9. Physiological Capacitance

The cytosol in the plant has a cellular vesicle solute, and the vesicle solute in the plant will change accordingly when it is stressed by adversity, while the cellular solute in the plant leaves is used as a dielectric, and the conductivity of the vesicle solute can be well judged according to the plant adversity [26,37,57]. The C of plant leaves is obtained by increasing the clamping force by stacking iron blocks, and the change in clamping force leads to a change in cytosolic solute concentration in leaves and a change in cytosolic solute conductivity of B. striata leaf tissue [26,57].
By the gravimetric equation:
F = ( M + m ) g
where F is the clamping force, N; M is the mass of the iron block, m is the mass of the plastic rod and electrode sheet, kg; and g is the acceleration of gravity of 9.8, N/kg.
The Gibbs free energy equation is expressed as Δ G = Δ H + PV , the energy equation of a capacitor W = 1 2 U 2 C , and the equation of the plant cell subjected to pressure P = F S .
W is the energy of the capacitor, which is equal to the work transformed by the Gibbs free energy ΔG, W = ΔG; ΔH is the internal energy of the leaf system, P is the pressure on the leaf cells of B. striata, V is the volume of the leaf cells of B. striata, U is the voltage parameter of the test setup, and C is the physiological capacitance of B. striata. Where the pressure equation F is the clamping force and S is the effective area under the action of the pole plate, so the C of the plant leaves varies with the clamping force F model as
C = 2 Δ H U 2 + 2 V SU 2 F
Let x 0 = 2 Δ H U 2 , h = 2 d U 2 , and Equation (2) can be deformed as
C = x 0 + Hf

4.10. Physiological Resistance

When external drought stress occurs, plant leaf water decreases, affecting changes in cytosol water thus leading to changes in ion concentration inside and outside the plant leaf, affecting the transmission of resistive current ions. The relationship between the physiological resistance of plant cells and drought conditions in leaves was derived from the Nernst equation based on the difference between internal and external ion concentrations [57].
The expression of the Nernst equation is given by
E E 0 = R 0 T n R F 0   ln C i C o
The internal energy of the electric potential E can be converted into work performed by pressure, which is proportional to PV, PV = a E, i.e.,
PV = Ae = a   E 0 + a   R 0 T n R F 0   ln C i C o
where P is the pressure on the plant cell, a is the electric potential conversion energy coefficient, V is the plant cell volume; and P is the pressure on the plant body cell, P = F S , where F is the clamping force and S is the effective area under the action of the pole plate.
Thus, (5) can become
V S F = a   E 0 a   R 0 T n R F 0   ln C T R f 0 f 0
Further deformation, we can obtain:
R = f 0 C T + f 0 C T e n R F 0 E 0 R 0 T e ( Vn R F 0 Sa   R 0 T F )
In Equation (8), R is the physiological resistance, and since d = V S , Equation (8) can be deformed as follows:
R = f 0 C T + f 0 C T e n R F 0 E 0 R 0 T e ( d   n R F 0 a   R 0 T F )
In Equation (8), d, a, E0, R0, T, nR, F0, CT, and f0 are fixed values, let y 0 = f 0 C T , k1 = f 0 C T e n R F 0 E 0 R 0 T , b1 = d   n R F 0 a   R 0 T , thus, the Equation (8) can be deformed as
R = y 0 + k 1   e b 1 F
In Equation (9), y0, k1 and b1 are the parameters of the model. Therefore, the metabolic energy per unit of plant leaf cell based on physiological resistance ΔGR-E = a   E 0 d = ln k 1 ln y 0 b 1 . Metabolic energy of plant leaf cell based on physiological resistance ΔGR = ΔGR-Ed.

4.11. Physiological Impedance

The magnitude of impedance in the same plant depends on the concentration of cytosolic solute in response to the physiological impedance electrolyte, and when the plant is subjected to external environmental changes, the ensuing changes in cellular electrolytes lead to changes in physiological impedance inside and outside the membrane, obeying the Nernst equation [57].
Expression of the Nernst equation.
E E 0 = R 0 T n Z F 0   ln Q i Q o
The internal energy of the electric potential E can be converted into work performed by pressure, which is proportional to PV, PV = a E, i.e.,
PV = aE = a   E 0 + a   R 0 T n Z F 0   ln Q i Q o
Where P is the pressure on the plant cell, a is the electric potential conversion energy coefficient, V is the plant cell volume; the pressure P on the plant cell can be found by the pressure formula, where F is the clamping force and S is the effective area under the action of the pole plate.
Therefore, (11) can become
V S F = a   E 0 a   R 0 T n Z F 0   ln QZ J 0 J 0
Further deformation, we can obtain:
Z = J 0 Q + J 0 Q e n Z F 0 E 0 R 0 T e ( Vn Z F 0 Sa   R 0 T F )
In Formula (14), Z is the physiological impedance. Since d = V S , Formula (13) can be transformed into:
+ J 0 Q e n Z F 0 E 0 R 0 T e ( d   n Z F 0 a   R 0 T F )
where d, a, E0, R0, T, nZ, F0, Q, J0 are all fixed values, let p 0 = J 0 Q , k2 = J 0 Q e n Z F 0 E 0 R 0 T , b2 = d   n Z F 0 a   R 0 T , thus Equation (14) can be deformed as
Z = p 0 + k 2   e b 2 F
where p0, k2 and b2 are the parameters of the model. Therefore, the metabolic energy per unit of plant leaf cell based on physiological impedance ΔGZ-E = a   E 0 d = ln k 2 ln p 0 b 2 . Metabolic energy of plant leaf cells based on physiological impedance ΔGZ = ΔGZ-Ed. ΔGB is the average of ΔGR and ΔGZ.

4.12. B. striata Stomatal Scanning

The drought-treated B. striata leaves were removed, the upper and lower epidermal dust on the leaves was wiped off with skimmed cotton, a blade was used 3/1 from the main leaf veins to take sample sizes of approximately 3 mm × 3 mm size from the leaves, double-sided adhesive was fixed in the sample table, and a JFC-1600 sputtering instrument was sprayed with platinum. The samples were placed on a scanning electron microscope (KYKY-1000B, Shimadzu, Kyoto, Japan), and the cellular structure characteristics of the B. striata leaves were observed at ×1000 magnification. The B. striata leaf structures were photographed by a digital microscope imaging system and were calibrated by the digital ranging software, Motic Images Advanced 3.0. The stomatal density was measured by taking digital photos of visual fields in different directions at ×100 magnification. The number of stomata in each visual field was counted (four visual fields were averaged), and the area of the visual field was obtained, so stomatal density (mm2) = stomata number/S. Where visual field area: The length and width of the scanning image of the electron microscope are 22.8 cm and 16.5 cm, and the length of the 100 μm ruler is 1.7 cm. The actual length of the field of view is 22.8/1.7 × 100 μm = 1341.18 μm, and the actual width of the field of view is 16.5/1.7 × 100 μm = 970.59 μm. Visual field area =1341.18 μm × 970.59 μm = 1,301,735.90 μm2 = 1.30 mm2.

4.13. Statistical Analysis

Data were processed with MS-Excel® 2016 (Microsoft Inc., Redmond, WA, USA) and SPSS 23 (SPSS Inc., Chicago, IL, USA) software. One-way analysis of variance (ANOVA) and the least significant difference test (LSD) were used for significance testing (p < 0.05). The data are shown as the means ± SE. Graphs were prepared using Origin 2018 (Northampton, MA, USA). The R program was used for plotting, and the program packages used were “ggplot2” and “GGally”, The detailed code is as follows:
install.packages(“ggplot2”)
install.packages(“GGally”)
library(ggplot2)
library(GGally)
ppo<-read.csv(choose.files(),header = TRUE,row.names = 1)
ggpairs(iris,columns=1:4,aes(color=Species),upper=list(continuous=wrap(‘cor’,size=3)),lower = list(continuous=‘smooth’))iris
install.packages(“corrplot”)
library(corrplot)
ppo<-read.csv(choose.files(),header = TRUE,row.names = 1)
M<-cor(ppo)
res1<-cor.mtest(M,conf.level=.95)
res2<-cor.mtest(M,conf.level=.99)
p.mat=res1$p
corrplot(M,order=‘hclust’,type=‘upper’,tl.pos=‘d’,p.mat=res1$p,sig.level=c(0.001,0.01,0.05),insig = ‘label_sig’,pch.cex=1,tl.srt = 0,tl.cex = 0.5,cl.cex = 1)
corrplot(M,add=TRUE,type=‘lower’,method=‘number’,order=‘hclust’,diag=FALSE,tl.pos=‘n’,number.cex = 0.58)

5. Conclusions

For Karst areas with seasonal water shortages, the reasonable selection of cultivated species is beneficial to regional plant restoration and economic cost savings. Under drought stress conditions, the physiological characteristics and morphology of B. striata changed significantly, showing low PN, gs, Tr, LUE and high WUE. In B. striata, the morphological adaptation mode was small and thick leaves and long roots, and the water utilization strategy was to increase stomatal length, decrease stomatal density and increase cell metabolized energy under light drought conditions. B. striata under mild drought showed more obvious morphological and physiological avoidance and adaptation to arid environments. It is generally believed that plants grow well in an environment adapted to soil moisture. However, in this study, severe drought and a humid environment were not conducive to the growth of B. striata, and proper drying (i.e., LS treatment) can promote the improvement of its quality. There was a significant correlation between the electrophysiological indexes and photosynthetic indexes of B. striata, which could jointly characterize the response of the growth and development of B. striata to soil water, but the correlation between the electrophysiological indexes and photosynthetic indexes was not obvious. In the general trend, the growth index and electrophysiological index of B. striata were consistent. Therefore, plant electrophysiological information can be used as another means to judge the state of plant soil water deficit. These findings will be beneficial to the selection of cultivated species in arid areas and the rapid monitoring of plant drought.

Author Contributions

Conceptualization, C.L. and W.Q.; Methodology, Y.W.; Software, Y.G. and Q.Y.; Validation, Y.G., W.Q. and C.C.; Formal analysis, Y.G.; Data curation, Y.G; Writing—original draft preparation, Y.G.; Writing—review and editing, Y.G. and Q.Y.; Visualization, Y.G. and C.C.; Supervision, C.L. and W.Q.; Project administration, C.L. and W.Q.; Funding acquisition, C.L. and W.Q. All authors have read and agreed to the published version of the manuscript.

Funding

This study was supported by the Guizhou provincial characteristic key laboratory (QJHKY [2021]002), and the Forestry Science and Technology Project of Guizhou Province (No. QLKH [2018]11). All these funding play roles in the design of the study and collection, analysis, and in writing the manuscript.

Institutional Review Board Statement

Not applicable.

Informed Consent Statement

Not applicable.

Data Availability Statement

Data are available from the authors upon request.

Conflicts of Interest

The authors declare no conflict of interest.

References

  1. Gorai, M.; Aloui, E.W.; Yang, X.; Neffati, M. Toward understanding the ecological role of mucilage in seed germination of a desert shrub Henophyton deserti: Interactive effects of temperature, salinity and osmotic stress. Plant Soil 2014, 374, 727–738. [Google Scholar] [CrossRef]
  2. Ha, C.V.; Leyva-González, M.A.; Osakabe, Y.; Tran, U.T.; Nishiyama, R.; Watanabe, Y.; Tanaka, M.; Seki, M.; Yamaguchi, S.; Dong, N.V. Positive regulatory role of strigolactone in plant responses to drought and salt stress. Proc. Natl. Acad. Sci. USA. 2014, 111, 851–856. [Google Scholar] [CrossRef]
  3. Omprakash; Gobu, R.; Bisen, P.; Baghel, M.; Chourasia, K.N. Resistance/Tolerance Mechanism under Water Deficit (Drought) Condition in Plants. Int. J. Curr. Microbiol. Appl. Sci. 2017, 6, 66–78. [Google Scholar]
  4. Ashraf, M. Inducing drought tolerance in plants: Recent advances. Biotechnol. Adv. 2010, 28, 169–183. [Google Scholar] [CrossRef] [PubMed]
  5. Xing, D.K.; Wu, Y.Y.; Wang, R.; Fu, W.G.; Zhou, Y.C.; Javed, Q. Effects of drought stress on photosynthesis and glucose-6-phosphate dehydrogenase activity of two biomass energy plants (Jatrophacurcas L. and Verniciafordii H.). J. Anim. Plant Sci. 2015, 25, 172–179. [Google Scholar]
  6. Fang, Y.; Xiong, L. General mechanisms of drought response and their application in drought resistance improvement in plants. Cell Mol. Life Sci. 2015, 72, 673–689. [Google Scholar] [CrossRef] [PubMed]
  7. Bhusal, N.; Lee, M.; Han, A.R.; Han, A.; Kim, H.S. Responses to drought stress in Prunus sargentii and Larix kaempferi seedlings using morphological and physiological parameters. Forest Ecol. Manag. 2020, 465, 118099. [Google Scholar] [CrossRef]
  8. Yang, X.L.; Li, Y.Y.; Chen, H.B.; Huang, J.; Zhang, Y.M.; Qi, M.F.; Li, Y.F.; Li, T.L. Photosynthetic response mechanism of soil salinity-induced cross-tolerance to subsequent drought stress in tomato plants. Plants 2020, 9, 363. [Google Scholar] [CrossRef]
  9. Gao, S.S.; Wang, Y.L.; Yu, S.; Huang, Y.Q.; Liu, H.C.; Chen, W.; He, X.Y. Effects of drought stress on growth, physiology and secondary metabolites of two Adonis species in northeast China. Sci. Hortic. 2020, 259, 108795. [Google Scholar] [CrossRef]
  10. Mcdowell, N.G. Mechanisms Linking Drought, Hydraulics, Carbon Metabolism, and Vegetation Mortality. Plant Physiol. 2011, 155, 1051–1059. [Google Scholar] [CrossRef]
  11. Chaves, M.M.; Oliveira, M.M. Mechanisms underlying plant re-silience to water deficits: Prospects for water-saving agriculture. J. Exp. Bot. 2004, 55, 2365–2384. [Google Scholar] [CrossRef]
  12. Bhusal, N.; Lee, M.; Lee, H.; Adhikari, A.; Han, A.R.; Han, A.; Kim, H.S. Evaluation of morphological, physiological, and biochemical traits for assessing drought resistance in eleven tree species. Sci. Total Environ. 2021, 779, 146466. [Google Scholar] [CrossRef] [PubMed]
  13. Schuppler, U.; He, P.H.; John, P.C.L.; Munns, R. Effects of water stress on cell division and cell-division-cycle-2-like cell-cycle ki-nase activity in wheat leaves. Plant Physiol. 1998, 117, 667–678. [Google Scholar] [CrossRef] [PubMed]
  14. Lipiec, J.; Doussan, C.; Nosalewicz, A.; Kondracka, K. Effect of drought and heat stresses on plant growth and yield: A review. Int Agrophys. 2013, 27, 463–477. [Google Scholar] [CrossRef]
  15. Kavar, T.; Maras, M.; Kidric, M.; Šuštar-Vozlič, J.; Meglič, V. Identification of genes involved in the response of leaves of Phaseolus vulgaris to drought stress. Mol. Breed. 2007, 21, 159–172. [Google Scholar] [CrossRef]
  16. Farooq, M.; Wahid, A.; Kobayashi, N.; Fujita, D.; Basra, S.M.A. Plant drought stress: Effects, mechanisms and management. Agron. Sustain. Dev. 2009, 29, 185–212. [Google Scholar] [CrossRef]
  17. Lundholm, J.; Tran, S.; Gebert, L. Plant functional traits predict green roof ecosystem services. Environ. Sci. Technol. 2015, 49, 2366–2374. [Google Scholar] [CrossRef]
  18. Yin, C.; Peng, Y.; Zang, R.; Zhu, Y.; Li, C. Adaptive responses of Populus kangdingensis to drought stress. Physiol. Plantarum. 2005, 123, 445–451. [Google Scholar] [CrossRef]
  19. Arndt, S.K.; Clifford, S.C.; Wanek, W.; Jones, H.G.; Popp, M. Physiological and morphological adaptations of the fruit tree Ziziphus rotundifolia in response to progressive drought stress. Tree Physiol. 2001, 21, 705–715. [Google Scholar] [CrossRef]
  20. He, X.R.; Wang, X.X.; Fang, J.C.; Zhao, Z.F.; Huang, L.H.; Guo, H.; Zheng, X.H. Bletilla striata: Medicinal uses, phytochemistry and pharmacological activities. J. Ethnopharmacol. 2016, 195, 20–38. [Google Scholar] [CrossRef]
  21. Kong, L.; Yu, L.; Feng, T.; Yin, X.J.; Liu, T.J.; Dong, L. Physicochemical characterization of the polysaccharide from Bletilla striata: Effect of drying method. Carbohydr. Polym. 2015, 125, 1–8. [Google Scholar] [CrossRef] [PubMed]
  22. Zhang, J.; Zhang, W.M.; Shi, J.S.; Sun, D.F.; Zhu, C.L. Research progress of Bletila striata polysaccharide gum in medicine. Polym. Bull. 2010, 31, 52–57. [Google Scholar]
  23. Yu, R.; Wu, Y.; Xing, D. Can electrophysiological parameters substitute for growth, and photosynthetic parameters to characterize the response of mulberry and paper mulberry to drought. Plants 2021, 10, 1772. [Google Scholar] [CrossRef] [PubMed]
  24. Burdon, S.J. Note on the electrical phenomena which accompany irritation of the leaf of Dionaea muscipula. Proc. R. Soc. Lond. 1873, 21, 495–496. [Google Scholar]
  25. Li, M.Q.; Li, J.Y.; Mao, H.P.; Wu, Y.Y. Diagnosis and detection of phosphorus nutrition level for Solanum lycopersicum based on electrical impedance spectroscopy. Biosyst. Eng. 2016, 143, 108–118. [Google Scholar]
  26. Javed, Q.; Wu, Y.Y.; Xing, D.K.; Azeem, A.; Ullah, I.; Zaman, M. Re-watering: An effective measure to recover growth and photosynthetic characteristics in salt-stressed Brassica napus L. Chil. J. Agric. Res. 2017, 77, 78–86. [Google Scholar] [CrossRef]
  27. Zebelo, S.A.; Maffei, M.E. Plant Electrophysiology: Early Stages of the Plant Response to Chemical Signals//Deciphering Chemical Language of Plant Communication; Springer: Cham, Switzerland, 2016; pp. 285–303. [Google Scholar]
  28. Javed, Q.; Wu, Y.Y.; Azeem, A.; Ullah, I. Evaluation of irrigation effects using diluted salted water based on electrophysiological properties of plants. J. Plant Interact. 2017, 12, 219–227. [Google Scholar] [CrossRef]
  29. Fromm, J.; Lautner, S. Electrical signals and their physiological significance in plants. Plant Cell Environ. 2007, 30, 249–257. [Google Scholar] [CrossRef]
  30. Saraiva, G.F.R.; Ferreira, A.S.; Souza, G.M. Osmotic stress decreases complexity underlying the electrophysiological dynamic in soybean. Plant Biol. 2017, 19, 1031–1037. [Google Scholar] [CrossRef]
  31. Canales, J.; Henriquez-Valencia, C.; Brauchi, S. The integration of electrical signals originating in the root of vascular plants. Front. Plant Sci. 2018, 8, 2173. [Google Scholar] [CrossRef]
  32. Saglio, P.H.; Raymond, P.; Pradet, A. metabolic activity and energy charge of excised maize root tips under anoxia. Plant Physiol. 1980, 66, 1053–1057. [Google Scholar] [CrossRef] [PubMed]
  33. Vanhercke, T.; Tahchy, A.E.; Liu, Q.; Zhou, X.R.; Shrestha, P.; Divi, U.K.; Ral, J.P.; Mansour, M.P. Metabolic engineering of biomass for high energy density: Oilseed-like triacylglycerol yields from plant leaves. Plant Biotechnol. J. 2014, 12, 231–239. [Google Scholar] [CrossRef] [PubMed]
  34. Shu, S.M.; Duan, X.; Zhao, Y.Y.; Xiong, H.Q. A model based on time, space, energy and iterative mechanism for woody plant metabolic rates and biomass. J. Biobased Mater. Bioenergy 2016, 10, 184–194. [Google Scholar] [CrossRef]
  35. Yan, X.F.; Wang, Z.Y.; Huang, L.; Wang, C.; Hou, R.F.; Xu, Z.L.; Qiao, X.J. Research progress on electrical signals in higher plants. Prog. Nat. Sci. 2009, 19, 531–541. [Google Scholar] [CrossRef]
  36. Oyarce, P.; Gurovich, L. Evidence for the transmission of information through electric potentials in injured avocado trees. J. Plant Physiol. 2001, 168, 103–108. [Google Scholar] [CrossRef] [PubMed]
  37. Zhang, M.M.; Wu, Y.Y.; Xing, D.K.; Zhao, K.; Yu, R. Rapid measurement of drought resistance in plants based on electrophysiological properties. Trans. ASABE. 2015, 58, 1441–1446. [Google Scholar]
  38. Liu, C.C.; Liu, Y.G.; Fan, D.Y.; Guo, K. Plant drought tolerance assessment for re-vegetation in heterogeneous karst landscapes of southwestern China. Flora Morphol. Distrib. Funct. Ecol. Plants 2012, 207, 30–38. [Google Scholar] [CrossRef]
  39. Castaeda, V.; González, E.M. Strategies to Apply Water-Deficit Stress: Similarities and Disparities at the Whole Plant Metabolism Level in Medicago truncatula. Int. J. Mol. Sci. 2021, 22, 2813. [Google Scholar] [CrossRef]
  40. Bhargava, S.; Sawant, K. Drought stress adaptation: Metabolic adjustment and regulation of gene expression. Plant Breed. 2013, 132, 21–32. [Google Scholar] [CrossRef]
  41. Lourkistia, R.; Oustrica, J.; Quilichinib, Y.; Froelicherc, Y.; Herbetted, S.; Morillone, R.; Bertia, L.; Santinia, J. Improved response of triploid citrus varieties to water deficit is related to anatomical and cytological properties. Plant Physiol. Biochem. 2021, 162, 762–775. [Google Scholar] [CrossRef]
  42. Li, Y.; Zhao, H.X.; Duan, B.L.; Korpelainen, H.; Li, C.Y. Effect of drought and ABA on growth, photosynthesis and antioxidant system of Cotinus coggygria seedlings under two different light conditions. Environ. Exp Bot. 2011, 71, 107–113. [Google Scholar] [CrossRef]
  43. Koffler, B.E.; Luschin-Ebengreuth, N.; Stabentheiner, E.; Müller, M.; Zechmann, B. Compartment specific response of antioxidants to drought stress in Arabidopsis. Plant Sci. 2014, 227, 133–144. [Google Scholar] [CrossRef] [PubMed]
  44. Choudhury, F.K.; Rivero, R.M.; Blumwald, E.; Mittler, R. Reactive oxygen species, abiotic stress and stress combination. Plant J. 2017, 90, 856–867. [Google Scholar] [CrossRef] [PubMed]
  45. Srivalli, B.; Sharma, G.; Khanna-chopra, R. Antioxidative defense system in an upland rice cultivar subjected to increasing intensity of water stress followed by recovery. Physiol. Plant. 2003, 119, 503–512. [Google Scholar] [CrossRef]
  46. Kadioglu, A.; Saruhan, N.; Sağlam, A.; Terzi, R.; Acet, T. Exogenous salicylic acid alleviates effects of long term drought stress and delays leaf rolling by inducing antioxidant system. Plant Growth Regul. 2011, 64, 27–37. [Google Scholar] [CrossRef]
  47. Lawson, T.; Oxborough, K.; Morison, J.I.L.; Baker, N.R. The responses of guard and mesophyll cell photosynthesis to CO2, O2, light, and water stress in a range of species are similar. J. Exp. Bot. 2003, 54, 1743–1752. [Google Scholar] [CrossRef] [Green Version]
  48. Redondo, F.J.; Peña, T.C.D.L.; Morcillo, C.N.; Lucas, M.M.; Pueyo, J.J. Overexpression of flavodoxin in bacteroids induces changes in antioxidant metabolism leading to delayed senescence and starch accumulation in alfalfa root nodules. Plant Physiol. 2009, 149, 1166–1178. [Google Scholar] [CrossRef]
  49. Vieira, E.A.; Silva, M.D.G.; Moro, C.F.; Laura, V.A. Physiological and biochemical changes attenuate the effects of drought on the Cerrado species Vatairea macrocarpa (Benth.) Ducke. Plant Physiol. Biochem. 2017, 115, 472–483. [Google Scholar] [CrossRef]
  50. Taylor, S.H.; Franks, P.J.; Hulme, S.P.; Spriggs, E.; Christin, P.A.; Edwards, E.J.; Woodward, F.I.; Osborne, C.P. Photosynthetic pathway and ecological adaptation explain stomatal trait diversity amongst grasses. New Phytol. 2012, 193, 387–396. [Google Scholar] [CrossRef]
  51. Zhou, Y.; Huang, L.H.; Wei, X.L.; Zhou, H.Y.; Chen, X. Physiological, morphological, and anatomical changes in Rhododendron agastum in response to shading. Plant Growth Regul. 2017, 81, 23–30. [Google Scholar] [CrossRef]
  52. Zhang, Y.J.; Ding, J.Q.; Wang, H.; Su, L.; Zhao, C.C. Biochar addition alleviate the negative effects of drought and salinity stress on soybean productivity and water use efficiency. BMC Plant Biol. 2020, 20, 288. [Google Scholar] [CrossRef] [PubMed]
  53. Durand, M.; Brendel, O.; Buré, C.; Thiec, D.L. Changes in irradiance and vapour pressure deficit under drought induce distinct stomatal dynamics between glasshouse and field-grown poplars. New Phytol. 2020, 227, 392–406. [Google Scholar] [CrossRef] [PubMed]
  54. Bhusal, N.; Kim, H.S.; Han, S.G.; Yoon, T.M. Photosynthetic traits and plant–water relations of two apple cultivars grown as bi-leader trees under long-term waterlogging conditions. Environ. Exp. Bot. 2020, 176, 104111. [Google Scholar] [CrossRef]
  55. Cowan, I.R.; Farquhar, G.D. Stomatal function in relation to leaf metabolism and environment: Stomatal function in the regulation of gas exchange. Symp. Soc. Exp. Biol. 1977, 31, 471–505. [Google Scholar]
  56. Egilla, J.N.; Davies, F.T.; Boutton, T.W. Drought stress influences leaf water content, photosynthesis, and water-use efficiency of Hibiscus rosa-sinensis at three potassium concentrations. Photosynthetica 2005, 43, 135–140. [Google Scholar] [CrossRef]
  57. Wu, Y.Y.; Wu, Y.S.; Fang, L.; Wu, M.K.; Wang, R.; Su, Y.; Wang, S.J.; Liu, C.Q. A Method for Measuring Metabolic Energy of Plant Leaf Cells. China Patent CN109060886A, 21 December 2018. [Google Scholar]
  58. Thongsook, T.; Barrett, D.M. Heat inactivation and reactivation of broccoli peroxidase. J. Agric. Food Chem. 2005, 53, 3215–3222. [Google Scholar] [CrossRef]
  59. Mou, D.L.; Yao, Y.N.; Yang, Y.Q.; Zhang, Y.M.; Tian, C.Y.; Achal, V. Plant high tolerance to excess manganese related with root growth, manganese distribution and antioxidative enzyme activity in three grape cultivars. Ecotoxicol. Environ. Saf. 2011, 74, 776–786. [Google Scholar] [CrossRef] [PubMed]
  60. Güneş, A.; Kordali, Ş.; Turan, M.; Bozhüyük, A.U. Determination of antioxidant enzyme activity and phenolic contents of some species of the Asteraceae family from medicanal plants. Ind. Crops Prod. 2019, 137, 208–213. [Google Scholar] [CrossRef]
  61. Ábrahám, E.; Hourton-Cabassa, C.; Erdei, L.; Szabados, L. Methods for determination of proline in plants. Plant Stress Toler. 2010, 639, 317–331. [Google Scholar]
  62. Loreto, F.; Velikova, V. Isoprene produced by leaves protects the photosynthetic apparatus against ozone damage, quenches ozone products, and reduces lipid peroxidation of cellular membranes. Plant Physiol. 2001, 127, 1781–1787. [Google Scholar] [CrossRef]
  63. Heath, R.L.; Packer, L. Photoperoxidation in isolated. Chloroplasts: I. Kinetics and stoichiometry of fatty acid peroxidation. Arch. Biochem. Biophys. 1968, 125, 189–198. [Google Scholar] [CrossRef]
Figure 1. B. striata application value and research ideas.
Plants 11 02313 g001
Figure 2. Effects of drought stress on POD, CAT, Pro, and MDA in B. striata. Peroxidase (a), catalase (b), proline (c), malondialdehyde (d). CK = control group, LS = light drought stress, MS = moderate drought stress, and SS = severe drought stress. The bars indicate the standard errors of the means (± SE). The different lowercase letters indicate significant differences according to LSD test.
Plants 11 02313 g002
Figure 3. Effects of drought stress on root length (a), leaf length and biomass (b). The bars indicate the standard errors of the means (±SE). The different lowercase letters indicate significant differences according to LSD test.
Plants 11 02313 g003
Figure 4. Responses of the photosynthetic parameters of B. striata leaves to drought stress. The bars indicate the standard errors of the means (± SE). The different lowercase letters indicate significant differences according to LSD test. PN: Net photosynthetic rate (a); gs: Stomatal conductance (b); Ci: Intercellular CO2 concentration (c); Tr: Transpiration rate (d); LUE: Light use efficiency (e); WUE: Water use efficiency (f).
Plants 11 02313 g004
Figure 5. Variation of C of B. striata leaf with clamping force F.
Plants 11 02313 g005
Figure 6. The change of B. striata leaf R with clamping force F.
Plants 11 02313 g006
Figure 7. The change of B. striata leaf Z with clamping force F.
Plants 11 02313 g007
Figure 8. Effect of drought stress on the B. striata stomatal. Stomatal length and stomatal width (a), stomatal density (b). The bars indicate the standard errors of the means (±SE). The different lowercase letters indicate significant differences according to LSD test.
Plants 11 02313 g008
Figure 9. Electron microscope scans of B. striata stomatal pores. Stomata density (a1,b1,c1,d1); stomata size (a2,b2,c2,d2).
Plants 11 02313 g009
Figure 10. Correlation analysis of various of B. striata indicators. The R program was used for plotting, and the program packages used were “ggplot2” and “GGally”. The blue colors in the graph indicate that the correlations are positive, the red colors indicate that the correlations are negative, and “*” indicates the significance level.
Plants 11 02313 g010
Table 1. The equations and parameters of the model of the leaves C with the clamping force (F).
Treatmentsx0hEquation
CK11.546.70C = 11.54 + 6.70F
R2 = 0.99, p < 0.05, n = 76
LS3.129.80C = 3.12 + 9.80F
R2 = 0.99, p < 0.05, n = 76
MS8.0610.28C = 8.06 + 10.28F
R2 = 0.99, p < 0.05, n = 76
SS14.6812.70C = 14.68 + 12.70F
R2 = 0.98, p < 0.05, n = 76
Table 2. The equations and parameters of the model of the leaves R with the clamping force (F).
Treatmentsy0k1b1Equation
CK2.3990.821.68R = 2.39 + 90.82e−1.68F
R2 = 0.99, p < 0.05, n = 76
LS1.057.940.34R = 1.05 + 7.94e−0.34F
R2 = 0.99, p < 0.05, n = 76
MS1.4215.940.57R = 1.42 + 15.94e−0.57F
R2 = 0.95, p < 0.05, n = 76
SS0.977.820.90R = 0.97 + 7.82e−0.90F
R2 = 0.99, p < 0.05, n = 76
Table 3. The equations and parameters of the model of the leaves Z with the clamping force (F).
Treatmentsp0k2b2Equation
CK0.916.060.69Z = 0.91 + 6.06e−0.69F
R2 = 0.98, p < 0.05, n = 76
LS0.574.340.47Z = 0.57 + 4.34e−0.47F
R2 = 0.99, p < 0.05, n = 76
MS0.823.990.64Z = 0.82 + 3.99e−0.64F
R2 = 0.99, p < 0.05, n = 76
SS0.503.890.86Z = 0.50 + 3.89e−0.86F
R2 = 0.99, p < 0.05, n = 76
Table 4. d and cell metabolic energy of B. striata leaves under different treatments.
Treatmentsd/(10−12m)ΔGR-E/(1012Jm−1)ΔGZ-E/(1012Jm−1)ΔGR/(J)ΔGZ/(J)ΔGB/(J)
CK7.542.172.7516.3220.7118.52
LS11.035.954.3265.6047.6256.61
MS11.574.242.4749.0628.5938.83
SS14.292.322.3933.1334.0833.61
Publisher’s Note: MDPI stays neutral with regard to jurisdictional claims in published maps and institutional affiliations.

