
Do Reproductive Traits of Invasive Populations of Scotch Broom, Cytisus scoparius (Fabaceae), Outperform Native Populations?


Abstract
:1. Introduction
2. Materials and Methods
2.1. Study Species
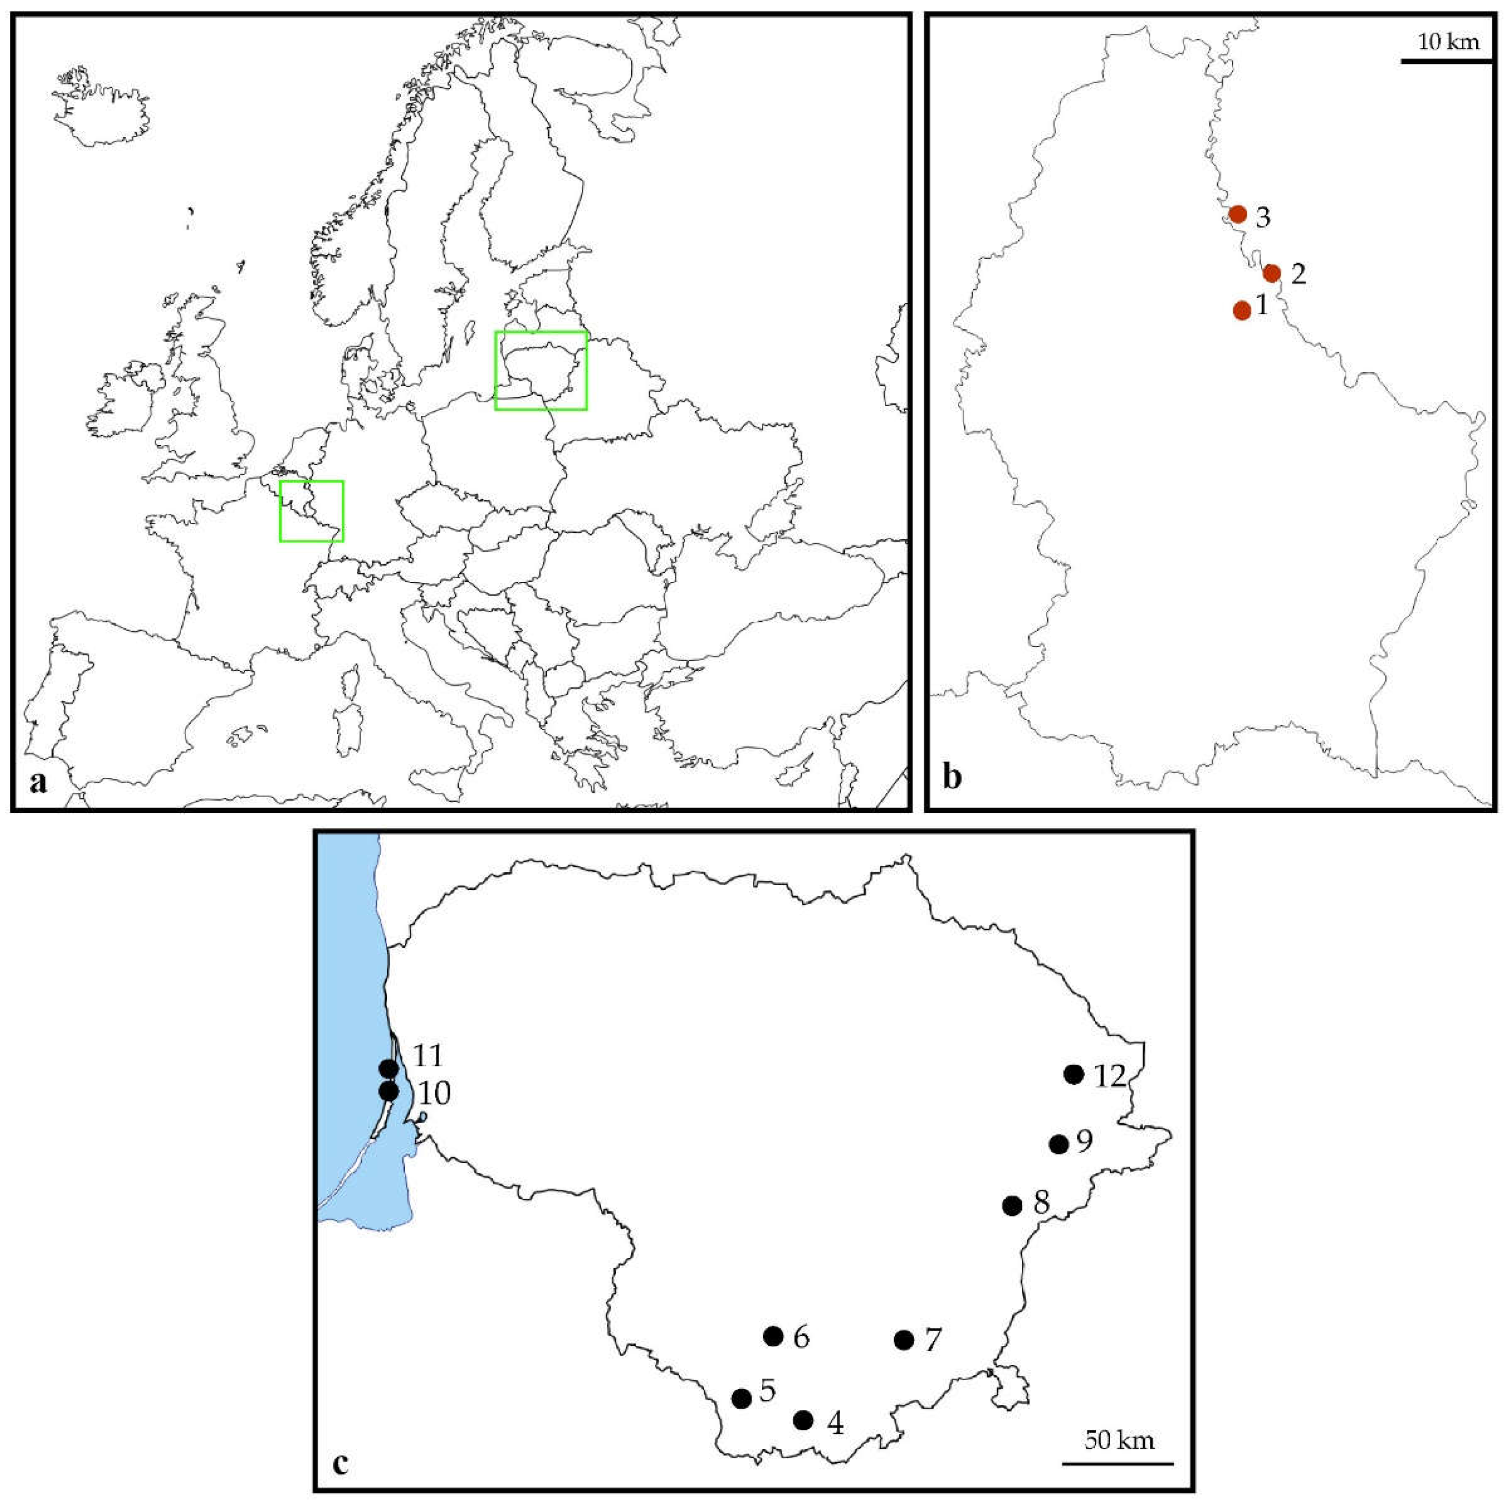
2.2. Study Sites
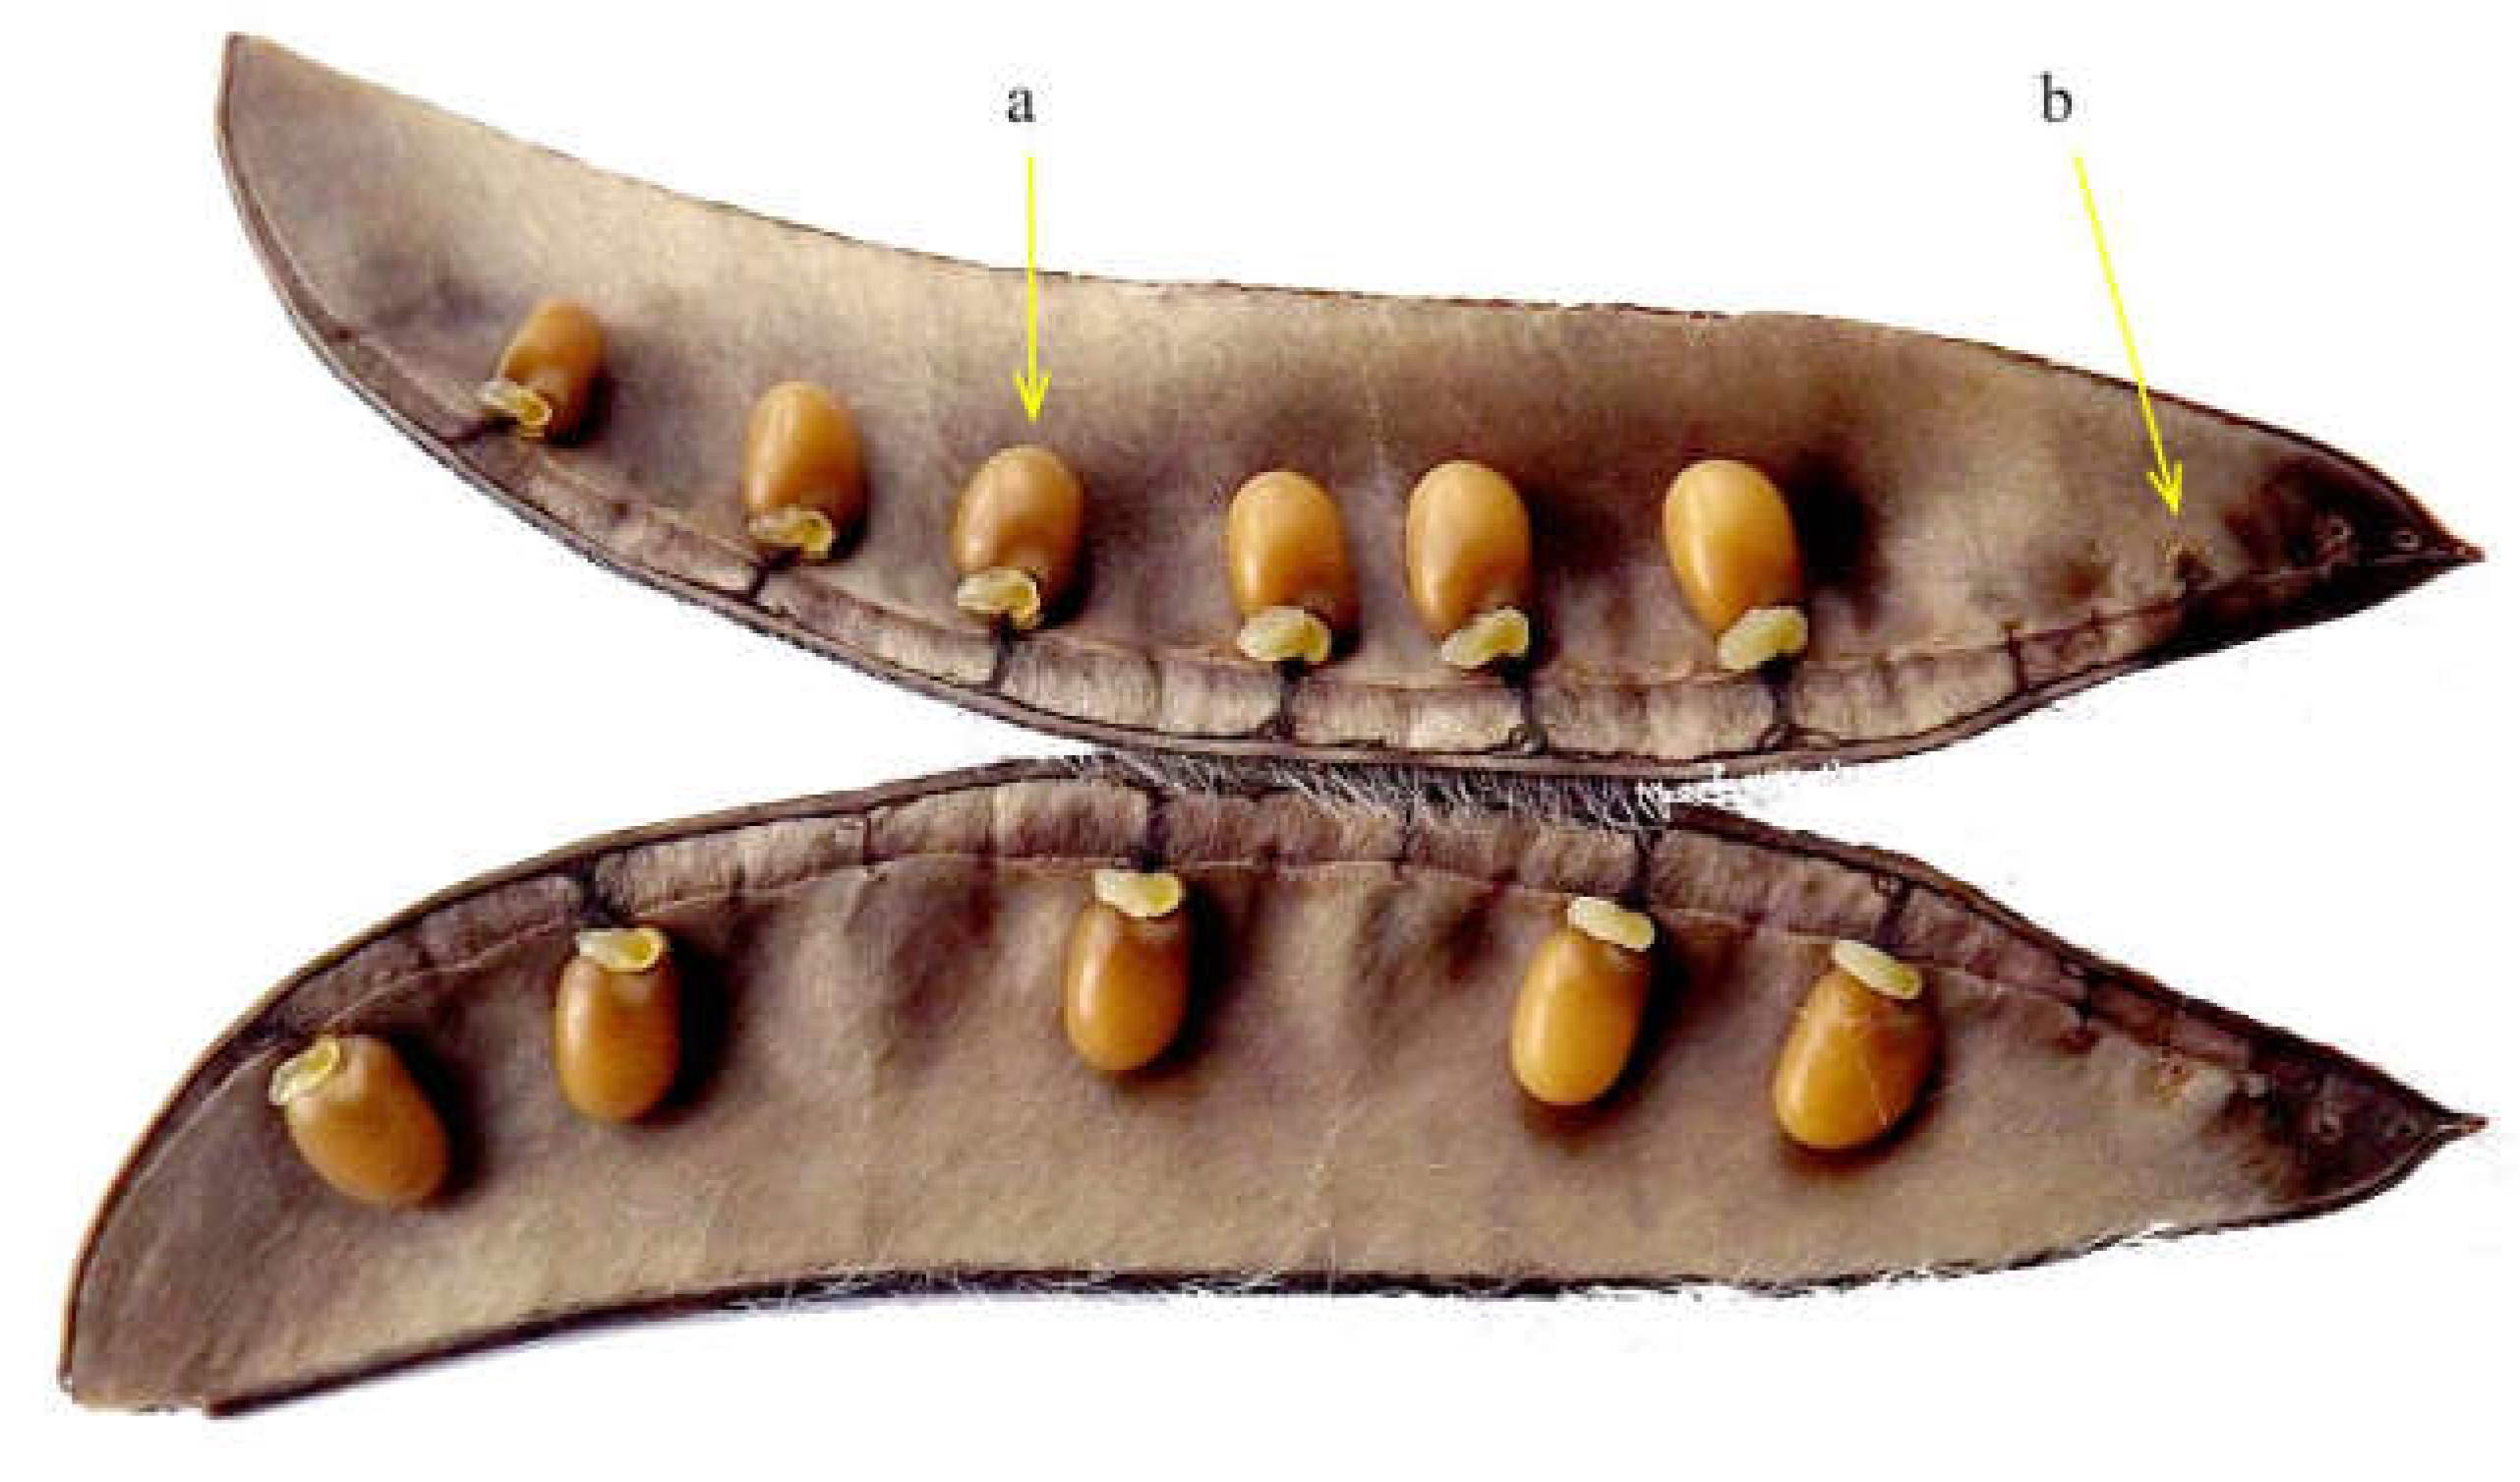
2.3. Procedures of Pod Sampling and Study
2.4. Statistical Analyses
3. Results
3.1. Effect of Population Origin and Site on Reproductive Traits
3.1.1. Number of Ovules
3.1.2. Number of Matured Seeds
3.1.3. Number of Aborted Ovules
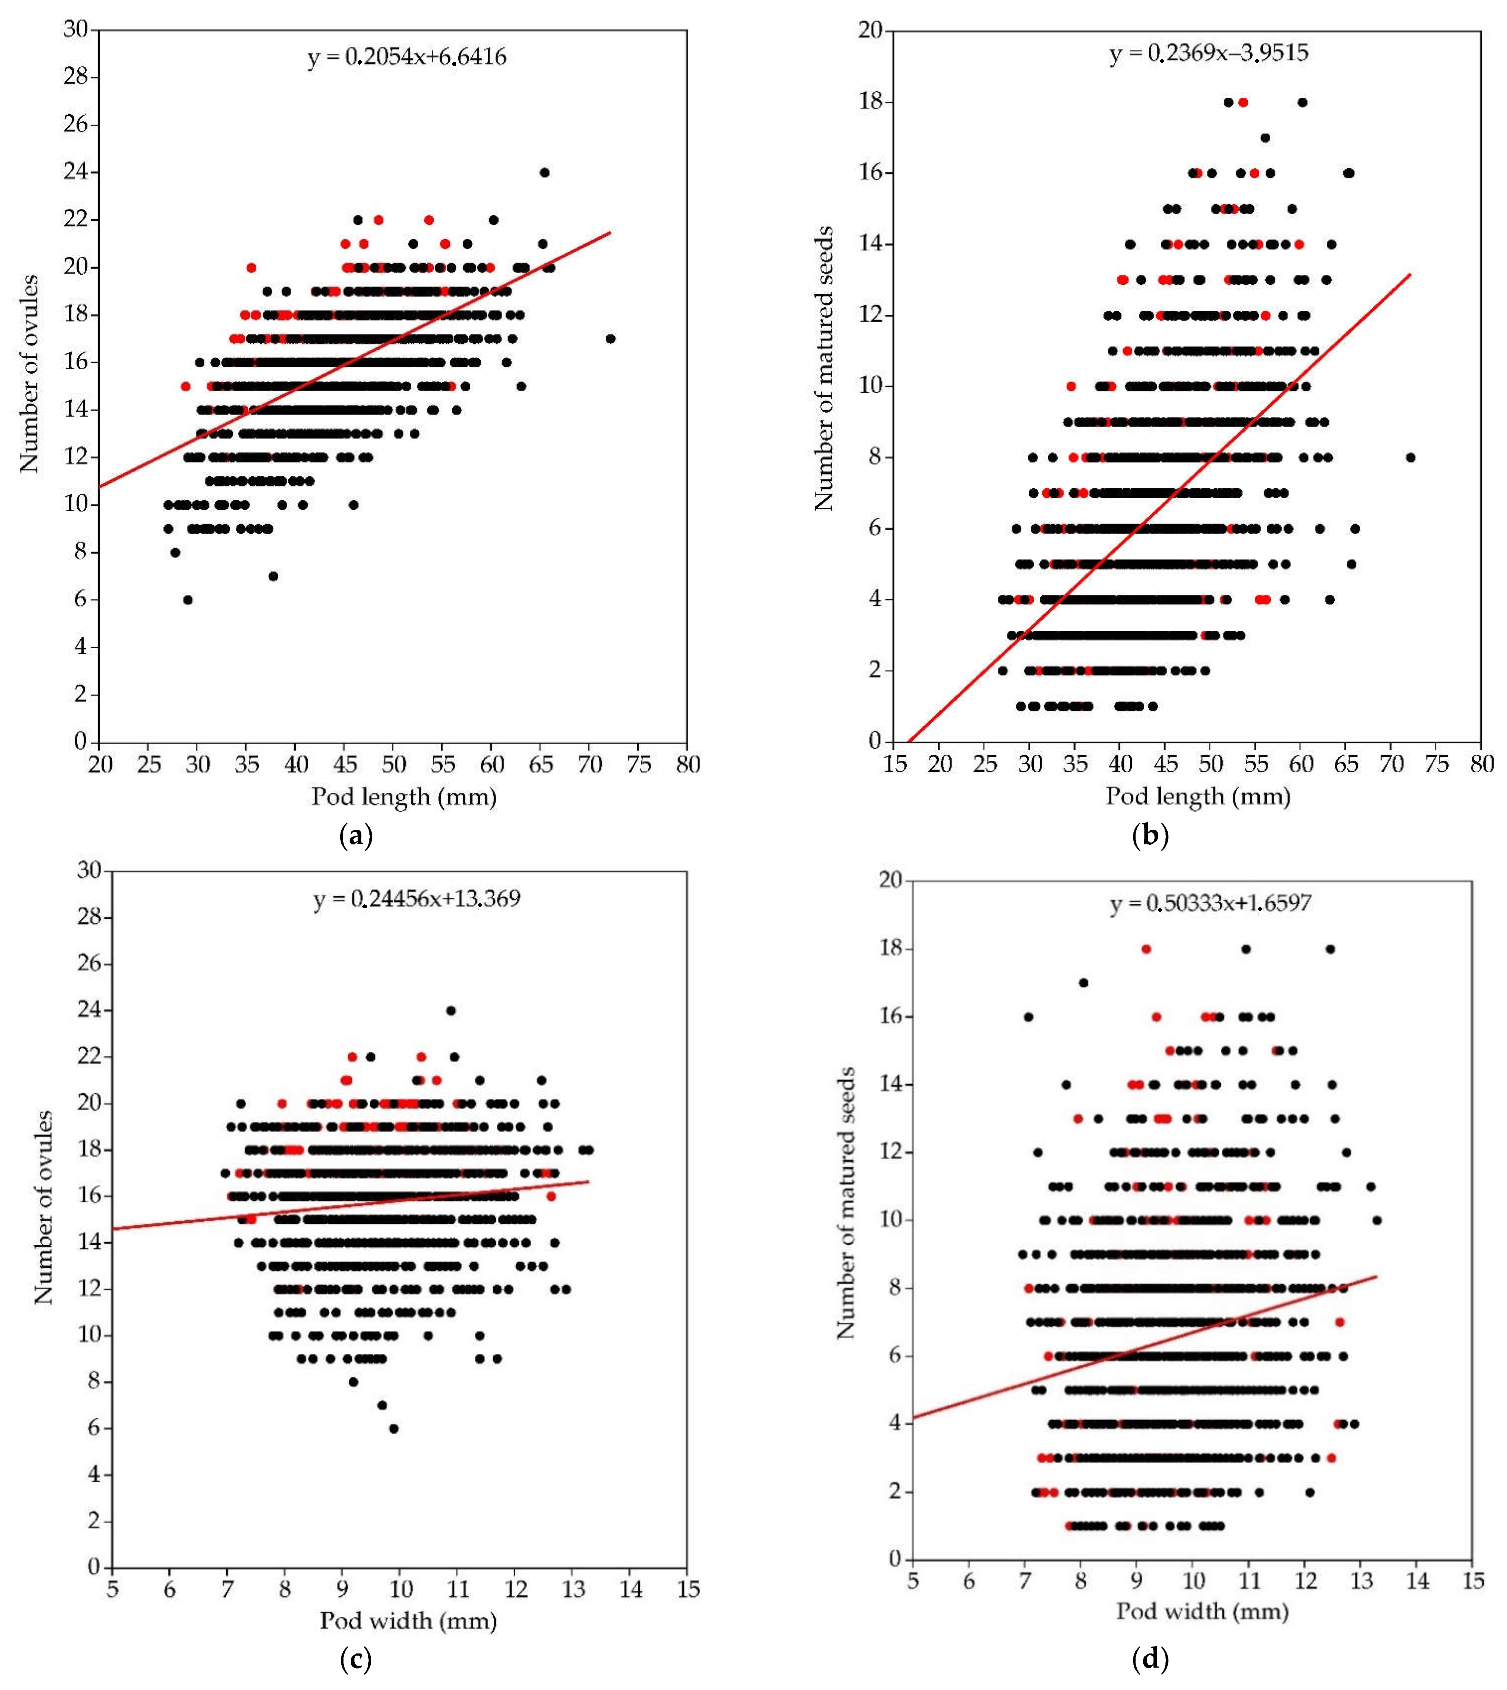
3.1.4. Pod Size
3.2. Effect of Habitat Type on Reproductive Traits
3.2.1. Number of Ovules
3.2.2. Number of Matured Seeds
3.2.3. Number of Aborted Ovules
3.2.4. Pod Size
3.3. Comparison of Reproductive Traits between Years
4. Discussion
4.1. Effect of Population Origin and Site on Reproductive Traits
4.2. Effect of Habitat Type on Reproductive Traits
4.3. Comparison of Reproductive Traits between Years
5. Conclusions
Author Contributions
Funding
Institutional Review Board Statement
Informed Consent Statement
Acknowledgments
Conflicts of Interest
Appendix A

| Number | Site Name | Habitat Type | Cover of Cytisus sco-parius (%) | Cover of the Layer (%) | |||
|---|---|---|---|---|---|---|---|
| Tree | Shrub | Herbs | Bryo-Phytes | ||||
| Native range | |||||||
| 1 | Walsdorf | Woodland fringe | 20 | 20 | 30 | 50 | 20 |
| 2 | Vianden | Inland cliff | 15 | 0 | 15 | 10 | 5 |
| 3 | Übereisenbach | Inland cliff | 10 | 0 | 10 | 15 | 5 |
| Invasive range | |||||||
| 4 | Grūtas | Shrubby clearing | 30 | 0 | 40 | 30 | 30 |
| 5 | Veisiejai | Woodland fringe | 25 | 20 | 30 | 40 | 30 |
| 6 | Meteliai | Shrubby clearing | 20 | 0 | 40 | 30 | 40 |
| 7 | Valkininkai | Pine woodland | 15 | 60 | 40 | 30 | 70 |
| 8 | Kabakėlis | Taiga woodland | 20 | 50 | 30 | 40 | 60 |
| 9 | Kaltanėnai | Taiga woodland | 15 | 50 | 40 | 30 | 60 |
| 10 | Nagliai | Grey dunes | 30 | 0 | 30 | 30 | 50 |
| 11 | Juodkrantė | Grey dunes | 20 | 0 | 20 | 30 | 40 |
| 12 | Didžiasalis | Pine woodland | 20 | 60 | 30 | 30 | 60 |
Appendix B
| Sites | Wals-dorf | Vian-den | Übereis-enbach | Grūtas | Veisie-jai | Mete-liai | Valki-ninkai | Kaba-kėlis | Kalta-nėnai | Nag-liai | Juod-krantė | Didžia-salis |
|---|---|---|---|---|---|---|---|---|---|---|---|---|
| Walsdorf | 0.859 | 0.995 | 0.998 | <0.001 | <0.001 | <0.001 | <0.001 | <0.001 | 0.954 | 0.996 | <0.001 | |
| Vianden | 2.43 | 0.173 | 0.997 | <0.001 | <0.001 | <0.001 | <0.001 | <0.001 | 0.996 | 0.859 | <0.001 | |
| Übereisenbach | 1.56 | 3.99 | 0.824 | <0.001 | <0.001 | <0.001 | <0.001 | <0.001 | 0.313 | 0.995 | <0.001 | |
| Grūtas | 0.97 | 1.46 | 2.53 | <0.001 | <0.001 | <0.001 | <0.001 | <0.001 | 0.997 | 0.999 | <0.001 | |
| Veisiejai | 9.83 | 7.39 | 11.38 | 8.85 | <0.001 | 0.999 | 0.986 | 0.030 | <0.001 | <0.001 | 0.875 | |
| Meteliai | 16.73 | 14.30 | 18.29 | 15.76 | 6.91 | <0.001 | 0.015 | 0.954 | <0.001 | <0.001 | 0.063 | |
| Valkininkai | 9.73 | 7.30 | 11.28 | 8.76 | 0.10 | 7.00 | 0.978 | 0.024 | <0.001 | <0.001 | 0.842 | |
| Kabakėlis | 11.58 | 9.14 | 13.13 | 10.60 | 1.75 | 5.16 | 1.85 | 0.549 | <0.001 | <0.001 | 0.997 | |
| Kaltanėnai | 14.69 | 12.26 | 16.25 | 13.72 | 4.86 | 2.04 | 4.96 | 3.11 | <0.001 | <0.001 | 0.842 | |
| Nagliai | 2.04 | 0.39 | 3.60 | 1.07 | 7.78 | 14.69 | 7.69 | 9.53 | 12.65 | 0.954 | <0.001 | |
| Juodkrantė | 0.00 | 2.43 | 1.56 | 0.97 | 9.83 | 16.73 | 9.73 | 11.58 | 14.69 | 2.04 | <0.001 | |
| Didžiasalis | 12.21 | 9.78 | 13.76 | 11.24 | 2.38 | 4.52 | 2.48 | 0.63 | 2.48 | 10.17 | 12.21 |
| Sites | Wals-dorf | Vian-den | Übereis-enbach | Grūtas | Veisie-jai | Mete-liai | Valki-ninkai | Kaba-kėlis | Kalta-nėnai | Nag-liai | Juod-krantė | Didžia-salis |
|---|---|---|---|---|---|---|---|---|---|---|---|---|
| Walsdorf | 0.998 | <0.001 | <0.001 | 0.999 | 0.995 | 0.193 | 0.997 | 0.998 | 0.585 | <0.001 | 0.985 | |
| Vianden | 1.01 | <0.001 | <0.001 | 0.997 | 0.809 | 0.654 | 0.998 | 0.996 | 0.154 | <0.001 | 0.996 | |
| Übereisenbach | 6.59 | 7.61 | 0.087 | <0.001 | 0.020 | <0.001 | <0.001 | <0.001 | 0.334 | 0.007 | <0.001 | |
| Grūtas | 10.95 | 11.97 | 4.36 | <0.001 | <0.001 | <0.001 | <0.001 | <0.001 | <0.001 | 0.997 | <0.001 | |
| Veisiejai | 0.17 | 1.18 | 6.42 | 10.79 | 0.998 | 0.145 | 0.998 | 0.996 | 0.671 | <0.001 | 0.970 | |
| Meteliai | 1.56 | 2.57 | 5.04 | 9.40 | 1.39 | 0.006 | 0.970 | 0.977 | 0.996 | <0.001 | 0.446 | |
| Valkininkai | 3.92 | 2.91 | 10.52 | 14.88 | 4.09 | 5.48 | 0.334 | 0.305 | <0.001 | <0.001 | 0.932 | |
| Kabakėlis | 0.37 | 0.64 | 6.97 | 11.33 | 0.54 | 1.93 | 3.55 | 0.999 | 0.397 | <0.001 | 0.998 | |
| Kaltanėnai | 0.30 | 0.71 | 6.90 | 11.26 | 0.47 | 1.86 | 3.62 | 0.07 | 0.430 | <0.001 | 0.997 | |
| Nagliai | 3.04 | 4.06 | 3.55 | 7.91 | 2.87 | 1.49 | 6.97 | 3.42 | 3.35 | <0.001 | 0.034 | |
| Juodkrantė | 12.04 | 13.05 | 5.44 | 1.08 | 11.87 | 10.48 | 15.96 | 12.41 | 12.34 | 8.99 | <0.001 | |
| Didžiasalis | 1.76 | 0.74 | 8.35 | 12.71 | 1.93 | 3.31 | 2.16 | 1.39 | 1.45 | 4.80 | 13.80 |
| Sites | Wals-dorf | Vian-den | Übereis-enbach | Grūtas | Veisie-jai | Mete-liai | Valki-ninkai | Kaba-kėlis | Kalta-nėnai | Nag-liai | Juod-krantė | Didžia-salis |
|---|---|---|---|---|---|---|---|---|---|---|---|---|
| Walsdorf | 0.997 | 0.002 | <0.001 | <0.001 | <0.001 | 0.585 | <0.001 | <0.001 | 0.036 | <0.001 | <0.001 | |
| Vianden | 0.72 | 0.014 | <0.001 | <0.001 | <0.001 | 0.894 | <0.001 | <0.001 | 0.153 | <0.001 | <0.001 | |
| Übereisenbach | 5.91 | 5.18 | <0.001 | 0.994 | <0.001 | 0.677 | 0.894 | 0.042 | 0.996 | <0.001 | 0.999 | |
| Grūtas | 12.47 | 11.74 | 6.56 | 0.023 | 0.991 | <0.001 | 0.110 | 0.978 | <0.001 | 0.997 | 0.011 | |
| Veisiejai | 7.50 | 6.78 | 1.59 | 4.96 | <0.001 | 0.072 | 0.997 | 0.547 | 0.746 | 0.008 | 0.996 | |
| Meteliai | 14.13 | 13.41 | 8.23 | 1.67 | 6.63 | <0.001 | 0.002 | 0.350 | <0.001 | 0.999 | <0.001 | |
| Valkininkai | 3.04 | 2.32 | 2.86 | 9.42 | 4.46 | 11.09 | 0.014 | <0.001 | 0.987 | <0.001 | 0.126 | |
| Kabakėlis | 8.23 | 7.50 | 2.32 | 4.24 | 0.72 | 5.91 | 5.18 | 0.872 | 0.384 | 0.045 | 0.996 | |
| Kaltanėnai | 10.62 | 9.89 | 4.71 | 1.85 | 3.12 | 3.52 | 7.57 | 2.39 | 0.002 | 0.904 | 0.401 | |
| Nagliai | 4.78 | 4.06 | 1.12 | 7.68 | 2.72 | 9.35 | 1.74 | 3.44 | 5.83 | <0.001 | 0.861 | |
| Juodkrantė | 12.90 | 12.18 | 6.99 | 0.43 | 5.40 | 1.23 | 9.86 | 4.67 | 2.28 | 8.12 | 0.004 | |
| Didžiasalis | 7.21 | 6.49 | 1.30 | 5.25 | 0.29 | 6.92 | 4.17 | 1.02 | 3.41 | 2.43 | 5.69 |
| Sites | Wals-dorf | Vian-den | Übereis-enbach | Grūtas | Veisie-jai | Mete-liai | Valki-ninkai | Kaba-kėlis | Kalta-nėnai | Nag-liai | Juod-krantė | Didžia-salis |
|---|---|---|---|---|---|---|---|---|---|---|---|---|
| Walsdorf | 0.977 | 0.988 | <0.001 | 0.998 | 0.988 | 0.997 | 0.997 | 0.305 | 0.999 | 0.038 | 0.997 | |
| Vianden | 1.86 | 0.325 | <0.001 | 0.587 | 0.999 | 0.937 | 0.458 | 0.985 | 0.986 | <0.001 | 0.998 | |
| Übereisenbach | 1.71 | 3.57 | <0.001 | 0.998 | 0.390 | 0.998 | 0.996 | 0.009 | 0.981 | 0.586 | 0.705 | |
| Grūtas | 7.78 | 9.64 | 6.07 | <0.001 | <0.001 | <0.001 | <0.001 | <0.001 | <0.001 | 0.595 | <0.001 | |
| Veisiejai | 1.18 | 3.04 | 0.53 | 6.60 | 0.660 | 0.997 | 0.997 | 0.034 | 0.999 | 0.324 | 0.907 | |
| Meteliai | 1.72 | 0.14 | 3.43 | 9.50 | 2.90 | 0.961 | 0.530 | 0.973 | 0.993 | <0.001 | 0.996 | |
| Valkininkai | 0.28 | 2.14 | 1.43 | 7.50 | 0.90 | 2.00 | 0.999 | 0.200 | 0.996 | 0.070 | 0.998 | |
| Kabakėlis | 1.43 | 3.29 | 0.28 | 6.35 | 0.25 | 3.15 | 1.15 | 0.019 | 0.995 | 0.442 | 0.826 | |
| Kaltanėnai | 3.62 | 1.76 | 5.33 | 11.40 | 4.80 | 1.90 | 3.90 | 5.05 | 0.352 | <0.001 | 0.826 | |
| Nagliai | 0.11 | 1.75 | 1.82 | 7.89 | 1.29 | 1.61 | 0.39 | 1.54 | 3.51 | 0.030 | 0.999 | |
| Juodkrantė | 4.75 | 6.61 | 3.04 | 3.03 | 3.57 | 6.47 | 4.47 | 3.32 | 8.37 | 4.86 | 0.002 | |
| Didžiasalis | 1.09 | 0.77 | 2.81 | 8.87 | 2.27 | 0.62 | 1.37 | 2.53 | 2.53 | 0.98 | 5.85 |
| Sites | Wals-dorf | Vian-den | Übereis-enbach | Grūtas | Veisie-jai | Mete-liai | Valki-ninkai | Kaba-kėlis | Kalta-nėnai | Nag-liai | Juod-krantė | Didžia-salis |
|---|---|---|---|---|---|---|---|---|---|---|---|---|
| Walsdorf | 0.999 | 0.997 | <0.001 | 0.122 | <0.001 | 0.973 | 0.998 | 0.999 | 0.780 | <0.001 | 0.001 | |
| Vianden | 0.44 | 0.999 | <0.001 | 0.253 | <0.001 | 0.997 | 0.998 | 0.996 | 0.567 | <0.001 | 0.004 | |
| Übereisenbach | 0.90 | 1.33 | <0.001 | 0.018 | <0.001 | 0.709 | 0.997 | 0.998 | 0.986 | 0.004 | <0.001 | |
| Grūtas | 8.25 | 7.82 | 9.15 | 0.150 | 0.992 | <0.001 | <0.001 | <0.001 | <0.001 | <0.001 | 0.921 | |
| Veisiejai | 4.19 | 3.75 | 5.08 | 4.07 | 0.857 | 0.903 | 0.192 | 0.033 | <0.001 | <0.001 | 0.978 | |
| Meteliai | 6.62 | 6.19 | 7.52 | 1.63 | 2.44 | 0.041 | <0.001 | <0.001 | <0.001 | <0.001 | 0.997 | |
| Valkininkai | 1.90 | 1.46 | 2.80 | 6.36 | 2.29 | 4.73 | 0.992 | 0.824 | 0.061 | <0.001 | 0.132 | |
| Kabakėlis | 0.26 | 0.18 | 1.16 | 8.00 | 3.93 | 6.36 | 1.64 | 0.996 | 0.658 | <0.001 | 0.003 | |
| Kaltanėnai | 0.63 | 1.07 | 0.27 | 8.88 | 4.82 | 7.25 | 2.53 | 0.89 | 0.959 | 0.002 | <0.001 | |
| Nagliai | 2.64 | 3.08 | 1.74 | 10.89 | 6.83 | 9.26 | 4.54 | 2.90 | 2.01 | 0.202 | <0.001 | |
| Juodkrantė | 6.54 | 6.97 | 5.64 | 14.79 | 10.72 | 13.16 | 8.43 | 6.79 | 5.91 | 3.90 | <0.001 | |
| Didžiasalis | 6.04 | 5.60 | 6.94 | 2.21 | 1.86 | 0.58 | 4.14 | 5.78 | 6.67 | 8.68 | 12.58 |
Appendix C
| Habitat Types | Number of Ovules | Number of Matured Seeds | Number of Aborted Ovules | Pod Length (mm) | Pod Width (mm) |
|---|---|---|---|---|---|
| Inland cliffs | 16.84 ± 1.73 ab | 5.73 ± 3.23 ab | 11.11 ± 3.07 a | 43.17 ± 6.36 ah | 9.58 ± 1.01 a |
| Grey dunes | 16.88 ± 1.88 b | 6.41 ± 3.97 c | 10.47 ± 3.70 ab | 45.40 ± 6.80 bg | 9.06 ± 1.12 b |
| Woodland fringes | 16.23 ± 2.43 a | 6.89 ± 3.37 d | 9.36 ± 2.83 bd | 44.80 ± 6.58 fgh | 9.73 ± 1.05 ac |
| Shrubby clearings | 15.27 ± 2.50 cd | 7.73 ± 3.09 cd | 7.54 ± 2.36 c | 45.89 ± 7.51 cf | 10.36 ± 1.07 d |
| Pine woodland | 14.83 ± 2.41 c | 5.04 ± 2.93 ae | 9.79 ± 2.82 b | 43.53 ± 7.74 df | 9.98 ± 1.15 c |
| Western taiga | 14.39 ± 2.29 d | 5.78 ± 2.70 be | 8.61 ± 2.78 d | 43.05 ± 7.29 ef | 9.53 ± 1.13 a |
References
- Moravcová, L.; Pyšek, P.; Jarošík, V.; Pergl, J. Getting the right traits: Reproductive and dispersal characteristics predict the invasiveness of herbaceous plant species. PLoS ONE 2015, 10, e0123634. [Google Scholar] [CrossRef]
- Richardson, D.M.; Pyšek, P.; Rejmanek, M.; Barbour, M.G.; Panetta, D.M.; West, C.J. Naturalization and invasion of alien plants: Concepts and definitions. Divers. Distrib. 2000, 6, 93–107. [Google Scholar] [CrossRef]
- Pyšek, P.; Richardson, D.M. Traits associated with invasiveness in alien plants: Where do we stand? In Ecological Studies; Springer: Berlin/Heidelberg, Germany, 2007; pp. 97–125. [Google Scholar] [CrossRef]
- Jelbert, K.; Stott, I.; McDonald, R.A.; Hodgson, D. Invasiveness of plant is predicted by size and fecundity in the native range. Ecol. Evol. 2015, 5, 1933–1943. [Google Scholar] [CrossRef] [PubMed]
- Herrera, J. Fecundity above species level: Ovule number and brood size in the Genistaseae (Fabaceae: Papilionoideae). Int. J. Plant Sci. 1999, 160, 887–896. [Google Scholar] [CrossRef] [PubMed]
- Burns, J.H.; Pardini, E.A.; Schutzenhofer, M.R.; Chung, A.C.; Seidler, K.J.; Knight, T.M. Greater sexual reproduction contributes to differences in demography of invasive plants and their noninvasive relatives. Ecology 2013, 95, 995–1004. [Google Scholar] [CrossRef] [PubMed]
- Holle, B.V.; Simberoff, D. Ecological resistance to biological invasion overwhelmed by propagule pressure. Ecology 2005, 86, 3212–3218. [Google Scholar] [CrossRef]
- Mason, R.A.B.; Cooke, J.; Moles, A.T.; Leishman, M.R. Reproductive output of invasive versus native plants. Global Ecol. Biogeogr. 2008, 17, 633–640. [Google Scholar] [CrossRef]
- Moravcová, L.; Pyšek, P.; Jarošík, V.; Havlíčková, V.; Zákravský, P. Reproductive characteristics of neophytes in the Czech Republic: Traits of invasive and non-invasive species. Preslia 2010, 82, 365–390. [Google Scholar]
- Burns, J.H.; Ashman, T.; Steets, J.A.; Harmon-Threatt, A.; Knight, T.M. A phylogenetically controlled analysis of the roles of reproductive traits in plant invasions. Oecologia 2011, 166, 1009–1017. [Google Scholar] [CrossRef]
- Simberloff, D. The role of propagule pressure in biological invasions. Ann. Rev. Ecol. Evol. Syst. 2009, 40, 81–102. [Google Scholar] [CrossRef]
- Buyn, C.; de Blois, S.; Brisson, J. Interactions between abiotic constraint, propagule pressure, and biotic resistance regulate plant invasion. Oecologia 2015, 178, 285–296. [Google Scholar] [CrossRef]
- Kostrakiewicz-Gierałt, K.; Pliszko, A.; Barabasz-Krasny, B.; Bomanowska, A.; Dajdok, Z.; Gudžinskas, Z.; Kucharczyk, M.; Maćkowiak, Ł.; Majk, J.; Możdżeń, K.; et al. The relationships of habitat conditions, height level, and geographical position with fruit and seed traits in populations of invasive vine Echinocystis lobata (Cucurbitaceae) in Central and Eastern Europe. Forests 2022, 13, 256. [Google Scholar] [CrossRef]
- Novak, S.J.; Mack, R.N. Genetic variation in Bromus tectorum (Poaceae): Comparison between native and introduced populations. Heredity 1993, 71, 167–176. [Google Scholar] [CrossRef]
- Vilá, M.; Gómez, A.; Maron, J.L. Are alien plants more competitive than their native conspecifics? A test using Hypericum perforatum L. Oecologia 2003, 137, 211–215. [Google Scholar] [CrossRef]
- Ricklefs, R.R.; Guo, Q.; Qian, H. Growth form and distribution of introduced plants in their native and non-native ranges in Eastern Asia and North America. Divers. Distrib. 2008, 14, 381–386. [Google Scholar] [CrossRef]
- Alexander, J.M.; Naylor, B.; Poll, M.; Edwards, P.J.; Dietz, H. Plant invasions along mountain roads: The altitudinal amplitude of alien Asteraceae forbs in their native and introduced ranges. Ecography 2009, 32, 334–344. [Google Scholar] [CrossRef]
- Herrera, A.M.; Raymond, I.; Millis, C.N.J. Introduced populations of Genista monspessulana (French broom) are more dense and produce a greater seed rain in California, USA, than native populations in the Mediterranean Basin of Europe. Biol. Invasions 2011, 13, 369–380. [Google Scholar] [CrossRef]
- Grigulis, K.; Sheppard, A.W.; Ash, J.E.; Groves, R.H. The comparative demography of the pasture weed Echium plantagineum between its native and invaded ranges. J. Appl. Ecol. 2001, 38, 281–290. [Google Scholar] [CrossRef]
- Paynter, Q.; Downey, P.O.; Sheppard, A.W. Age structure and growth of the woody legume weed Cytisus scoparius in native and exotic habitats: Implications for control. J. Appl. Ecol. 2003, 40, 470–480. [Google Scholar] [CrossRef]
- Ollivier, M.; Kazakou, E.; Corbin, M.; Sartori, K.; Gooden, B.; Lesieur, V.; Thomann, T.; Martin, J.-F.; Tixier, M.S. Trait differentiation between native and introduced populations of the invasive plant Sonchus oleraceus L. (Asteraceae). NeoBiota 2020, 55, 85–115. [Google Scholar] [CrossRef]
- Jakobs, G.; Weber, E.; Edwards, P.J. Introduced plants of the invasive Solidago gigantea (Asteraceae) are larger and grow denser than conspecifics in the native range. Divers. Distrib. 2004, 10, 11–19. [Google Scholar] [CrossRef]
- Pál, R.W.; Chen, S.; Nagy, D.U.; Callaway, R.M. Impacts of Solidago gigantea on other species at home and away. Biol. Invasions 2015, 17, 3317–3325. [Google Scholar] [CrossRef]
- Pettenkofer, T.; Burkardt, K.; Ammer, C.; Torsten, V.; Finkeldey, R.; Müller, M.; Krutovsky, K.; Vorman, B.; Leinemann, L.; Gailing, O. Genetic diversity and differentiation of introduced red oak (Quercus rubra) in Germany in comparison with reference native North American populations. Eur. J. Forest Res. 2019, 138, 275–285. [Google Scholar] [CrossRef]
- Bucharova, A.; Van Kleunen, M. Introduction history and species characteristics partly explain naturalization success of North American woody species in Europe. J. Ecol. 2009, 97, 230–238. [Google Scholar] [CrossRef]
- Pyšek, P.; Lambdon, P.W.; Arianoutsou, M.; Kühn, I.; Pino, J.; Winter, M. Chapter 4. Alien Vascular Plants of Europe. In Handbook of Alien Species in Europe; Springer: Berlin/Heidelberg, Germany, 2009; pp. 43–61. [Google Scholar]
- Nentwig, W.; Bacher, S.; Kumschick, S.; Pyšek, P.; Vilà, M. More than “100 worst” alien species in Europe. Biol. Invasions 2018, 20, 1611–1621. [Google Scholar] [CrossRef]
- Rosenmeier, L.; Kjær, E.D.; Nielsen, L.R. The Scotch broom, Cytisus scoparius (Fabaceae), a paradox in Denmark–an invasive plant or endangered native species? Bot. J. Linn. Soc. 2013, 171, 429–440. [Google Scholar] [CrossRef]
- Patamsytė, J.; Naugžemys, D.; Čėsnienė, T.; Kleizaitė, V.; Demina, O.N.; Mikhailova, S.I.; Agafonov, V.A.; Žvingila, D. Evaluation and comparison of the genetic structure of Bunias orientalis populations in their native range and two non-native ranges. Plant Ecol. 2018, 219, 101–114. [Google Scholar] [CrossRef]
- Kołodziejek, J. Growth and competitive interaction between seedlings of an invasive Rumex confertus and of cooccurring two native Rumex species in relation to nutrient availability. Sci. Rep. 2019, 9, 3298. [Google Scholar] [CrossRef] [PubMed]
- Brandes, U.; Furevik, B.B.; Nielsen, L.R.; Kjær, E.D.; Rosef, L.; Fjellheim, S. Introduction history and population genetics of intracontinental scotch broom (Cytisus scoparius) invasion. Divers. Distrib. 2019, 25, 1773–1786. [Google Scholar] [CrossRef]
- Winde, J.; Sønderkær, M.; Nielsen, K.L.; Pagter, M. Is range expansion of introduced Scotch broom (Cytisus scoparius) in Denmark limited by winter cold tolerance? Plant Ecol. 2020, 221, 709–723. [Google Scholar] [CrossRef]
- Essl, F.; Nehring, S.; Klingenstein, F.; Milasowszky, N.; Nowack, C.; Rabitsch, W. Review of risk assessment systems of IAS in Europe and introducing the German-Austrian Black list information system (GABLIS). J. Nat. Conserv. 2011, 19, 339–350. [Google Scholar] [CrossRef]
- Pergl, J.; Sádlo, J.; Petrusek, A.; Laštůvka, Z.; Musil, J.; Perglová, I.; Šanda, R.; Šefrová, H.; Šíma, J.; Vohralík, V.; et al. Black, Grey and Watch Lists of alien species in the Czech Republic based on environmental impacts and management strategy. NeoBiota 2016, 28, 1–37. [Google Scholar] [CrossRef]
- Bomanowska, A.; Adamowski, W.; Kirpluk, I.; Otręba, A.; Rewicz, A. Invasive alien plants in Polish national parks–threats to species diversity. PeerJ 2019, 7, e8034. [Google Scholar] [CrossRef]
- Gudžinskas, Z.; Žalneravičius, E. Invasive plants. In Invasive Species in Lithuania; Ministry of Environment: Vilnius, Lithuania, 2017; pp. 27–44. [Google Scholar]
- Abromeit, J.; Neuhoff, W.; Steffen, H. Flora Von Ost- Und Westpreussen; Band 2; Friedländer & Sohn: Berlin, Germany, 1903. [Google Scholar]
- Gudžinskas, Z. Conspectus of alien plant species of Lithuania. 10. Fabaceae. Bot. Lith. 1999, 5, 103–114. [Google Scholar]
- Taura, L.; Gudžinskas, Z. Life stages and demography of invasive shrub Cytisus scoparius (Fabaceae) in Lithuania. Botanica 2020, 26, 1–14. [Google Scholar] [CrossRef]
- Gudžinskas, Z.; Taura, L. New alien plant species recorded in South Lithuania. Botanica 2020, 26, 170–183. [Google Scholar] [CrossRef]
- Srinivasan, M.P.; Shenoy, K.; Gleeson, S.K. Population structure of Scotch broom (Cytisus scoparius) and its invasion impacts on the resident plant community in the grasslands of Nilgiris, India. Curr. Sci. 2007, 93, 108–1113. [Google Scholar]
- Srinivasan, M.; Kalita, R.; Gurung, I.K.; Bhattacharjee, S.K.; Predit, M.A.; Krishnan, S.; Gleeson, S.K. Seedling germination success and survival of the invasive shrub Scotch broom (Cytisus scoparius) in response to fire and experimental clipping in the montane grasslands of the Nilgiris, south India. Acta Oecol. 2012, 38, 41–48. [Google Scholar] [CrossRef]
- Mkhize, V.; Mhlambi, M.; Nänni, I. Scotch broom (Cytisus scoparius), a horticultural escapee targeted for eradication in South Africa. S. Afr. J. Bot. 2013, 86, 178. [Google Scholar] [CrossRef]
- Williams, P.A. Aspects of the ecology of broom (Cytisus scoparius) in Canterbury, New Zealand. N. Zealand J. Bot. 1981, 19, 31–43. [Google Scholar] [CrossRef]
- Downey, P.O.; Smith, J.M.B. Demography of the invasive shrub Scotch broom (Cytisus scoparius) at Barrington Tops, New South Wales: Insights for management. Austral Ecol. 2000, 25, 477–485. [Google Scholar] [CrossRef]
- Tran, H.; Harrington, K.C.; Robertson, A.W.; Watt, M.S. Assessment of herbicides for selectively controlling broom (Cytisus scoparius) growing with radiata pine (Pinus radiata) in New Zealand. N. Zealand J. For. Sc. 2016, 46, 13. [Google Scholar] [CrossRef]
- Isaacson, D.L. Impacts of broom (Cytisus scoparius) in western North America. Plant Prot. Quart. 2000, 15, 145–148. [Google Scholar]
- Muir, J.L.; Vamosi, J.C. Invasive Scotch broom (Cytisus scoparius, Fabaceae) and the pollination success of three Garry oak-associated plant species. Biol. Invasions 2015, 17, 2429–2446. [Google Scholar] [CrossRef]
- Cordero, R.L.; Torchelsen, F.P.; Anand, M. Cytisus scoparius (Fam. Fabaceae) in southern Brazil–first step of an invasion process? Anais Acad. Brasil. Cienc. 2016, 88, 149–154. [Google Scholar] [CrossRef]
- Shaben, J.; Myers, J.H. Relationships between Scotch broom (Cytisus scoparius), soil nutrients, and plant diversity in the Garry oak savannah ecosystem. Plant Ecol. 2010, 207, 81–91. [Google Scholar] [CrossRef]
- Simberloff, D.; Martín Nuñez, M.A.R. Introduced species and management of a Nothofagus/Austrocedrus forest. Environm. Manag. 2003, 31, 263–275. [Google Scholar] [CrossRef]
- Wheeler, C.T.; Helgerson, O.T.; Perry, D.A.; Gordon, J.C. Nitrogen fixation and biomass accumulation in plant communities dominated by Cytisus scoparius L. in Oregon and Scotland. J. Appl. Ecol. 1987, 24, 231–237. [Google Scholar] [CrossRef]
- Fogarty, G.; Facelli, J.M. Growth and competition of Cytisus scoparius, an invasive shrub, and Australian native shrubs. Plant Ecol. 1999, 144, 27–35. [Google Scholar] [CrossRef]
- Haubensak, K.A.; Parker, I.M. Soil changes accompanying invasion of the exotic shrub Cytisus scoparius in glacial outwash prairies of western Washington. Plant Ecol. 2004, 175, 71–79. [Google Scholar] [CrossRef]
- Caldwell, B.A. Effects of invasive Scotch broom on soil properties in a Pacific coastal prairie soil. Appl. Soil Ecol. 2006, 32, 149–152. [Google Scholar] [CrossRef]
- Slesak, R.A.; Harrington, T.B.; D’Amato, A.W.; Carter, D.R. Legacy effects of non-native Cytisus scoparius in glacial outwash soils: Potential impacts to forest soil productivity in western Washington. Forest Ecol. Manag. 2021, 481, 118733. [Google Scholar] [CrossRef]
- Zarri, A.A.; Rahmani, A.R.; Behan, M.J. Habitat modifications by scotch broom Cytisus scoparius invasion of grasslands of the upper Nilgiris in India. J. Bombay Nat. Hist. Soc. 2006, 103, 356–365. [Google Scholar]
- Bossard, C.C. The role of habitat disturbance, seed predation and ant dispersal on establishment of the exotic shrub Cytisus scoparius in California. Am. Midl. Natur. 1991, 126, 1–13. [Google Scholar] [CrossRef]
- Bossard, C.C. Seed germination in the exotic shrub Cytisus scoparius (Scotch broom) in California. Madroño 1993, 40, 47–61. [Google Scholar]
- Bossard, C.C.; Rejmanek, M. Herbivory, growth, seed production, and re-sprouting of an exotic invasive shrub Cytisus scoparius. Biol. Conser. 1994, 67, 193–200. [Google Scholar] [CrossRef]
- Rees, M.; Paynter, Q. Biological control of Scotch broom: Modelling the determinants of abundance and the potential impact of introduced insect herbivores. J. Appl. Ecol. 1997, 34, 1203–1221. [Google Scholar] [CrossRef]
- Sheppard, A.W.; Hodge, P.; Paynter, Q.; Rees, M. Factors affecting invasion and persistence of broom Cytisus scoparius in Australia. J. Appl. Ecol. 2002, 39, 721–734. [Google Scholar] [CrossRef]
- López, J.; Devesa, J.A.; Ortega-Olivencia, A.; Ruiz, T. Production and morphology of fruit and seeds in Genisteae (Fabaceae) of south-west Spain. Bot. J. Linn. Soc. 2000, 132, 97–120. [Google Scholar] [CrossRef]
- Parker, I.M.; Haubensak, K.A. Comparative pollinator limitation of two non-native shrubs: Do mutualisms influence invasions? Oecologia 2002, 130, 250–258. [Google Scholar] [CrossRef]
- Simpson, S.R.; Gross, C.L.; Silberbauer, L.X. Broom and honeybees in Australia: An alien liaison. Plant Biol. 2005, 7, 541–548. [Google Scholar] [CrossRef]
- Parker, I.M. Pollinator limitation of Cytisus scoparius (Scotch broom), an invasive exotic shrub. Ecology 1997, 78, 1457–1470. [Google Scholar] [CrossRef]
- Smith, J.M.B. An introduction to the biogeography and ecology of broom (Cytisus scoparius) in Australia. Plant Prot. Quart. 2000, 15, 140–144. [Google Scholar]
- Zhang, S.; Isermann, M.; Gan, W.; Breed, M. Invasive Rosa rugosa populations outperform native populations, but some populations have greater invasive potential than others. Sci. Rep. 2018, 8, 5735. [Google Scholar] [CrossRef]
- Baker, H.G. Characteristics and modes of origin of weeds. In The Genetics of Colonising Species; Baker, H.G., Stebbins, G.L., Eds.; Academic Press: Cambridge, MA, USA, 1965; pp. 147–168. [Google Scholar]
- Paynter, Q.; Fowler, S.; Memmott, J.; Sheppard, A.W. Factors affecting the establishment of Cytisus scoparius in southern France: Implications for the managing both native and exotic populations. J. Appl. Ecol. 1998, 35, 582–595. [Google Scholar] [CrossRef]
- Harrington, B.T. Seed germination and seedling emergence of Scotch broom (Cytisus scoparius). Weed Sci. 2009, 57, 620–626. [Google Scholar] [CrossRef]
- Potter, K.J.B.; Kriticos, D.J.; Watt, M.S.; Leriche, A. The current and future potential distribution of Cytisus scoparius: A weed of pastoral systems, natural ecosystems and plantation forestry. Weed Res. 2009, 49, 271–282. [Google Scholar] [CrossRef]
- Ralienė, V. Lithuanian Meteorological Yearbook; 2016; Lithuanian Hydrometeorological Service: Vilnius, Lithuania, 2017. [Google Scholar]
- Kazlauskienė, J.; Kitrienė, Z. Lithuanian Meteorological Yearbook; 2017; Lithuanian Hydrometeorological Service: Vilnius, Lithuania, 2018. [Google Scholar]
- Hammer, Ø.; Harper, D.A.T.; Ryan, P.D. PAST: Paleontological statistics software package for education and data analysis. Palaeontol. Electron. 2001, 4, 1–9. [Google Scholar]
- Van Bogaert, G. Factors affecting seed yield in white clover. Euphytica 1977, 26, 233–239. [Google Scholar] [CrossRef]
- Kephart, S.R. Phenological variation in flowering and fruiting of Asclepias. Am. Midl. Nat. 1987, 118, 64–76. [Google Scholar] [CrossRef]
- Dlugos, D.M.; Collins, H.; Bartelme, E.M.; Drenovsky, R.E. The non-native Rosa multiflora expresses shade avoidance traits under low light availability. Am. J. Bot. 2015, 102, 1323–1331. [Google Scholar] [CrossRef] [PubMed]
- Stout, J.C. Does size matter? Bumblebee behaviour and the pollination of Cytisus scoparius L. (Fabaceae). Apidologie 2000, 31, 129–139. [Google Scholar] [CrossRef]
- Diaz-Forero, I.; Kuusemets, V.; Mänd, M.; Liivamägi, A.; Kaart, T.; Luig, J. Effects of forests habitats on the local abundance of bumblebee species: A landscape-scale study. Balt. Forest 2011, 17, 235–242. [Google Scholar]
- Hossaert, M.; Valéro, M. Effect of ovule position in the pod on patterns of seed formation in two species of Lathyrus (Leguminosae: Papilionoideae). Am. J. Bot. 1988, 75, 1714–1731. [Google Scholar] [CrossRef]
- Arathi, H.S.; Ganeshaiah, K.N.; Uma Shaanker, R.; Hegde, S.G. Seed abortion in Pongamia pinnata (Fabaceae). Am. J. Bot. 1999, 86, 659–662. [Google Scholar] [CrossRef]
- Haberer, G.; Kieber, J.J. Cytokinins. New insights into a classic phytohormone. Am. Soc. Plant Physiol. 2002, 128, 354–362. [Google Scholar] [CrossRef]
- Arathi, H.S. Selective embryo abortion in a perennial tree-legume: A case for maternal advantage of reduced number per fruit. J. Plant Res. 2011, 124, 675–681. [Google Scholar] [CrossRef]
- Herrera, C.M. Dissecting factors responsible for individual variation in plant fecundity. Ecology 1991, 72, 1436–1448. [Google Scholar] [CrossRef]
- Hanzawa, F.M.; Kalisz, S. The relationship between age, size, and reproduction in Trillium grandiflorum (Liliaceae). Am. J. Bot. 1993, 80, 405–410. [Google Scholar] [CrossRef]
- Clark, J.C.; Ji, Y. Fecundity and dispersal in plant populations: Implications for structure and diversity. Am. Nat. 1995, 146, 72–111. [Google Scholar] [CrossRef]
- Venugopal, N.; Ahuja, P. Relationship between age, size, fecundity and climatic factors in Panax wangianus an endangered medicinal plant in the sacred grove forest of North-East India. J. For. Res. 2011, 22, 427–435. [Google Scholar] [CrossRef]
- Ehlers, B.K.; Olesen, J.M. Flower production in relation to individual plant age and leaf production among different patches of Corydalis intermedia. Plant Ecol. 2004, 174, 71–78. [Google Scholar] [CrossRef]
- Edelfeldt, S.; Bengtsson, K.; Dahlgren, J.P. Demographic senescence and effects on population dynamics of a perennial plant. Ecology 2019, 100, e02742. [Google Scholar] [CrossRef]
- Sanderson, R.A.; Goffe, L.A.; Leifert, C. Time-series models to quantify short-term effects of meteorological conditions on bumblebee forager activity in agricultural landscapes. Agr. For. Entomol. 2015, 17, 270–276. [Google Scholar] [CrossRef]
- Asmussen, C.B. Pollination biology of the sea pea, Lathyrus japonicus: Floral characters and activity and flight pattern of bumblebees. Flora 1993, 188, 227–237. [Google Scholar] [CrossRef]
- Mena-Alí, J.I.; Rocha, O.J. Effect of ovule position within the pod on the probability of seed production in Bauhinia ungulata (Fabaceae). Ann. Bot. 2005, 95, 449–455. [Google Scholar] [CrossRef]


| Number | Site Name | Country and Administrative Unit | Longitude (°N) | Latitude (°E) | Habitat |
|---|---|---|---|---|---|
| Native range | |||||
| 1 | Walsdorf | Luxembourg, Bamberg distr. | 49.92678 | 6.17394 | Woodland fringe |
| 2 | Vianden | Luxembourg, Diekirch distr. | 49.94018 | 6.20448 | Inland cliff |
| 3 | Übereisenbach | Germany, Bitburg-Prüm distr. | 49.99762 | 6.14206 | Inland cliff |
| Invasive range | |||||
| 4 | Grūtas | Lithuania, Druskininkai distr. | 54.02997 | 24.06246 | Shrubby clearing |
| 5 | Veisiejai | Lithuania, Lazdijai distr. | 54.13799 | 23.67147 | Woodland fringe |
| 6 | Meteliai | Lithuania, Lazdijai distr. | 54.26898 | 23.75269 | Shrubby clearing |
| 7 | Valkininkai | Lithuania, Varėna distr. | 54.35036 | 24.71771 | Pine woodland |
| 8 | Kabakėlis | Lithuania, Švenčionys distr. | 55.01001 | 25.72869 | Taiga woodland |
| 9 | Kaltanėnai | Lithuania, Švenčionys distr. | 55.27716 | 26.12015 | Taiga woodland |
| 10 | Nagliai | Lithuania, Neringa city | 55.46504 | 21.08314 | Grey dunes |
| 11 | Juodkrantė | Lithuania, Neringa city | 55.52240 | 21.09606 | Grey dunes |
| 12 | Didžiasalis | Lithuania, Ignalina distr. | 55.56388 | 26.23861 | Pine woodland |
| Sites | Number of Ovules | Number of Matured Seeds | Number of Aborted Ovules | Pod Length (mm) | Pod Width (mm) |
|---|---|---|---|---|---|
| Native range | |||||
| Walsdorf | 17.09 ± 1.54 | 5.88 ± 2.82 | 11.21 ± 2.77 | 43.81 ± 5.76 | 9.55 ± 0.85 |
| Vianden | 16.59 ± 1.89 | 5.58 ± 3.61 | 11.01 ± 3.36 | 42.53 ± 6.88 | 9.60 ± 1.16 |
| Übereisenbach | 17.41 ± 1.92 | 7.83 ± 3.13 | 9.58 ± 2.61 | 44.98 ± 5.78 | 9.46 ± 0.95 |
| Pooled native range | 17.03 ± 1.81 | 6.43 ± 3.34 | 10.60 ± 3.01 | 43.77 ± 6.22 | 9.54 ± 0.99 |
| Invasive range | |||||
| Grūtas | 16.89 ± 1.47 | 9.05 ± 2.70 | 7.77 ± 2.42 | 49.15 ± 7.49 | 10.44 ± 1.10 |
| Veisiejai | 15.05 ± 2.31 | 5.95 ± 3.36 | 9.14 ± 3.02 | 44.63 ± 7.23 | 10.01 ± 1.07 |
| Meteliai | 13.65 ± 2.25 | 6.34 ± 2.79 | 7.31 ± 2.29 | 42.62 ± 5.97 | 10.27 ± 1.04 |
| Valkininkai | 15.09 ± 2.47 | 4.72 ± 3.20 | 10.37 ± 2.96 | 44.00 ± 8.81 | 9.76 ± 1.14 |
| Kabakėlis | 14.71 ± 2.07 | 5.77 ± 2.00 | 8.94 ± 2.49 | 44.79 ± 6.75 | 9.58 ± 1.32 |
| Kaltanėnai | 14.07 ± 2.48 | 5.79 ± 3.25 | 8.28 ± 3.01 | 41.32 ± 7.43 | 9.49 ± 0.91 |
| Nagliai | 16.67 ± 1.88 | 6.78 ± 3,37 | 9.89 ±2.62 | 43.73 ± 6.74 | 9.27 ± 0.80 |
| Juodkrantė | 17.09 ± 1.87 | 9.44 ± 3.23 | 7.65 ± 2.80 | 47.08 ± 6.46 | 8.85 ± 1.35 |
| Didžiasalis | 14.58 ± 2.33 | 5.36 ± 2.60 | 9.22 ± 2.56 | 43.05 ± 6.52 | 10.21 ± 1.11 |
| Pooled invasive range | 15.31 ± 2.43 | 6.58 ± 3.24 | 8.73 ± 2.86 | 44.48 ± 7.41 | 9.76 ± 1.20 |
| Sites | Year | Number of Ovules | Number of Matured Seeds | Number of Aborted Ovules | Pod Length (mm) | Pod Width (mm) |
|---|---|---|---|---|---|---|
| Valkininkai | 2016 | 15.09 ± 2.47 *** | 4.72 ± 3.20 *** | 10.37 ± 2.96 *** | 44.00 ± 8.8 n.s. | 9.76 ± 1.14 n.s. |
| 2017 | 16.87 ± 1.66 *** | 9.16 ± 3.24 *** | 7.71 ± 2.35 *** | 43.72 ± 5.68 n.s. | 9.50 ± 1.19 n.s. | |
| Juodkrantė | 2016 | 17.09 ± 1.87 n.s. | 9.44 ± 3.23 n.s. | 7.65 ± 2.80 n.s. | 47.08 ± 6.46 n.s. | 8.85 ± 1.35 * |
| 2017 | 17.16 ± 1.76 n.s. | 10.15 ± 3.14 n.s. | 7.01 ± 2.86 n.s. | 47.81 ± 5.48 n.s. | 9.26 ± 0.84 * | |
| Nagliai | 2016 | 16.67 ± 1.88 * | 6.71 ± 2.04 *** | 9.96 ± 2.43 *** | 43.73 ± 6.74 *** | 9.27 ± 0.80 *** |
| 2017 | 16.06 ± 2.03 * | 9.26 ± 2.77 *** | 6.80 ± 2.21 *** | 47.86 ± 5.92 *** | 10.09 ± 0.94 *** | |
| All sites polled | 2016 | 16.28 ± 2.26 * | 6.96 ± 3.46 *** | 9.32 ± 2.98 *** | 44.94 ± 7.54 ** | 9.29 ± 1.18 *** |
| 2017 | 16.70 ± 1.88 * | 9.56 ± 3.10 *** | 7.17 ± 2.51 *** | 46.46 ± 6.00 ** | 9.62 ± 1.06 *** |
| Traits and Factors | Sum of Squares | df | Mean Square | F | p |
|---|---|---|---|---|---|
| Number of ovules | |||||
| Site | 135.79 | 2 | 67.89 | 0.89 | 0.409 |
| Year | 25.63 | 1 | 25.63 | 0.34 | 0.561 |
| Interaction | 151.64 | 2 | 75.82 | 19.64 | <0.001 |
| Within | 2292.88 | 594 | 3.86 | ||
| Total | 2605.94 | 599 | |||
| Number of matured seeds | |||||
| Site | 834.61 | 2 | 417.30 | 2.40 | 0.092 |
| Year | 988.17 | 1 | 988.17 | 5.68 | 0.017 |
| Interaction | 347.84 | 2 | 173.42 | 19.76 | <0.001 |
| Within | 834.61 | 594 | 8.90 | ||
| Total | 7399.44 | 599 | |||
| Number of aborted ovules | |||||
| Site | 297.48 | 2 | 148.74. | 1.67 | 0.189 |
| Year | 695.53 | 1 | 695.53. | 7.81 | 0.005 |
| Interaction | 178.01. | 2 | 89.01 | 12.97 | <0.001 |
| Within | 4075.48 | 594 | 6.86 | ||
| Total | 5246.50 | 599 | |||
| Pod length | |||||
| Site | 1292.29 | 2 | 646.14 | 2.82 | 0.060 |
| Year | 306.36 | 1 | 306.36 | 1.34 | 0.248 |
| Interaction | 458.50 | 2 | 229.25 | 5.46 | 0.004 |
| Within | 24,936.70 | 594 | 41.98 | ||
| Total | 26,993.90 | 599 | |||
| Pod width | |||||
| Site | 42.73 | 2 | 21.37 | 1.44 | 0.237 |
| Year | 13.94 | 1 | 13.94 | 0.94 | 0.332 |
| Interaction | 29.59 | 2 | 14.79 | 13.90 | <0.001 |
| Within | 632.36 | 594 | 1.06 | ||
| Total | 718.62 | 599 |
Publisher’s Note: MDPI stays neutral with regard to jurisdictional claims in published maps and institutional affiliations. |
© 2022 by the authors. Licensee MDPI, Basel, Switzerland. This article is an open access article distributed under the terms and conditions of the Creative Commons Attribution (CC BY) license (https://creativecommons.org/licenses/by/4.0/).
Share and Cite
Gudžinskas, Z.; Taura, L. Do Reproductive Traits of Invasive Populations of Scotch Broom, Cytisus scoparius (Fabaceae), Outperform Native Populations? Plants 2022, 11, 2158. https://doi.org/10.3390/plants11162158
Gudžinskas Z, Taura L. Do Reproductive Traits of Invasive Populations of Scotch Broom, Cytisus scoparius (Fabaceae), Outperform Native Populations? Plants. 2022; 11(16):2158. https://doi.org/10.3390/plants11162158
Chicago/Turabian StyleGudžinskas, Zigmantas, and Laurynas Taura. 2022. "Do Reproductive Traits of Invasive Populations of Scotch Broom, Cytisus scoparius (Fabaceae), Outperform Native Populations?" Plants 11, no. 16: 2158. https://doi.org/10.3390/plants11162158