Article

Determination of Colchicine in Pharmaceutical Formulations, Traditional Extracts, and Ultrasonication-Based Extracts of Colchicum autumnale Pleniflorum (L.) Using Regular and Greener HPTLC Approaches: A Comparative Evaluation of Validation Parameters

1
Department of Pharmacognosy, College of Pharmacy, Prince Sattam Bin Abdulaziz University, Al-Kharj 11942, Saudi Arabia
2
Department of Pharmaceutics, College of Pharmacy, King Saud University, Riyadh 11451, Saudi Arabia
3
Department of Pharmacognosy, Faculty of Pharmacy, Alexandria University, Alexandria 21215, Egypt
*
Author to whom correspondence should be addressed.
Plants 2022, 11(13), 1767; https://doi.org/10.3390/plants11131767
Submission received: 15 June 2022 / Revised: 29 June 2022 / Accepted: 30 June 2022 / Published: 3 July 2022
(This article belongs to the Special Issue Phytochemical Analysis)

Abstract

:
In the literature, there is a scarcity of greener analytical approaches for colchicine (CLH) analysis. As a result, efforts were made in this study to develop and validate a greener reversed-phase high-performance thin-layer chromatography (HPTLC) technique for CLH analysis in traditional extracts (TE) and ultrasonication-based extracts (UBE) of commercial Unani formulations, commercial allopathic formulations, and Colchicum autumnale Pleniflorum (L.) obtained from Egypt and India. This new technique was compared to the regular normal-phase HPTLC method. The greenness profile of both methods was estimated using the Analytical GREENness (AGREE) approach. In the 100–600 and 25–1200 ng/band ranges, regular and greener HPTLC procedures were linear for CLH analysis, respectively. For CLH analysis, the greener HPTLC method was more sensitive, accurate, precise, and robust than the regular HPTLC method. For CLH analysis in TE and UBE of commercial Unani formulations, commercial allopathic formulations, and C. autumnale obtained from Egypt and India, the greener HPTLC method was superior in terms of CLH content compared to the regular HPTLC method. In addition, the UBE procedure was superior to the TE procedure for both methods. The AGREE scores for regular and greener reversed-phase HPTLC methods were found to be 0.46 and 0.75, respectively. The AGREE results showed excellent greener profile of the greener HPTLC method over the regular HPTLC technique. Based on several validation criteria and pharmaceutical assay findings, the greener HPTLC method is regarded as superior to the regular HPTLC approach.

1. Introduction

Colchicine (CLH) is an alkaloidal compound that is commonly obtained from Colchicum autumnale Pleniflorum (L.) (family: Colchicaceae) [1]. In the traditional system of medicine, CLH is used in the treatment of gout [2]. It has also been found to show anti-inflammatory, antimitotic, and anticancer activity [2,3,4] and is used in the treatment of Mediterranean fever [5]. Recently, CLH has also been investigated in the treatment of SARS-COVID-19 [6,7]. CLH is present in various Unani formulations, allopathic formulations, and Ayurvedic formulations. As a consequence, CLH in pharmaceutical dosage forms and plant extracts must be analyzed qualitatively and quantitatively.
A through literature analysis demonstrated various analytical methods for CLH analysis in marketed formulations, plant extracts, and physiological fluids. For analysis of this compound in its pure form and dosage forms, a spectrophotometry approach has been reported [8]. Various high-performance liquid chromatography (HPLC) assays have been used for its detection in different formulations, medicinal extracts, and microbial cultures [9,10,11,12,13,14,15,16,17,18]. An HPLC method has also been used to determine this compound in Colchicum haussknechtii extract using a response surface methodology [19]. This compound has been analyzed in various biological fluids, such as blood serum, blood plasma, and urine samples, using an HPLC approach [11,20,21]. For its determination in serum and plasma samples, various liquid chromatography–mass spectrometry (LC–MS) methods have been reported [1,22,23,24]. For the determination of this compound in various commercial formulations and plant extracts, distinct high-performance thin-layer chromatography (HPTLC) assays have been reported [10,25,26,27,28,29,30,31,32,33,34,35]. Some electrochemical techniques have also been utilized for the determination of this compound [36,37]. The detection of this compound in plant extract has been reported using a fluorescent immunoassay [38]. A multiple-pulse amperometric technique has been reported for its analysis in pharmaceutical formulations and urine samples [39]. Its detection has also been reported using capillary electromigration techniques [40]. The range of analytical techniques for CLH detection has been shown in published studies. However, the greenness profile of the analytical techniques has not been evaluated. Furthermore, no CLH analysis has been recorded using greener HPTLC techniques. Various quantitative analytical methodologies have been utilized in the literature to assess the greenness score [41,42,43,44,45]. However, only the Analytical GREENness (AGREE) approach utilizes all 12 principles of green analytical chemistry (GAC) [43]. As a consequence, AGREE approach was used for the assessment of greenness score of the current HPTLC methods [43].
The goal of this study was to design and validate a reversed-phase HPTLC method for CLH analysis in traditional (TE) and ultrasonication-based extracts (UBE) of commercial Unani formulations, commercial allopathic formulations, and C. autumnale obtained from Egypt and India. This technique was then compared to the regular normal-phase HPTLC method. For the regular analytical method, routine solvent mixtures were used as the mobile phase. However, for the greener analytical method, green solvents mixtures were used as the mobile phase. Using the International Council for Harmonization (ICH) Q2-R1 guidelines, regular and greener HPTLC approaches for CLH analysis were validated [46].

2. Results and Discussion

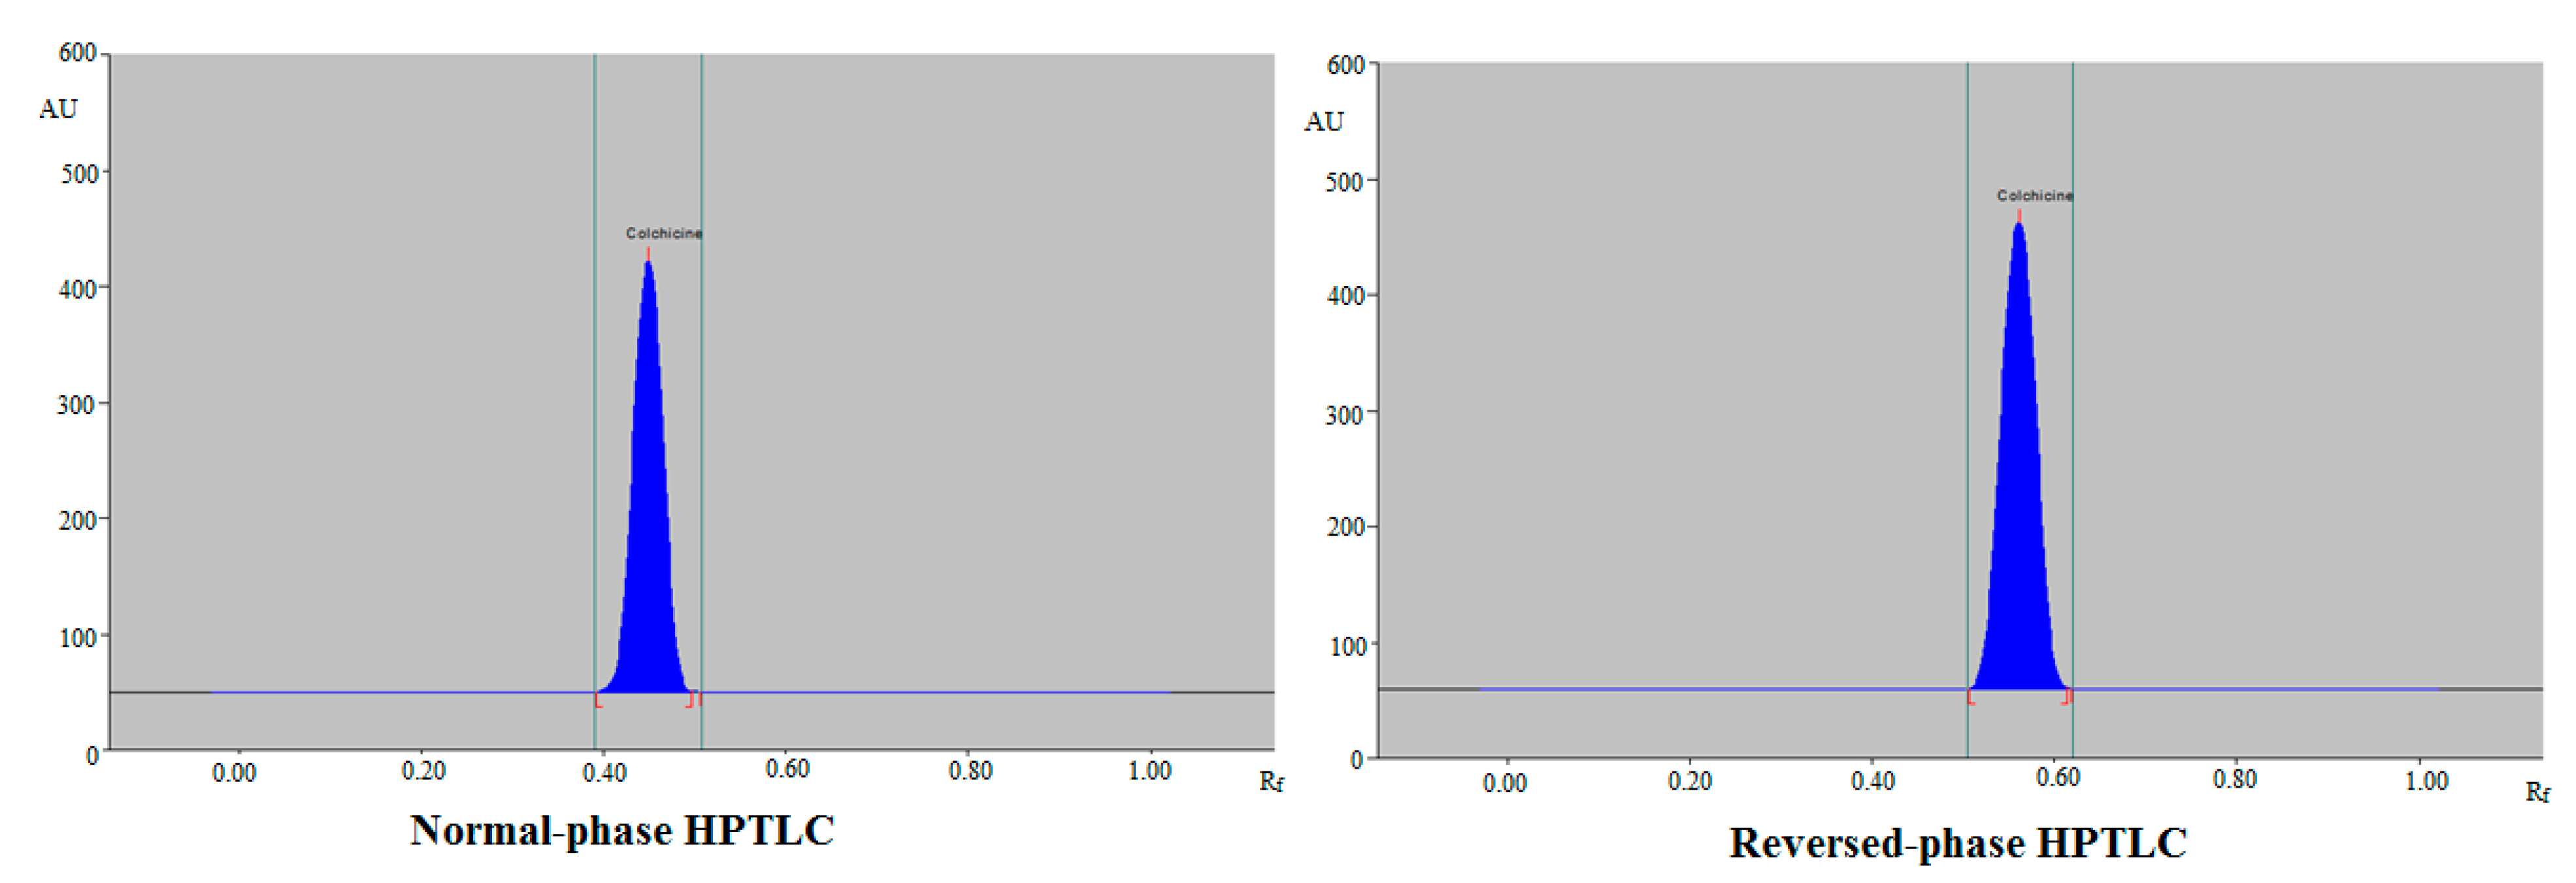
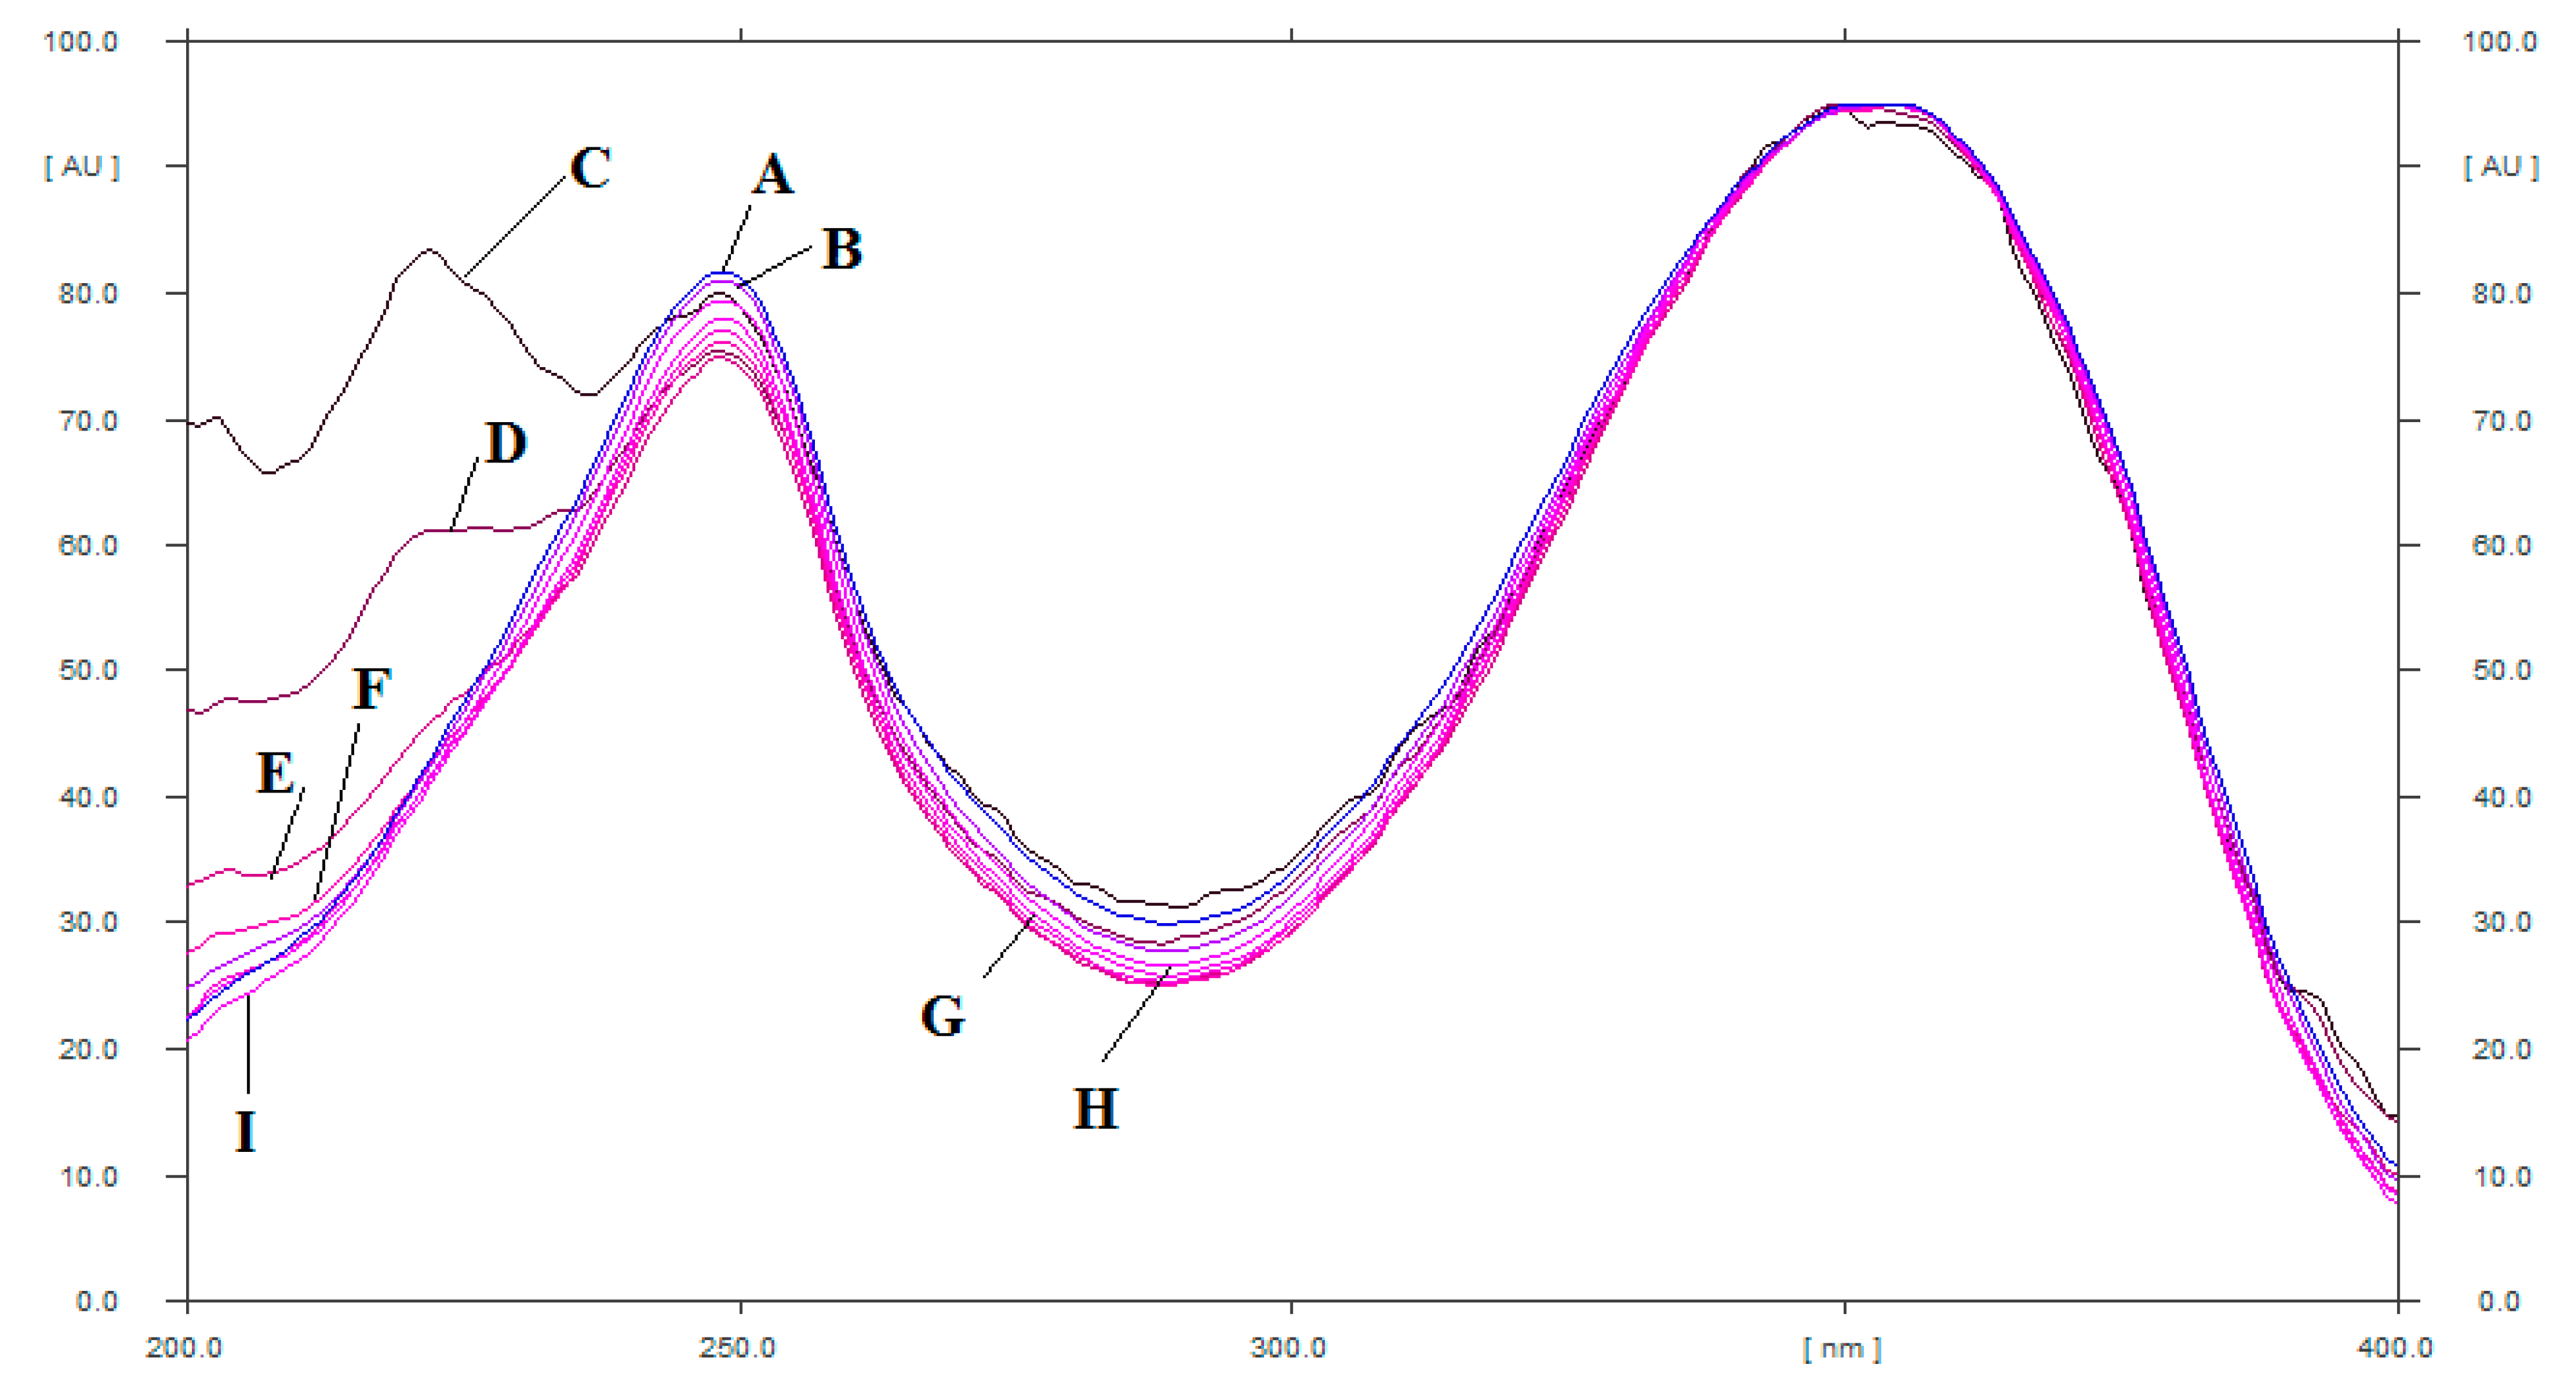
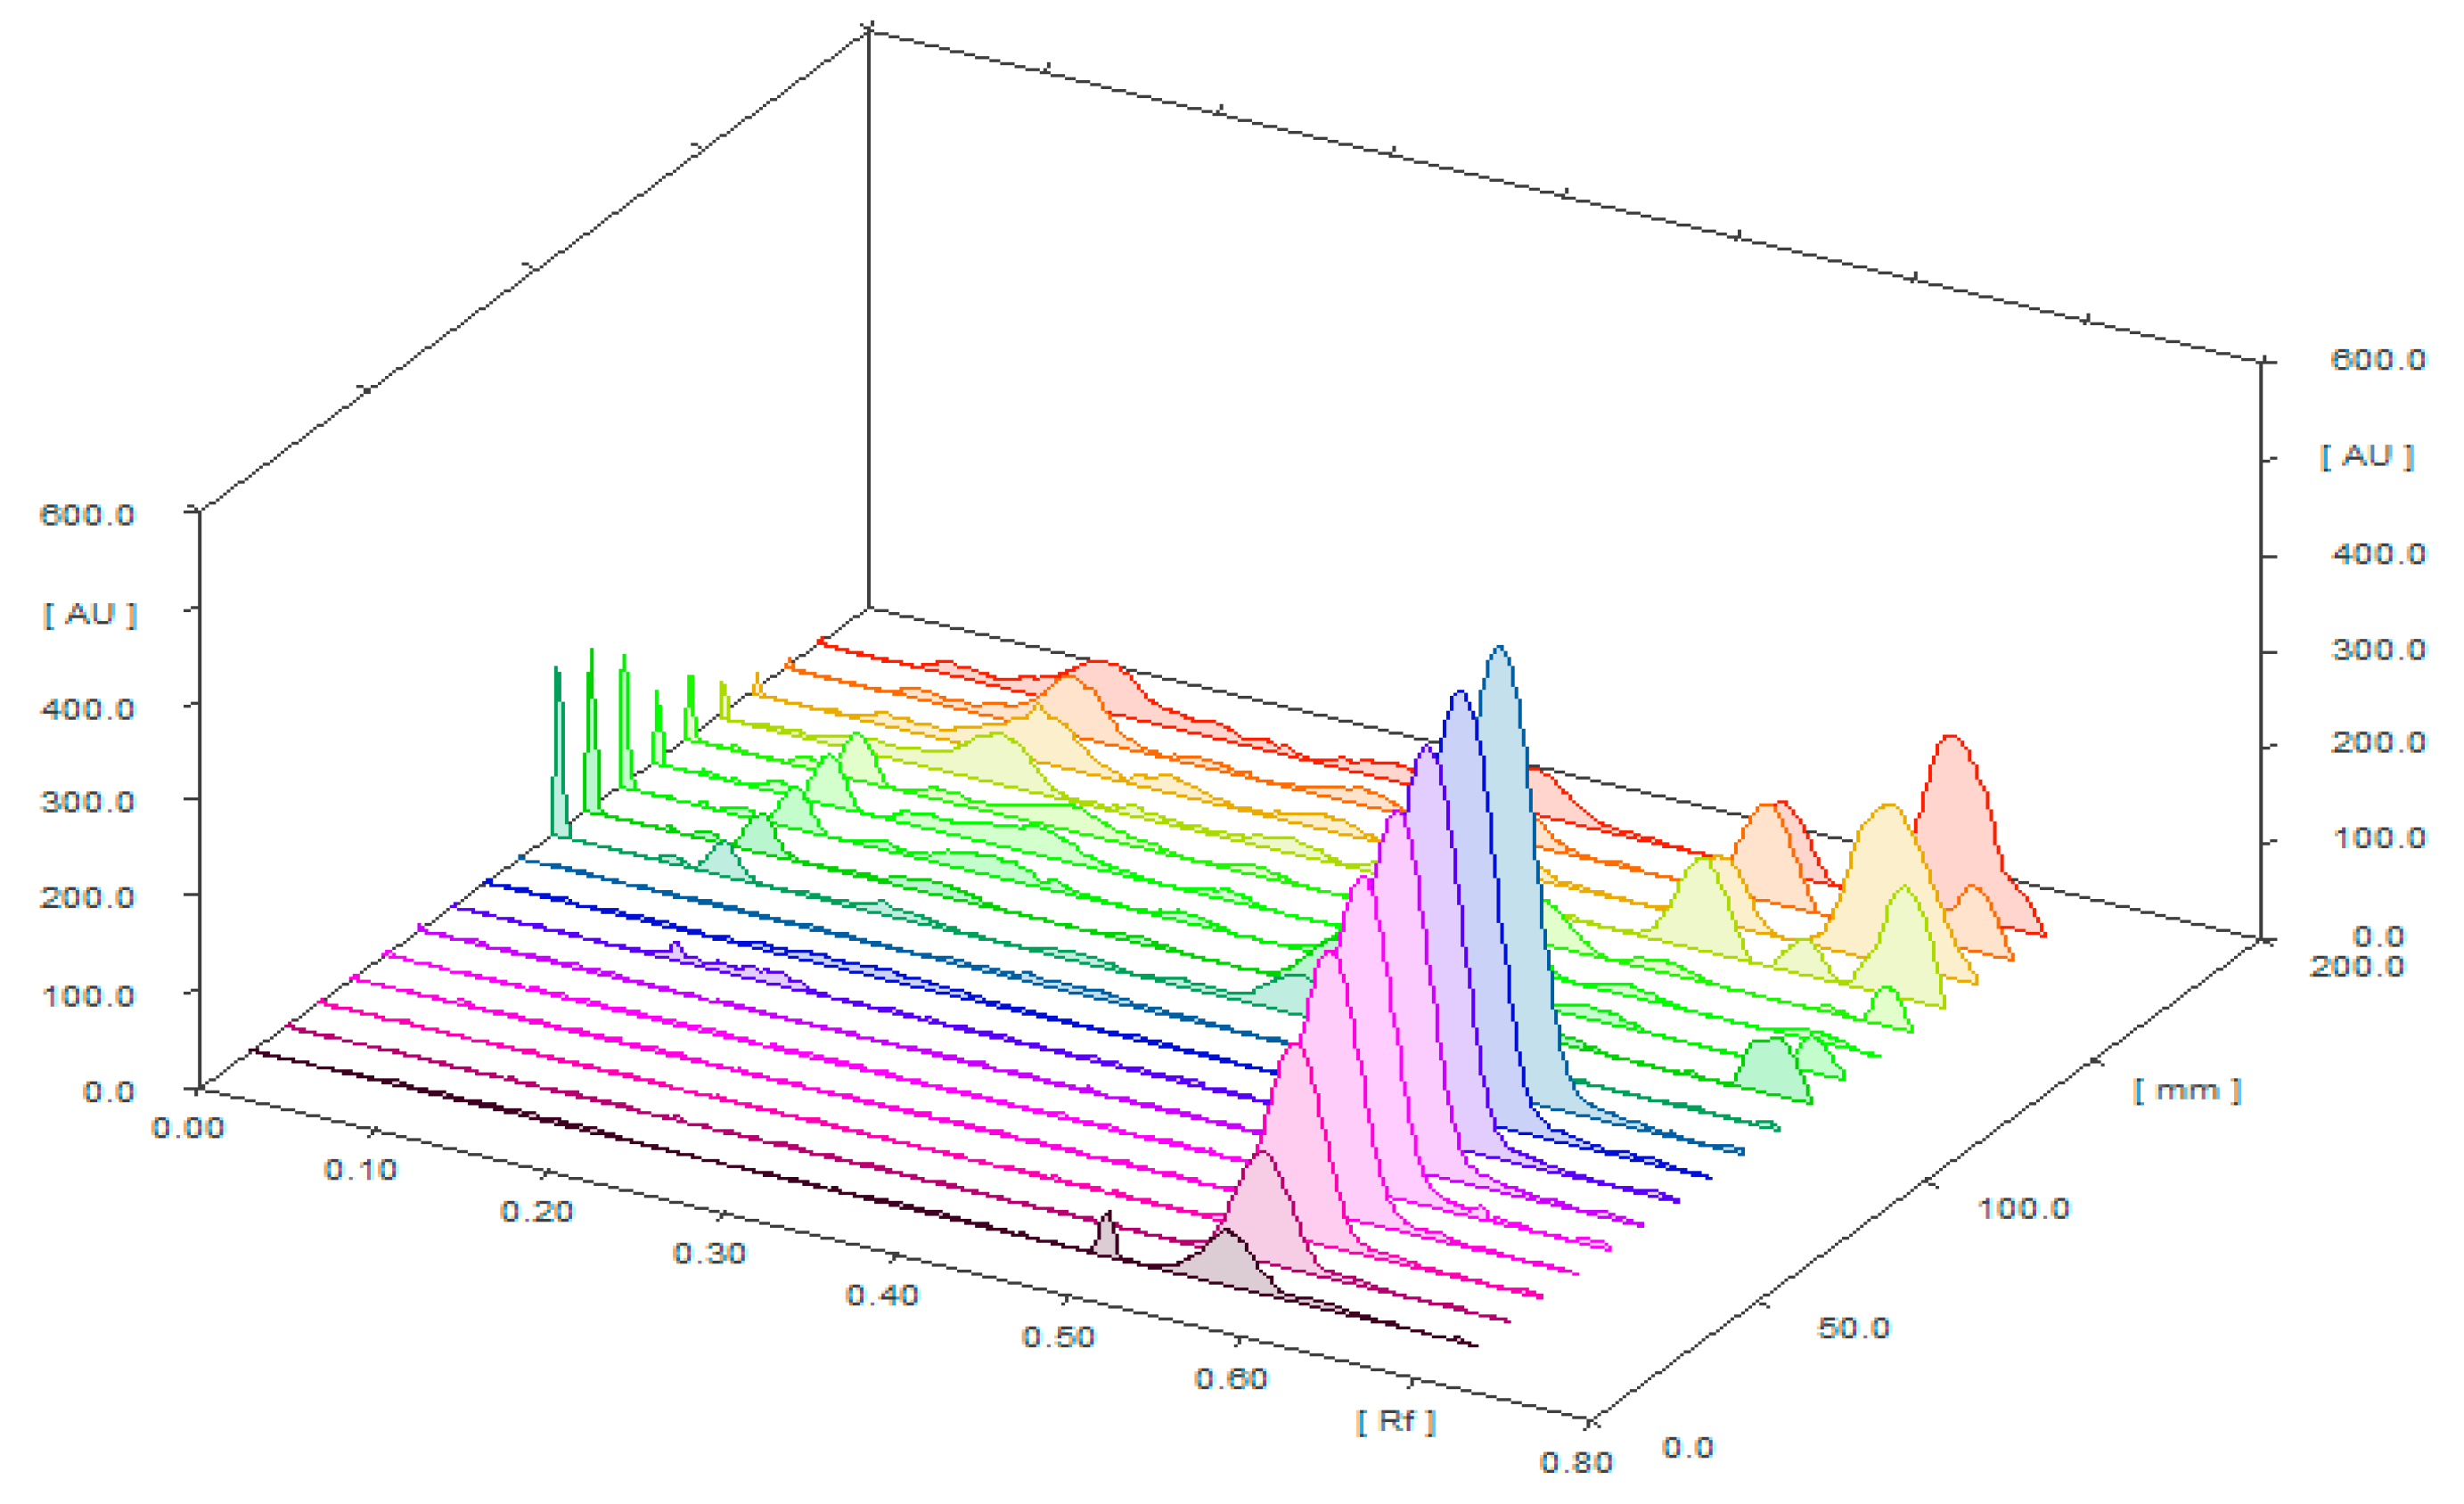
2.1. Method Development

To establish a reliable band for CLH analysis using the regular HPTLC method, different amounts of chloroform (CHCl3) and methanol (MeOH), including CHCl3/MeOH (40:60, v/v), CHCl3/MeOH (50:50, v/v), CHCl3/MeOH (60:40, v/v), CHCl3/MeOH (70:30, v/v), CHCl3/MeOH (80:20, v/v), and CHCl3/MeOH (90:10, v/v), were examined as regular mobile phases. CHCl3/MeOH (40:60, v/v), CHCl3/MeOH (50:50, v/v), CHCl3/MeOH (60:40, v/v), CHCl3/MeOH (70:30, v/v), and CHCl3/MeOH (80:20, v/v) showed poor chromatographic peaks of CLH with high asymmetry factor (As) value (As > 1.20), whereas CHCl3/MeOH (90:10, v/v) presented a well-resolved and intact chromatographic peak for CLH at a retention factor (Rf) = 0.44 ± 0.01 (Figure 1). CLH was also predicted to have As values of 1.07, which is trustworthy. As a result, CHCl3/MeOH (90:10, v/v) was selected as the final regular mobile phase for CLH analysis using the regular HPTLC approach.
To establish a reliable band for CLH analysis using the greener HPTLC approach, different proportions of ethanol (EtOH) and water (H2O), such as EtOH/H2O (40:60, v/v), EtOH/H2O (50:50, v/v), EtOH/H2O (60:40, v/v), EtOH/H2O (70:30, v/v), EtOH/H2O (80:20, v/v), and EtOH/H2O (90:10, v/v), were examined as greener mobile phases. EtOH/H2O (40:60, v/v), EtOH/H2O (50:50, v/v), EtOH/H2O (60:40, v/v), EtOH/H2O (80:20, v/v), and EtOH/H2O (90:10, v/v) presented poor chromatographic peak of CLH with high As value (As > 1.25), whereas EtOH/H2O (70:30, v/v) showed well-resolved and intact chromatographic peak of CLH at Rf = 0.55 ± 0.02 (Figure 1). CLH was also predicted to have As values of 1.03, which is trustworthy. As a result, EtOH/H2O (70:30, v/v) was selected as the final greener mobile phase for CLH analysis using the greener HPTLC approach. The greater TLC response was found at a wavelength of 354 nm for CLH when the spectral bands for CLH were examined under densitometry mode. As a consequence, the whole CLH analysis took place at 354 nm.

2.2. Validation Studies

Different parameters for CLH analysis were determined using the ICH-Q2-R1 guidelines [46]. Table 1 shows the results of the linear regression analysis of CLH calibration curves using both approaches. The CLH calibration curve was linear in the 100–600 ng/band range for the regular HPTLC technique and in the 25–1200 ng/band range for the greener HPTLC technique. The determination coefficient (R2) and regression coefficient (R) of CLH were found to be 0.9935 and 0.9967 for the regular HPTLC method and 0.9971 and 0.9985 for the greener HPTLC method, respectively. The results revealed a substantial link between CLH concentration and the measured response. All of these findings demonstrated that both approaches were suitable for CLH analysis. However, the greener HPTLC method was linear over a greater range than the regular HPTLC method.
Table 2 lists the system suitability criteria for both regular and greener HPTLC technologies. For CLH analysis, the Rf, As, and the number of theoretical plates per meter (N/m) for the regular HPTLC approach were recorded as 0.44, 1.07, and 4464, respectively, which were satisfactory. For CLH analysis, the Rf, As, and N/m for the greener HPTLC approach were recorded as 0.55, 1.03, and 4754, respectively, which were also satisfactory. The values of Rf, As, and N/m for the regular and greener analytical methods were not statistically different (p > 0.05).
The % recovery was used to measure the accuracy of both approaches for CLH analysis. Table 3 summarizes the accuracy analysis results for both techniques. The % recovery values of CLH at three different quality-control (QC) levels were determined to be 95.41–103.09% using the regular HPTLC technique and 98.94–100.91% for the greener HPTLC methodology. Both approaches were found to be accurate for CLH analysis based on these findings. However, the % recovery of CLH using the greener analytical method was significant in terms of accuracy data compared to the regular analytical method (p < 0.05). Hence, for CLH analysis, the greener HPTLC method was found to be more accurate than the regular HPTLC method.
The intra/interassay precision of both approaches was investigated, and data for CLH analysis were represented as a percentage of the relative standard deviation (% RSD). Table 4 shows the results of intra/interday precisions for both techniques of CLH analysis. Tor the regular HPTLC methodology, the % RSD values of CLH for intraday and interday precision were determined to be 2.97–3.17 and 3.14–3.49%, respectively. For the greener HPTLC methodology, the % RSD values of CLH for intraday and interday precision were determined to be 0.62–0.76 and 0.60–0.84%, respectively. These data suggest that both approaches of CLH analysis were accurate, but the intraday and interday precisions of CLH using the greener analytical method were significant compared to the regular analytical method (p < 0.05). Hence, the greener HPTLC approach was found to be more reproducible than the regular HPTLC strategy for CLH analysis.
By introducing planned deliberate changes in the components of mobile phases, the robustness of both methods of CLH analysis was evaluated. Table 5 documents the results of robustness assessment for both methods. For the regular HPTLC method, CLH % RSD values were found to be 3.41–3.98%, while the CLH Rf values were determined to be 0.42–0.46. For the greener HPTLC approach, the % RSD values for CLH were determined to be 0.64–0.67%, while the Rf values were determined to be 0.54–0.56. These data revealed that both approaches for CLH analysis were robust. The % RSD of CLH using the greener analytical method was significant compared to the regular analytical method (p < 0.05). Hence, when it came to CLH analysis, the greener HPTLC method outperformed the regular HPTLC method.
The LOD and LOQ were used to assess the sensitivity of both CLH analysis methods. Table 1 shows the calculated values of LOD and LOQ for CLH using both approaches. For the regular HPTLC method, the LOD and LOQ of CLH were determined to be 34.31 ± 0.62 and 102.93 ± 1.86 ng/band, respectively. For the greener HPTLC method, the LOD and LOQ of CLH were determined to be 8.41 ± 0.10 and 25.23 ± 0.30 ng/band, respectively. These data revealed that both approaches were sensitive, but the LOD and LOQ values of CLH using the greener analytical method were significant compared to the regular analytical method (p < 0.05). Hence, for CLH analysis, the greener HPTLC method proved to be more sensitive than the regular HPTLC method.

2.3. Application of Regular and Greener HPTLC Methods in CLH Analysis in Commercial Unani Formulations, Commercial Allopathic Formulations, TE, and UBE of C. autumnale

The specificity of the proposed CLH analysis method was assessed by comparing the Rf values and superimposed UV absorption spectra of CLH in TE of commercial Unani formulations, UBE of commercial Unani formulations, TE of commercial allopathic formulations, TE of C. autumnale seed extract, and UBE of C. autumnale seed extract obtained from India and Egypt with those of standard CLH. The superimposed UV absorption spectra of standard CLH as well as CLH in TE of commercial Unani formulations, UBE of commercial Unani formulations, TE of commercial allopathic formulations, TE of C. autumnale seed extract, and UBE of C. autumnale seed extract obtained from India and Egypt are included in Figure 2.
At 354 nm, the greatest response of CLH in standard CLH and TE of commercial Unani formulations, UBE of commercial Unani formulations, TE of commercial allopathic formulations, TE of C. autumnale seed extract, and UBE of C. autumnale seed extract obtained from India and Egypt was determined. The specificity of the proposed HPTLC method of CLH analysis was confirmed by the identical UV absorption spectra, Rf values, and wavelengths of CLH in standard and TE of commercial Unani formulations, UBE of commercial Unani formulations, TE of commercial allopathic formulations, TE of C. autumnale seed extract, and UBE of C. autumnale seed extract obtained from India and Egypt.
For the determination of CLH in TE of commercial Unani formulations, UBE of commercial Unani formulations, TE of commercial allopathic formulations, TE of C. autumnale seed extract, and UBE of C. autumnale seed extract obtained from India and Egypt, both methods were applied as an alternative to traditional pharmaceutical assays. The chromatogram of CLH from Egyptian seed extract, Indian seed extract, marketed Unani tablets, and marketed allopathic tablets was verified by comparing the TLC band at Rf = 0.44 ± 0.01 for CLH with standard CLH using the regular HPTLC method. Figure S1 indicates the recorded chromatograms of CLH in Egyptian seed extract (Figure S1A), Indian seed extract (Figure S1B), commercial Unani formulations (Figure S1C), and commercial allopathic formulations (Figure S1D), which presented identical peak of CLH to that of standard CLH in all sample matrices studied. Some additional peaks, such as peaks 9, 8, and 7, were also found in Egyptian seed extract, Indian seed extract, and commercial Unani formulations, respectively, utilizing the regular HPTLC method. However, no extra peaks were detected in marketed allopathic tablets using the regular HPTLC methodology.
The chromatogram of CLH from Egyptian seed extract, Indian seed extract, marketed Unani tablets, and marketed allopathic tablets was verified by comparing the TLC band at Rf = 0.55 ± 0.02 for CLH with standard CLH using the greener HPTLC method. Figure S2 indicates the recorded chromatograms of CLH in Egyptian seed extract (Figure S2A), Indian seed extract (Figure S2B), commercial Unani formulations (Figure S1C), and commercial allopathic formulations (Figure S2D), which also presented identical peak of CLH to that of standard CLH in all sample matrices studied. Some additional peaks, such as peaks 4, 6, and 6, were also found in Egyptian seed extract, Indian seed extract, and commercial Unani formulations, respectively, utilizing the greener HPTLC approach. Using the greener HPTLC methodology, however, no extra peaks were detected in marketed allopathic tablets. The presence of additional peaks could be associated with other phytocompounds of extracts instead of CLH destruction. The presence of additional peaks indicated that both methods were suitable for CLH analysis in the presence of excipients/impurities.
Three-dimensional TLC densitograms of standard CLH, marketed Unani formulations, and marketed allopathic tablets using the greener HPTLC method are presented in Figure 3, and they also showed similar peaks of CLH in all sample matrices. These three-dimensional densitograms indicated the selectivity and linearity of the method.
The amount of CLH was calculated using the calibration curve for the regular and greener HPTLC methods, and the results are included in Table S1. Utilizing the regular HPTLC method, the amounts of CLH in TE of Egyptian seed extract, Indian seed extract, commercial Unani formulations, and commercial allopathic formulations were determined to be 1.74 ± 0.09, 2.39 ± 0.11, 0.48 ± 0.01, and 12.45 ± 0.84% w/w, respectively. Utilizing the regular HPTLC methodology, the amounts of CLH in UBE of Egyptian seed extract, Indian seed extract, commercial Unani formulations, and commercial allopathic formulations were determined to be 1.89 ± 0.10, 2.55 ± 0.13, 0.55 ± 0.02, and 12.61 ± 0.91% w/w, respectively.
Utilizing the greener HPTLC methodology, the amounts of CLH in TE of Egyptian seed extract, Indian seed extract, commercial Unani formulations, and commercial allopathic formulations were determined to be 2.34 ± 0.12, 2.90 ± 0.14, 1.37 ± 0.04, and 13.27 ± 0.92% w/w, respectively. Utilizing the greener HPTLC methodology, the amounts of CLH in UBE of Egyptian seed extract, Indian seed extract, commercial Unani formulations, and commercial allopathic formulations were determined to be 2.61 ± 0.13, 3.19 ± 0.16, 1.58 ± 0.05, and 15.11 ± 0.97% w/w, respectively. The amount of CLH was found to be higher in all sample matrices using the greener HPTLC approach compared to the regular HPTLC approach. This observation was possible due to the use of different solvent systems in the greener and regular analytical methods. Using both approaches, the amount of CLH in the UBE of all sample matrices was higher than in the TE. As a result, the UBE procedure for CLH was deemed superior to the TE procedure. The amount of CLH in UBE of all sample matrices was not significant compared to their TE using the regular HPTLC approach. Utilizing the greener HPTLC methodology, however, the quantity of CLH in UBE of all sample matrices was considerably more than their TE. The differences in the CLH content in different extracts might be due to changes in the growth area and other environmental conditions. Overall, the greener HPTLC method was deemed superior to the regular HPTLC method for CLH pharmaceutical assay.

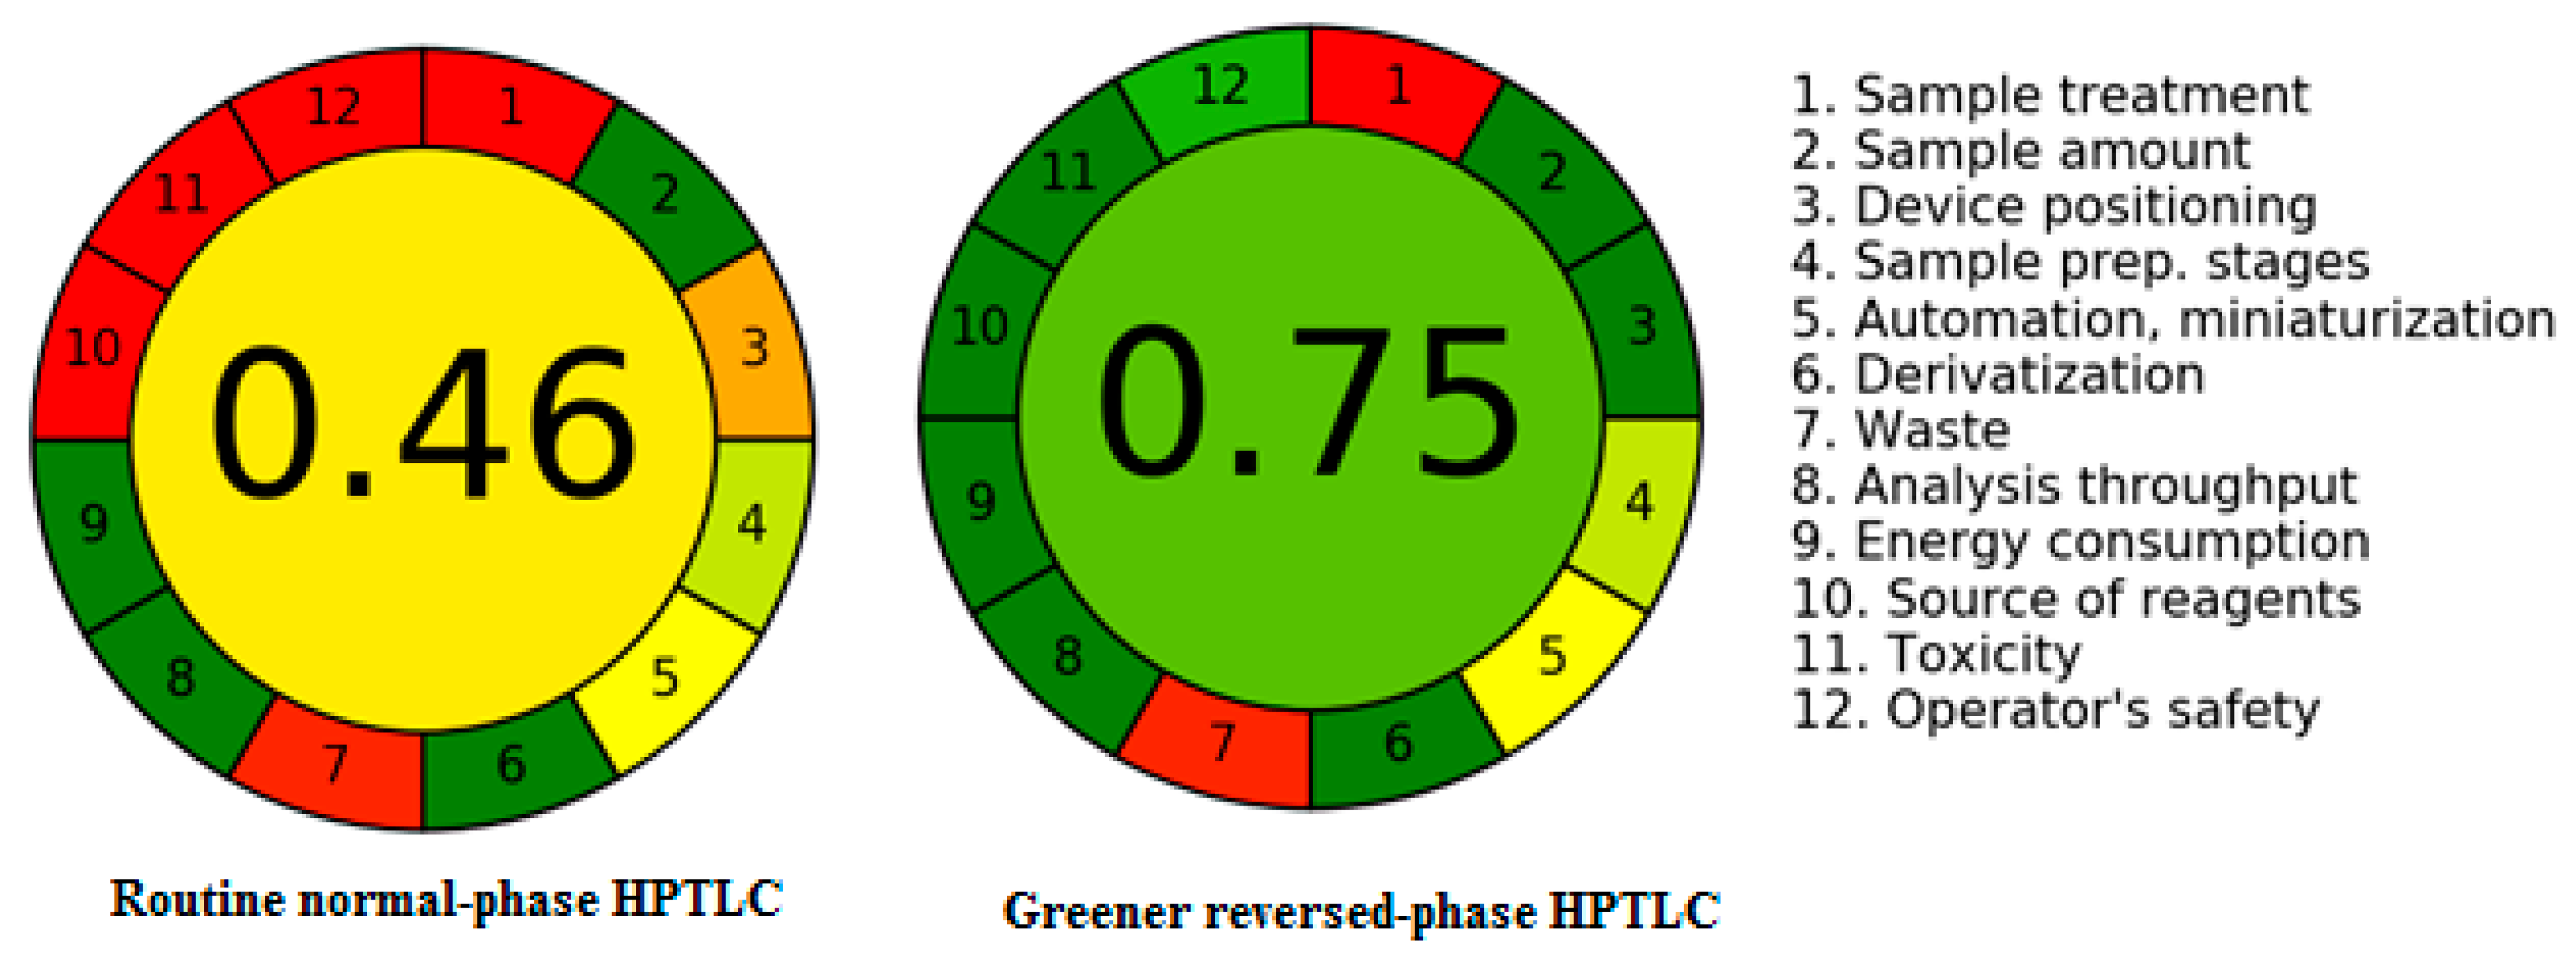
2.4. Greenness Assessment

Various methods are available for the greenness estimation of pharmaceutical assays [41,42,43,44,45]. However, only AGREE utilizes all 12 GAC principles for greenness determination [43]. As a consequence, the greenness of both methods was determined using AGREE: The Analytical Greenness Calculator (version 0.5, Gdansk University of Technology, Gdansk, Poland, 2020). Figure 4 shows a representative pictogram for the AGREE score of regular and greener HPTLC techniques. For regular and greener HPTLC procedures, the AGREE score was calculated to be 0.46 and 0.75, respectively. These data revealed that the greener HPTLC methodology had a better greenness profile than the regular HPTLC approach for CLH analysis.

3. Materials and Methods

3.1. Materials

Pure CLH was obtained from Sigma Aldrich (St. Louis, MO, USA). The chromatography-grade solvents, such as EtOH, MeOH, and CHCl3, were obtained from Fluka Chemica (Darmstadt, Germany). Chromatography-grade H2O was procured using the Milli-Q unit. The marketed Unani tablets (containing 600 µg CLH/tablet along with other excipients such as elwa, tukhm soya, turbud safaid, habb-ul-neel, suranjan shirin, gugal, and mastagi) and allopathic tablet formulations (containing 500 µg CLH/tablet along with other excipients such as lactose, pregelatinized maize starch, stearic acid, purified talc, ethanol, and purified water) of CLH were obtained from a pharmacy shop in New Delhi, India. According to the manufacturer’s guidelines, both Unani and allopathic tablets were prepared using a wet granulation technique. The composition for marketed Unani and allopathic tablets was taken from their labels. All other reagents and chemicals used were of analytical grade.

3.2. Plant Materials

The dried seeds of C. autumnale were collected from Alexandria (Egypt) and New Delhi (India). The plant materials from Alexandria (Egypt) were obtained with the geographical coordinates of 31°12′0.3312″ N and 29°55′7.4604″ E with an altitude of 5 m. The month of collection was January 2022. The plant materials from New Delhi (India) were obtained from the geographical coordinates of 28°38′41.2800″ N and 77°13′0.1956″ E with an altitude of 300 m. The month of collection was November 2021.
The identification key provided by the Saudi Arabian flora was used to verify the seeds of C. autumnale. The voucher specimen for C. autumnale (voucher number: ALX82384) was deposited in Herbarium of Department of Pharmacognosy, College of Pharmacy, Prince Sattam Bin Abdulaziz University, Al-Kharj, Saudi Arabia.

3.3. Instrumentation and Analytical Conditions

The HPTLC CAMAG TLC system (CAMAG, Muttenz, Switzerland) was applied for the determination of CLH in marketed Unani formulations, commercial allopathic formulations, TE, and UBE of C. autumnale obtained from India and Egypt. The prepared samples were applied as 6 mm bands using a CAMAG Automatic TLC Sampler 4 (ATS4) Sample Applicator (CAMAG, Geneva, Switzerland). The CAMAG microliter syringe (Hamilton, Bonaduz, Switzerland) was connected to the sample applicator. The application rate for the determination of CLH was kept constant at 150 nL/s. Under linear ascending mode, the TLC plates were established in a CAMAG automated developing chamber 2 (ADC2) (CAMAG, Muttenz, Switzerland) with a distance of 80 mm. The development chamber was saturated with vapors of respective mobile phases for 30 min at 22 °C. A wavelength of 354 nm was used to detect CLH. The slit size (band length × width) and scanning rate were set to 4 × 0.45 mm2 and 20 mm/s, respectively. Three or six replicates were applied for each analysis. The software utilized was WinCAT’s (version 1.4.3.6336, CAMAG, Muttenz, Switzerland).
The identical instrumentation and analytical settings were employed in both the regular normal-phase and the greener reversed-phase HPTLC techniques. The TLC plates and the mobile phase compositions showed the most significant differences between the normal-phase and reversed-phase procedures. The TLC plates were glass plates (plate size: 10 × 20 cm) precoated with normal-phase silica gel (particle size: 5 µm) 60F254S plates (E-Merck, Darmstadt, Germany) in the regular HPTLC method and RP-60F254S plates (E-Merck, Darmstadt, Germany) in the greener HPTLC method. The normal mobile phase in the regular HPTLC method was CHCl3/MeOH (90:10, v/v), whereas the greener mobile phase in the greener HPTLC method was EtOH/H2O (70:30, v/v).

3.4. Calibration Curves and QC Sample for CLH

CLH stock solution was made by dispensing the required amount of CLH into the given volume of mobile phase, yielding a final stock solution of 100 µg/mL CLH. CLH concentrations in the 100–600 ng/band range were obtained using the regular HPTLC method, whereas concentrations in the 25–1200 ng/band range were obtained using the greener HPTLC method, which involved diluting varying amounts of CLH stock solution with the corresponding mobile phase. An amount of 200 µL of each concentration of CLH was applied to normal-phase TLC plates for the regular HPTLC and to reversed-phase TLC plates for the greener HPTLC. The spot area of each CLH concentration was calculated using both tests. CLH calibration curves were created by plotting CLH concentrations vs. measured spot area in six replicates (n = 6). Three different QC samples were prepared freshly for the examination of different validation parameters.

3.5. Sample Preparation for the Determination of CLH in Commercial Allopathic and Unani Tablets Using TE

The average weight of 10 commercial allopathic tablets (each having 500 µg of CLH) or Unani tablets (each having 600 µg of CLH) was calculated. Using a glass pestle and mortar, CLH containing allopathic or Unani tablets were crushed and powdered finely. MeOH was used to extract a weight of powder equivalent to 5.0 mg of CLH. MeOH is the most effective solvent for the extraction, giving the highest extraction yields and highest content of phenolics, flavonoids, alkaloids, and terpenoids [47,48,49]. Lower temperature is needed for evaporation using MeOH extracts [47]. CLH is an alkaloidal compound and hence MeOH is the most effective solvent to obtain the highest extraction yields of CLH from C. autumnale [3]. Due to these reasons, MeOH was used as the solvent for the extraction of CLH. The MeOH was evaporated at 40 °C, and the residue was dissolved in 50 mL MeOH in a volumetric flask separately [47]. This technique was carried out three times. The resulting solution was utilized as a test solution for both techniques of determining CLH in the TE of commercial allopathic and Unani tablets.

3.6. Sample Preparation for the Determination of CLH in Marketed Allopathic and Unani Tablets Using UBE

The average weight of 10 commercial allopathic tablets (each having 500 µg of CLH) or Unani tablets (each having 600 µg of CLH) was calculated. Using a glass pestle and mortar, CLH containing allopathic or Unani tablets were crushed and powdered finely. A weight of powder equivalent to 5.0 mg of CLH was ultrasonically extracted with MeOH using Bransonic series ultrasonication vibrations (Model CPX5800H-E; Trenton, NJ, USA). A rotary vacuum evaporator was used to evaporate MeOH at 40 °C, and the residue was reconstituted with 50 mL of MeOH. The reconstituted sample was ultrasonicated at 50 °C for one hour. This technique was carried out three times. Using both procedures, the resulting solution was employed as a test solution for determining CLH in UBE of commercial allopathic and Unani tablets.

3.7. TE of CLH from C. autumnale Seeds Obtained from Egypt and India

The dried seeds of C. autumnale collected from Egypt and India were coarsely powdered. The coarsely powdered seeds (5 g) obtained from Egypt and India were extracted by maceration with MeOH (3 × 100 mL) at room temperature. Each sample was filtered using a Whatman filter paper (No. 41). The obtained seed extract of C. autumnale obtained from Egypt and India was evaporated separately at 40 °C under reduced pressure utilizing a rotary vacuum evaporator. Then, the concentrated extracts of different geographical regions were reconstituted with 50 mL of MeOH [48]. This procedure was carried out in triplicates. The obtained solution was used as a test solution for the determination of CLH in TE of C. autumnale obtained from Egypt and India using both methods.

3.8. UBE of CLH from C. autumnale Seeds Obtained from Egypt and India

The dried seeds of C. autumnale obtained from Egypt and India were ultrasonically extracted utilizing Bransonic series ultrasonication vibrations (Model CPX5800H-E; Trenton, NJ, USA). Then, 5 g of powdered dried seeds of C. autumnale was carefully weighed and extracted with 100 mL of MeOH. A rotary vacuum evaporator was used to evaporate MOH at 40 °C, and the residue was reconstituted with 50 mL of MeOH. The reconstituted sample was ultrasonicated at 50 °C for one hour [48]. This procedure was carried out in triplicates. The obtained solution was used as a test solution for the determination of CLH in UBE of C. autumnale obtained from Egypt and India using both methods.

3.9. Validation Studies

Regular and greener HPTLC techniques for CLH analysis were validated for several parameters using the ICH-Q2-R1 recommendations [46]. CLH linearity was determined by plotting CLH concentrations against the measured peak area. The linearity was tested in the 100–600 ng/band range (n = 6) for the regular HPTLC technique and in the 25–1200 ng/band range (n = 6) for the greener HPTLC approach.
The evaluation of Rf, As, and N/m was used to determine the parameters for system suitability for regular and greener HPTLC approaches for the determination of CLH. For both methods, the Rf, As, and N/m data were calculated using their reported formulae [45].
The accuracy of regular and greener HPTLC procedures for determining CLH was assessed using the percent recovery method. The accuracy for both methods was determined using CLH standard solution instead of plant extracts by the spiking method. CLH was tested at three QC levels of standard CLH solution, namely low QC (LQC; 100 ng/band), middle QC (MQC; 400 ng/band), and high QC (HQC; 600 ng/band), to determine the accuracy of the regular HPTLC approach. CLH was also tested at three different QC levels of standard CLH solution, namely LQC (50 ng/band), MQC (400 ng/band), and HQC (1200 ng/band), to determine the accuracy of the greener HPTLC approach. The percent recovery of CLH was calculated using both methods at each QC level (n = 6).
For CLH, the intra/interassay precision of regular and greener HPTLC techniques was investigated. The intraassay precision for CLH was evaluated using estimation of freshly generated CLH solutions at LQC, MQC, and HQC on the same day for both procedures (n = 6). The interassay variance was investigated using estimation of freshly generated CLH solutions at LQC, MQC, and HQC on three different days for both methods (n = 6).
The robustness of CLH was tested for both techniques by making some planned adjustments to the mobile phase components. The regular mobile phase CHCl3/MeOH (90:10, v/v) for CLH was modified to EtOH/H2O (92:8, v/v) and EtOH/H2O (88:12, v/v) for the regular HPTLC approach, and the variations in measured response and Rf values were examined (n = 6). The greener mobile phase EtOH/H2O (70:30, v/v) for CLH was modified to EtOH/H2O (72:28, v/v) and EtOH/H2O (68:32, v/v) for the greener HPTLC approach, and the variations in measured response and Rf values were examined (n = 6).
Using a standard deviation approach, the sensitivity of regular and greener HPTLC techniques for CLH was determined as limit of detection (LOD) and limit of quantification (LOQ). The LOD and LOQ were calculated using their published formulae for both methods (n = 6) [46].
The Rf values and UV absorption spectra of CLH in marketed Unani formulations, commercial allopathic formulations, TE, and UBE of C. autumnale obtained from India and Egypt were compared to those of standard CLH to investigate the specificity of regular and greener HPTLC approaches for CLH.

3.10. Application of Regular and Greener HPTLC Methods in the Determination of CLH in Commercial Unani Formulations, Commercial Allopathic Formulations, TE, and UBE of C. autumnale

The processed samples of marketed Unani formulations, commercial allopathic formulations, TE, and UBE of C. autumnale obtained from India and Egypt were spotted on normal-phase TLC plates for the regular HPTLC method and on reversed-phase TLC plates for the greener HPTLC approach. For both methods, the chromatographic responses were examined utilizing the same experimental conditions used for the determination of CLH (n = 3). For both methods, the quantity of CLH in commercial Unani formulations, commercial allopathic formulations, TE, and UBE of C. autumnale obtained from India and Egypt were estimated using the calibration curve of CLH.

3.11. Greenness Estimation

The AGREE approach [43] was used to examine the greenness profile for regular and greener HPTLC procedures for CLH analysis. The AGREE scores (0.0–1.0) for regular and greener reversed-phase HPTLC methods was obtained using AGREE: The Analytical Greenness Calculator (version 0.5, Gdansk University of Technology, Gdansk, Poland, 2020) for both methods.

3.12. Statistical Evaluation

The validation parameters of regular and greener HPTLC approaches were analyzed and compared using Student’s t-test utilizing the MS Excel 2010 program. The p-value of less than 0.05 was considered as significant.

4. Conclusions

For CLH analysis, there is a paucity of greener analytical approaches in the literature. Consequently, this research attempted to develop and validate a rapid, sensitive, and greener HPTLC method for CLH analysis in diverse commercial formulations and plant extracts and then compare it to the regular HPTLC methodology. The greener HPTLC methodology was found to be more linear, accurate, precise, robust, and sensitive for CLH analysis than the regular HPTLC method. When comparing the greener HPTLC technique to the regular HPTLC approach, the amount of CLH in all sample matrices was found to be significantly higher in terms of % w/w. The AGREE results showed that the greener HPTLC approach had a better greenness profile than the regular HPTLC method. Overall, based on numerous validation criteria and pharmaceutical assay findings, the greener HPTLC methodology is superior to the regular HPTLC method for CLH analysis in commercial formulations and plant extracts. These results suggest that the greener analytical methodology can be used for the analysis of CLH in a wide range of sample matrices.

Supplementary Materials

The following supporting information can be downloaded at: https://www.mdpi.com/article/10.3390/plants11131767/s1. Figure S1: Representative chromatograms of CLH in (A) Egyptian seed extract, (B) Indian seed extract, (C) Unani formulation, and (D) allopathic formulation obtained using regular normal-phase HPTLC approach; Figure S2: Representative chromatograms of CLH in (A) Egyptian seed extract, (B) Indian seed extract, (C) Unani formulation, and (D) allopathic formulation obtained using greener reversed-phase HPTLC approach; Table S1: Application of the regular normal-phase HPTLC and the greener reversed-phase HPTLC approaches in the determination of CLH in methanolic extracts of Egyptian and Indian C. autumnale seeds, allopathic formulation, and Unani formulation produced by traditional and ultrasonication procedures (mean ± SD; n = 3).

Author Contributions

Conceptualization, M.H.A. and P.A.; methodology, P.A., T.M.A., and M.S.A.-K.; software, F.S.; validation, S.A. and M.H.A.; formal analysis, H.H.Z. and M.S.A.-K.; investigation, P.A. and T.M.A.; resources, S.A.; data curation, H.H.Z. and F.S.; writing—original draft preparation, F.S.; writing—review and editing, M.H.A., T.M.A., and S.A.; visualization, S.A.; supervision, P.A.; project administration, P.A.; funding acquisition, S.A. All authors have read and agreed to the published version of the manuscript.

Funding

This research was funded by the Researchers Supporting Project (number RSP-2021/146) at King Saud University, Riyadh, Saudi Arabia. The APC was funded by RSP.

Institutional Review Board Statement

Not applicable.

Informed Consent Statement

Not applicable.

Data Availability Statement

Not applicable.

Acknowledgments

The authors are thankful to the Researchers Supporting Project (number RSP-2021/146) at King Saud University, Riyadh, Saudi Arabia for supporting this research.

Conflicts of Interest

The authors declare no conflict of interest.

References

  1. Al Nebaihi, H.M.; Le, T.S.; Davies, N.M.; Brocks, D.R. Liquid Chromatography Tandem Mass Spectrometric Analytical Method for Study of Colchicine in Rats Given Low Doses. Processes 2021, 9, 2007. [Google Scholar] [CrossRef]
  2. Roberts, W.N.; Liang, M.H.; Stern, S.H. Colchicine in acute gout. Reassessment of risks and benefits. JAMA 1987, 257, 1920–1922. [Google Scholar] [CrossRef] [PubMed]
  3. Molad, Y. Update on colchicine and its mechanism of action. Curr. Rheumatol. Rep. 2002, 4, 252–256. [Google Scholar] [CrossRef] [PubMed]
  4. Kuo, M.-C.; Chang, S.-J.; Hsieh, M.-C. Colchicine Significantly Reduces Incident Cancer in Gout Male Patients. Medicine 2015, 94, e1570. [Google Scholar] [CrossRef]
  5. Cerquaglia, C.; Diaco, M.; Nucera, G.; La Regina, M.; Montalto, M.; Manna, R. Pharmacological and clinical basis of treatment of Familial Mediterranean Fever (FMF) with colchicine or analogues: An update. Curr. Drug Targets 2005, 4, 117–124. [Google Scholar] [CrossRef]
  6. Karatza, E.; Ismailos, G.; Karalis, V. Colchicine for the treatment of COVID-19 patients: Efficacy, safety, and model informed dosage regimens. Xenobiotica 2021, 51, 643–656. [Google Scholar] [CrossRef]
  7. Madrid-García, A.; Pérez, I.; Colomer, J.I.; León-Mateos, L.; Jover, A.J.; Fernández-Gutiérrez, B.; Abásolo-Alcazar, L.; Rodríguez-Rodríguez, L. Influence of colchicine prescription in COVID-19-related hospital admissions: A survival analysis. Ther. Adv. Musculoskelet. Dis. 2021, 13, 1–12. [Google Scholar] [CrossRef]
  8. Omar, S.K.; Abdolla, N.S.Y.; Boujwod, F.F.; Rajab, Y.M.M. Spectrophotometric method for the determination of colchicine in pure and pharmaceutical forms (a kinetic study). J. Pure Appl. Sci. 2019, 18, 313–319. [Google Scholar]
  9. Thompson, R.D. Liquid Chromatographic Determination of Colchicine in Pharmaceuticals: Collaborative Study. J. AOAC Int. 1985, 68, 1051–1055. [Google Scholar] [CrossRef]
  10. Alali, F.; Tawaha, K.; Qasaymeh, R.M. Determination of colchicine in Colchicum steveni and C. heirosolymitanum (colchicaceae): Comparison between two analytical methods. Phytochem. Anal. 2004, 15, 27–29. [Google Scholar] [CrossRef]
  11. Samanidou, V.F.; Sarantis, G.A.; Papadoyannis, I.N. Development and Validation of a Rapid HPLC Method for the Direct Determination of Colchicine in Pharmaceuticals and Biological Fluids. J. Liq. Chromatogr. Relat. Technol. 2006, 29, 1–13. [Google Scholar] [CrossRef]
  12. Gowda, B.G. High-performance liquid chromatographic determination of colchicine in pharmaceutical formulations and biological fluids. Int. J. Pharm. Pharm. Sci. 2014, 6, 335–337. [Google Scholar]
  13. Maslarska, V.; Pencheva, I. Determination of colchicine content in drug by RP-HPLC. Int. J. Adv. Pharm. Biol. Chem. 2014, 3, 116–119. [Google Scholar]
  14. Rica, C.I.; Naessens, T.; Pieters, L.; Apers, S. An HPLC Method for the Quantification of Colchicine and Colchicine Derivatives in Gloriosa superba seeds. Nat. Prod. Commun. 2017, 12, 1215–1221. [Google Scholar] [CrossRef] [Green Version]
  15. Joshi, S.A.; Jalalpure, S.S.; Kempwade, A.A.; Peram, M.R. Development and validation of HPLC method to determine colchicine in pharmaceutical formulations and its application for analysis of solid lipid nanoparticles. Curr. Pharm. Anal. 2018, 14, 76–83. [Google Scholar] [CrossRef]
  16. Chanchula, N.; Fongsuk, C.; Na-Nakorn, P.; Pansuksan, K. Colchicine determination in Gloriosa spp. by HPLC. Sci. Technol. Asia 2021, 26, 120–127. [Google Scholar]
  17. Klein, A.E.; Davis, P.J. Determination of colchicine and colchiceine in microbial cultures by high-performance liquid chromatography. Anal. Chem. 1980, 52, 2432–2435. [Google Scholar] [CrossRef]
  18. Gumustas, M.; Polat, D.; Kılıç, C.S.; Akalın, K.; Ozkan, S.A.; Coşkun, M. Comparison of Seeds of Colchicum Speciosum and Gloriosa Superba in Respect to Colchicine and Colchicoside Contents by RP-LC. Nat. Prod. Commun. 2016, 11, 397–400. [Google Scholar] [CrossRef] [Green Version]
  19. Khodadoust, S.; Sadeghi, H.; Pebdani, A.A.; Mohammadi, J.; Salehi, A. Optimization of ultrasound-assisted extraction of colchicine compound from Colchicum haussknechtii by using response surface methodology. J. Saudi Soc. Agric. Sci. 2017, 16, 163–170. [Google Scholar] [CrossRef] [Green Version]
  20. Fernandez, P.; Bermejo, A.; Tabernero, M.; López-Rivadulla, M.; Cruz, A. Determination of colchicine in biological fluids by reverse-phase HPLC. Variation of colchicine levels in rats. Forensic Sci. Int. 1993, 59, 15–18. [Google Scholar] [CrossRef]
  21. Chen, Q.H.; Hou, S.; Gan, L.C.; Li, Y.B. Determination of colchicine in mouse plasma by high performance liquid-chromatographic method with UV detection and its application to pharmacokinetic studies. J. Pharm. Soc. Jpn. 2007, 127, 1485–1490. [Google Scholar] [CrossRef] [PubMed] [Green Version]
  22. Hamscher, G.; Priess, B.; Nau, A.H.; Panariti, E. Determination of Colchicine Residues in Sheep Serum and Milk Using High-Performance Liquid Chromatography Combined with Electrospray Ionization Ion Trap Tandem Mass Spectrometry. Anal. Chem. 2005, 77, 2421–2425. [Google Scholar] [CrossRef]
  23. Abe, E.; Lemaire-Hurtel, A.-S.; Duverneuil, C.; Etting, I.; Guillot, E.; de Mazancourt, P.; Alvarez, J.-C. A Novel LC-ESI-MS-MS Method for Sensitive Quantification of Colchicine in Human Plasma: Application to Two Case Reports. J. Anal. Toxicol. 2006, 30, 210–215. [Google Scholar] [CrossRef] [PubMed] [Green Version]
  24. Bourgogne, E.; Soichot, M.; Latour, C.; Laprévote, O. Rugged and accurate quantitation of colchicine in human plasma to support colchicine poisoning monitoring by using turbulent-flow LC–MS/MS analysis. Bioanalysis 2013, 5, 2889–2896. [Google Scholar] [CrossRef] [PubMed]
  25. Petruczynik, A.; Waksmundzka-Hajnos, M.; Hajnos, M.L. The effect of chromatographic conditions on the separation of selected alkaloids in RP-HPTLC. J. Chromatogr. Sci. 2005, 43, 183–194. [Google Scholar] [CrossRef] [Green Version]
  26. Toniolo, C.; Nicoletti, M.; Maggi, F.; Venditti, A. HPTLC determination of chemical composition variability in raw materials used in botanicals. Nat. Prod. Res. 2014, 28, 119–126. [Google Scholar] [CrossRef]
  27. Misra, A.; Srivastava, S.; Shukla, P.K.; Kumar, M.; Khalid, M.; Kushwaha, P.; Agrawal, P.K. Variability in alkaloid and phenolic content vis-a-vis antigout potential among the natural population of Gloriosa superba (L.) collected from central India. Nat. Prod. Res. 2021, 35, 2444–2448. [Google Scholar] [CrossRef]
  28. Mirakor, V.; Vaidya, V.; Menon, S.; Champanerker, P.; Laud, A. HPTLC method for determination of colchicine in a pharmaceutical formulation. J. Planar Chromatogr. 2008, 21, 187–189. [Google Scholar] [CrossRef]
  29. Gowda, B.G. High performance thin layer chromatographic determination of colchicine in pharmaceutical preparations and biological fluids. Int. J. Pharm. Pharm. Sci. 2013, 4, 2737–2741. [Google Scholar]
  30. Hadad, G.M.; Badr, J.M.; El-Nahriry, K.; Hassanean, H.A. Validated HPLC and HPTLC Methods for Simultaneous Determination of Colchicine and Khellin in Pharmaceutical Formulations. J. Chromatogr. Sci. 2012, 51, 258–265. [Google Scholar] [CrossRef]
  31. Rahmawati, S.I.; Susilowati, A.; Yunus, A.; Widyastuti, Y. Determination colchicine content in aquadest-extracted Gloriosa sperba seed from Sukoharjo and Gunung Kidul. IOP Conf. Ser. Earth Env. Sci. 2018, 142, E012053. [Google Scholar] [CrossRef]
  32. Rathod, D.; Panigrahi, J.; Patel, I. Colchicine (a high-priced alkaloid) accumulation and HPTLC quantification in different stages of in vitro developed tuber of Gloriosa sperba L. Fut. J. Pharm. Sci. 2021, 7, E177. [Google Scholar] [CrossRef]
  33. Ahmad, S.; Fahim, M.; Singh, M.; Kamal, Y.; Mukhtar, H.M. A high performance thin layer chromatographic method for the estimation of colchicine in different formulations. J. Pharm. Bioallied Sci. 2015, 7, 260–263. [Google Scholar] [CrossRef] [PubMed]
  34. Ali, A.; Qadir, A.; Khan, M.A.; Al-Otaibi, F.O.; Khan, S.; Abdin, M.Z. A Simple Validated HPTLC Method for Simultaneous Analysis of Colchicine and Gallic Acid in Polyherbal Formulation: Habb-E-Irqun-Nisha. Food Anal. Methods 2017, 10, 2934–2942. [Google Scholar] [CrossRef]
  35. Pandey, D.K.; Kaur, P.; Kumar, V.; Banik, R.M.; Malik, T.; Dey, A. Screening the elite chemotypes of Gloriosa superba L. in India for the production of anticancer colchicine: Simultaneous microwave-assisted extraction and HPTLC studies. BMC Plant Biol. 2021, 21, E77. [Google Scholar] [CrossRef] [PubMed]
  36. Bodoki, E.; Săndulescu, R.; Roman, L. Method validation in quantitative electrochemical analysis of colchicine using glassy carbon electrode. Open Chem. 2007, 5, 766–778. [Google Scholar] [CrossRef]
  37. Zhang, K.; Zhou, J.; Liu, J.; Li, K.; Li, Y.; Yang, L.; Ye, B. Sensitive determination of colchicine at carbon paste electrode doped with multiwall carbon nanotubes. Anal. Methods 2013, 5, 1830–1836. [Google Scholar] [CrossRef]
  38. Zvereva, E.A.; Zherdev, A.; Formanovsky, A.A.; Abuknesha, R.A.; Eremin, S.A.; Dzantiev, B.B. Fluorescence polarization immunoassay of colchicine. J. Pharm. Biomed. Anal. 2018, 159, 326–330. [Google Scholar] [CrossRef] [Green Version]
  39. Moreira, D.A.R.; de Oliveira, F.M.; Pimentel, D.M.; Guedes, T.J.; Luz, R.C.S.; Damos, F.S.; Pereira, A.C.; da Silva, R.A.B.; dos Santos, T.P. Determination of colchicine in pharmaceutical formulations and urine by multiple-pulse amperometric detection in an FIA system using born-doped diamond electrode. J. Braz. Chem. Soc. 2018, 29, 1796–1802. [Google Scholar]
  40. Bodoki, E.; Iacob, B.C.; Oprean, R. Capillary Electromigration Techniques for the Quantitative Analysis of Colchicine. Croat. Chem. Acta 2011, 84, 383–391. [Google Scholar] [CrossRef]
  41. Abdelrahman, M.M.; Abdelwahab, N.S.; Hegazy, M.A.; Fares, M.Y.; El-Sayed, G.M. Determination of the abused intravenously self-administered madness drops (Tropicamide) by liquid chromatography in rat plasma; an application to pharmacokinetic study and greenness profile assessment. Microchem. J. 2020, 159, 105582. [Google Scholar] [CrossRef]
  42. Duan, X.; Liu, X.; Dong, Y.; Yang, J.; Zhang, J.; He, S.; Yang, F.; Wang, Z.; Dong, Y. A Green HPLC Method for Determination of Nine Sulfonamides in Milk and Beef, and Its Greenness Assessment with Analytical Eco-Scale and Greenness Profile. J. AOAC Int. 2020, 103, 1181–1189. [Google Scholar] [CrossRef] [PubMed]
  43. Pena-Pereira, F.; Wojnowski, W.; Tobiszewski, M. AGREE—Analytical GREEnness Metric Approach and Software. Anal. Chem. 2020, 92, 10076–10082. [Google Scholar] [CrossRef] [PubMed]
  44. Alam, P.; Salem-Bekhit, M.M.; Al-Joufi, F.A.; Alqarni, M.H.; Shakeel, F. Quantitative analysis of cabozantinib in pharmaceutical dosage forms using green RP-HPTLC and green NP-HPTLC methods: A comparative evaluation. Sustain. Chem. Pharm. 2021, 21, 100413. [Google Scholar] [CrossRef]
  45. Foudah, A.I.; Shakeel, F.; Alqarni, M.H.; Alam, P. A rapid and sensitive stability-indicating green RP-HPTLC method for the quantitation of flibanserin compared to green NP-HPTLC method: Validation studies and greenness assessment. Microchem. J. 2021, 164, 105960. [Google Scholar] [CrossRef]
  46. International Conference on Harmonization (ICH). Q2 (R1): Validation of Analytical Procedures–text and Methodology; International Conference on Harmonization (ICH): Geneva, Switzerland, 2005. [Google Scholar]
  47. Alam, P.; Shakeel, F.; Ali, A.; Alqarni, M.H.; Foudah, A.I.; Aljarba, T.M.; Alkholifi, F.K.; Alshehri, S.; Ghoneim, M.M.; Ali, A. Simultaneous determination of caffeine and paracetamol in commercial formulations using greener normal-phase and reversed-phase HPTLC methods: A contrast of validation parameters. Molecules 2022, 27, 405. [Google Scholar] [CrossRef]
  48. Foudah, A.I.; Shakeel, F.; Alqarni, M.H.; Ali, A.; Alshehri, S.; Ghoneim, M.M.; Alam, P. Determination of thymol in commercial formulations, essential oils, traditional, and ultrasound-based extracts of Thymus vulgaris and Origenum vulgare using a greener HPTLC approach. Molecules 2022, 27, 1164. [Google Scholar] [CrossRef]
  49. Truong, D.-H.; Nguyen, D.H.; Ta, N.T.A.; Bui, A.V.; Do, T.H.; Nguyen, H.C. Evaluation of the Use of Different Solvents for Phytochemical Constituents, Antioxidants, and In Vitro Anti-Inflammatory Activities of Severinia buxifolia. J. Food Qual. 2019, 2019, E8178294. [Google Scholar] [CrossRef] [Green Version]
Figure 1. Representative chromatograms of standard colchicine (CLH) obtained using regular normal-phase high-performance thin-layer chromatography (HPTLC) and greener reversed-phase HPTLC approaches.
Plants 11 01767 g001
Figure 2. UV absorption spectra of (A) standard CLH, (B) UBE of allopathic formulation, (C) TE of allopathic formulation, (D) UBE of Indian seed extract, (E) TE of Indian seed extract, (F) UBE of Egyptian seed extract, (G) TE of Egyptian seed extract, and (H) UBE of Unani formulation, and (I) TE of Unani formulation superimposed.
Plants 11 01767 g002
Figure 3. Three-dimensional TLC densitograms of standard CLH, marketed allopathic tablets, and marketed Unani tablets obtained using the greener reversed-phase HPTLC approach.
Plants 11 01767 g003
Figure 4. Representative pictograms for AGREE scores for the regular normal-phase HPTLC and the greener reversed-phase HPTLC methods obtained using AGREE: The Analytical Greenness Calculator.
Plants 11 01767 g004
Table 1. Results for the regression analysis of colchicine (CLH) for the regular normal-phase high-performance thin-layer chromatography (HPTLC) and the greener reversed-phase HPTLC approaches (mean ± SD; n = 6).
ParametersNormal-Phase HPTLCReversed-Phase HPTLC
Linearity range (ng/band)100–60025–1200
Regression equationy = 15.039x + 1497.9y = 20.837x + 800.37
R20.99350.9971
R0.99670.9985
Standard error of slope0.380.40
Standard error of intercept13.573.03
95% confidence interval of slope13.38–16.6919.11–22.55
95% confidence interval of intercept1439.49–1556.30787.29–813.44
LOD ± SD (ng/band)34.31 ± 0.628.41 ± 0.10
LOQ ± SD (ng/band)102.93 ± 1.8625.23 ± 0.30
R2: determination coefficient; R: regression coefficient; LOD: limit of detection; LOQ: limit of quantification.
Table 2. System suitability parameters of CLH for the regular normal-phase HPTLC and the greener reversed-phase HPTLC approaches (mean ± SD; n = 3).
ParametersNormal-Phase HPTLCReversed-Phase HPTLC
Rf0.44 ± 0.010.55 ± 0.02
As1.07 ± 0.021.03 ± 0.01
N/m4464 ± 3.744754 ± 3.91
Rf: retention factor, As: asymmetry factor, N/m: number of theoretical plates per meter.
Table 3. Assessment of accuracy of CLH for the regular normal-phase HPTLC and the greener reversed-phase HPTLC approaches (mean ± SD; n = 6).
Conc. (ng/band)Conc. Found (ng/band) ± SDRecovery (%)RSD (%)
Normal-Phase HPTLC
10095.41 ± 3.0295.413.16
400387.32 ± 11.2396.832.89
600618.54 ± 15.24103.092.46
Reversed-phase HPTLC
5050.12 ± 0.41100.240.81
400403.65 ± 2.85100.910.70
12001187.32 ± 7.4598.940.62
Table 4. Assessment of intra/interday precision of CLH for the regular normal-phase HPTLC and the greener reversed-phase HPTLC approaches (mean ± SD; n = 6).
Conc.
(ng/band)
Intraday PrecisionInterday Precision
Conc. Found (ng/band) ± SDStandard ErrorRSD (%)Conc. Found (ng/band) ± SDStandard ErrorRSD (%)
Normal-phase HPTLC
100103.21 ± 3.281.333.17104.24 ± 3.641.483.49
400406.85 ± 12.345.033.03407.84 ± 13.215.393.23
600584.32 ± 17.417.102.97597.23 ± 18.247.443.14
Reversed-phase HPTLC
5049.87 ± 0.380.150.7649.63 ± 0.420.170.84
400397.56 ± 2.591.050.65405.61 ± 2.611.060.64
12001212.31 ± 7.523.070.621184.32 ± 7.212.940.60
Table 5. Assessment of robustness for the regular normal-phase HPTLC and the greener reversed-phase HPTLC approaches (mean ± SD; n = 6).
Conc.
(ng/band)
Mobile Phase Composition (Chloroform-Methanol)Results
OriginalUsed Conc. (ng/band) ± SDRSD (%)Rf
Normal-phase HPTLC
92:8+2.0386.32 ± 13.213.410.42
40090:1090:100.0396.94 ± 14.323.610.44
88:12−2.0407.51 ± 16.243.980.46
Reversed-phase HPTLC
Mobile phase composition (ethanol-water)
72:28+2.0392.41 ± 2.540.640.54
40070:3070:300.0402.12 ± 2.670.660.55
68:32−2.0406.32 ± 2.760.670.56
Publisher’s Note: MDPI stays neutral with regard to jurisdictional claims in published maps and institutional affiliations.

