Article

Potential Distribution of and Sensitivity Analysis for Urochloa panicoides Weed Using Modeling: An Implication of Invasion Risk Analysis for China and Europe

by
Tayna Sousa Duque
1,*,
Ricardo Siqueira da Silva
1,
Josiane Costa Maciel
1,
Daniel Valadão Silva
2,
Bruno Caio Chaves Fernandes
2,
Aurélio Paes Barros Júnior
2 and
José Barbosa dos Santos
1
1
Departamento de Agronomia, Universidade Federal dos Vales do Jequitinhonha e Mucuri, Diamantina CEP 39100-000, MG, Brazil
2
Departamento de Agronomia e Ciências Vegetais, Universidade Federal Rural do Semi-Árido, Mossoró CEP 59625-900, RN, Brazil
*
Author to whom correspondence should be addressed.
Plants 2022, 11(13), 1761; https://doi.org/10.3390/plants11131761
Submission received: 23 May 2022 / Revised: 22 June 2022 / Accepted: 29 June 2022 / Published: 1 July 2022
(This article belongs to the Section Plant Ecology)

Abstract

:
Urochloapanicoides P. Beauv. is considered one of the most harmful weeds in the United States and Australia. It is invasive in Pakistan, Mexico, and Brazil, but its occurrence is hardly reported in China and European countries. Species distribution models enable the measurement of the impact of climate change on plant growth, allowing for risk analysis, effective management, and invasion prevention. The objective of this study was to develop current and future climate models of suitable locations for U. panicoides and to determine the most influential climatic parameters. Occurrence data and biological information on U. panicoides were collected, and climatic parameters were used to generate the Ecoclimatic Index (EI) and to perform sensitivity analysis. The future projections for 2050, 2080, and 2100 were modeled under the A2 SRES scenario using the Global Climate Model, CSIRO-Mk3.0 (CS). The potential distribution of U. panicoides coincided with the data collected, and the reliability of the final model was demonstrated. The generated model identified regions where the occurrence was favorable, despite few records of the species. Sensitivity analysis showed that the most sensitive parameters of the model were related to temperature, humidity, and cold stress. Future projections predict reductions in climate suitability for U. panicoides in Brazil, Australia, India, and Africa, and an increase in suitability in Mexico, the United States, European countries, and China. The rise in suitability of China and Europe is attributed to predicted climate change, including reduction in cold stress. From the results obtained, preventive management strategies can be formulated against the spread of U. panicoides, avoiding economic and biodiversity losses.

1. Introduction

Invasive alien species can reproduce and persist outside the regions to which they are native [1], causing loss of biodiversity [2], economic and social impacts [3], agricultural losses [4], and changes in nutrient stock, soil chemistry, and pH [5,6]. Biological invasion can be influenced by the biological characteristics of the species [7], introduction history [8], anthropogenic factors, and climate change [9].
The level of invasion impact differs across species [10]. African grasses have been introduced as pasture in several countries worldwide, spreading and suppressing native vegetation [11]. Selected traits such as high vigor, seed production, and resistance have become problematic because they also exacerbate invasion [12]. The genus Urochloa encompasses species listed among the current primary invasive grasses [11].
Urochloa panicoides P. Beauv. is a grass native to Africa that is considered a weed for several crops, such as corn, soybean, and cotton [13]. This species was accidentally introduced in other countries, possibly during cereal cultivation [14]. It is considered one of the most harmful weeds in the United States [15] and Argentina [13], and in Australia, biotypes resistant to atrazine and glyphosate have already been found [16]. Abundant seed production [14] and herbicide resistance facilitate invasion and hinder management in agricultural areas. Invasion by U. panicoides has already been reported in Pakistan [17], Mexico [18], and Brazil [19].
The occurrence of U. panicoides in China is restricted to the Yunnan province; on the European continent, there are a few occurrences in Belgium and the United Kingdom [20,21]. China is the world’s second largest producer of cotton and corn and is a leading producer of soybean oil; European countries also excel in the world agricultural sector, producing corn and soy oil [22]. Invasion, dissemination, and insertion of species such as U. panicoides into agricultural areas would cause losses in biodiversity and productivity and require new weed control strategies, causing an increase in the use of herbicides [23]. The low occurrence of U. panicoides in China and Europe is related to seed dormancy when subjected to cold stress [13]. However, climate change, especially changes in temperature, may favor the introduction and establishment of these species [23].
The invasion likelihood of a species depends on its biology, place of origin, and its introduction to the exotic environment [24]. Increases in greenhouse gas emissions, nitrogen deposition, land use changes [25], international commercial transport [26,27], tourism growth [28], socioeconomic development, and rise in gross domestic product of a country [29] are factors that influence the degree of dispersion. In addition, aspects related to physiology, growth [7,24], phenological characteristics [30], and high phenotypic plasticity [7] alter the invasive potential of species.
Among the factors that enhance biological invasion, climate change may alter the competitive potential of an exotic species [31] and growth in places where it currently does not occur [32]. Species distribution models (SDMs) are tools that establish relationships between species occurrence data and predictor variables [33], and they can be used to measure the impact of climate change on the distribution of organisms [34]. Through sensitivity analysis, SDMs determine the main climatic factors that interfere with species growth [35]. CLIMEX software generates SDMs from biological information, occurrence of the target species, and climatic data [36].
Studying the potential and future distribution of possibly aggressive invasive species such as U. panicoides allows for risk analyses, effective management, and invasion prevention [32]. The objective of this study was to use the CLIMEX software to predict suitable areas for the establishment of U. panicoides based on ecoclimatic conditions, determine potential regions subject to invasion of the species with risk analysis for China and Europe, and establish the most influential climatic parameters for the models.

2. Material and Methods

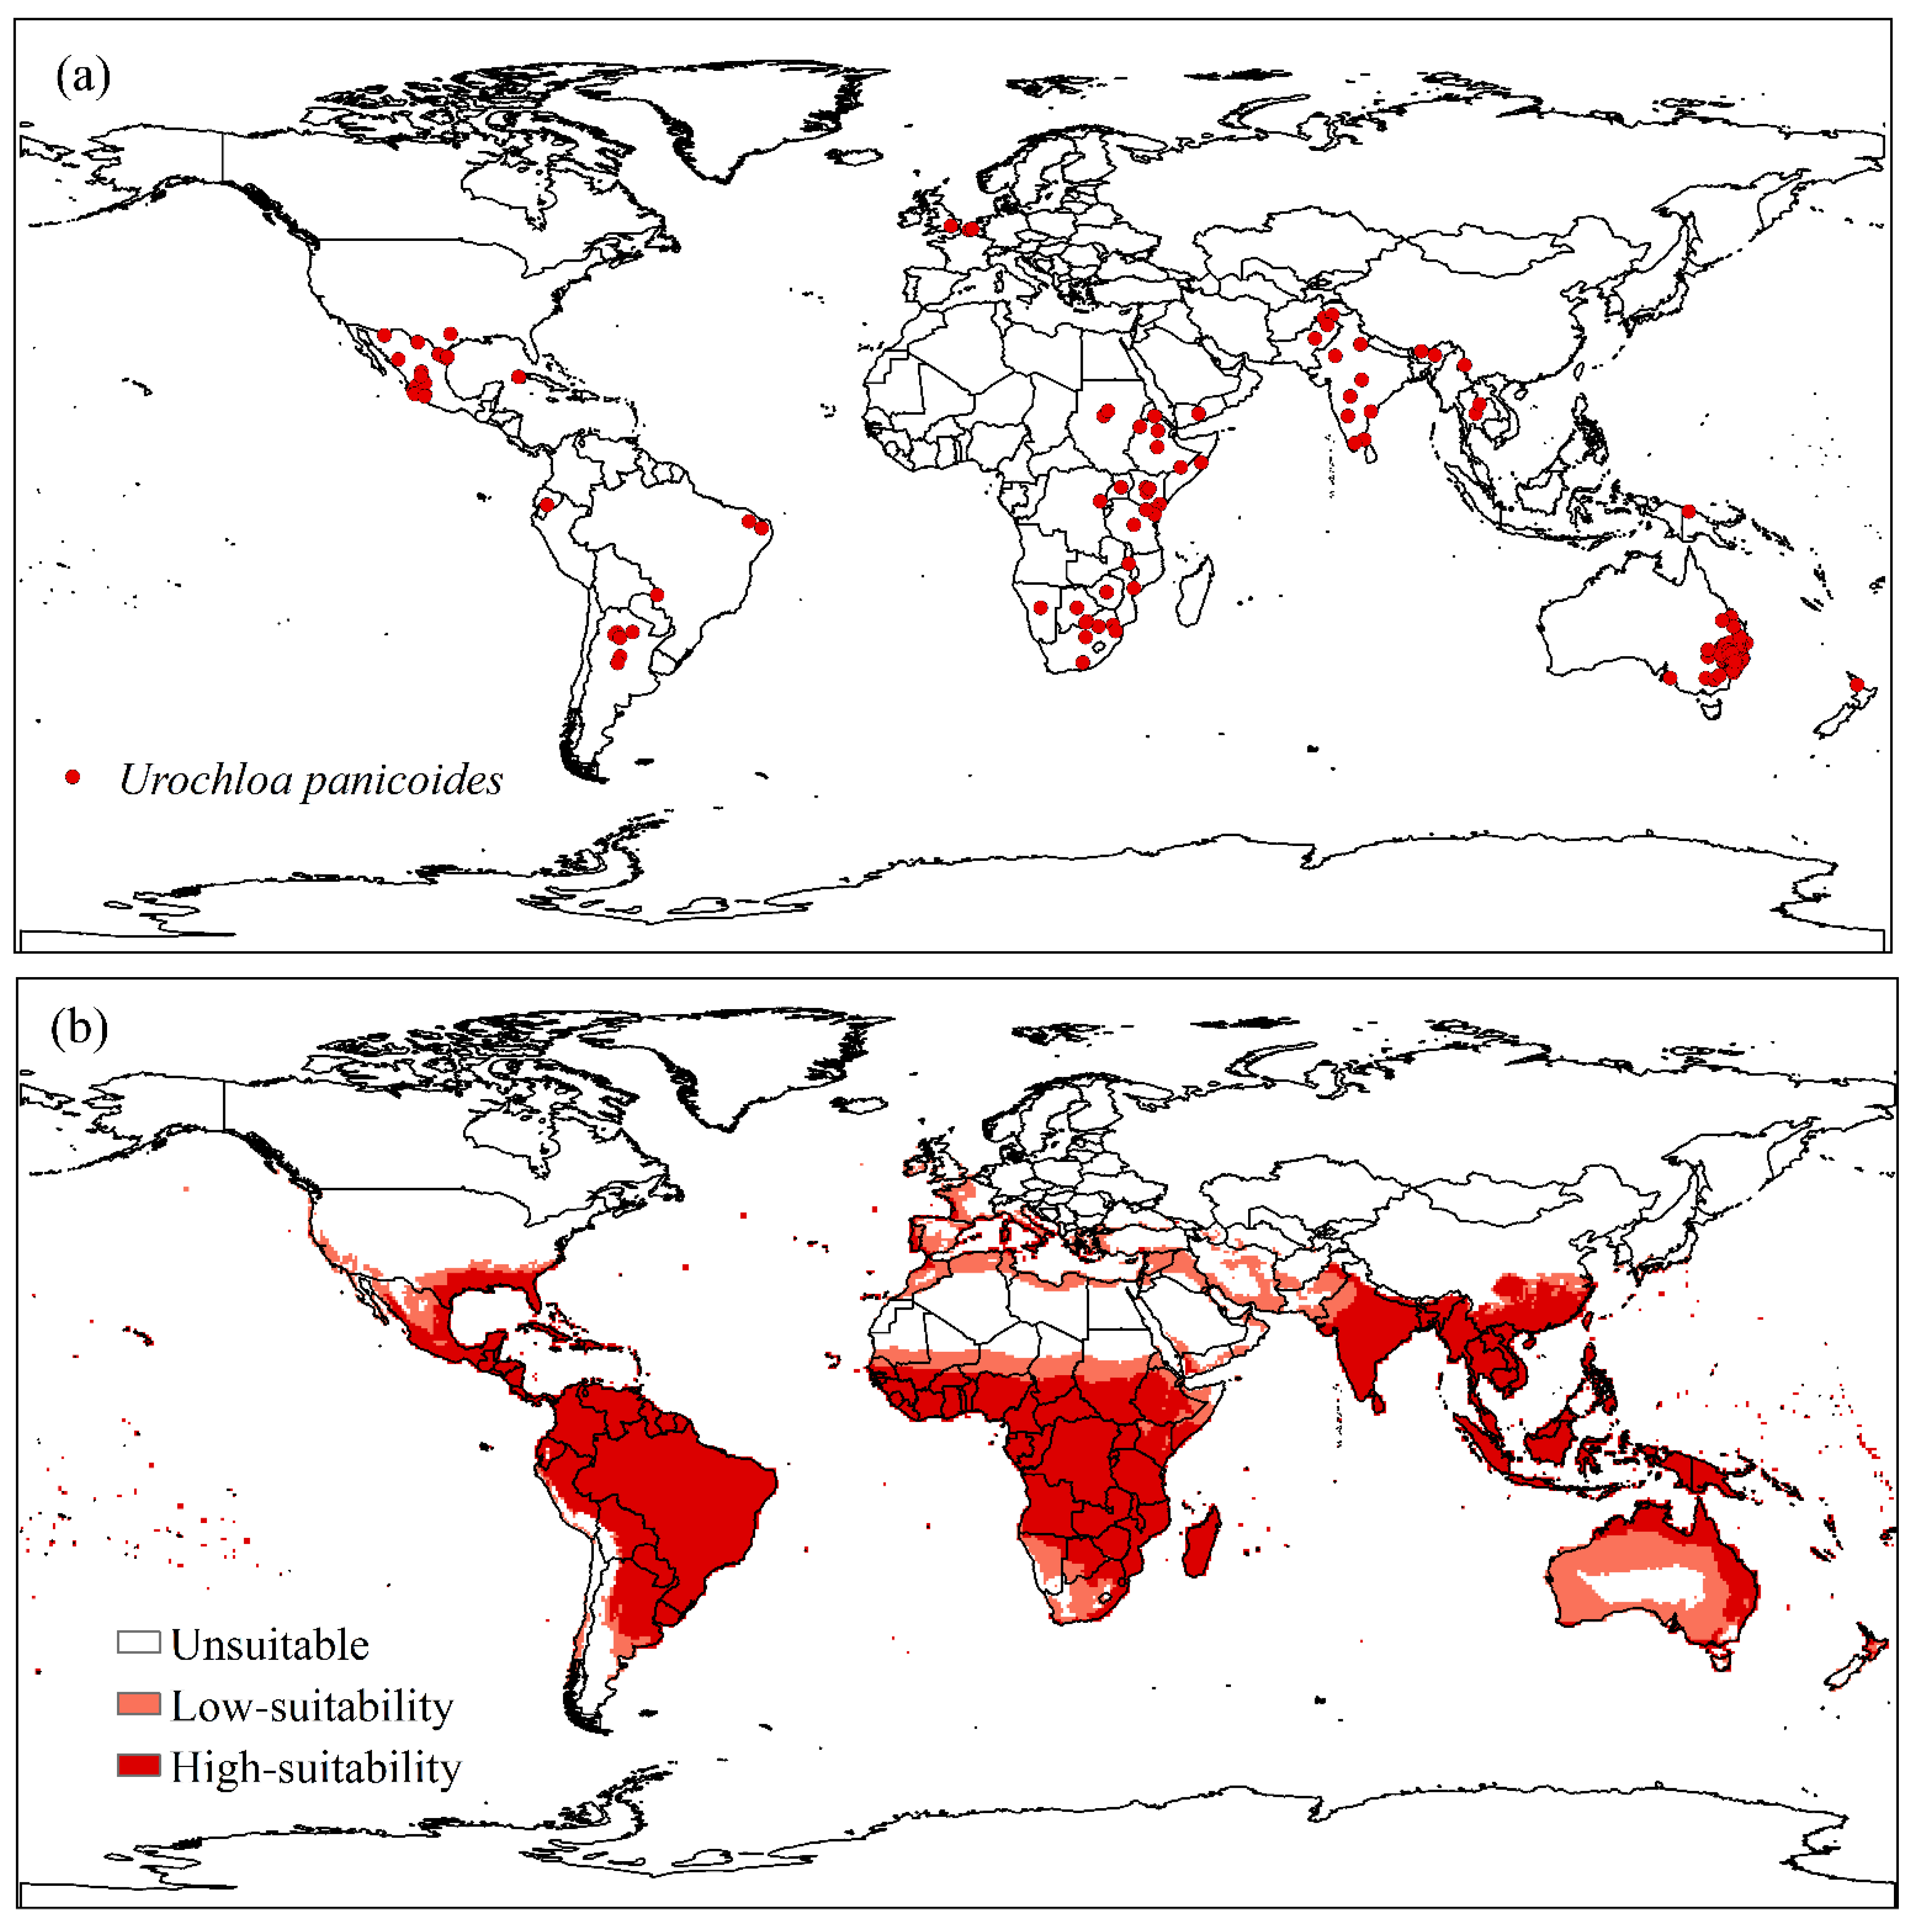
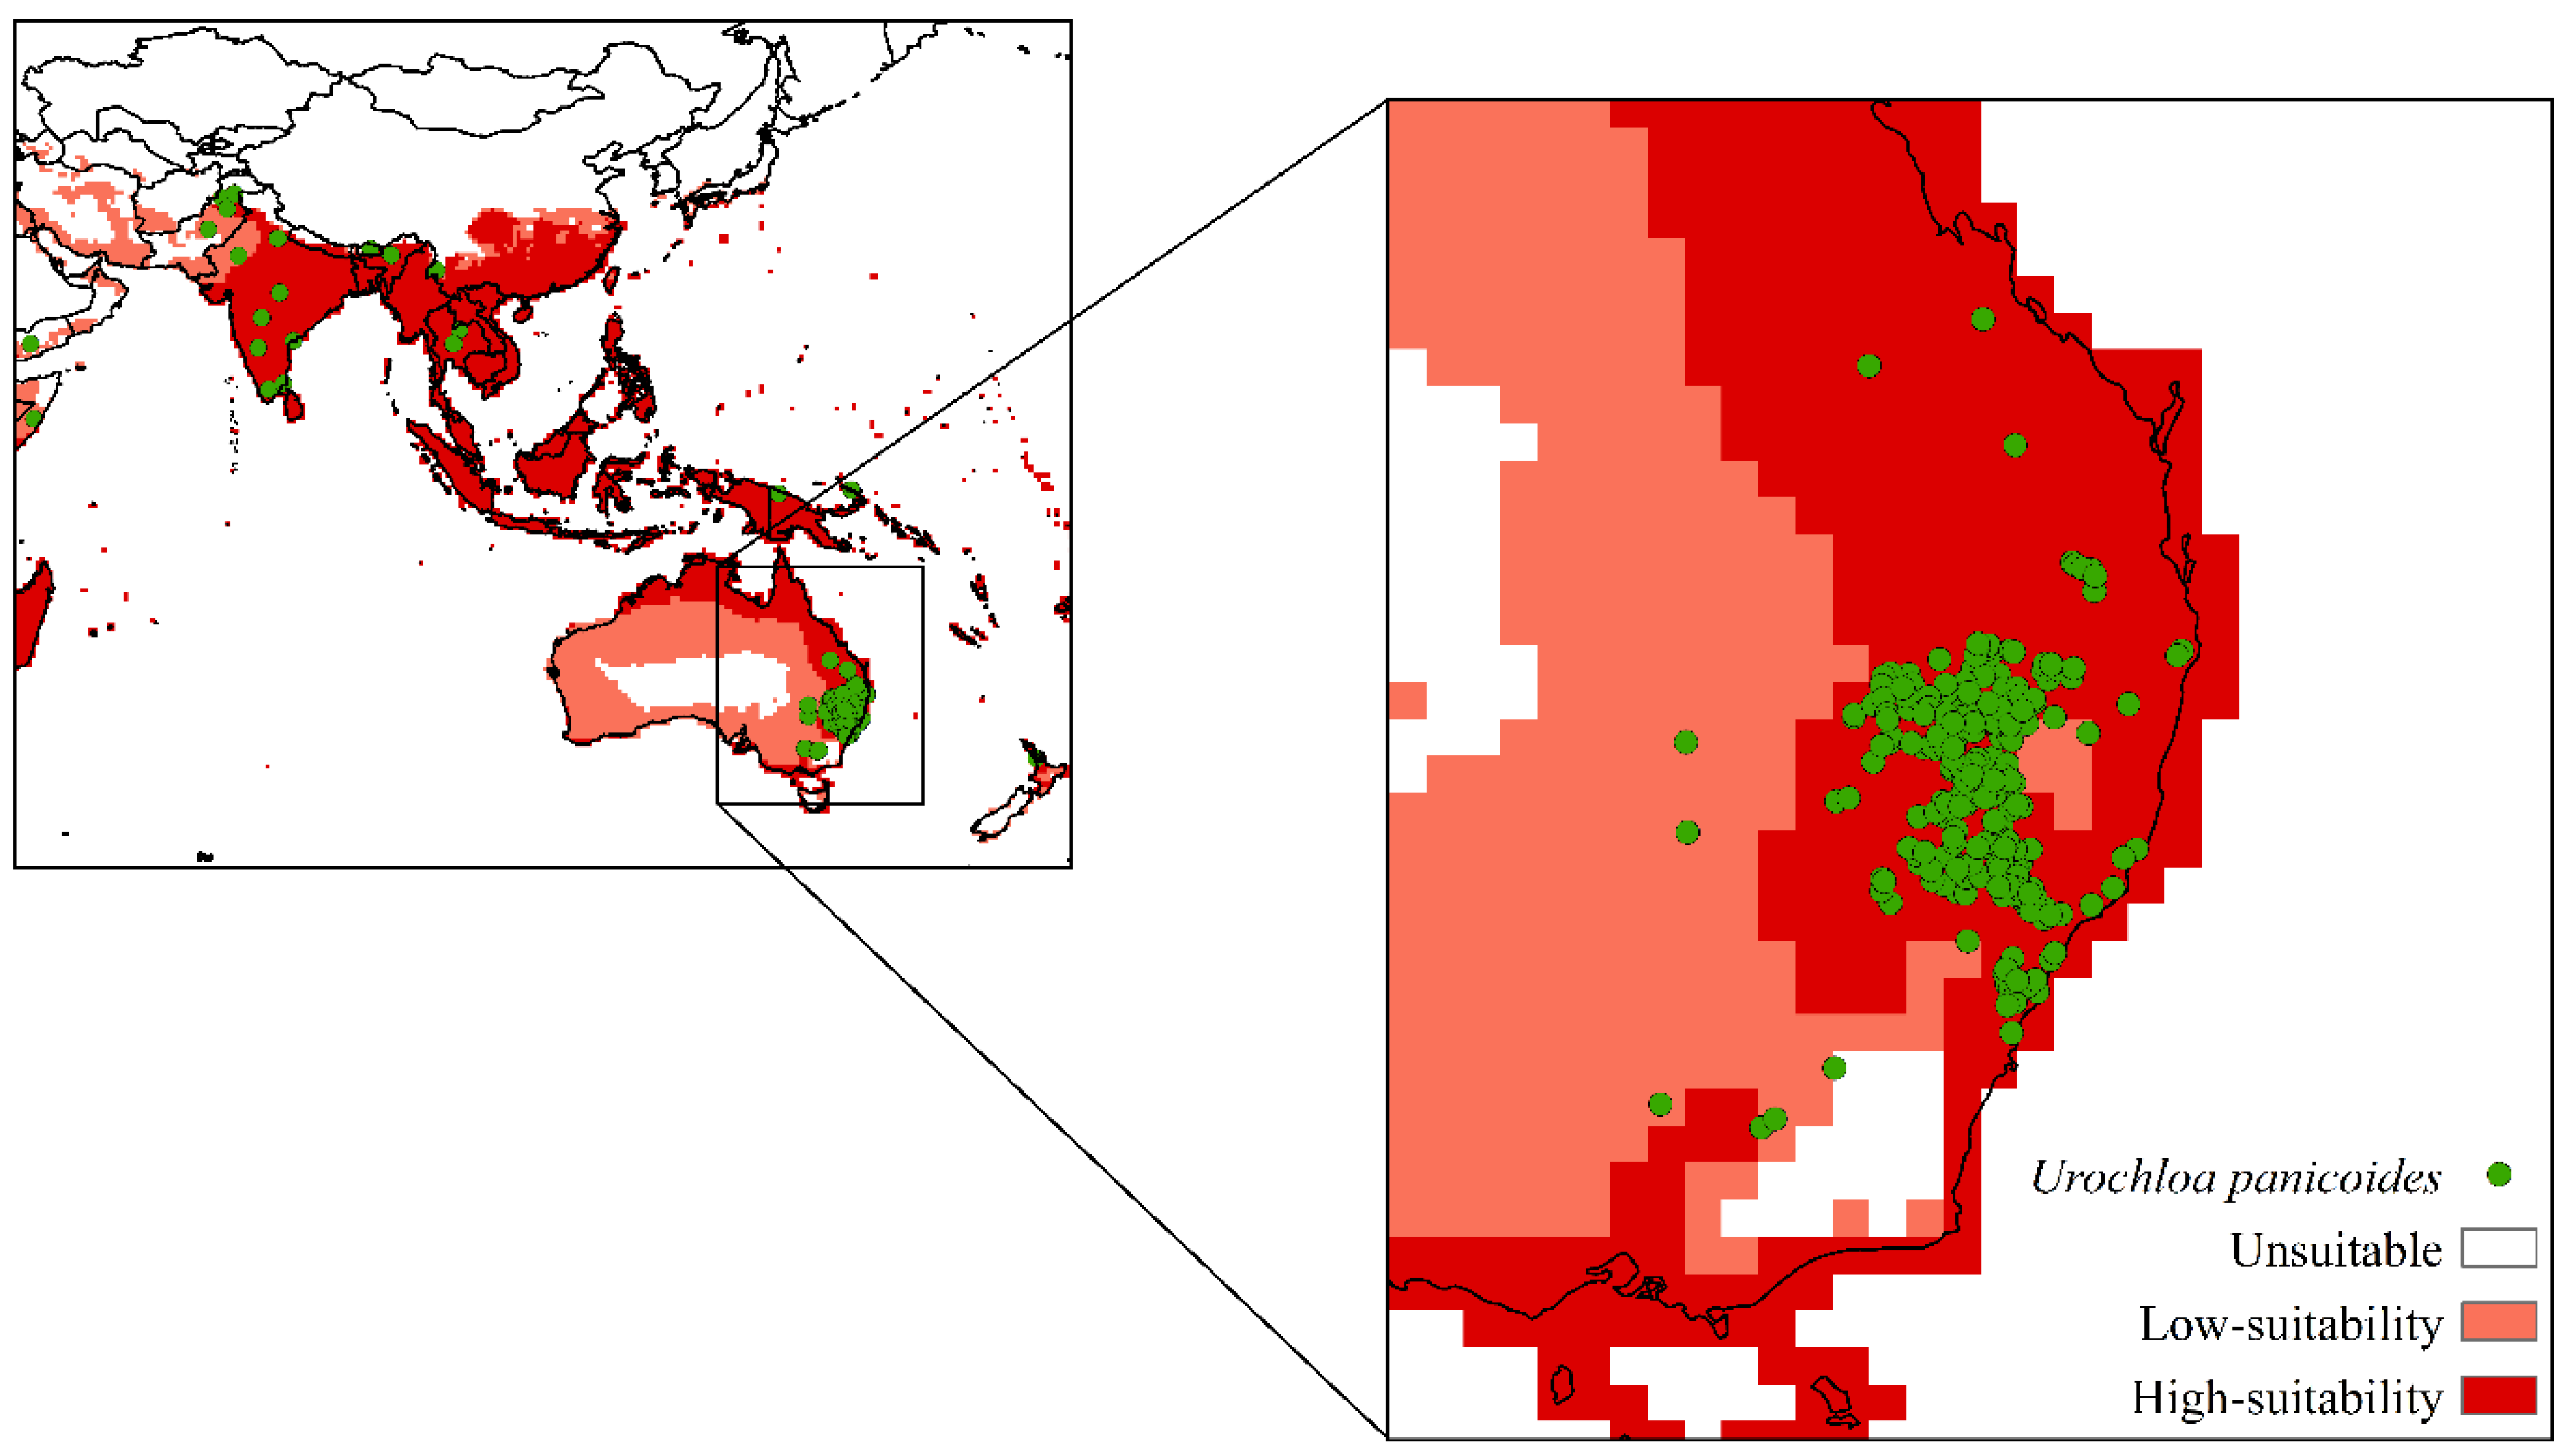
2.1. Global Distribution of Urochloa panicoides

Occurrence data for U. panicoides were collected in online databases: Global Biodiversity Information Facility [21], based on the record of human observations and occurrences, and in the Invasive Species Compendium [20]. In addition, information on the current distribution of U. panicoides was obtained from the published literature, including areas where the species is cultivated or considered invasive (Annex I). Occurrence records were checked, and those with incomplete or duplicate location information were omitted. A total of 730 occurrences were found and filtered in a 10 km radius, resulting in 355 records.

2.2. CLIMEX

The CLIMEX software from climatic and biological parameters predicts a potential distribution of species [36]. Biological parameters are essential components to generate the model, limiting the distribution of the species [37]. The definition of biological parameters was carried out from physiological information of U. panicoides and climatic conditions of the places of occurrence.
The growth, stress, and combination parameters define the Ecoclimatic Index (EI), representing areas with climatic suitability for the development and establishment of species. The EI ranges from 0 to 100, where values close to 0 are inappropriate places for the species to grow, and those above 30 are where climatic conditions are considered adequate [38].

2.3. Parameter Adjustments and Model Validation in CLIMEX Software

The model for U. panicoides was created with parameters related to the biological data of the species and was calibrated as a function of the known distribution. The model validation was based on the distribution of U. panicoides, mainly in regions of Australia and South Africa, where higher occurrences were observed. The verification demonstrates reliability in the final model, with most distribution data entered in areas with a high Ecoclimatic Index.

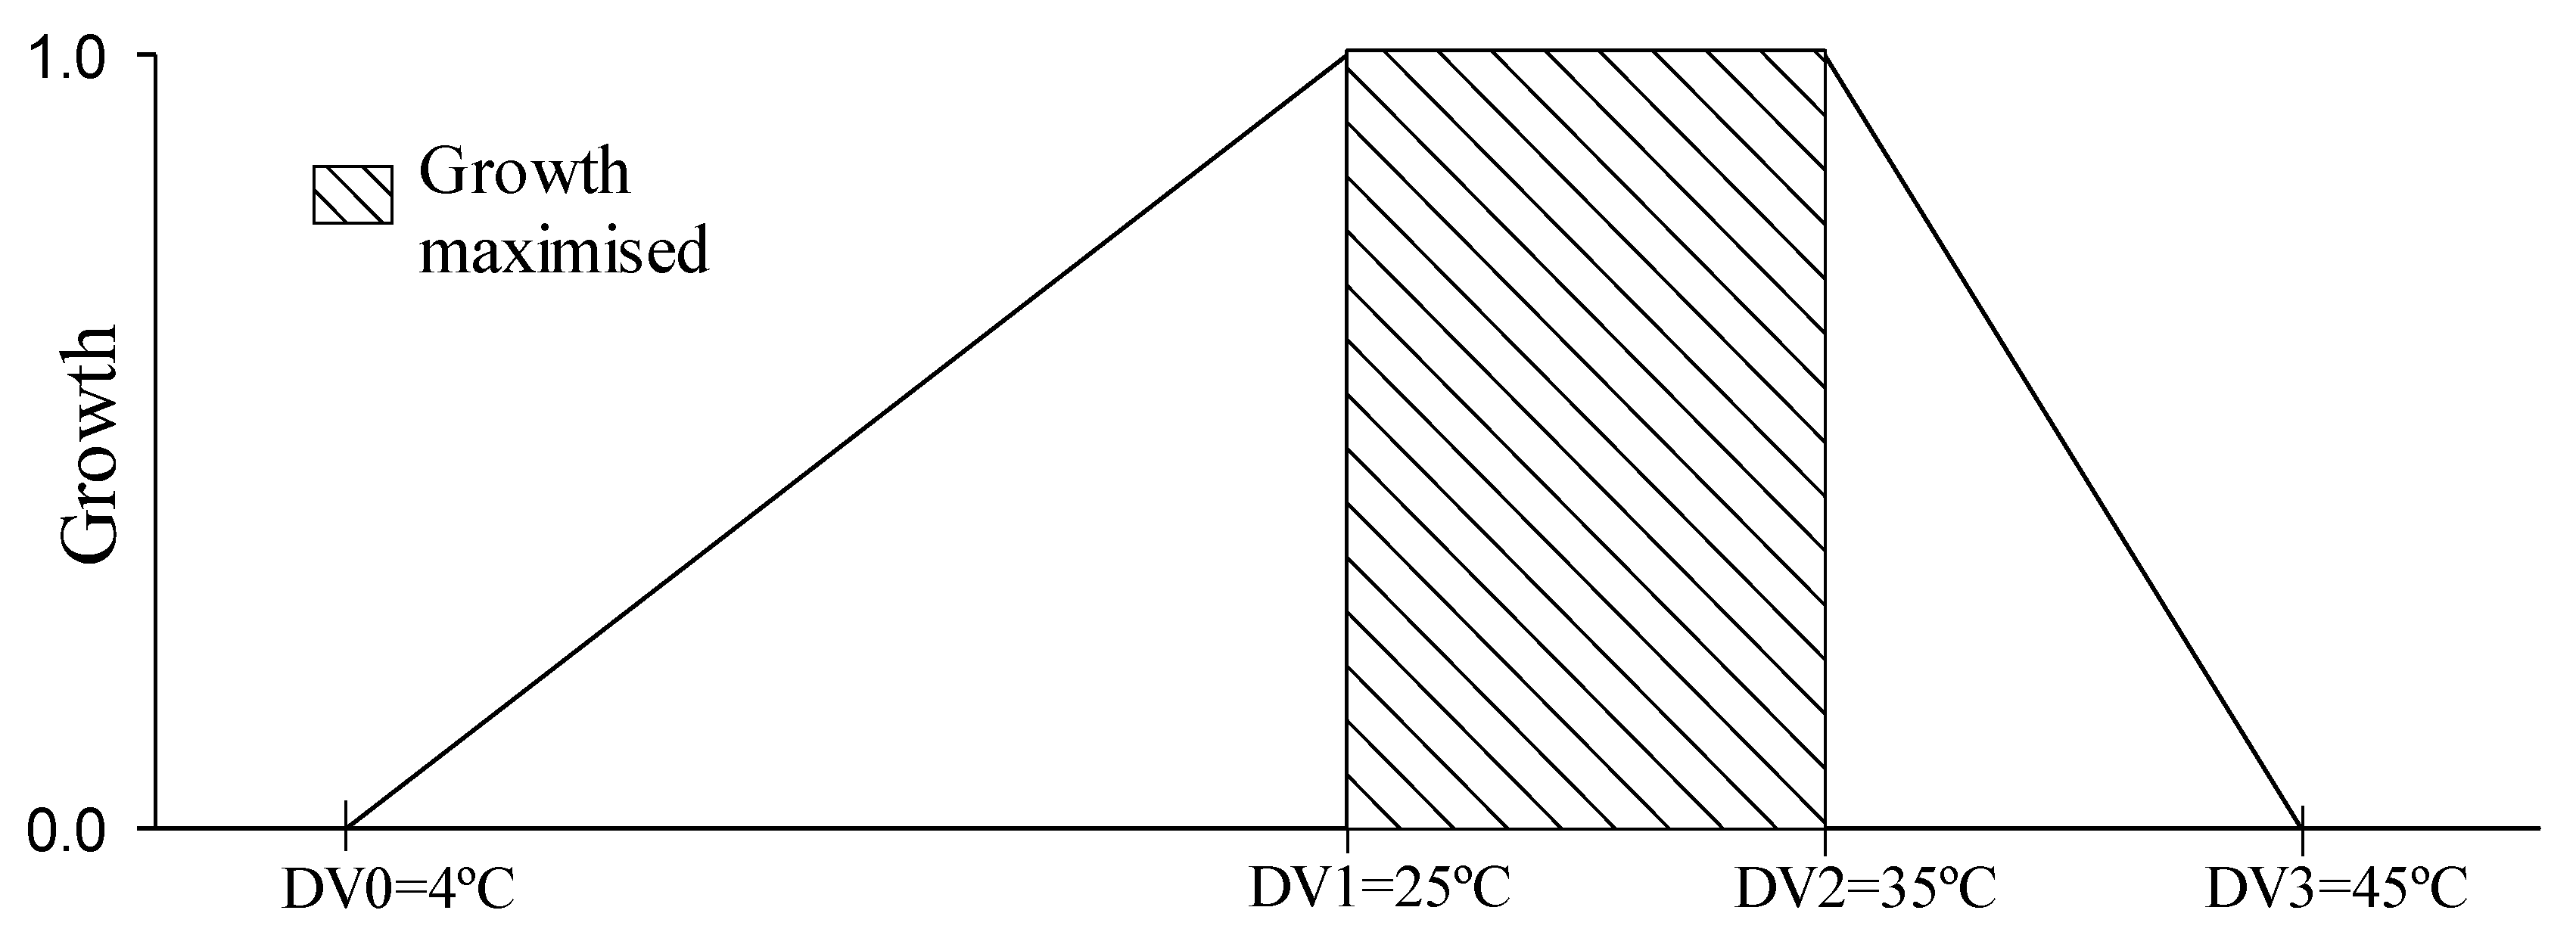
2.3.1. Growth Indices

Thermal requirements of U. panicoides, mainly due to germination and dormancy breaking, have already been reported. The low limiting temperature (DV0) used to make the model was 4 °C because the seeds show dormancy [13]. The high limiting temperature (DV3) of 45 °C was defined based on the maximum temperature for germination [13]. The lower optimal temperature (DV1) and upper (DV2) temperatures were established because constant temperatures from 25 °C favor the breaking of dormancy, germination, and growth, and the temperature of 35 °C is considered optimal for the species [13] (Figure 1).
The degree days for U. panicoides vary between 1202 and 1723 °C days. Thus, the established value was an average between the two extremes, 1517 °C days [39].
The lower limit of moisture and the ideal soil moisture were determined from the best fit of the model in the global distribution of U. panicoides and the upper limit based on moisture content in Queensland, Australia [36]. The lower (SM0), ideal (SM1 and SM2), and upper (SM3) limits established were 0.1, 0.2, 8, and 10, respectively.

2.3.2. Stress Parameters

The cold stress temperature threshold (TTCS) and heat stress temperature threshold (TTHS) were determined from the temperature limits being 4 and 45 °C, respectively [13]. The dry stress threshold (SMDS) was determined according to the lower humidity limit, being 0.01, and the dry stress rate (HDS) was adjusted to −0.01 week−1.
Drought and temperature stress parameters were established due to U. panicoides being tolerant to low soil moisture; however, seeds were stored dry and at temperatures below 4 °C present dormancy. In addition, a temperature of 45 °C is the maximum temperature for germination [13]. Overall, the parameters were established according to the best fit of the distribution data of U. panicoides (Table 1).

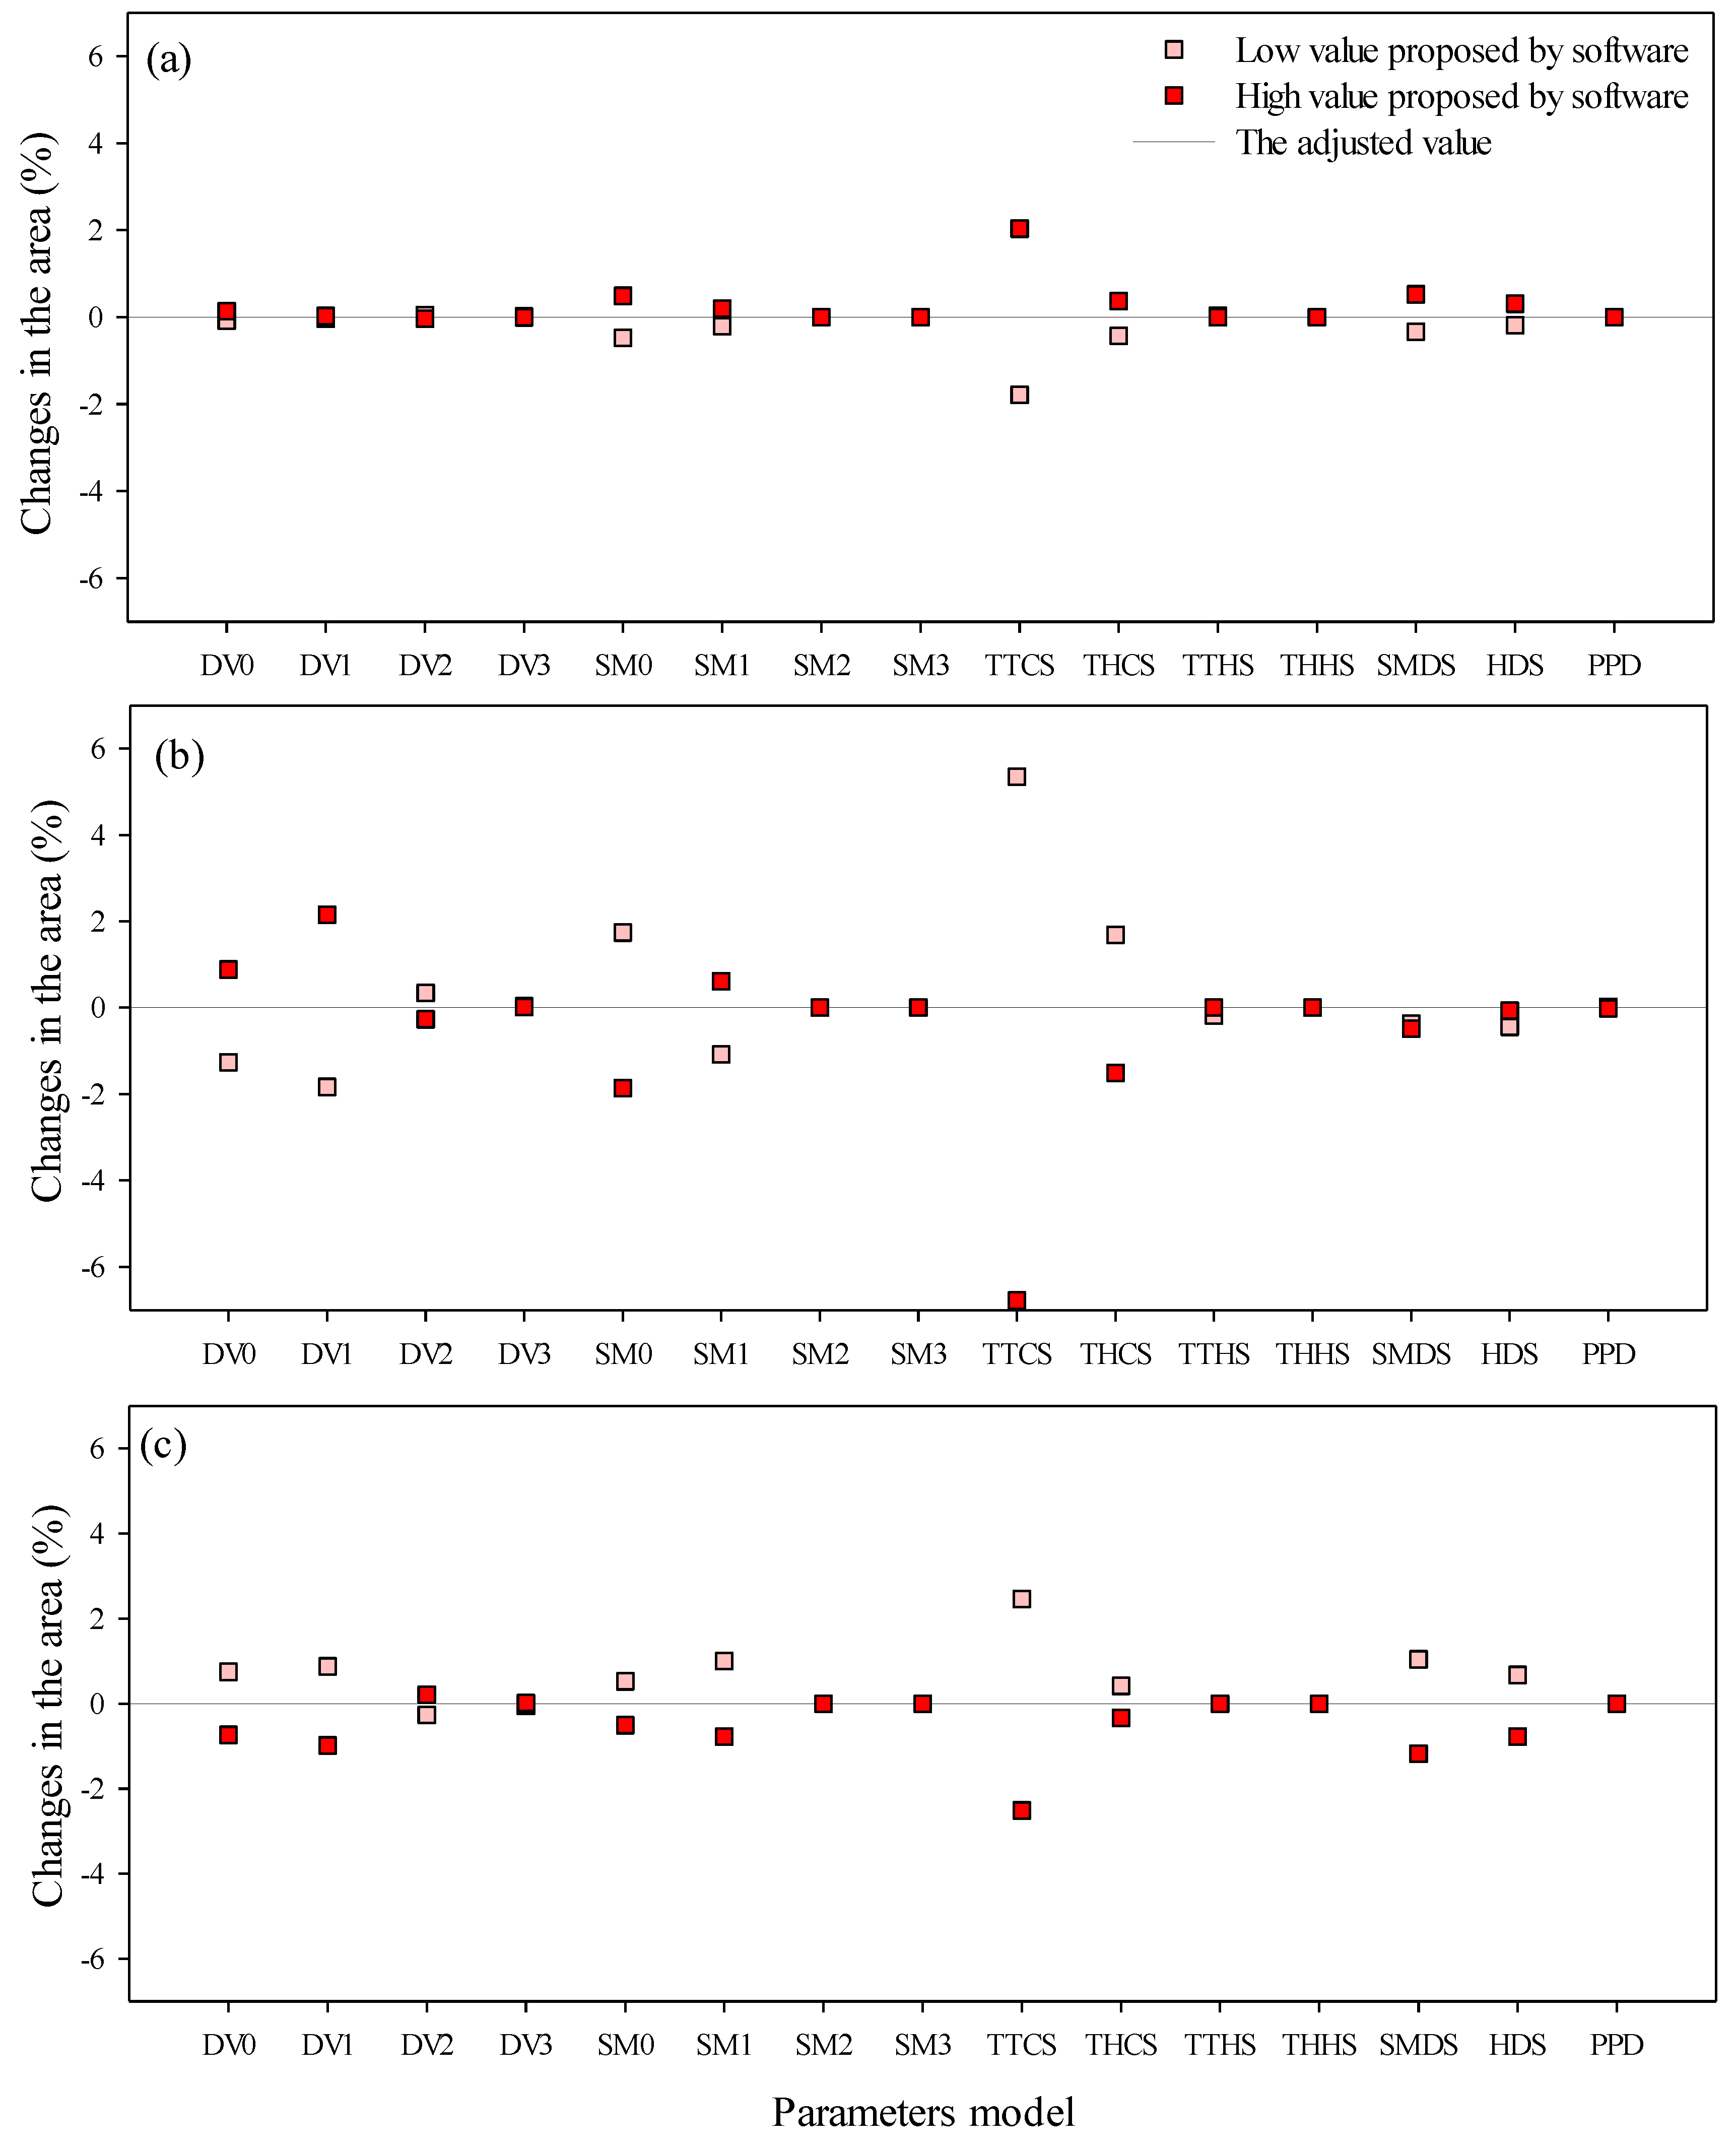
2.4. Sensitivity Analysis Using CLIMEX

The sensitivity analysis consists of reductions and increases in the adjusted values for the growth and stress indices to determine the parameters with the most significant influence on the model [35]. This analysis makes it possible to establish the variables that cause more substantial interference in the growth and establishment of U. panicoides [35].
Sensitivity analysis for U. panicoides was performed using CLIMEX software and the 15 model parameters. Temperature-related parameters (DV0, DV1, DV2, DV3, TTCS, and TTHS) had a variation of ±1 °C. Parameters related to moisture, accumulation rates, and drought stress (SM0, SM1, SM2, SM3, TTHS, THHS, SMDS, and HDS) had a variation of ±10%, and degree-days (PPD) had a variation of ±20 °C days [36] (Table 1).

2.5. Climate Data, Models, and Scenarios
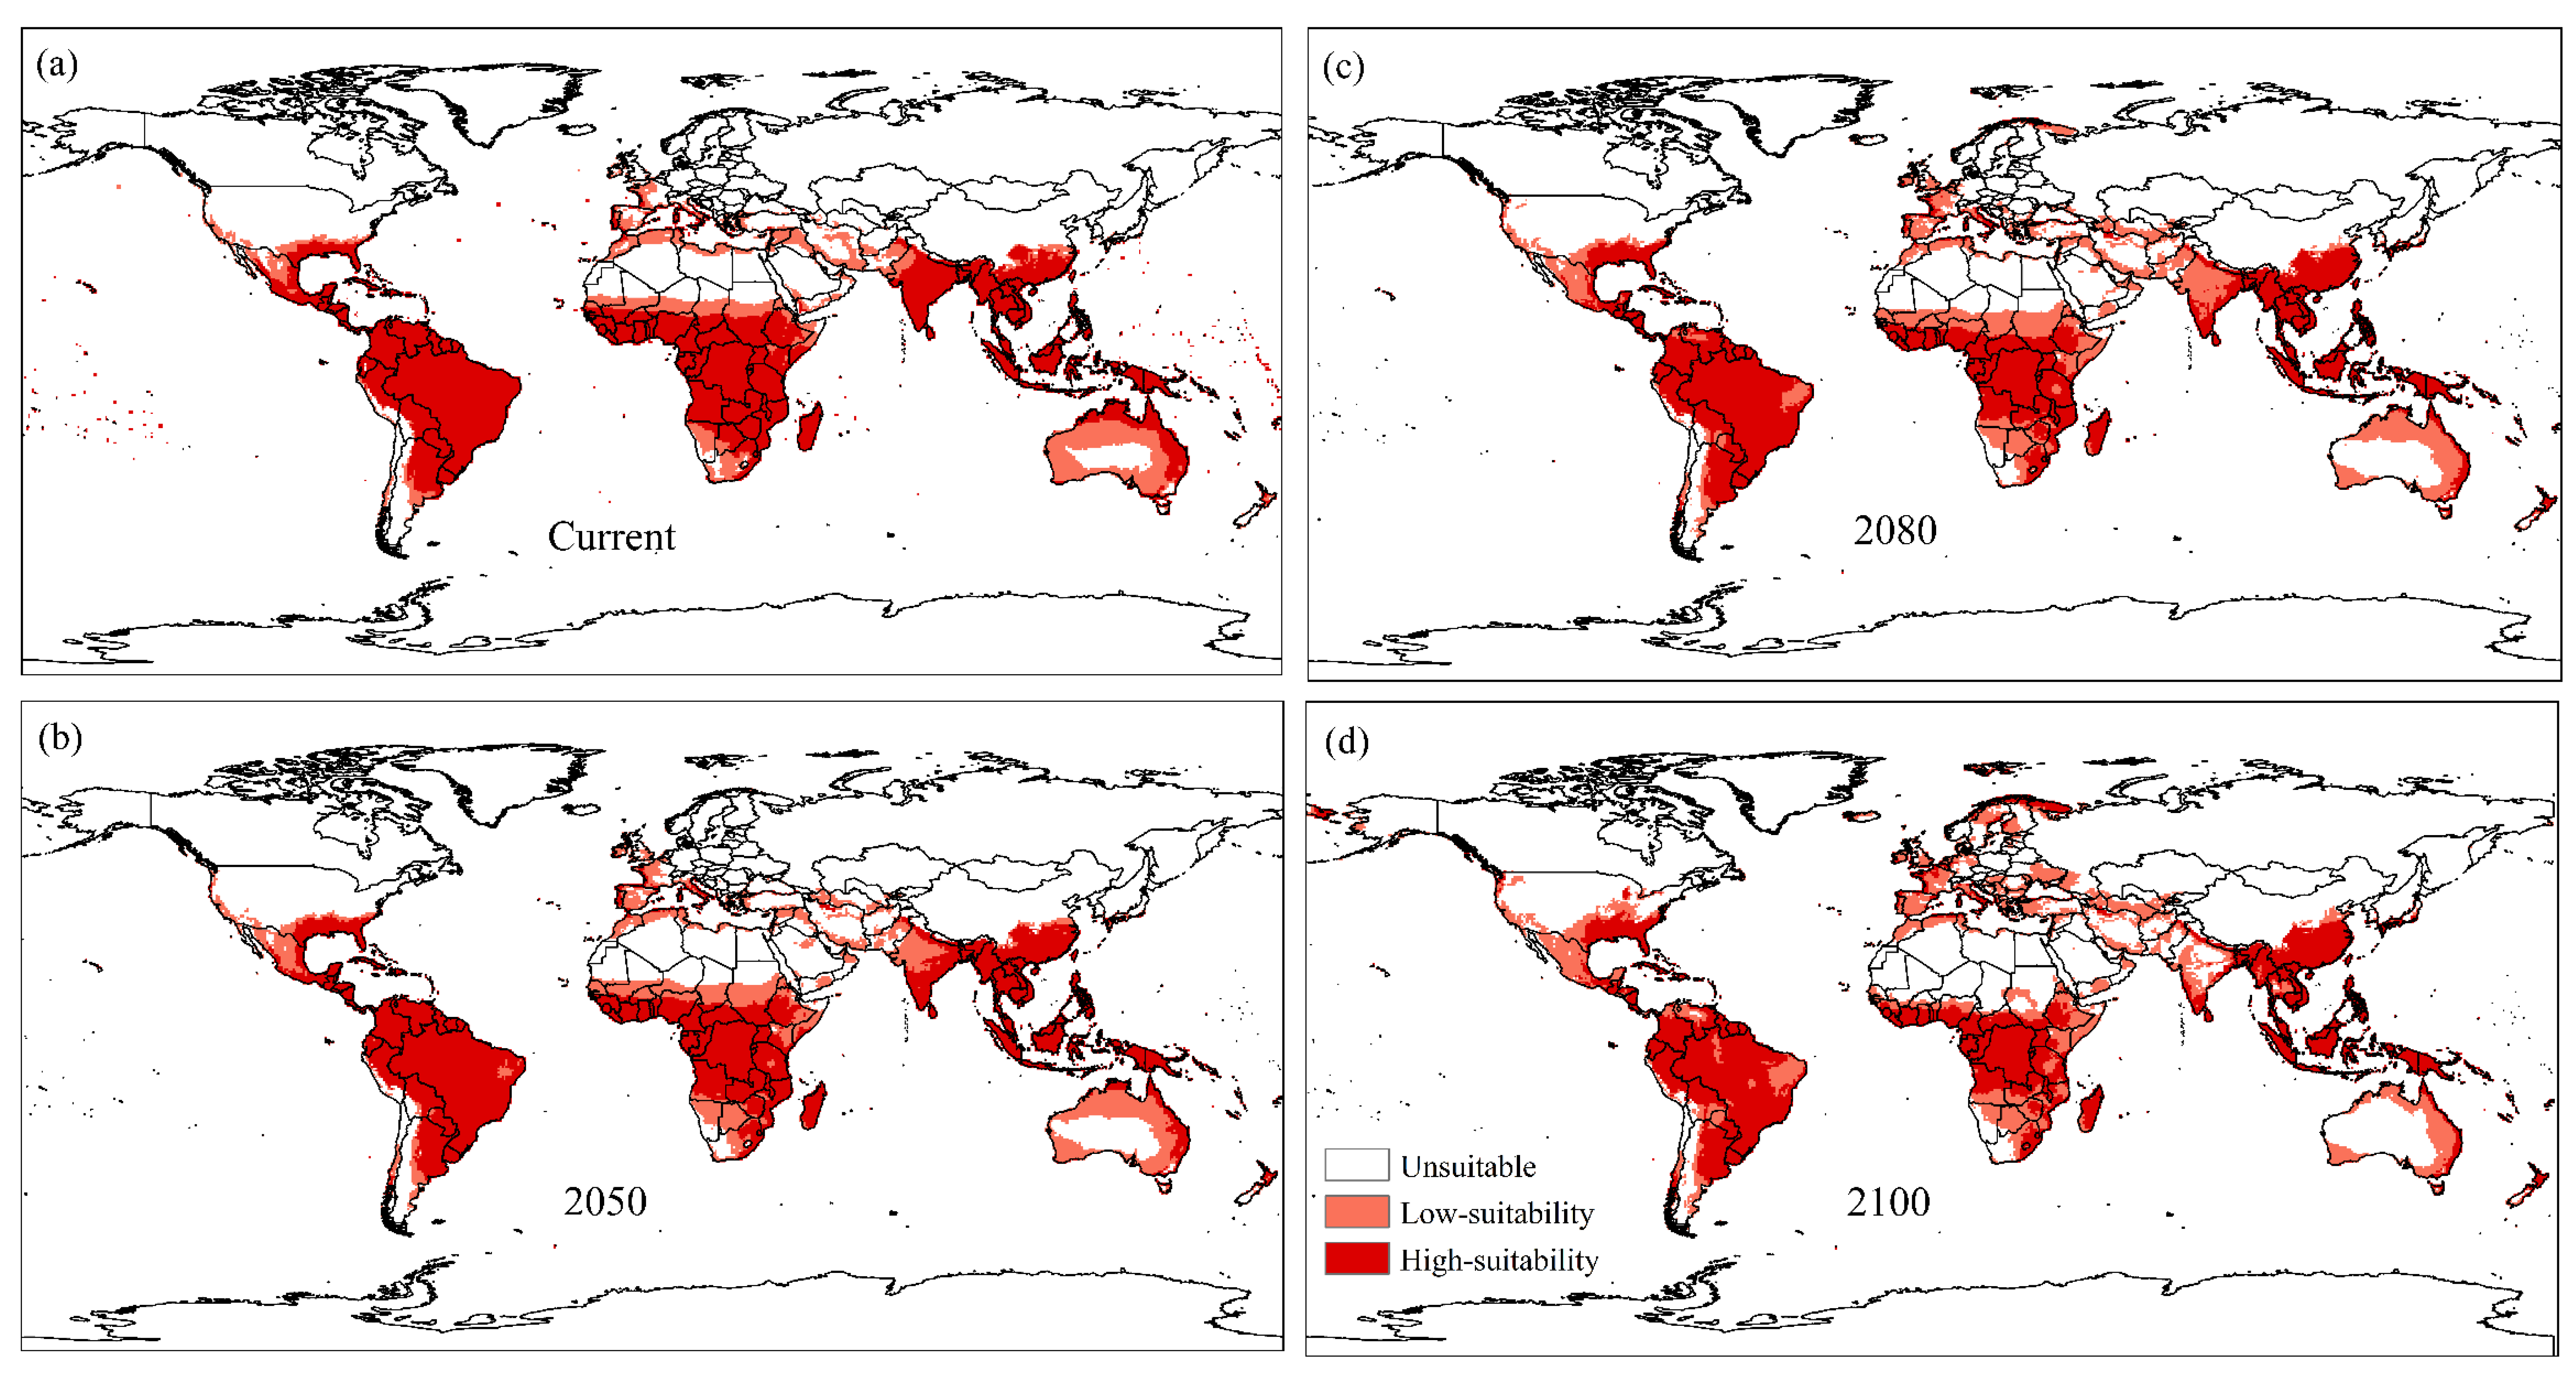
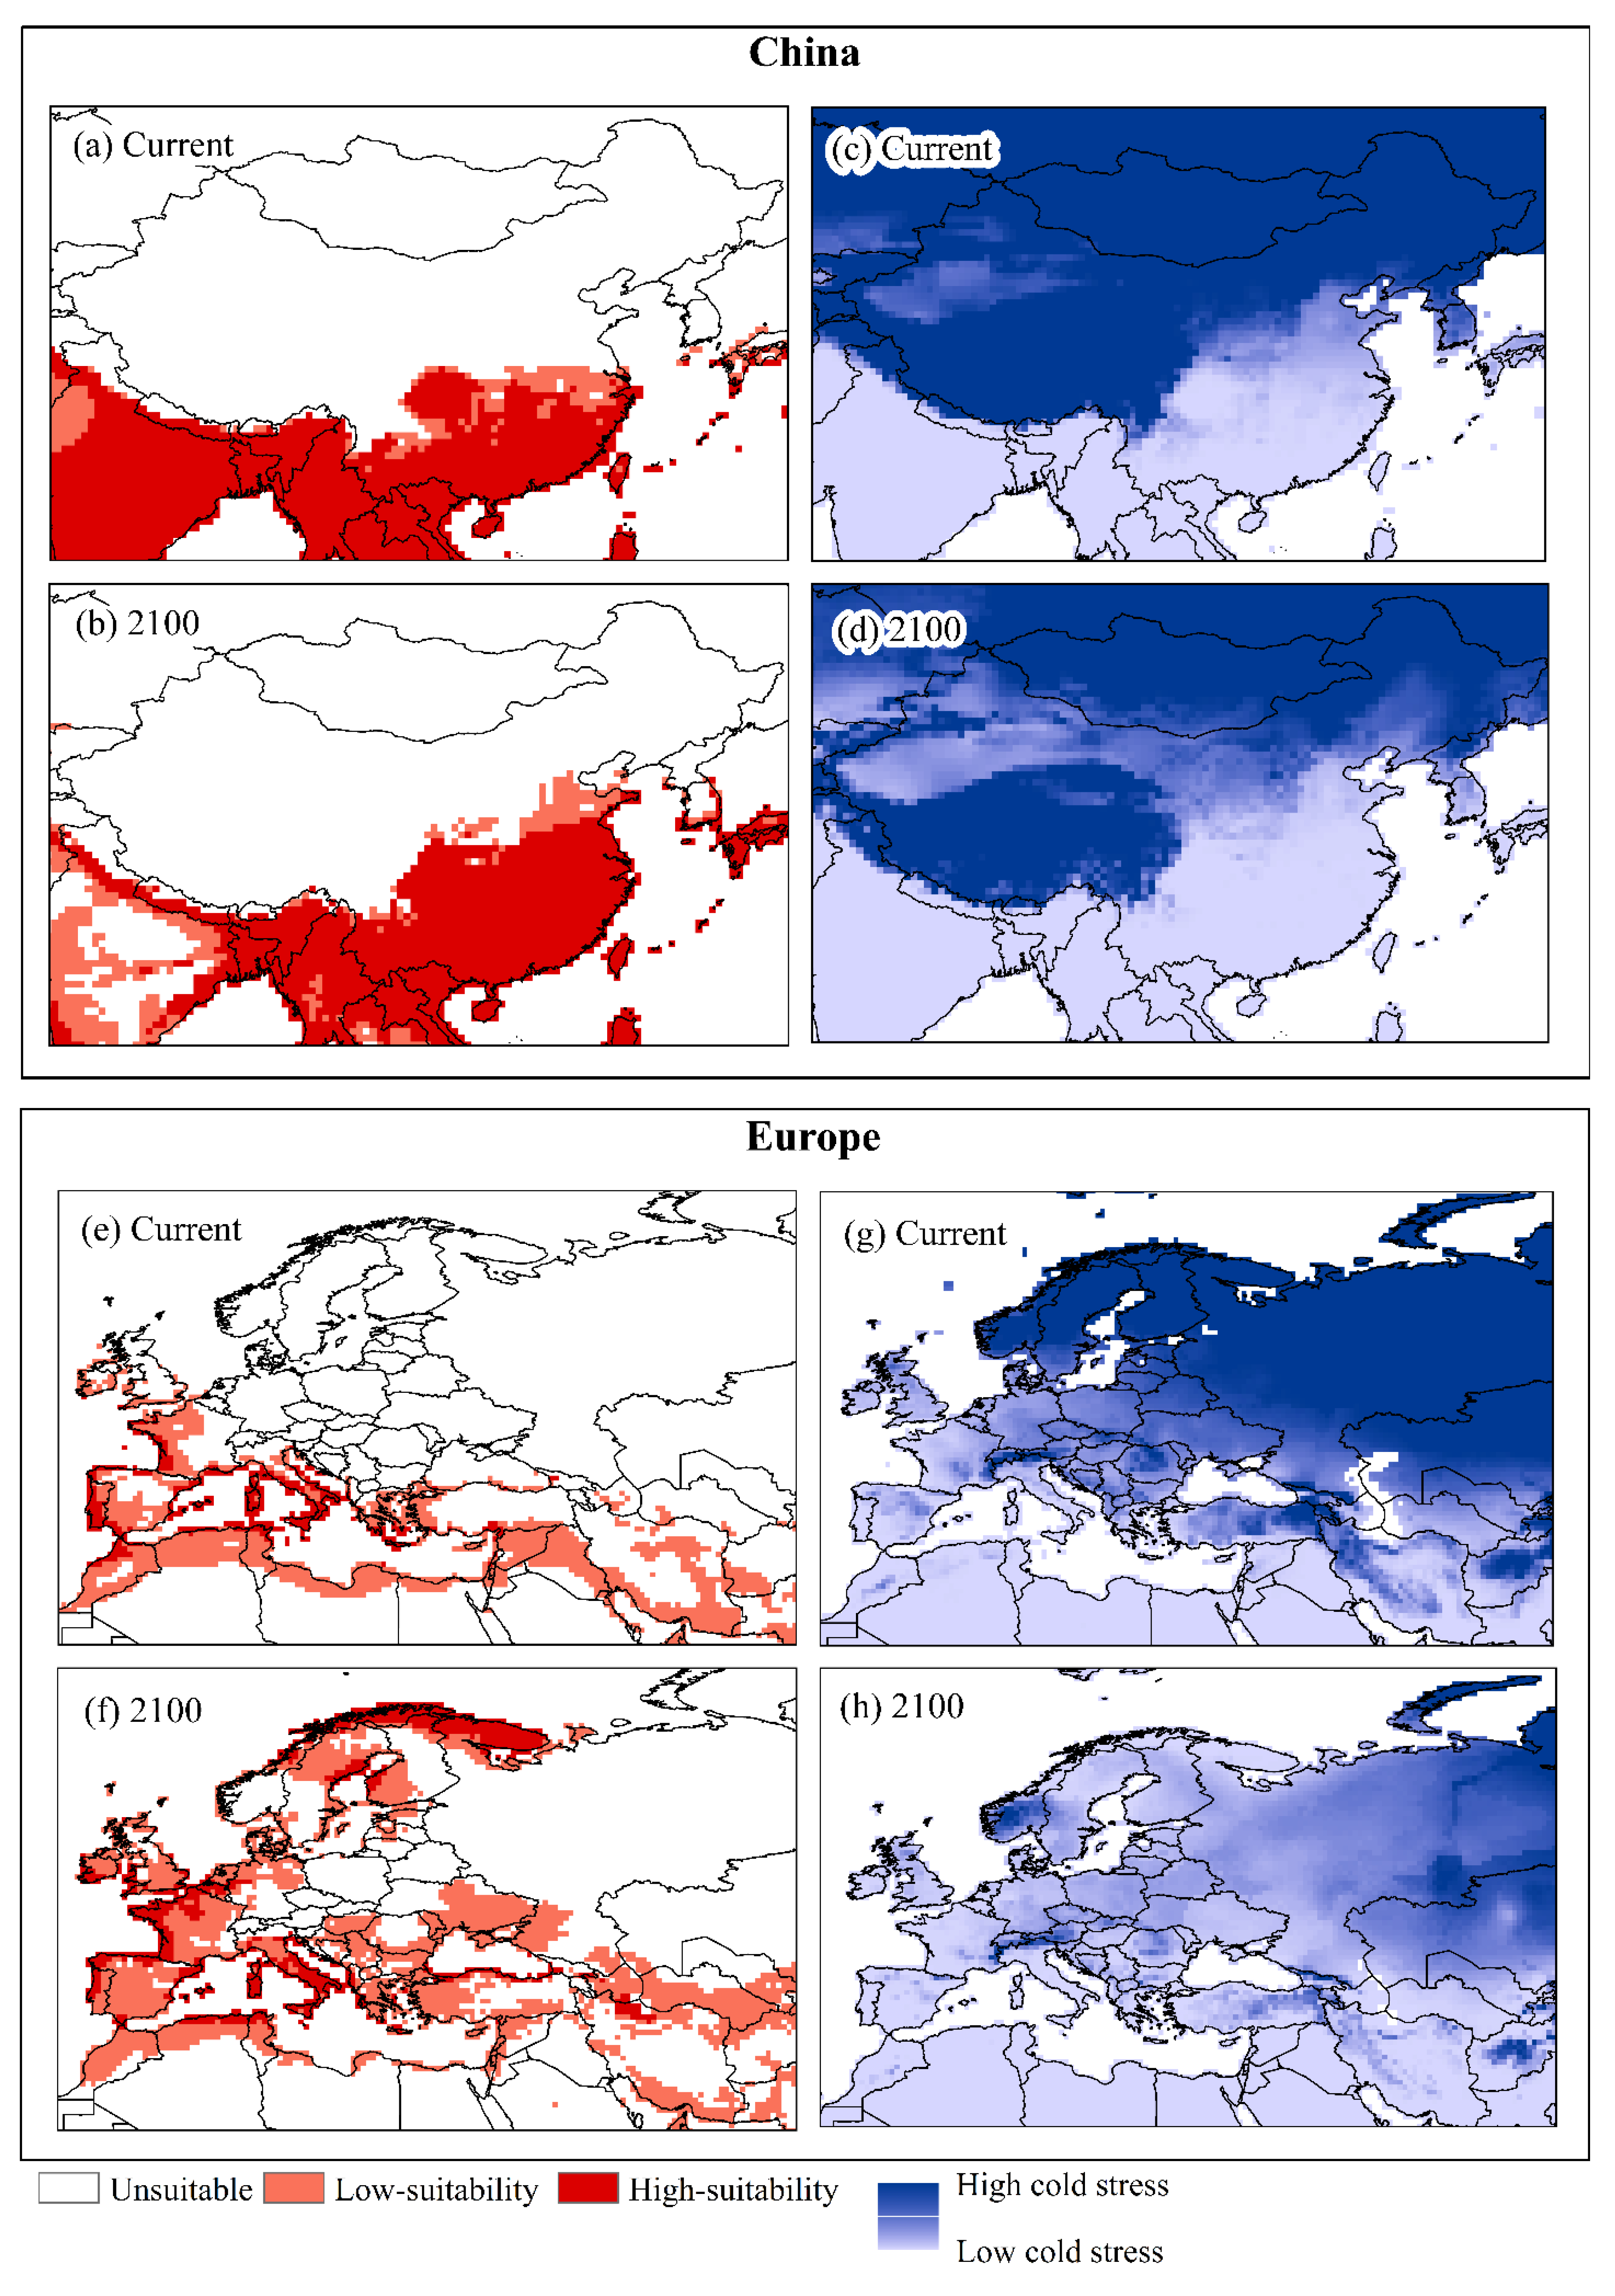
Modeling in CLIMEX was performed using climate data in a Climond 10’ grid. Monthly minimum average temperature and monthly maximum average temperature, monthly average precipitation, and relative humidity at 09:00 and 15:00 h were used to represent the historical climate (data from 1961 to 1990, centered on 1975) [40].
The same variables were used for future modeling. The global distribution of U. panicoides for 2050, 2080, and 2100 was modeled under the A2 SRES scenario using the Global Climate Model (GCM), CSIRO-Mk3.0 (CS) from the Center for Climate Research, Australia [41].
The CS climate system model was chosen because it is comprehensive, encompassing data from the atmosphere, land surface, oceans and sea ice, providing the necessary variables for modeling in CLIMEX (temperature, precipitation and humidity) [41]. The forecasts incorporated into the CS estimate an increase of 2.11 °C and a reduction of 14% in precipitation [42]. Our decision to use A2 SRES was made due to the proven consistency of its premises and incorporation of technological, demographic and economic variables relating to greenhouse gas (GHG) emissions, derived from data representative of the world’s independent, self-reliant countries [42,43,44].

3. Results

Distribution data for U. panicoides showed 355 occurrence points in 32 countries. Oceania accounts for 77.48% of the reported points, followed by Africa (8.45%), America (7.88%), Asia (5.07%), and Europe (1.12%) (Figure 2a). Approximately 91.83% of the occurrence points were in regions considered highly suitable, of which 6.20% were in moderately suitable regions and 1.97% were in regions unsuitable for the occurrence of U. panicoides. The potential distribution of U. panicoides coincides with the data collected and agrees with the EI. The model does not predict the climatic suitability of U. panicoides in most northern and desert regions, where the species is absent. The results indicate that countries in South America, Central America, Asia, and Europe, with little or no occurrence of the species, have areas with suitable climatic conditions (30 < EI < 100) (Figure 2b).
Approximately 76.62% of these occurrences are concentrated in Australia. Therefore, this region was used to validate the model. The model showed a good fit, with 96.69% of the points in the validation region appearing in areas with highly suitable climatic conditions. This high percentage in the validation area indicated that the model was reliable (Figure 3).
The sensitivity analysis showed that for changes in unsuitable areas, the most sensitive parameters in the model were SM1, SM2, TTCS, THCS, SMDS, and HDS; for low-suitability areas, DV0, DV1, DV2, SM0, SM1, TTCS, THCS, and SMDS; and for high-suitability areas, DV0, DV1, SM0, TTCS, THCS, SMDS, and HDS (Figure 4).
Parameters related to cold stress were found to be sensitive. Sensitivity analyses with lower values of TTCS (3 °C) and THCS (−0.0018 week−1) resulted in a reduction of 1.78% and 0.43% in unsuitable areas, an increase of 5.35% and 1.68% in low-suitability areas, and an increase of 2.46% and 0.42% in high-suitability areas, respectively. Sensitivity analyses with higher values of TTCS (5 °C) and THCS (−0.0022 week−1) caused an increase of 2.03% and 0.34% in unsuitable areas, a reduction of 6.77% and 1.51% in low-suitability areas, and a reduction of 2.51% and 0.34% in high-suitability areas, respectively (Figure 4).
Changes in temperature and humidity limits also caused changes in model adequacy for the three area classes. DV1 and SM1 values, when reduced to 24 °C and 0.18, caused a reduction of the unsuitable regions by 0.04% and 0.2%; low-suitability areas were reduced by 1.84% and 1.08%; and high suitability areas were increased by 0.87% and 1%, respectively. DV1 and SM1 values, when raised to 26 °C and 0.22, caused an increase in unsuitable areas by 0.03% and 0.2%; low-suitability areas were increased by 2.15% and 0.62%, and high-suitability areas were reduced by 0.98% and 0.78%, respectively. The observed changes in climatic suitability for U. panicoides depended on the region under study.
Reductions in areas highly suitable for establishing U. panicoides were observed in scenarios designed using CLIMEX under the CSIRO SRES A2 scenario in 2050, 2080, and 2100, compared to those of the current model (Figure 5). The most significant reductions were observed in Brazil, Australia, India, and Africa. The model predicted an increase in low and high suitability areas for establishing U. panicoides in Mexico, the United States, Europe, and Asian countries, especially China.
The scenario projected for the year 2100 for China shows an increase mainly in areas highly suitable for establishing U. panicoides (Figure 6a,b). The scenario projected in 2100 for Europe foresees the conversion of unsuitable regions to moderately and highly suitable areas for U. panicoides (Figure 6e,f). In both areas, compared with the current model, the projected scenario for 2100 showed reductions in cold stress (Figure 6b,d,g,h).

4. Discussion

The wide distribution of the grass Urochloa panicoides in tropical and subtropical regions is attributed to C4 photosynthetic metabolism [13]. The temperature range in which the growth of U. panicoides is maximized (25–35 °C) coincides with the range where plants with the C4 mechanism show maximum CO2 assimilation and photosynthesis [45,46].
The validation region (Figure 3) demonstrated the reliability of the model. SDMs generated by CLIMEX are effective tools for determining areas with high climatic suitability for a species [47]. However, limitations occur because the models do not consider biotic interactions such as competition, predation, parasitism, and the occurrence of diseases [48]. Additionally, non-climatic factors such as land use, fertility, and soil type are not considered [49].
The sensitivity analysis in CLIMEX changed the EI, mainly in parameters related to temperature and humidity (TTCS, TTHS, DV0, DV1, SM0, and SM1). Temperature and humidity are the main factors determining growth rate and, consequently, climatic suitability [36]. For U. panicoides, constant values below the ideal temperature and lower humidity (25 °C and 0.2) cause seed dormancy, preventing germination and growth [13]. U. panicoides has low cold tolerance, especially for prolonged cold periods [50]. Therefore, the parameters of cold stress and accumulation rate are the most sensitive in the analysis. The effectiveness of weed control is influenced by climatic factors [51]. Prolonged high temperatures can change the selectivity and persistence of herbicides [52], making U. panicoides difficult to control in regions with high temperatures.
Progressive reductions in the suitability of U. panicoides in Brazil, Australia, India, and Africa in scenarios designed using CLIMEX under the CSIRO SRES A2 scenario in 2050, 2080 and 2100 are attributed to possible decreases in humidity and increases in stress during drought [53]. Climate change modifies rainfall patterns, and the water availability influences physiological processes of weeds [51]. Climate change could reduce the suitability of this species in regions such as Australia, where U. panicoides herbicide resistance is an economic problem [54].
The increase in suitable areas in Mexico, the United States, and mainly in China and Europe, where there is a low occurrence of the species, occurs because of the reduction in cold stress [53], which is the most sensitive parameter of the model that limits the growth of U. panicoides. Temperate regions where the colonization of tropical and subtropical species such as U. panicoides is restricted can develop because of the increase in temperature and CO2 [55]. Additionally, in the face of climate change, species with C4 metabolism will become more competitive than C3 species [56] and may expand their distribution to higher latitudes [57].
Urochloa panicoides is an annual species with considerable herbicide resistance that mainly affects soybean and corn crops [16,58] and is one of the main weeds in cotton cultivation in Australia [54]. Weed populations have specific characteristics; therefore, the spread of U. panicoides in China and Europe would change the species composition of agricultural and natural areas [59]. These regions have significant contributions to the world production of cotton, corn, and soybean [22], and the presence of U. panicoides would lead to economic and productivity losses in addition to the loss of biodiversity, requiring the creation of integrated management of plant weeds in response to climate change [51,59].

5. Conclusions

The SDM for U. panicoides generated by the CLIMEX software identified regions, such as Brazil and China, where occurrence is favorable, despite few records.
Sensitivity analysis demonstrated that the most sensitive parameters of the model were related to temperature (DV0 and DV1), humidity (SM0 and SM1), and cold stress (TTCS and TTHS).
The model projections for the years 2050, 2080, and 2100 using CLIMEX under the CSIRO SRES A2 scenario determined reductions in climatic suitability for U. panicoides in Brazil, Australia, India, and the African continent and an increase in moderately and highly suitable areas in Mexico, the United States, and European and Asian countries.
The mold projection for 2100 foresees an increase in areas suitable for U. panicoides in China and Europe. The introduction and dissemination of this species in these regions can result in biodiversity, productivity, and economic losses.
From the results obtained, it is possible to identify places where U. panicoides has high current and/or future climatic suitability and to create management strategies to avoid the entry and spread of the species.

Supplementary Materials

The following supporting information can be downloaded at: https://www.mdpi.com/article/10.3390/plants11131761/s1. Annex I: Occurrences of Urochloa panicoides collected in Global Bio-diversity Information Facility (GBIF), Invasive Species Compendium (CABI) and in published literature. Refs. [60,61,62,63,64,65,66,67,68,69,70,71,72,73,74,75,76,77,78,79,80,81,82,83,84,85] are cited in Supplementary Materials.

Author Contributions

Conceptualization, T.S.D. and J.B.d.S.; Data curation, T.S.D. and J.C.M.; Funding acquisition, J.B.d.S.; Investigation, T.S.D., R.S.d.S., J.C.M., and D.V.S.; Methodology, R.S.d.S. and J.B.d.S.; Project administration, T.S.D. and J.B.d.S.; Validation, R.S.d.S., D.V.S., B.C.C.F., and A.P.B.J.; Visualization, J.C.M. and A.P.B.J.; Writing—original draft, T.S.D.; Writing—review and editing, D.V.S., B.C.C.F., and A.P.B.J. All authors have read and agreed to the published version of the manuscript.

Funding

Coordenação de Aperfeicoamento de Pessoal de Nível Superior: 001; Fundação de Amparo à Pesquisa do Estado de Minas Gerais: 001.

Data Availability Statement

All other data are presented in the paper.

Acknowledgments

To the “Conselho Nacional de Desenvolvimento Científico e Tecnológico (CNPq)”, “Coordenação de Aperfeiçoamento de Pessoal de Nível Superior (CAPES)—Código Financeiro 001”, “Fundação de Amparo à Pesquisa do Estado de Minas Gerais (FAPEMIG) ”, “Universidade Federal dos Vales do Jequitinhonha e Mucuri (UFVJM) ”, and “Syngenta Crop Protection”.

Conflicts of Interest

The authors declare no conflict of interest.

References

  1. Bonnamour, A.; Gippet, J.M.; Bertelsmeier, C. Insect and plant invasions follow two waves of globalisation. Ecol. Lett. 2021, 24, 2418–2426. [Google Scholar] [CrossRef] [PubMed]
  2. Pyšek, P.; Hulme, P.E.; Simberloff, D.; Bacher, S.; Blackburn, T.M.; Carlton, J.T.; Richardson, D.M. Scientists’ warning on invasive alien species. Biol. Rev. 2020, 95, 1511–1534. [Google Scholar] [CrossRef] [PubMed]
  3. Diagne, C.; Leroy, B.; Gozlan, R.E.; Vaissière, A.C.; Assailly, C.; Nuninger, L.; Roiz, D.; Jourdain, F.; Jaric, I.; Courchamp, F. InvaCost, a public database of the economic costs of biological invasions worldwide. Sci. Data 2020, 7, 1–12. [Google Scholar] [CrossRef] [PubMed]
  4. Paini, D.R.; Sheppard, A.W.; Cook, D.C.; De Barro, P.J.; Worner, S.P.; Thomas, M.B. Global threat to agriculture from invasive species. Proc. Natl. Acad. Sci. USA 2016, 113, 7575–7579. [Google Scholar] [CrossRef] [PubMed] [Green Version]
  5. Carboni, M.; Livingstone, S.W.; Isaac, M.E.; Cadotte, M.W. Invasion drives plant diversity loss through competition and ecosystem modification. J. Ecol. 2021, 109, 3587–3601. [Google Scholar] [CrossRef]
  6. Zhang, Z.; Suseela, V. Nitrogen availability modulates the impacts of plant invasion on the chemical composition of soil organic matter. Soil Biol. Biochem. 2021, 156, 108195. [Google Scholar] [CrossRef]
  7. Ni, M.; Deane, D.C.; Li, S.; Wu, Y.; Sui, X.; Xu, H.; Chu, C.; He, F.; Fang, S. Invasion success and impacts depend on different characteristics in non-native plants. Divers Distrib. 2021, 27, 1194–1207. [Google Scholar] [CrossRef]
  8. Van Kleunen, M.; Pyšek, P.; Dawson, W.; Essl, F.; Kreft, H.; Pergl, J.; Winter, M. The global naturalized alien Flora (Glo NAF) database. Ecology 2018, 100, e02542. [Google Scholar] [CrossRef] [PubMed] [Green Version]
  9. Roura-Pascual, N.; Leung, B.; Rabitsch, W.; Rutting, L.; Vervoort, J.; Bacher, S.; Essl, F. Alternative futures for global biological invasions. Sustain. Sci. 2021, 16, 1637–1650. [Google Scholar] [CrossRef]
  10. Blackburn, T.M.; Essl, F.; Evans, T.; Hulme, P.E.; Jeschke, J.M.; Kühn, I.; Bacher, S. A unified classification of alien species based on the magnitude of their environmental impacts. PLoS Biol. 2014, 12, e1001850. [Google Scholar] [CrossRef] [PubMed] [Green Version]
  11. Foxcroft, L.C.; Richardson, D.M.; Rejmánek, M.; Pyšek, P. Alien plant invasions in tropical and sub-tropical savannas: Patterns, processes and prospects. Biol. Invasions 2010, 12, 3913–3933. [Google Scholar] [CrossRef] [Green Version]
  12. Anderson, N.O.; Galatowitsch, S.M.; Gomez, N. Selection strategies to reduce invasive potential in introduced plants. Euphytica 2006, 148, 203–216. [Google Scholar] [CrossRef]
  13. Ustarroz, D.; Kruk, B.C.; Satorre, E.H.; Ghersa, C.M. Dormancy, germination and emergence of Urochloa panicoides regulated by temperature. Weed Res. 2016, 56, 59–68. [Google Scholar] [CrossRef]
  14. Malan, L. Biology and Germination Characteristics of Urochloa mosambicensis and Urochloa panicoides. Ph.D. Thesis, North-West University, Vanderbijlpark, South Africa, 2018. [Google Scholar]
  15. U.S. Department of Agriculture. Federal Noxious Weed List. Available online: https://www.aphis.usda.gov/plant_health/plant_pest_info/weeds/downloads/weedlist.pdf (accessed on 30 June 2022).
  16. Johnson, W.G.; Davis, V.M.; Kruger, G.R.; Weller, S.C. Influence of glyphosate-resistant cropping systems on weed species shifts and glyphosate-resistant weed populations. Eur J Agron 2009, 31, 162–172. [Google Scholar] [CrossRef]
  17. Riaz, T.; Javaid, A. Invasion of exotic weed Parthenium hysterophorus in district Sheikhupura, Pakistan. Int. J. Biol. Biotech. 2007, 4, 163–166. [Google Scholar]
  18. Villaseñor, J.L.J.; Espinosa-Garcia, F. The alien flowering plants of Mexico. Divers Distrib. 2004, 10, 113–123. [Google Scholar] [CrossRef]
  19. Souza, E.B.; Junior, G.A.D.; Pott, A. Soil seed bank in Pantanal riparian forest: Persistence, abundance, functional diversity and composition. Oecologia Aust. 2019, 23, 891–903. [Google Scholar] [CrossRef]
  20. CABI. Invasive Species Compendium. Urochloa panicoides (Liverseed Grass). Available online: https://www.cabi.org/isc/datasheet/55773 (accessed on 5 May 2022).
  21. GBIF.org. Global Biodiversity Information Facility. Urochloa panicoides P. Beauv. Available online: https://www.gbif.org/pt/species/2705869 (accessed on 5 May 2022).
  22. INDEX MUNDI. Available online: https://www.indexmundi.com/agriculture/?commodity=cotton&graph=production&display=map (accessed on 4 March 2022).
  23. Bogale, G.A.; Tolossa, T.T. Climate change intensification impacts and challenges of invasive species and adaptation measures in Eastern Ethiopia. Sustain. Environ. Res. 2021, 7, 1875555. [Google Scholar] [CrossRef]
  24. Van Kleunen, M.; Weber, E.; Fischer, M. A meta-analysis of trait differences between invasive and non-invasive plant species. Ecol. Lett. 2010, 13, 235–245. [Google Scholar] [CrossRef] [PubMed] [Green Version]
  25. Dukes, J.S.; Mooney, H.A. Does global change increase the success of biological invaders? Trends Ecol. Evol. 1999, 14, 135–139. [Google Scholar] [CrossRef]
  26. Westphal, M.I.; Browne, M.; MacKinnon, K.; Noble, I. The link between international trade and the global distribution of invasive alien species. Biol. Invasions 2008, 10, 391–398. [Google Scholar] [CrossRef]
  27. MacKenzie, D. Sick to death. New Sci. 2000, 167, 32–35. [Google Scholar]
  28. Sutherst, R.W. The vulnerability of animal and human health to parasites under global change. Int. J. Parasitol. 2001, 31, 933–948. [Google Scholar] [CrossRef]
  29. Sharma, G.P.; Esler, K.J.; Blignaut, J.N. Determining the relationship between invasive alien species density and a country’s socio-economic status. S. Afr. J. Sci. 2010, 106, 1–6. [Google Scholar] [CrossRef] [Green Version]
  30. Pyšek, P.; Richardson, D.M. Traits associated with invasiveness in alien plants: Where do we stand? Biol. Invasions 2008, 193, 97–125. [Google Scholar]
  31. Allen, J.M.; Bradley, B.A. Out of the weeds? Reduced plant invasion risk with climate change in the continental United States. Biol. Conserv. 2016, 203, 306–312. [Google Scholar] [CrossRef] [Green Version]
  32. Renteria, J.L.; Darin, G.M.S.; Grosholz, E.D. Assessing the risk of plant species invasion under different climate change scenarios in California. Invasive Plant Sci. Manag. 2021, 14, 172–182. [Google Scholar] [CrossRef]
  33. Pratt, C.J.; Denley, D.; Metaxas, A. Selection of predictor variables for species distribution models: A case study with an invasive marine bryozoan. Oecologia 2022, 198, 319–336. [Google Scholar] [CrossRef]
  34. Guisan, A.; Thuiller, W.; Zimmermann, N.E. Habitat Suitability and Distribution Models: With Applications in R; Cambridge University Press: Cambridge, UK, 2017. [Google Scholar]
  35. Da Silva, R.S.; Kumar, L.; Shabani, F.; Da Silva, E.M.; Da Silva Galdino, T.V.; Picanço, M.C. Spatio-temporal dynamic climate model for Neoleucinodes elegantalis using CLIMEX. Int. J. Biometeorol. 2017, 61, 785–795. [Google Scholar] [CrossRef]
  36. Kriticos, D.J.; Maywald, G.F.; Yonow, T.; Zurcher, E.J.; Herrmann, N.I.; Sutherst, R. Exploring the effects of climate on plants, animals and diseases. CLIMEX Version 2015, 4, 184. [Google Scholar]
  37. Jae-Min, J.; Sung-Hoon, J.; Byeon, D.H.; Wang-Hee, L. Invasion risk of the yellow crazy ant (Anoplolepis gracilipes) under the Representative Concentration Pathways 8.5 climate change scenario in South Korea. J Asia Pac Biodivers 2016, 10, 548–554. [Google Scholar]
  38. Ramos, R.S.; Kumar, L.; Shabani, F.; Da Silva, R.S.; De Araújo, T.A.; Picanço, M.C. Climate model for seasonal variation in Bemisia tabaci using CLIMEX in tomato crops. Int. J. Biometeorol. 2019, 63, 281–291. [Google Scholar] [CrossRef] [PubMed]
  39. Luna, I.M. Caracterización de la dinámica de emergencia de cuatro especies poáceas en el departamento Moreno (Santiago del Estero). Ph.D. Thesis, Universidad Católica de Córdoba, Córdoba, Argentina, 2018. [Google Scholar]
  40. Kriticos, D.J.; Webber, B.L.; Leriche, A.; Ota, N.; Macadam, I.; Bathols, J.; Scott, J.K. CliMond: Global high-resolution historical and future scenario climate surfaces for bioclimatic modelling. Methods Ecol. Evol. 2012, 3, 53–64. [Google Scholar] [CrossRef]
  41. Gordon, H.B.; Rotstayn, L.D.; McGregor, J.L.; Dix, M.R.; Kowalczyk, E.A.; O’Farrell, S.P.; Waterman, L.J.; Hirst, A.C.; Wilson, S.G.; Collier, M.A.; et al. The CSIRO Mk3 Climate System Model; CSIRO Atmospheric Research: Aspendale, VIC, Australia, 2002. [Google Scholar]
  42. Chiew, F.; Kirono, D.; Kent, D.; Vaze, J. Assessment of rainfall simulations from global climate models and implications for climate change impact on runoff studies. In Proceedings of the 18th World Imacs Congress and Modsim09 International Congress on Modelling and Simulation: Interfacing Modelling and Simulation with Mathematical and Computational Sciences, Cairns, Australia, 13–17 July 2009; pp. 3907–3913. [Google Scholar]
  43. Van Vuuren, D.P.; Carter, T.R. Climate and socio-economic scenarios for climate change research and assessment: Reconciling the new with the old. Clim. Change 2004, 122, 415–429. [Google Scholar] [CrossRef] [Green Version]
  44. Suppiah, R.; Hennessy, K.J.; Whetton, P.H.; McInnes, K.; Macadam, I.; Bathols, J.; Page, C.M. Australian climate change projections derived from simulations performed for the IPCC 4th Assessment Report. Aust. Meteorol. Mag. 2007, 56, 131–152. [Google Scholar]
  45. Shoko, C.; Mutanga, O.; Dube, T. Optimal season for discriminating C3 and C4 grass functional types using multi-date Sentinel 2 data. GISci Remote Sens. 2020, 57, 127–139. [Google Scholar] [CrossRef]
  46. Barroso, G.M.; Da Silva, R.S.; Mucida, D.P.; Borges, C.E.; Ferreira, S.R.; Dos Santos, J.C.B.; Dos Santos, J.B. Spatio-Temporal Distribution of Digitaria insularis: Risk Analysis of Areas with Potential for Selection of Glyphosate-Resistant Biotypes in Eucalyptus Crops in Brazil. Sustain. Sci. 2021, 13, 10405. [Google Scholar] [CrossRef]
  47. Jung, J.M.; Jung, S.; Byeon, D.H.; Lee, W.H. Model-based prediction of potential distribution of the invasive insect pest, spotted lanternfly Lycorma delicatula (Hemiptera: Fulgoridae), by using CLIMEX. J. Asia-Pac. Biodivers. 2017, 10, 532–538. [Google Scholar] [CrossRef]
  48. Pattison, R.R.; Mack, R.N. Potential distribution of the invasive tree Triadica sebifera (Euphorbiaceae) in the United States: Evaluating CLIMEX predictions with field trials. Global Change Biol. 2008, 14, 813–826. [Google Scholar] [CrossRef]
  49. Shabani, F.; Kumar, L.; Esmaeili, A. Future distributions of Fusarium oxysporum f. spp. in European, Middle Eastern and North African agricultural regions under climate change. Agric. Ecosyst. Environ. 2014, 197, 96–105. [Google Scholar] [CrossRef]
  50. Walker, S.; Wu, H.; Bell, K. Emergence and Seed Persistence of Echinochloa colona, Urochloa panicoides and Hibiscus trionum in the Sub-tropical Environment of North-Eastern Australia. Plant Prot. Q. 2010, 25, 127–132. [Google Scholar]
  51. Anwar, M.; Islam, A.K.M.; Yeasmin, S.; Rashid, M.; Juraimi, A.S.; Ahmed, S.; Shrestha, A. Weeds and Their Responses to Management Efforts in A Changing Climate. Agron J. 2021, 11, 1921. [Google Scholar] [CrossRef]
  52. Amare, T. Review on impact of climate change on weed and their management. AJBES. 2016, 2, 21–27. [Google Scholar] [CrossRef] [Green Version]
  53. Da Silva, R.S. Impactos do aquecimento global na distribuição espaço-temporal do tomateiro e do inseto praga Neoleucinodes elegantalis. Ph.D. Thesis, Universidade Federal de Viçosa, Viçosa, Brazil, 2016. [Google Scholar]
  54. Walker, S.R.; Taylor, I.N.; Milne, G.; Osten, V.A.; Hoque, Z.; Farquharson, R.J. A survey of management and economic impact of weeds in dryland cotton cropping systems of subtropical Australia. Aust J. Exp. Agric. 2005, 45, 79–91. [Google Scholar] [CrossRef] [Green Version]
  55. Chandrasena, N. How will weed management change under climate change? Some perspectives. J. Crop. Weed 2009, 5, 95–105. [Google Scholar]
  56. Singh, M.C.; Dubey, S.C.; Yaduraju, N.T. Climate change and its possible impacts on weeds. Int. J. Environ. Sci. Technol. 2016, 5, 1530–1539. [Google Scholar]
  57. Yin, X.; Struik, P.C. Applying modelling experiences from the past to shape crop systems biology: The need to converge crop physiology and functional genomics. New Phytol. 2008, 179, 629–642. [Google Scholar] [CrossRef]
  58. Adkins, S.W.; Wills, D.; Boersma, M.; Walker, S.R.; Robinson, G.; McLeod, R.J.; Einam, J.P. Weeds resistant to chlorsulfuron and atrazine from the north east grain region of Australia. Weed Res. 1997, 37, 343–349. [Google Scholar] [CrossRef]
  59. Peters, K.; Breitsameter, L.; Gerowitt, B. Impact of climate change on weeds in agriculture: A review. Agron. Sustain. Dev. 2014, 34, 707–721. [Google Scholar] [CrossRef] [Green Version]
  60. Flora do Brasil. Urochloa panicoides P.Beauv. Available online: http://reflora.jbrj.gov.br/reflora/listaBrasil/FichaPublicaTaxonUC/FichaPublicaTaxonUC.do?id=FB135135 (accessed on 1 November 2021).
  61. Varela, A.E.; Cabrera, D.C.; De La Veja, M.; De La Fuente, E.B. Dinámica de emergencia de plántulas y control de Urochloa panicoides P. Beauv resistente a glifosato en Tucumán (Argentina). Rev. Agron. Noroeste Argent. 2011, 41, 27–38. [Google Scholar]
  62. Dellafiore, C.M.; Brignone, E.; Scilingo, V. Rol Ecológico Del Zorro Pampeano (Lycalopex gymnocercus) Como Dispersor De Semillas En Ambientes De Agroecosistema Y Bosques Serranos De Argentina. Eur. J. Sci. 2020, 16, 223–233. [Google Scholar] [CrossRef]
  63. Olea, I.; Sabaté, S.; Vinciguerra, F.; Devani, L. Pautas para el manejo de malezas en cultivos extensivos en el Noroeste Argentino. Avanço Agroind. 2014, 35, 25–34. [Google Scholar]
  64. Edgar, E.; Shand, J.E. Checklist of Panicoid grasses naturalised in New Zealand; with a key to native and naturalised genera and species. N. Z. J. Bot. 1987, 25, 343–353. [Google Scholar] [CrossRef] [Green Version]
  65. Naples, N.E.R.; Oviedo, I.B.; Cruz, R.E. Diversidad florística de la Cordillera de Guaniguanico, Cuba/Floristic diversity of the Cordillera de Guaniguanico, Cuba. Acta Botánica Cubana 2018, 217, 1–32. [Google Scholar]
  66. Wipff, J.K.; Lonard, R.I.; Jones, S.D.; Hatch, S.L. The genus Urochloa (poaceae: Paniceae) in Texas, including one previously unreported species for the state. SIDA Contrib. Bot. 1993, 15, 405–413. [Google Scholar]
  67. Dávila, P.; Mejia-Saulés, M.; Soriano-Martínez, A.M.; Herrera-Arrieta, Y. Conocimiento taxonómico de la familia Poaceae en México. Bot. Sci. 2018, 96, 462–514. [Google Scholar] [CrossRef]
  68. Morrone, O.; Zuloaga, F.O. Sinopsis del género Urochloa (Poaceae: Panicoideae: Paniceae) para México y América Central. Darwiniana 1993, 32, 59–75. [Google Scholar]
  69. Rivera, L.M.M.; Ortiz-Arrona, C.I. Investigación y Gestión de los Recursos Naturales de la Cuenca del Rio Ayuquila-Armería, Jalisco; Universidad de Guadalajara: Guadalajara, México, 2020. [Google Scholar]
  70. Sánchez-Escalante, J.J.; Van Devender, T.R.; Reina-Guerrero, A.L. Preliminary Flora of the Sierra La Púrica, Sonora, Mexico. Available online: https://www.researchgate.net/profile/Jose-Sanchez-Escalante/publication/329761058_Preliminary_Flora_of_the_Sierra_La_Purica_Sonora_Mexico/links/5c197064a6fdccfc70586e81/Preliminary-Flora-of-the-Sierra-La-Purica-Sonora-Mexico.pdf (accessed on 30 June 2022).
  71. Arrieta, Y.H.; Ortiz, A.C. Diversidad y distribución de las gramíneas (poaceae) en el estado de Zacatecas. J. Bot. Res. Inst. Tex. 2009, 3, 775–792. [Google Scholar]
  72. Steinmann, V.W. Flora y Vegetación de la Reserva de la Biosfera Zicuirán-Infiernillo, Michoacán, México. Bot. Sci. 2021, 99, 661–707. [Google Scholar] [CrossRef]
  73. Nigatu, L.; Hassen, A.; Sharma, J.; Adkins, S.W. Impact of Parthenium hysterophorus on grazing land communities in north-eastern Ethiopia. Weed Biol. Manag. 2010, 10, 143–152. [Google Scholar] [CrossRef]
  74. Ahmad, Z.; Khan, S.M.; Ali, S.; Rahman, I.U.; Ara, H.; Noreen, I.; Khan, A. Indicator species analyses of weed communities of maize crop in district Mardan, Pakistan. Pak. J. Weed Sci. Res. 2016, 22, 227–238. [Google Scholar]
  75. Ernst, W.H.O.; Veenendaal, E.M.; Kebakile, M.M. Possibilities for dispersal in annual and perennial grasses in a savanna in Botswana. Vegetatio 1992, 102, 1–11. [Google Scholar] [CrossRef]
  76. Sintayehu, A. Weed flora survey in field crops of Northwestern Ethiopia. Afri. J. Agric. Res. 2019, 14, 749–758. [Google Scholar] [CrossRef]
  77. Sadasivaiah, B.; Priyadarshini, P.; Rao, B.R.P. Three rare grasses (Eragrostis ciliaris var. clarkei, E. tenella var. insularis and Urochloa panicoides var. velutina) from Andhra Pradesh, India. J. Sci. Trans. Eviron. Technov. 2013, 6, 166–167. [Google Scholar]
  78. Kiran, M.; Rahees, N.; Vishal, V.; Vidyasagaran, K. Floristic diversity and structural dynamics of mangroves in the north west coast of kerala, India. J. Plant Dev. 2015, 7, 549–553. [Google Scholar]
  79. Kabir, M.E.; Webb, E.L. Community in Conservation: A Case from a Deciduous Forest under Community Management in Northeast Thailand. In Proceedings of the FORTROP II: Tropical Forestry Change in a Changing World, Bangkok, Thailand, 17–20 November 2008. [Google Scholar]
  80. Rahman, I.U.; Afzal, A.; Iqbal, Z.; Ijaz, F.; Ali, N.; Asif, M.; Alam, J.; Majid, A.; Hart, R.; Bussmann, R.W. First insights into the floristic diversity, biological spectra and phenology of Manoor Valley, Pakistan. Pak. J. Bot. 2018, 50, 1113–1124. [Google Scholar]
  81. Labrada, R. Revisión de la lista de malezas cuarentenarias de Ecuador. Technique 2015, 15, 58–68. [Google Scholar] [CrossRef]
  82. Hemp, A. Ecology of the pteridophytes on the southern slopes of Mt. Kilimanjaro. Part II: Habitat selection. Plant Biol. 2001, 3, 493–523. [Google Scholar] [CrossRef]
  83. Dangerfield, J.M.; Veenendaal, E.M.; Riddoch, B.J.; Black, H. Termites and land use in south-east Botswana: Variety and abundance of termite surface features. Botsw. Notes Rec. 1992, 24, 165–179. [Google Scholar]
  84. Kumar, K.K.; Babu, P.K. Diversity of Weed Flora in Citrus at ICAR-Regional Research Centre for Citrus, Biswanath Chariali, Assam, India. Int. J. Curr. Microbiol. App. Sci. 2019, 8, 2100–2107. [Google Scholar] [CrossRef]
  85. Velayudham, L.; Jeyaprakash, K.; Balachandran, N.; Rajantheran, M. Lindernia micrantha D. Don (Linderniaceae): A red listed plant species new discovery to Tamil Nadu, India. Plant Arch. 2020, 20, 1404–1408. [Google Scholar]
Figure 1. Temperature as a function of population growth. Parameters used to define suitable temperature ranges for U. panicoides population growth. DV0: limiting low temperature, DV1: lower optimal temperature, DV2: upper optimal temperature, and DV3: limiting high temperature.
Plants 11 01761 g001
Figure 2. (a) Global distribution of Urochloa panicoides and (b) Ecoclimatic Index (EI) of U. panicoides, modeled using CLIMEX. Unsuitable areas in white (EI = 0), low-suitability areas in light red (0 < EI < 30), and high-suitability areas in red (30 < EI < 100).
Plants 11 01761 g002
Figure 3. Current distribution of Urochloa panicoides in a validation region based on the Ecoclimatic Index (EI). Unsuitable areas in white (EI = 0), low-suitability areas in light red (0 < EI < 30), and high-suitability areas in red (30 < EI < 100).
Plants 11 01761 g003
Figure 4. Changes in unsuitable areas (EI = 0) (a), low-suitability areas (0 < EI < 30) (b), and high-suitability areas (30 < EI < 100) (c), in %, for U. panicoides, in sensitivity analysis using CLIMEX, based on parameters of greater sensitivity for the Ecoclimatic Index (EI). The values for the parameters used are shown in Table 1.
Plants 11 01761 g004
Figure 5. Current (a) and projected Ecoclimatic Index (EI) using CLIMEX under CSIRO SRES A2 scenario for the years 2050 (b), 2080 (c) and, 2100 (d), for U. panicoides. Unsuitable areas in white (EI = 0), low-suitability areas in light red (0 < EI < 30), and high-suitability areas in red (30 < EI < 100).
Plants 11 01761 g005
Figure 6. Current and projected Ecoclimatic Index (EI) (a,b,e,f) and cold stress patterns (c,d,g,h) using CLIMEX under CSIRO SRES A2 scenario for U. panicoides for China and Europe. Unsuitable areas in white (EI = 0), low-suitability areas in light red (0 < EI < 30), and high-suitability areas in red (30 < EI < 100).
Plants 11 01761 g006
Table 1. Adjusted parameter values for modeling Urochloa panicoides. Proposed low and high values for the software included in the sensitivity analysis, using CLIMEX.
ParameterCodeUnitLow ValuesAdjusted Parameter ValuesHigh ValuesReferences
Limiting low temperatureDV0°C345Ustarroz, 2011; Ustarroz et al., 2015
Lower optimal temperatureDV1°C242526
Upper optimal temperatureDV2°C343536
Limiting high temperatureDV3°C444546
Limiting low moistureSM0--0.090.10.11----
Lower optimal moistureSM1--0.180.20.22
Upper optimal moistureSM2--7.288.8
Limiting high moistureSM3--91011
Cold stress temperature thresholdTTCS°C345Ustarroz, 2011; Ustarroz et al., 2015
Cold stress temperature rateTHCSweek−1−0.0018−0.002−0.0022
Heat stress temperature thresholdTTHS°C444546
Heat stress temperature rateTHHSweek−10.0180.020.022
Dry stress thresholdSMDS--0.090.10.11----
Dry stress rateHDSweek−1−0.009−0.01−0.011
Degree-daysPPD°C days149715171537Luna, 2018
Publisher’s Note: MDPI stays neutral with regard to jurisdictional claims in published maps and institutional affiliations.

