
Genome-Wide Association Study of Six Forage Traits in Ramie (Boehmeria nivea L. Gaud)

 and
and
Abstract
:1. Introduction
2. Results
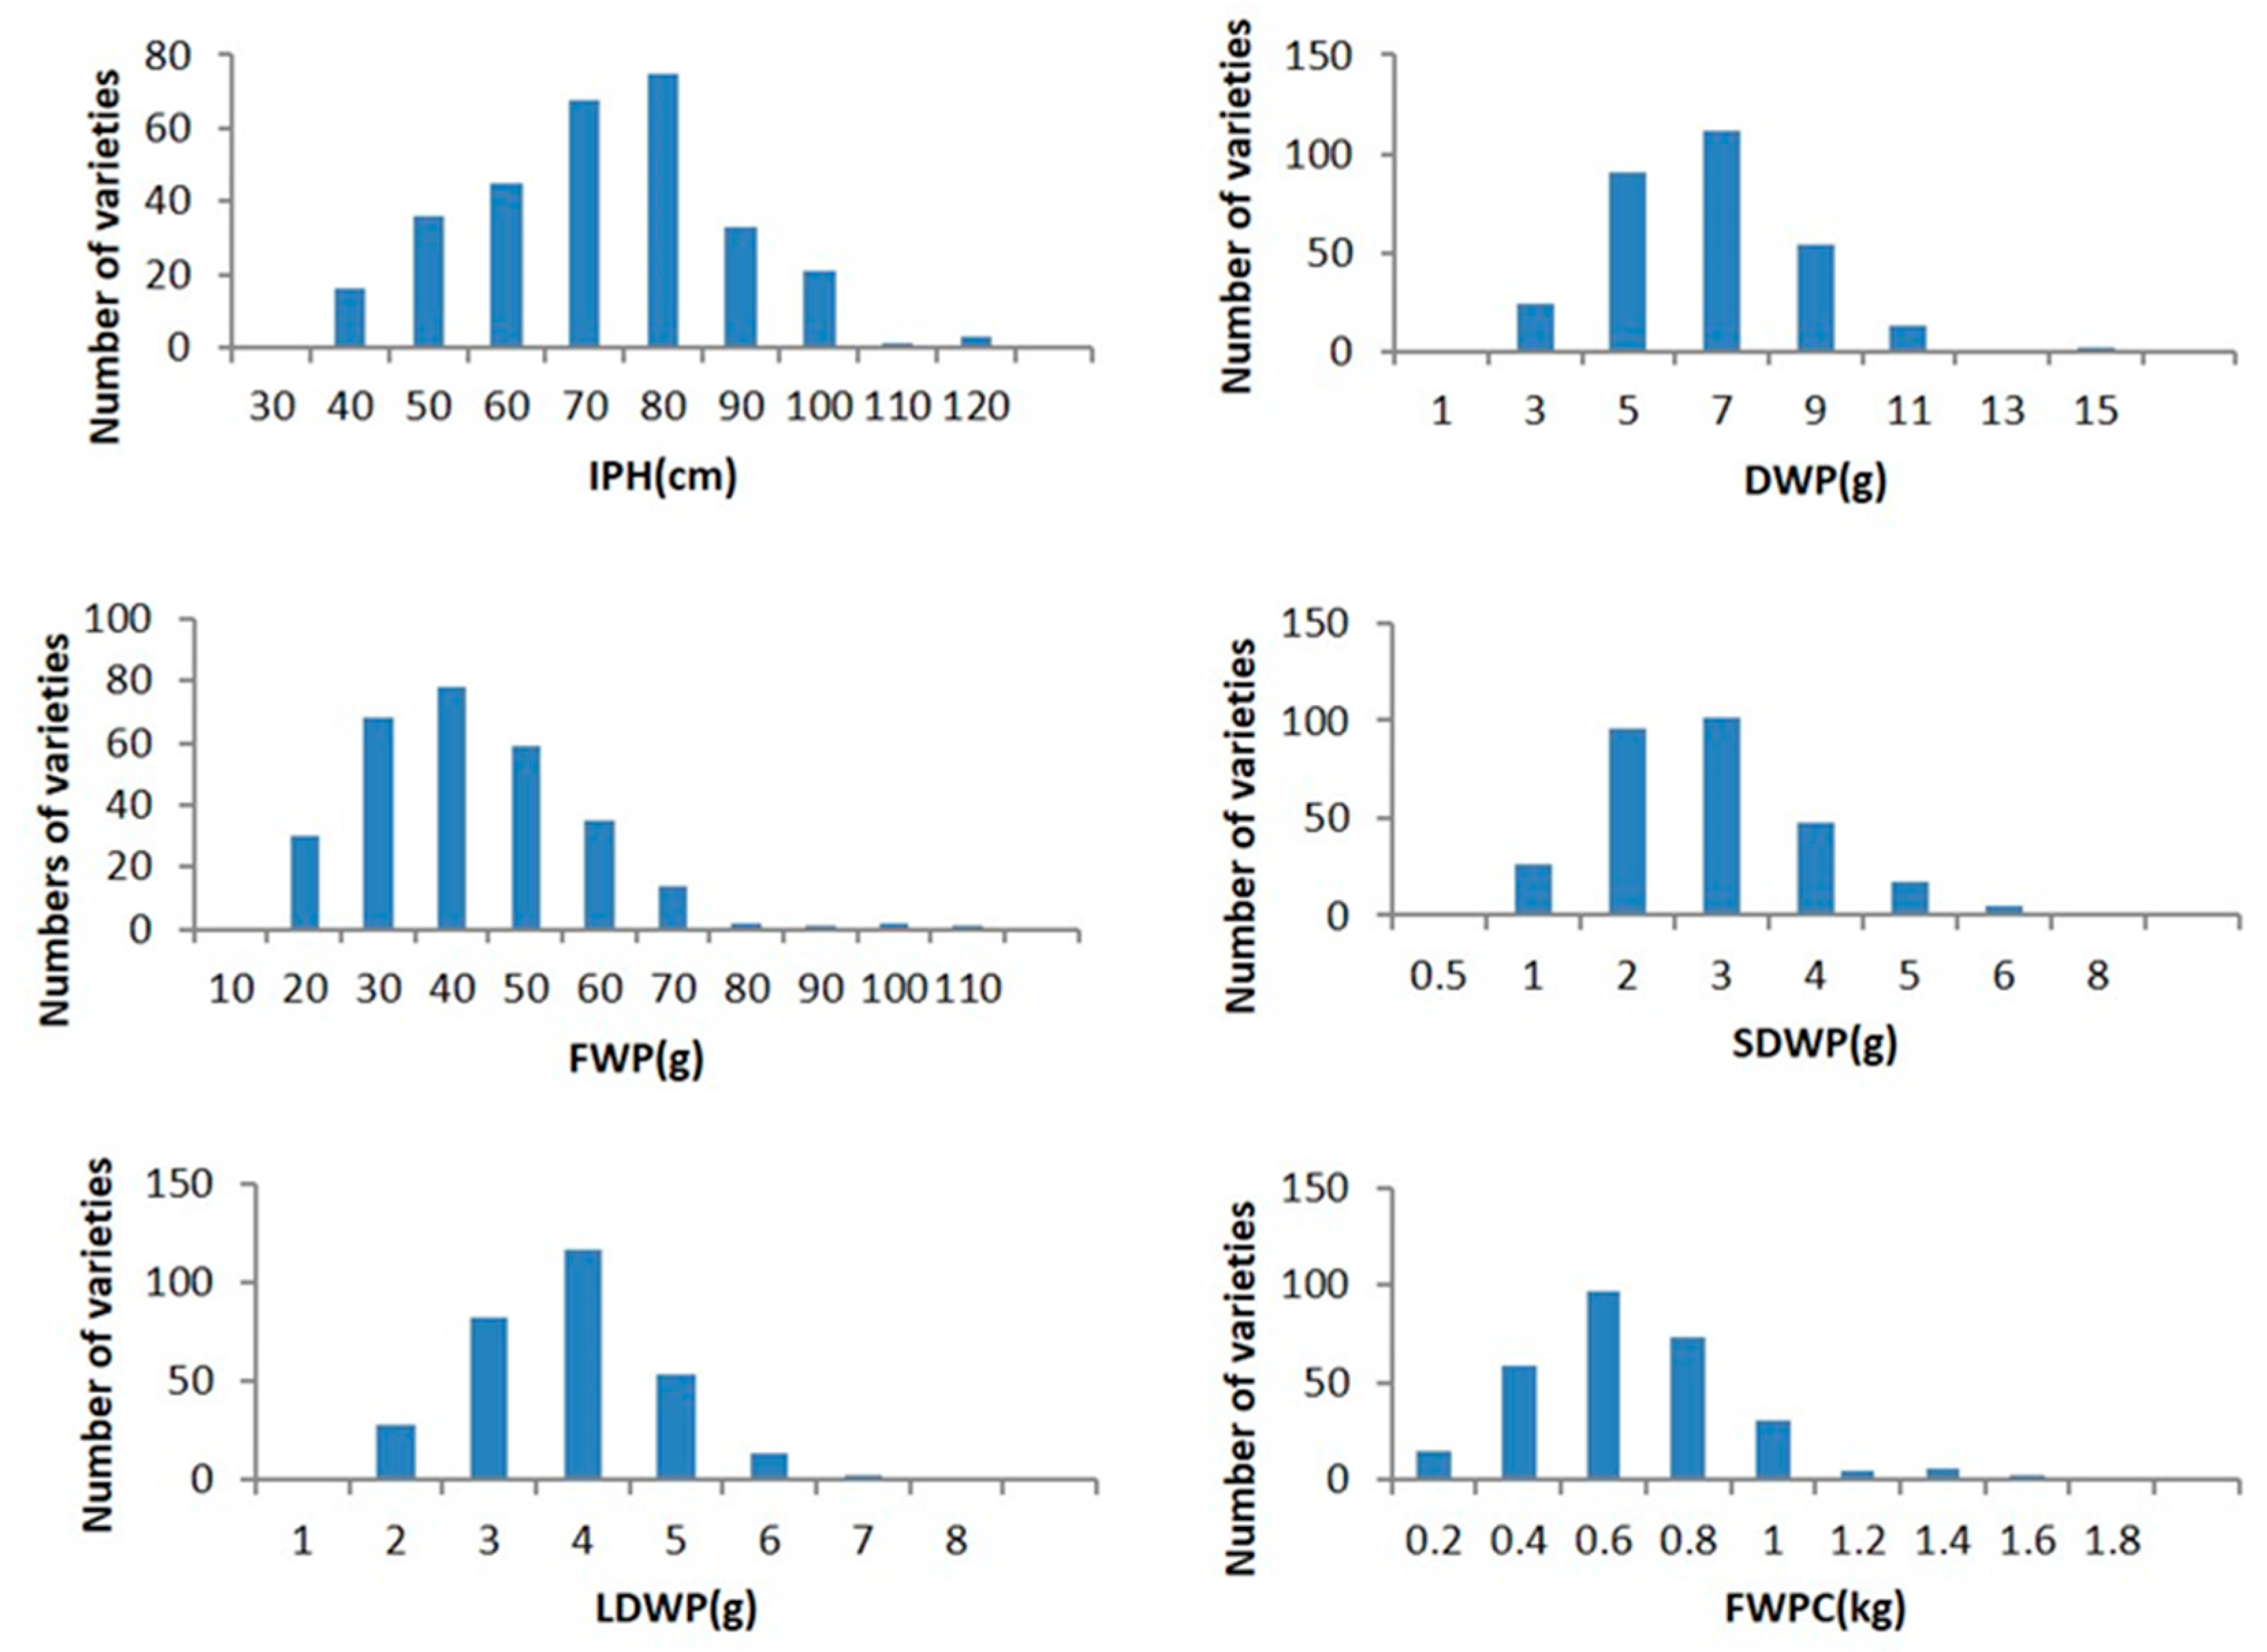
2.1. Phenotypic Trait Analysis
2.2. GWAS Analysis for Traits RELATED to Forage
2.3. Identification of Candidate Genes
3. Discussion
3.1. Analyzing the Characteristics of Ramie and Related Indexes of Feeding Characters
3.2. Application of GWAS in Forage Ramie
3.3. Putative Candidate Genes Associated with Forage Quality
4. Materials and Methods
4.1. Plant Materials
4.2. Phenotype Evaluation
4.3. Statistical Analyses
4.4. Population Structure and LD Analysis
4.5. GWAS Analysis
4.6. Prediction of Candidate Genes
Supplementary Materials
Author Contributions
Funding
Institutional Review Board Statement
Informed Consent Statement
Data Availability Statement
Conflicts of Interest
References
- Liao, L.; Li, T.; Zhang, J.; Xu, L.; Deng, H.; Han, X. The domestication and dispersal of the cultivated ramie (Boehmeria nivea (L.) Gaud. in Freyc.) determined by nuclear SSR marker analysis. Genet. Resour. Crop Evol. 2014, 61, 55–67. [Google Scholar] [CrossRef]
- Mu, L.; Cai, M.; Wang, Z.; Liu, J.; Liu, T.; Wanapat, M.; Huang, B. Assessment of ramie leaf (Boehmeria nivea L. gaud) as an animal feed supplement in PR China. Trop. Anim. Health Prod. 2020, 52, 115–121. [Google Scholar] [CrossRef] [PubMed]
- Nonhebel, S.; Kastner, T. Changing demand for food, livestock feed and biofuels in the past and in the near future. Livest. Sci. 2011, 139, 3–10. [Google Scholar] [CrossRef]
- Kipriotis, E.; Heping, X.; Vafeiadakis, T.; Kiprioti, M.; Alexopoulou, D.E. Ramie and kenaf as feed crops. Ind. Crop. Prod. 2015, 68, 126–130. [Google Scholar] [CrossRef]
- Kuntjoro, A.; Sutarno, S.; Astirin, O.P. Body weight and statistic vital of Texel sheep in Wonosobo District by giving the ramie hay as an additional woof. Nusant. Biosci. 2009, 1, 23–30. [Google Scholar] [CrossRef]
- De Toledo, G.; da Silva, L.; de Quadros, A.; Retore, M.; Araújo, I.; Brum, H.; Ferreira, P.; Melchior, R. Productive performance of rabbits fed with diets containing ramie (Boehmeria nivea) hay in substitution to alfalfa (Medicago sativa) hay. In Proceedings of the 9th World Rabbit Congress, Verona, Italy, 10–13 June 2008; pp. 827–830. [Google Scholar]
- López, O.; Montejo, I.; Lamela, L. Evaluation of the nutritional potential of four forage plants for feeding rabbit does. Pastos Y Forrajes 2012, 35, 293–300. [Google Scholar]
- Liu, L.J.; Chen, H.Q.; Dai, X.B.; Hui, W.; Peng, D.X. Effect of planting density and fertilizer application on fiber yield of ramie (Boehmeria nivea). J. Integr. Agric. 2012, 11, 1199–1206. [Google Scholar] [CrossRef]
- Wu, D.Q.; Wang, H.W.; Hou, Z.P.; Zhang, X.; Dai, Q.Z. Study of nutrient components and amino acid formation in several southern Chinese unconventional roughage sources. Pratacul. Sci. 2017, 34, 1332–1336. [Google Scholar] [CrossRef]
- Tang, S.; He, Y.; Zhang, P.; Jiao, J.; Han, X.; Yan, Q.; Tan, Z.; Wang, H.; Wu, D.; Yu, L. Nutrient digestion, rumen fermentation and performance as ramie (Boehmeria nivea) is increased in the diets of goats. Anim. Feed Sci. Technol. 2019, 247, 15–22. [Google Scholar] [CrossRef]
- Yang, C.; Zhang, F.; Jiang, X.; Yang, X.; He, F.; Wang, Z.; Long, R.; Chen, L.; Yang, T.; Wang, C. Identification of genetic loci associated with crude protein content and fiber composition in alfalfa (medicago sativa L.) using QTL mapping. Front. Plant Sci. 2021, 12, 210. [Google Scholar] [CrossRef]
- Scheben, A.; Batley, J.; Edwards, D. Genotyping-by-sequencing approaches to characterize crop genomes: Choosing the right tool for the right application. Plant Biotechnol. J. 2017, 15, 149–161. [Google Scholar] [CrossRef] [PubMed] [Green Version]
- Huang, X.; Sang, T.; Zhao, Q.; Feng, Q.; Zhao, Y.; Li, C.; Zhu, C.; Lu, T.; Zhang, Z.; Li, M. Genome-wide association studies of 14 agronomic traits in rice landraces. Nat. Genet. 2010, 42, 961–967. [Google Scholar] [CrossRef] [PubMed]
- Zhao, K.; Tung, C.W.; Eizenga, G.C.; Wright, M.H.; Ali, M.L.; Price, A.H.; Norton, G.J.; Islam, M.R.; Reynolds, A.; Mezey, J. Genome-wide association mapping reveals a rich genetic architecture of complex traits in Oryza sativa. Nat. Commun. 2011, 2, 467. [Google Scholar] [CrossRef] [PubMed]
- Wang, C.; Yang, Y.; Yuan, X.; Xu, Q.; Feng, Y.; Yu, H.; Wang, Y. Genome-wide association study of blast resistance in indica rice. BMC Plant Biol. 2014, 14, 311. [Google Scholar] [CrossRef] [PubMed] [Green Version]
- Lu, Q.; Wang, C.; Niu, X.; Zhang, M.; Xu, Q.; Feng, Y.; Yang, Y.; Wang, S.; Yuan, X.; Yu, H. Detecting novel loci underlying rice blast resistance by integrating a genome-wide association study and RNA sequencing. Mol. Breed. 2019, 39, 81. [Google Scholar] [CrossRef] [Green Version]
- Si, L.; Chen, J.; Huang, X.; Gong, H.; Luo, J.; Hou, Q.; Zhou, T.; Lu, T.; Zhu, J.; Shangguan, Y. OsSPL13 controls grain size in cultivated rice. Nat Genet. 2016, 48, 447–456. [Google Scholar] [CrossRef]
- Yano, K.; Yamamoto, E.; Aya, K.; Takeuchi, H.; Lo, P.C.; Hu, L.; Yamasaki, M.; Yoshida, S.; Kitano, H.; Hirano, K. Genome-wide association study using whole-genome sequencing rapidly identifies new genes influencing agronomic traits in rice. Nat. Genet. 2016, 48, 927–934. [Google Scholar] [CrossRef]
- Li, T.; Ma, X.; Li, N.; Zhou, L.; Liu, Z.; Han, H.; Gui, Y.; Bao, Y.; Chen, J.; Dai, X. Genome-wide association study discovered candidate genes of Verticillium wilt resistance in upland cotton (Gossypium hirsutum L.). Plant Biotechnol. J. 2017, 15, 1520–1532. [Google Scholar] [CrossRef] [Green Version]
- Li, K.; Wang, H.; Hu, X.; Liu, Z.; Wu, Y.; Huang, C. Genome-wide association study reveals the genetic basis of stalk cell wall components in maize. PLoS ONE 2016, 11, e0158906. [Google Scholar] [CrossRef] [Green Version]
- Chao, D.Y.; Chen, Y.; Chen, J.; Shi, S.; Chen, Z.; Wang, C.; Danku, J.M.; Zhao, F.J.; Salt, D.E. Genome-wide association mapping identifies a new arsenate reductase enzyme critical for limiting arsenic accumulation in plants. PLoS Biol. 2014, 12, e1002009. [Google Scholar] [CrossRef] [Green Version]
- Chen, K.; Luan, M.; Xiong, H.; Chen, P.; Chen, J.; Gao, G.; Huang, K.; Zhu, A.; Yu, C. Genome-wide association study discovered favorable single nucleotide polymorphisms and candidate genes associated with ramet number in ramie (Boehmeria nivea L.). BMC Plant Biol. 2018, 18, 345. [Google Scholar] [CrossRef] [PubMed] [Green Version]
- Korte, A.; Farlow, A. The advantages and limitations of trait analysis with GWAS: A review. Plant Methods 2013, 9, 29. [Google Scholar] [CrossRef] [PubMed] [Green Version]
- Zeng, Z.; Zhu, S.; Wang, Y.; Bai, X.; Liu, C.; Chen, J.; Zhang, T.; Wei, Y.; Li, F.; Bao, Z.; et al. Resequencing of 301 ramie accessions identifies genetic loci and breeding selection for fibre yield traits. Plant Biotechnol. J. 2022, 20, 323–334. [Google Scholar] [CrossRef] [PubMed]
- Anantharaman, V.; Aravind, L. MOSC domains: Ancient, predicted sulfur-carrier domains, present in diverse metal–sulfur cluster biosynthesis proteins including Molybdenum cofactor sulfurases. FEMS Microbiol. Lett. 2002, 207, 55–61. [Google Scholar] [CrossRef]
- Filiz, E.; Distelfeld, A.; Fahima, T.; Metin, Ö.K.; Nevo, E.; Weining, S.; Uncuoğlu, A.A. Barley molybdenum cofactor sulfurase (MCSU): Sequencing, modeling, and its comparison to other higher plants. Turk. J. Agric. For. 2015, 39, 786–796. [Google Scholar] [CrossRef]
- Aguilar-Martínez, J.A.; Poza-Carrión, C.; Cubas, P. Arabidopsis BRANCHED1 acts as an integrator of branching signals within axillary buds. Plant Cell 2007, 19, 458–472. [Google Scholar] [CrossRef]
- Kieffer, M.; Master, V.; Waites, R.; Davies, B. TCP14 and TCP15 affect internode length and leaf shape in Arabidopsis. Plant J. 2011, 68, 147–158. [Google Scholar] [CrossRef] [Green Version]
- Duan, A.Q.; Wang, Y.W.; Feng, K.; Liu, J.X.; Xu, Z.S.; Xiong, A.S. TCP family genes control leaf development and its responses to gibberellin in celery. Acta Physiol. Plant. 2019, 41, 153. [Google Scholar] [CrossRef]
- Lechner, E.; Achard, P.; Vansiri, A.; Potuschak, T.; Genschik, P. F-box proteins everywhere. Curr. Opin. Plant Biol. 2006, 9, 631–638. [Google Scholar] [CrossRef]
- Jia, Q.; Xiao, Z.-X.; Wong, F.-L.; Sun, S.; Liang, K.-J.; Lam, H.-M. Genome-wide analyses of the soybean F-box gene family in response to salt stress. Int. J. Mol. Sci. 2017, 18, 818. [Google Scholar] [CrossRef] [Green Version]
- Kipreoet, S.E.T.; Pagano, M. The F-box protein family, 2000. Genome Biol. 2000, 1, 1–7. [Google Scholar] [CrossRef] [Green Version]
- Sun, L.; Hao, X.; Fan, X.; Gang, L.; Zhou, D. Effects of different nitrogen fertilizers on soil copper bioavailability in a contaminated red soil. Acta Pedol. Sin. 2009, 46, 1033–1039. [Google Scholar]
- Machin, D.H. Ramie as an animal feed: A review. Trop. Sci. 1997, 19, 187–195. [Google Scholar]
- Squibb, R.L.; Guzmán, M.; Scrimshaw, N.S. Dehydrated desmodium, kikuyu grass, ramie, and banana leaf forages as supplements of protein, riboflavin, and carotenoids in chick rations. Poult. Sci. 1953, 32, 1078–1083. [Google Scholar] [CrossRef]
- Lucero, L.E.; Uberti-Manassero, N.G.; Arce, A.L.; Colombatti, F.; Alemano, S.G.; Gonzalez, D.H. TCP15 modulates cytokinin and auxin responses during gynoecium development in Arabidopsis. Plant J. 2015, 84, 267–282. [Google Scholar] [CrossRef]
- Resentini, F.; Felipo-Benavent, A.; Colombo, L.; Blázquez, M.A.; Alabadí, D.; Masiero, S. TCP14 and TCP15 mediate the promotion of seed germination by gibberellins in Arabidopsis thaliana. Mol. Plant 2015, 8, 482–485. [Google Scholar] [CrossRef] [Green Version]
- Davière, J.-M.; Wild, M.; Regnault, T.; Baumberger, N.; Eisler, H.; Genschik, P.; Achard, P. Class I TCP-DELLA interactions in inflorescence shoot apex determine plant height. Curr. Biol. 2014, 24, 1923–1928. [Google Scholar] [CrossRef] [Green Version]
- Challa, K.R.; Rath, M.; Nath, U. The CIN-TCP transcription factors promote commitment to differentiation in Arabidopsis leaf pavement cells via both auxin-dependent and independent pathways. PLoS Genet. 2019, 15, e1007988. [Google Scholar] [CrossRef] [Green Version]
- He, Z.; Zhou, X.; Chen, J.; Yin, L.; Zeng, Z.; Xiang, J.; Liu, S. Identification of a consensus DNA-binding site for the TCP domain transcription factor TCP2 and its important roles in the growth and development of Arabidopsis. Mol. Biol. Rep. 2021, 48, 2223–2233. [Google Scholar] [CrossRef]
- Martín-Trillo, M.; Cubas, P. TCP genes: A family snapshot ten years later. Trends Plant Sci. 2010, 15, 31–39. [Google Scholar] [CrossRef]
- Hepworth, S.R.; Klenz, J.E.; Haughn, G.W. UFO in the Arabidopsis inflorescence apex is required for floral-meristem identity and bract suppression. Planta 2006, 223, 769–778. [Google Scholar] [CrossRef] [PubMed]
- Li, Y.; Jia, F.; Yu, Y.; Luo, L.; Huang, J.; Yang, G.; Wu, C.; Zheng, C. The SCF E3 ligase AtPP2-B11 plays a negative role in response to drought stress in Arabidopsis. Plant Mol. Biol. Rep. 2014, 32, 943–956. [Google Scholar] [CrossRef]
- Stefanowicz, K.; Lannoo, N.; Zhao, Y.; Eggermont, L.; Van Hove, J.; Al Atalah, B.; Van Damme, E.J. Glycan-binding F-box protein from Arabidopsis thaliana protects plants from Pseudomonas syringae infection. BMC Plant Biol. 2016, 16, 213. [Google Scholar] [CrossRef] [PubMed] [Green Version]
- Baute, J.; Polyn, S.; De Block, J.; Blomme, J.; Van Lijsebettens, M.; Inzé, D. F-box protein FBX92 affects leaf size in Arabidopsis thaliana. Plant Cell Physiol. 2017, 58, 962–975. [Google Scholar] [CrossRef] [Green Version]
- Purcell, S.; Neale, B.; Todd-Brown, K.; Thomas, L.; Ferreira, M.A.R.; Bender, D.; Maller, J.; Sklar, P.; de Bakker, P.I.W.; Daly, M.J.; et al. PLINK: A tool set for whole-genome association and population-based linkage analyses. Am. J. Hum. Genet. 2007, 81, 559–575. [Google Scholar] [CrossRef] [Green Version]
- Alexander, D.H.; Novembre, J.; Lange, K. Fast model-based estimation of ancestry in unrelated individuals. Genome Res. 2009, 19, 1655–1664. [Google Scholar] [CrossRef] [Green Version]
- Behr, A.A.; Liu, K.Z.; Liu, F.G.; Nakka, P.; Ramachandran, S. pong: Fast analysis and visualization of latent clusters in population genetic data. Bioinformatics 2016, 32, 2817–2823. [Google Scholar] [CrossRef] [Green Version]
- Price, A.; Patterson, N.; Plenge, R.; Weinblatt, M.; Shadick, N.; Reich, D. Principal components analysis corrects for stratification in genomewide association studies. Nat. Genet. 2006, 38, 904–909. [Google Scholar] [CrossRef]
- Zhang, C.; Dong, S.S.; Xu, J.Y.; He, W.M.; Yang, T.L. PopLDdecay: A fast and effective tool for linkage disequilibrium decay analysis based on variant call format files. Bioinformatics 2019, 35, 1786–1788. [Google Scholar] [CrossRef]
- Li, H.; Durbin, R. Fast and accurate long-read alignment with Burrows–Wheeler transform. Bioinformatics 2010, 26, 589–595. [Google Scholar] [CrossRef] [Green Version]
- Li, H.; Handsaker, B.; Wysoker, A.; Fennell, T.; Ruan, J.; Homer, N.; Marth, G.; Abecasis, G.; Durbin, R. The sequence alignment/map format and SAMtools. Bioinformatics 2009, 25, 2078–2079. [Google Scholar] [CrossRef] [Green Version]
- McKenna, A.; Hanna, M.; Banks, E.; Sivachenko, A.; Cibulskis, K.; Kernytsky, A.; Garimella, K.; Altshuler, D.; Gabriel, S.; Daly, M. The Genome Analysis Toolkit: A MapReduce framework for analyzing next-generation DNA sequencing data. Genome Res. 2010, 20, 1297–1303. [Google Scholar] [CrossRef] [PubMed] [Green Version]
- Kang, H.; Wang, Y.; Peng, S.; Zhang, Y.; Xiao, Y.; Wang, D.; Qu, S.; Li, Z.; Yan, S.; Wang, Z. Dissection of the genetic architecture of rice resistance to the blast fungus Magnaporthe oryzae. Mol. Plant Pathol. 2016, 17, 959–972. [Google Scholar] [CrossRef] [PubMed] [Green Version]
- Zhou, X.; Stephens, M. Genome-wide efficient mixed-model analysis for association studies. Nat. Genet. 2012, 44, 821–824. [Google Scholar] [CrossRef] [PubMed] [Green Version]
- Li, M.X.; Yeung, J.M.; Cherny, S.S.; Sham, P.C. Evaluating the effective numbers of independent tests and significant p-value thresholds in commercial genotyping arrays and public imputation reference datasets. Hum. Genet. 2012, 131, 747–756. [Google Scholar] [CrossRef] [Green Version]
- Luan, M.B.; Jian, J.B.; Chen, P.; Chen, J.H.; Chen, J.H.; Gao, Q.; Gao, G.; Zhou, J.H.; Chen, K.M.; Guang, X.M. Draft genome sequence of ramie, Boehmeria nivea (L.) Gaudich. Mol. Ecol. Resour. 2018, 18, 639–645. [Google Scholar] [CrossRef] [PubMed]


| Traits | Years | Mean | STDEV | Skewness | Kurtosis | CV |
|---|---|---|---|---|---|---|
| IPH | 2019 | 80.41041 | 14.45221 | 0.08226 | −0.09009 | 0.1797 |
| 2020 | 66.93907 | 16.22265 | 0.0334 | −0.27588 | 0.2426 | |
| FWP | 2019 | 58.87703 | 18.55376 | 0.167087 | −0.44334 | 0.3151 |
| 2020 | 36.75665 | 15.74601 | 0.577069 | 1.410746 | 0.4284 | |
| DWP | 2019 | 8.035631 | 2.276232 | 0.011917 | −0.10541 | 0.2833 |
| 2020 | 5.683078 | 2.034604 | 0.670854 | 0.957744 | 0.3580 | |
| LDWP | 2019 | 4.494491 | 1.159356 | −0.70925 | 1.836823 | 0.2580 |
| 2020 | 3.321628 | 1.009748 | 0.453133 | 0.563682 | 0.3040 | |
| SDWP | 2019 | 3.510219 | 1.171264 | 0.238948 | −0.33708 | 0.3337 |
| 2020 | 2.36334 | 1.121519 | 1.085063 | 2.395851 | 0.4745 | |
| FWPC | 2019 | 0.69955 | 0.398916 | 2.058627 | 6.861975 | 0.5702 |
| 2020 | 0.577711 | 0.263481 | 1.026716 | 2.199923 | 0.4561 |
| 2019 | IPH | FWP | DWP | LDWP | SDWP | FWPC |
|---|---|---|---|---|---|---|
| IPH | ||||||
| FWP | 0.794 ** | |||||
| DWP | 0.796 ** | 0.840 * | ||||
| LDWP | 0.633 ** | 0.748 ** | 0.933 ** | |||
| SDWP | 0.877 ** | 0.891 ** | 0.926 ** | 0.757 ** | ||
| FWPC | 0.701 ** | 0.589 ** | 0.557 ** | 0.416 ** | 0.645 ** |
| 2020 | IPH | FWP | DWP | LDWP | SDWP | FWPC |
|---|---|---|---|---|---|---|
| IPH | ||||||
| FWP | 0.825 ** | |||||
| DWP | 0.850 ** | 0.915 ** | ||||
| LDWP | 0.720 ** | 0.837 ** | 0.949 ** | |||
| SDWP | 0.894 ** | 0.908 ** | 0.959 ** | 0.820 ** | ||
| FWPC | 0.704 ** | 0.826 ** | 0.795 ** | 0.711 ** | 0.803 ** |
| Chr. | SNPs | Intergenic | CDS | Intron | NS SNPs | S SNPs |
|---|---|---|---|---|---|---|
| Chr1 | 532,773 | 219,654 | 44,626 | 97,484 | 20,658 | 23,968 |
| Chr2 | 481,607 | 191,354 | 43,443 | 93,941 | 20,173 | 23,270 |
| Chr3 | 462,186 | 186,239 | 42,467 | 96,791 | 20,737 | 21,730 |
| Chr4 | 493,655 | 203,277 | 43,274 | 94,759 | 20,664 | 22,610 |
| Chr5 | 456,788 | 185,700 | 43,097 | 87,148 | 20,447 | 22,650 |
| Chr6 | 447,197 | 150,528 | 44,799 | 88,657 | 20,438 | 24,361 |
| Chr7 | 454,335 | 227,789 | 33,706 | 68,160 | 15,682 | 18,024 |
| Chr8 | 391,132 | 178,009 | 31,695 | 65,775 | 14,691 | 17,004 |
| Chr9 | 440,598 | 209,133 | 32,741 | 78,206 | 15,541 | 17,200 |
| Chr10 | 348,653 | 130,303 | 36,950 | 68,202 | 17,607 | 19,343 |
| Chr11 | 418,597 | 196,178 | 32,787 | 77,175 | 15,233 | 17,554 |
| Chr12 | 337,679 | 141,539 | 29,983 | 72,029 | 14,708 | 15,275 |
| Chr13 | 359,036 | 152,503 | 35,334 | 73,229 | 16,874 | 18,460 |
| Chr14 | 288,534 | 133,000 | 23,759 | 48,307 | 10,490 | 13,269 |
| Scaffold | 39,056 | 10,782 | 4196 | 6718 | 2008 | 2188 |
| Total | 5,951,826 | 2,515,988 | 522,857 | 1,116,581 | 245,951 | 276,906 |
| Chromosome Number | Gene | Associated Signal | Signal Position in Gene | Annotation | ||
|---|---|---|---|---|---|---|
| Trait | SNP Position | −log 10 p Values | ||||
| Chr13 | Bnt13G018582 | FWPC | 7866103 | 6.3 | Intergenic region | TCP domain-containing protein |
| Chr13 | Bnt13G018583 | FWPC | 7866103 | 6.3 | Intergenic region | TCP domain-containing protein |
| Chr14 | Bnt14G019331 | LDWP | 1803576 | 6.0 | Upstream gene variant | Transposase-associated domain |
| Chr04 | Bnt04G005762 | DWP | 9087683 | 7.0 | Intergenic region | Cation transport |
| FWP | 9087683 | 6.1 | Intergenic region | |||
| IPH | 9100978 | 6.5 | Downstream gene variant | |||
| Chr04 | Bnt04G005636 | FWP | 7066661 | 6.2 | Intron variant | CSC1-like protein |
| SDWP | 7110697 | 6.5 | Intergenic region | |||
| Chr04 | Bnt04G005637 | FWP | 7110697 | 6.1 | Intergenic region | Wall-associated receptor kinase-like 9 |
| SDWP | 7110697 | 6.5 | Intergenic region | |||
| Chr05 | Bnt05G007759 | FWP | 11395767 | 6.3 | Upstream gene variant | MOSC, N-terminal beta barrel |
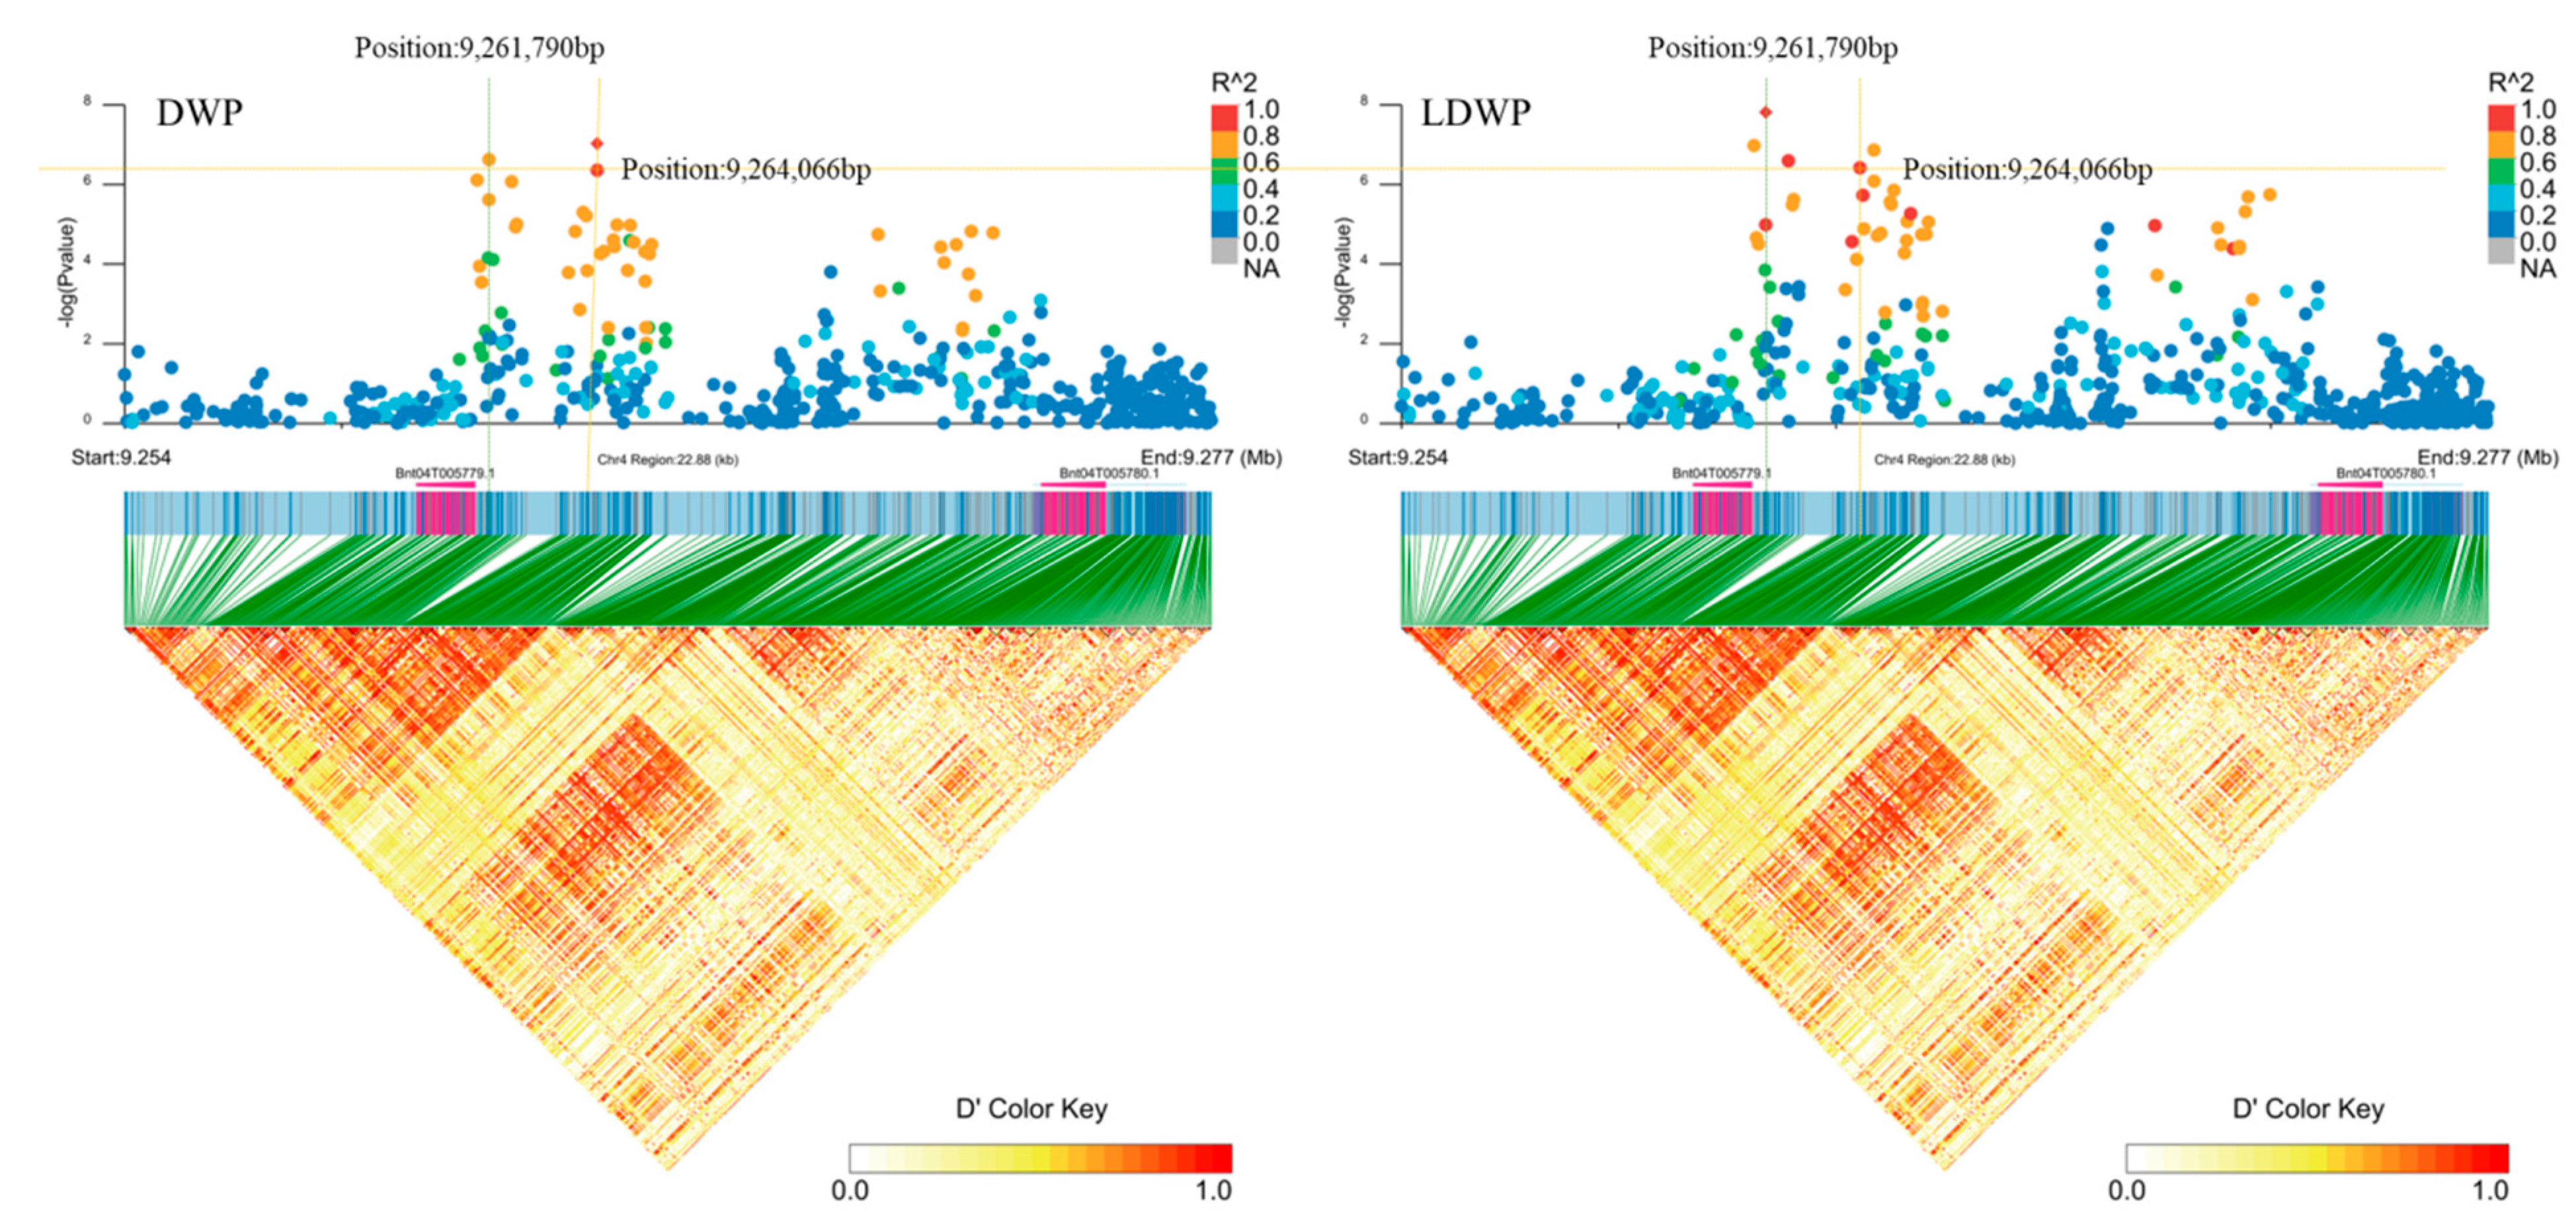
| Chr04 | Bnt04G005779 | LDWP | 9261790 | 7.8 | Downstream gene variant | F-box domain-containing protein |
| LDWP | 9264066 | 6.9 | Intergenic region | |||
| DWP | 9264066 | 7.0 | Intergenic region | |||
| DWP | 9261790 | 6.6 | Downstream gene variant | |||
| Chr04 | Bnt04G005780 | LDWP | 9264066 | 6.9 | Intergenic region | F-box protein |
| DWP | 9264066 | 7.0 | Intergenic region | |||
Publisher’s Note: MDPI stays neutral with regard to jurisdictional claims in published maps and institutional affiliations. |
© 2022 by the authors. Licensee MDPI, Basel, Switzerland. This article is an open access article distributed under the terms and conditions of the Creative Commons Attribution (CC BY) license (https://creativecommons.org/licenses/by/4.0/).
Share and Cite
Bai, X.; Wang, X.; Wang, Y.; Wei, Y.; Fu, Y.; Rao, J.; Ma, Y.; Zeng, Z.; Li, F.; Wang, M.; et al. Genome-Wide Association Study of Six Forage Traits in Ramie (Boehmeria nivea L. Gaud). Plants 2022, 11, 1443. https://doi.org/10.3390/plants11111443
Bai X, Wang X, Wang Y, Wei Y, Fu Y, Rao J, Ma Y, Zeng Z, Li F, Wang M, et al. Genome-Wide Association Study of Six Forage Traits in Ramie (Boehmeria nivea L. Gaud). Plants. 2022; 11(11):1443. https://doi.org/10.3390/plants11111443
Chicago/Turabian StyleBai, Xuehua, Xin Wang, Yanzhou Wang, Yiping Wei, Yafen Fu, Jing Rao, Yonghong Ma, Zheng Zeng, Fu Li, Mansheng Wang, and et al. 2022. "Genome-Wide Association Study of Six Forage Traits in Ramie (Boehmeria nivea L. Gaud)" Plants 11, no. 11: 1443. https://doi.org/10.3390/plants11111443