
Comparative Analysis of Detectors and Feature Descriptors for Multispectral Image Matching in Rice Crops

 ,
,  , , , , and
Abstract
:1. Introduction
2. Materials and Methods
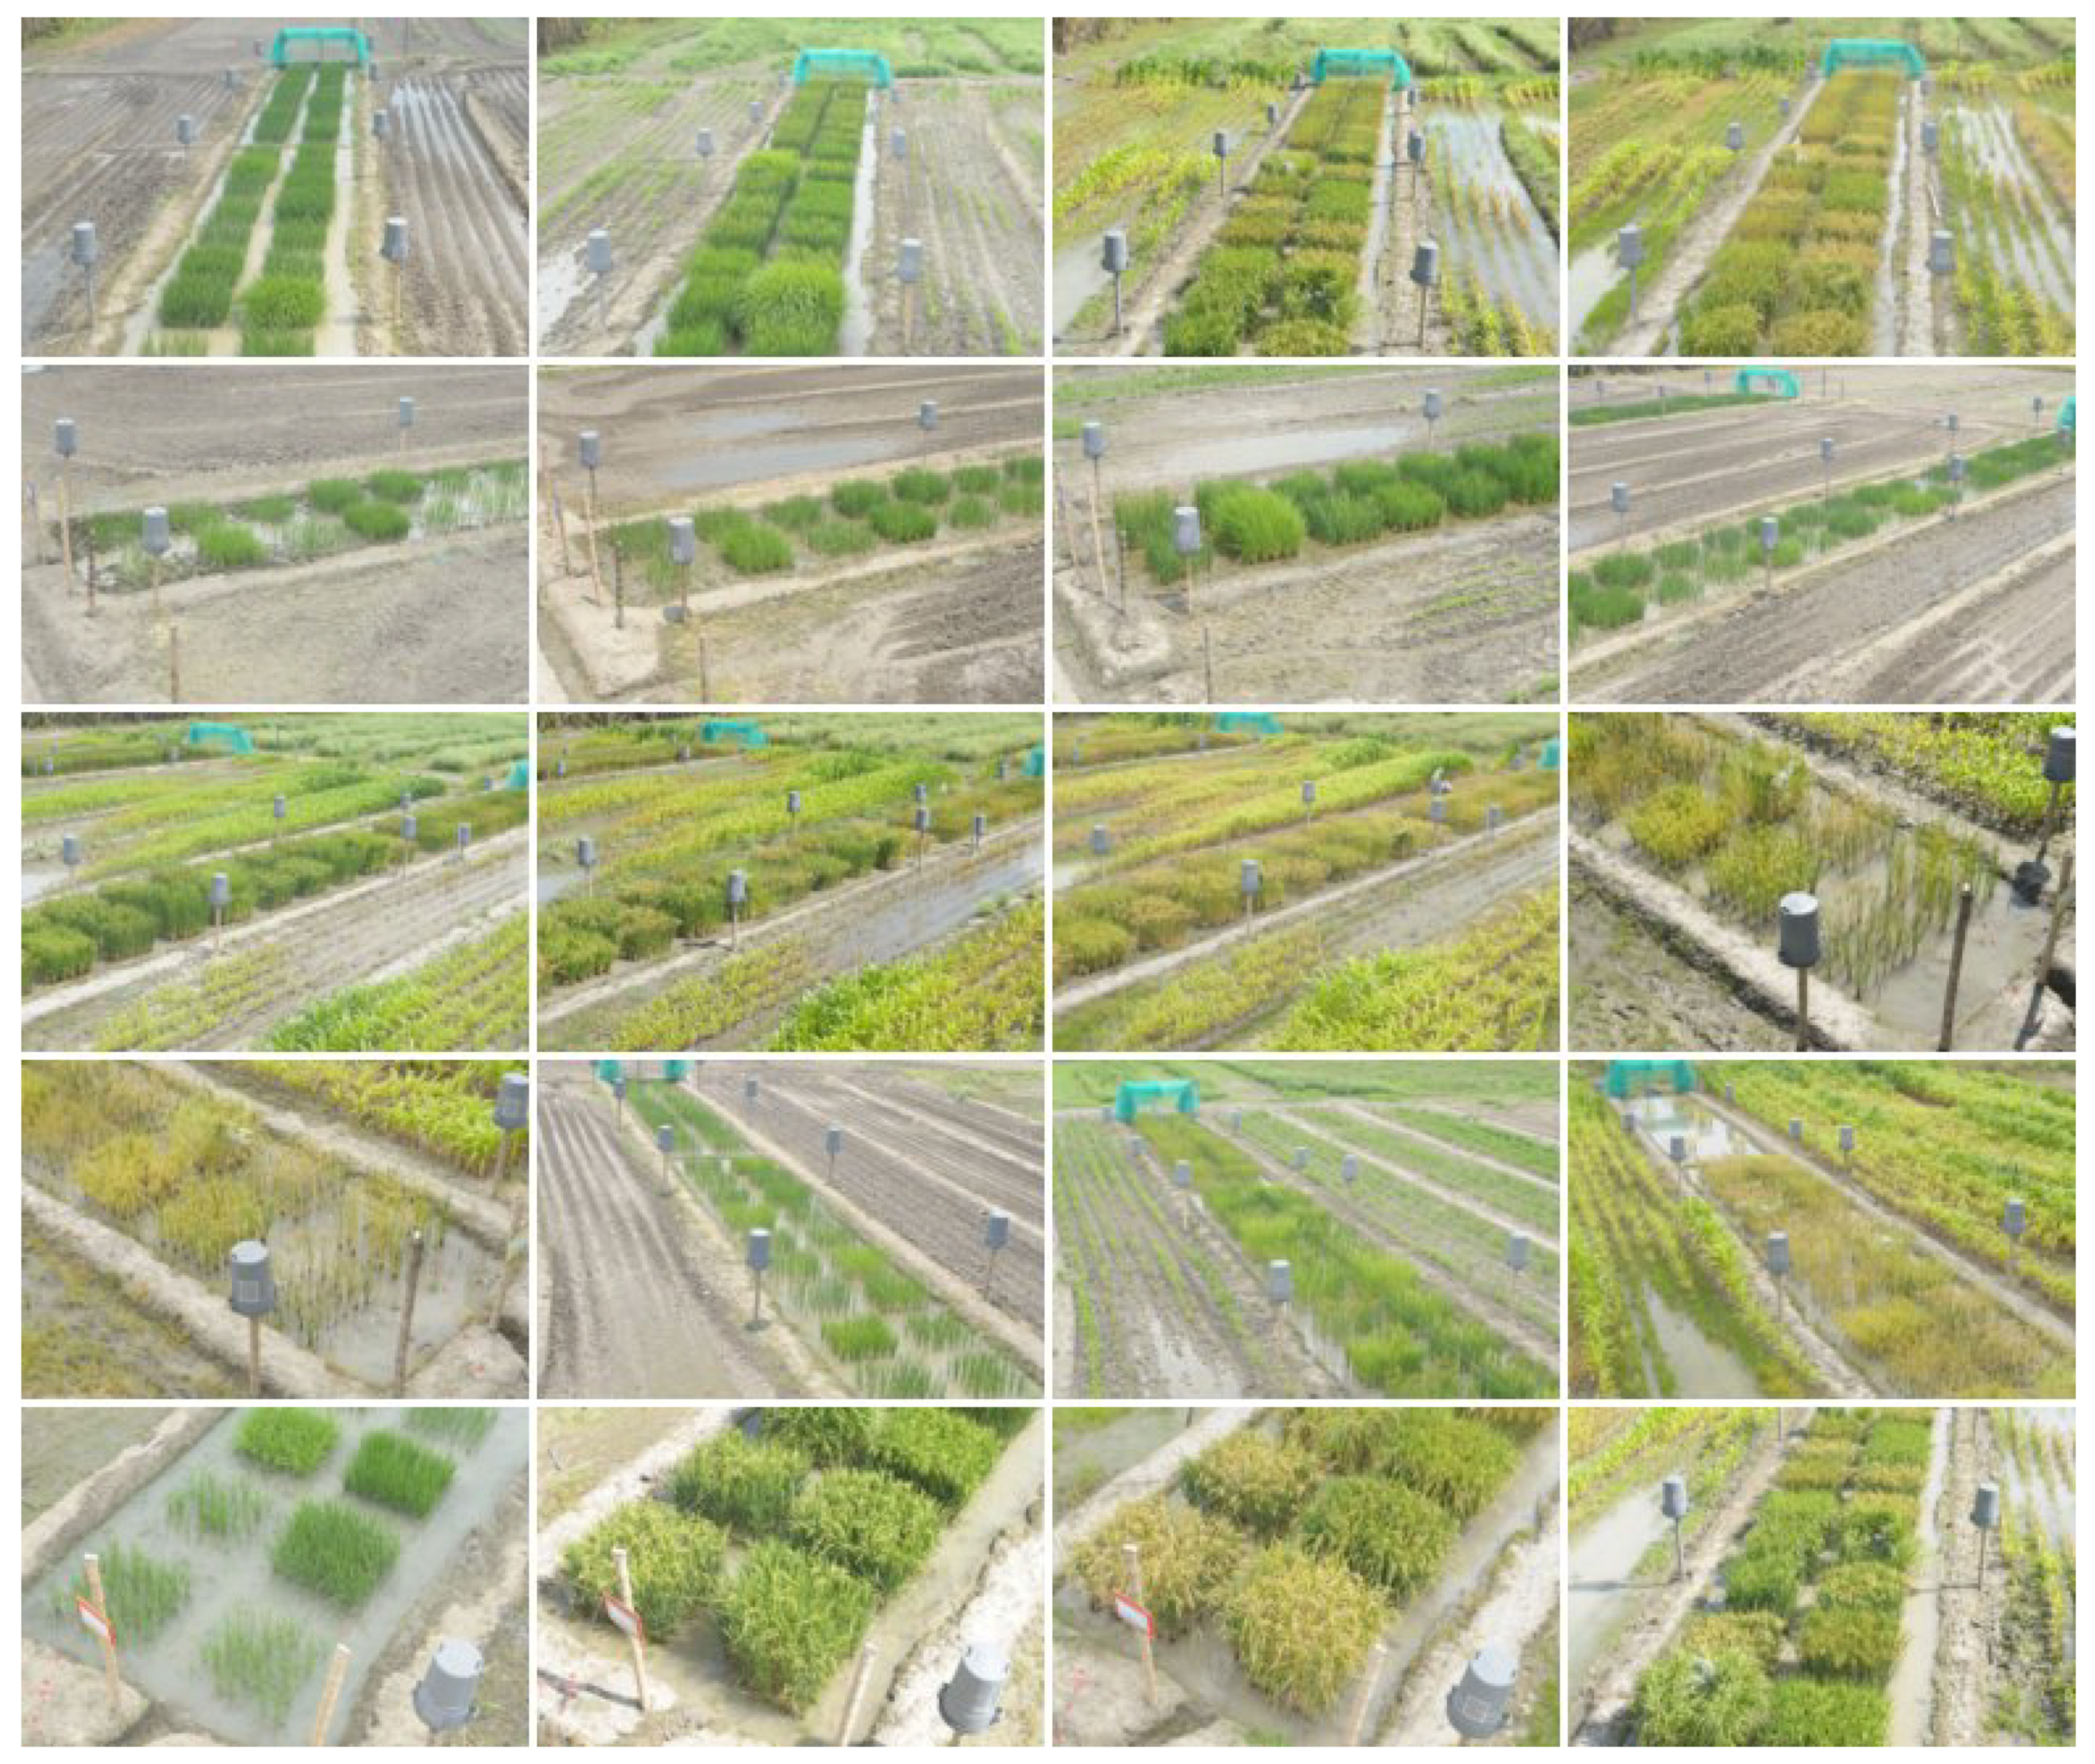
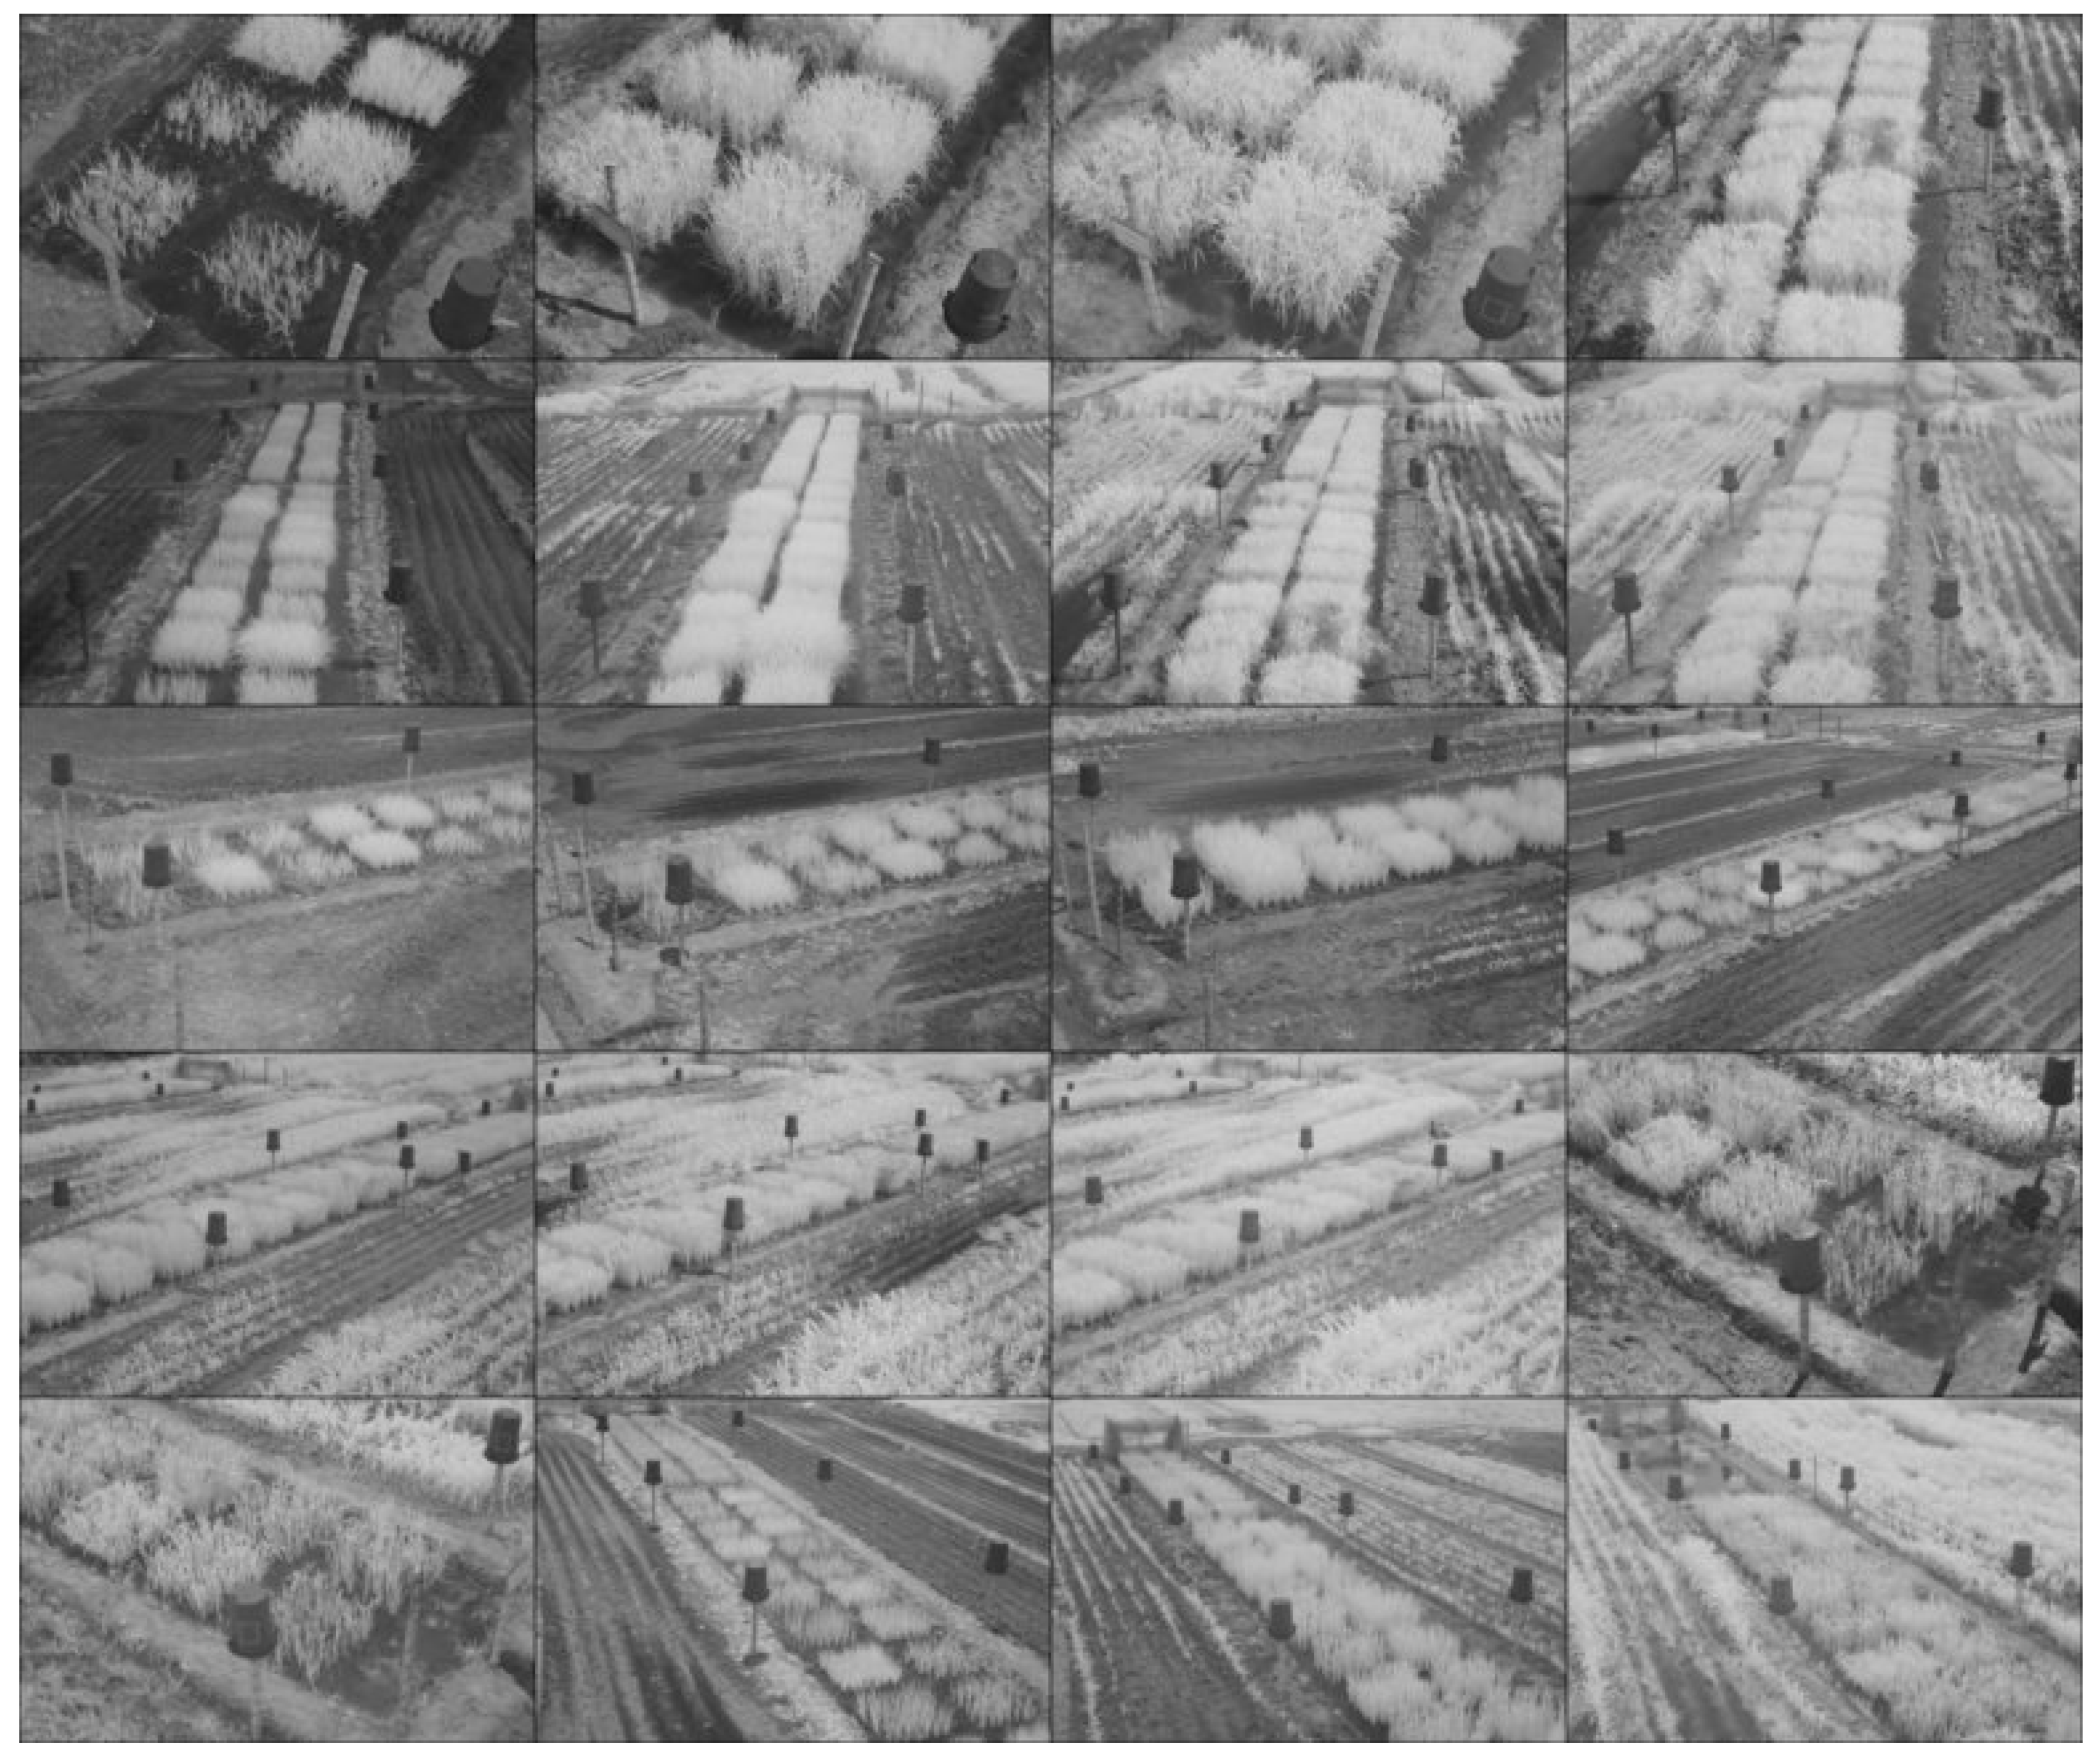
2.1. Materials
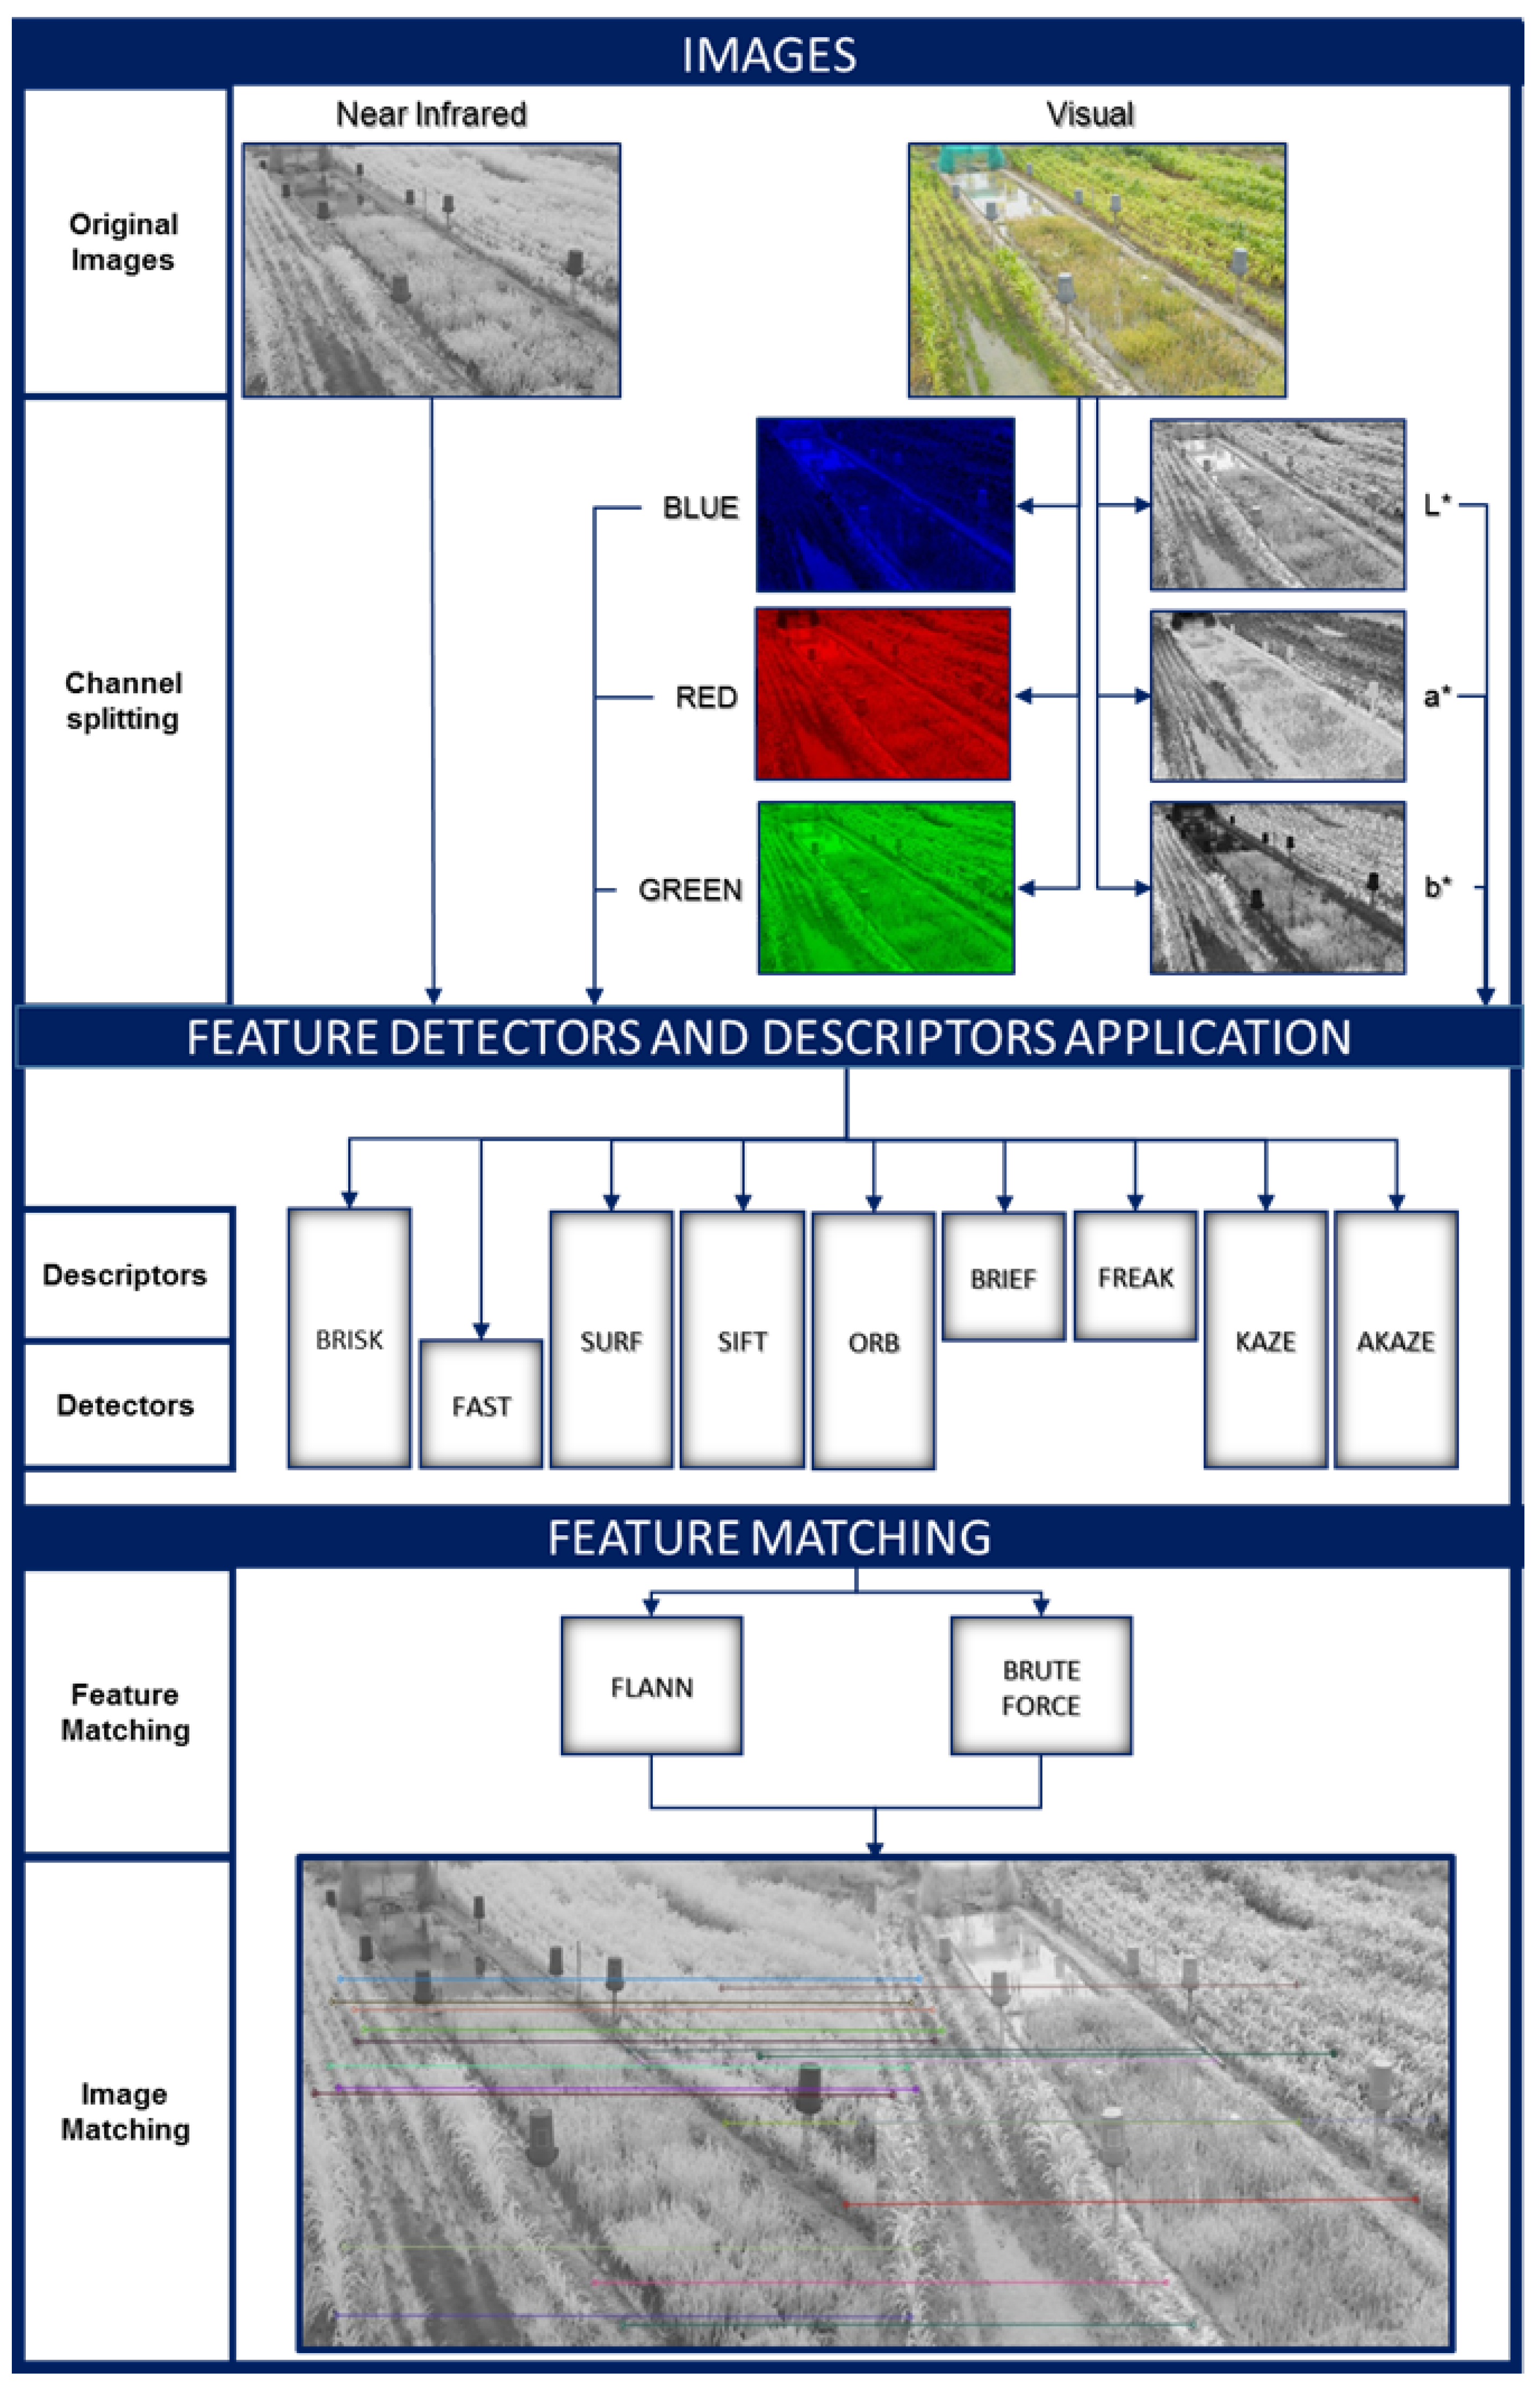
2.2. Methods
2.2.1. Evaluated Methods
- SIFT: This method detects the key points by applying a Gaussian filter to smooth the image while rescaling it. In this way, a pyramid is generated with the original image at the first level. The key points are then detected around a matrix of any pixel at an intermediate level where the Gaussian difference values reach an extreme. The SIFT method is also a key point descriptor, where it performs a histogram of the position of the local image gradient directions around the point of interest being scale invariant [17];
- SURF: The keypoint detection process of this algorithm is very similar to SIFT, however, the SURF is based on a Hessian matrix, which is generated by convolution of the Gaussian second-order derivative with image pixels by detecting the keypoints using a non-maximal suppression in a Gaussian pyramid, and then interpolating the maxima of the Hessian matrix. Keypoint detection is performed by first assigning the orientation by obtaining the Haar Wavelet response in the x and y directions around each point of interest, where the dominant orientation is defined by calculating the sum of orientations. Then, the Wavelet responses in a square region oriented in the dominant orientation provide the SURF descriptors [18];
- FAST: This algorithm aims to find points of interest in an image and is specialized in corner detection. To find the points of interest it analyzes each pixel p, comparing its intensity with that of the four pixels located in a circle of radius 3, forming a cross with the center p. If at least 3 of them are darker or brighter than p, p is compared with the 16 pixels located on the edge of the circle. If at least 12 of them are darker or brighter than p, and are consecutive p is identified as a key point [19];
- BRISK: Is a detector and descriptor robust to rotational changes, based on a scale-space FAST method introduced by [19]. It takes the input image to create a scale space with n octaves and intra-octaves , where and normally . To find the points of interest, a circular mask consisting of 16 points located at the edge of the circumference is initially used. If at least 9 of the 16 pixels are larger or smaller than the central one, it is taken as a candidate keypoint. This process is performed in each octave and intra-octave. The candidate points are compared with their neighbors in the same layer and in the upper and lower ones. Thus, points are obtained on different scales and scored accordingly [20]. After obtaining the points of interest at different scales, they are used for the construction of the descriptor. Thus, on these points in the input image a sampling pattern of n samples is used, usually consisting of four circles. Then, a Gaussian smoothing is performed with standard deviation equal to the distance between the points of the same circle. In addition, the local gradient over the k is calculated. Afterwards, two subgroups are defined, the first one formed by pairs of samples separated by a short distance S and the other one by pairs separated by a larger distance L. In this way, the estimate of the direction of k is obtained. For obtaining the rotation invariance, the sampling pattern rotated by about the point of interest k is used. The description of point k is formed by the bit vector which is assembled from the short-distance pairwise intensity comparisons. Finally, to compare two BRISK descriptors, the Hamming distance is employed, using the difference between the bits as the dissimilarity measure [20];
- BRIEF: Is a binary feature point descriptor that employs simple tests using intensity difference to create binary feature vectors that effectively describe key points in a pair of image patches. Before executing binary tests, images patches are smoothed using a Gaussian kernel at a pixel level, reducing noise sensitivity. The obtained binary strings with BRIEF only require between 128 and 512 bits, a relatively few number of bits compared with other state-of-the-art feature descriptors. The Hamming distance is employed for evaluating the ranking of descriptors, instead of the L2 distance, since it is easier to calculate. Although construction and matching for this descriptor is faster than other state-of-the-art ones, does not provide rotation invariance, but tolerates small amounts of rotations. Since BRIEF does not make features detection, any fast detector, such as CenSurE (Star) or FAST, can be used with this descriptor, but should not be used with SURF as it would negate BRIEF’s speed advantage [21];
- ORB: This method results from a fusion between the FAST keypoint detector and the BRIEF descriptor with some modifications. ORB employs the FAST method to detect the key points and implements the Harris corner detector to find the main N points at each level of a multi-scale image pyramid, thus seeking to be invariant to scale change. Orientation invariance is obtained by calculating the intensity centroid of a circular patch centered at the keypoint. The orientation is given by the direction of the vector located between the pixel, located at a corner, and the intensity centroid. ORB uses BRIEF as its feature descriptor doing a ’steer’ BRIEF according to the orientation of the keypoints. To construct the feature set, the result of n binary tests at the points of interest (x,y) is taken and the orientation of the patch around the key point is calculated [22];
- FREAK: Is a binary keypoint descriptor which employ a highly structured pattern that mimics the human eyes saccadic search for binary tests. A cascade of binary strings is computed by efficiently comparing pairs of image intensities. The sampling method involves a smoothing process with a Gaussian kernel using a circular retinal sampling grid. The radius of the circular grid represents the size of the kernel standard deviation, corresponding with the distribution of receptive fields over the retina. This descriptor is very similar to BRISK, but unlike this one, an exponential change in size and the overlapping receptive fields in the topology, that captures more information is handled. The added redundancy allows the use of less receptive fields, which is a known strategy employed in compressed sensing (dictionary learning). FREAK also follows ORB’s approach to learn the best pairs from training data by maximizing variance. It takes advantage of this structure to further speed up the matching using a cascade approach: more than 90% of the candidates are discarded with the first 128 bits of the descriptor if the distance is smaller than a threshold. Finally, FREAK compensate rotation changes measuring the orientation in a similar way to BRISK. However, instead of using long distance pairs, a predefined set of 45 symmetric sampling pairs is used [23];
- KAZE: The algorithm consists of detecting and describing 2D features in a non-linear scale space to obtain better distinction and location precision. From an input image, a non-linear scale space is constructed by discretizing the scale space in logarithmic steps arranged in a series of octaves and sublevels while maintaining the resolution of the original image. Then, convert the set of discrete scale levels in units of pixels () to time units (). The non-linear scale space is then built iteratively using an additive operator splitting (AOS) and variable conductance diffusion schemes reducing noise and preserving the boundaries of the objects in the image. The 2D feature detection is obtained from the scaled normalized determinant of the Hessian matrix calculated at multiple scale levels, taking the maxima as key points. The description is made from the calculation of the keypoint orientation, obtaining a descriptor invariant to scale and rotation. This technique is computationally expensive [24].
- AKAZE: Is an accelerated version of KAZE. It consists of a 2D feature detector and descriptor that uses a faster method to create a non-linear scale space based on anisotropic diffusion called fast explicit diffusion (FED) to create a fine and coarse pyramid frame. In this way, a set of filtered images is obtained to build a non-linear scale space. For feature detection, a Hessian determinant and a modified version of the local difference binary descriptor (M-LDB), which exploits the gradient and intensity information of the non-linear scale space, are used [25].
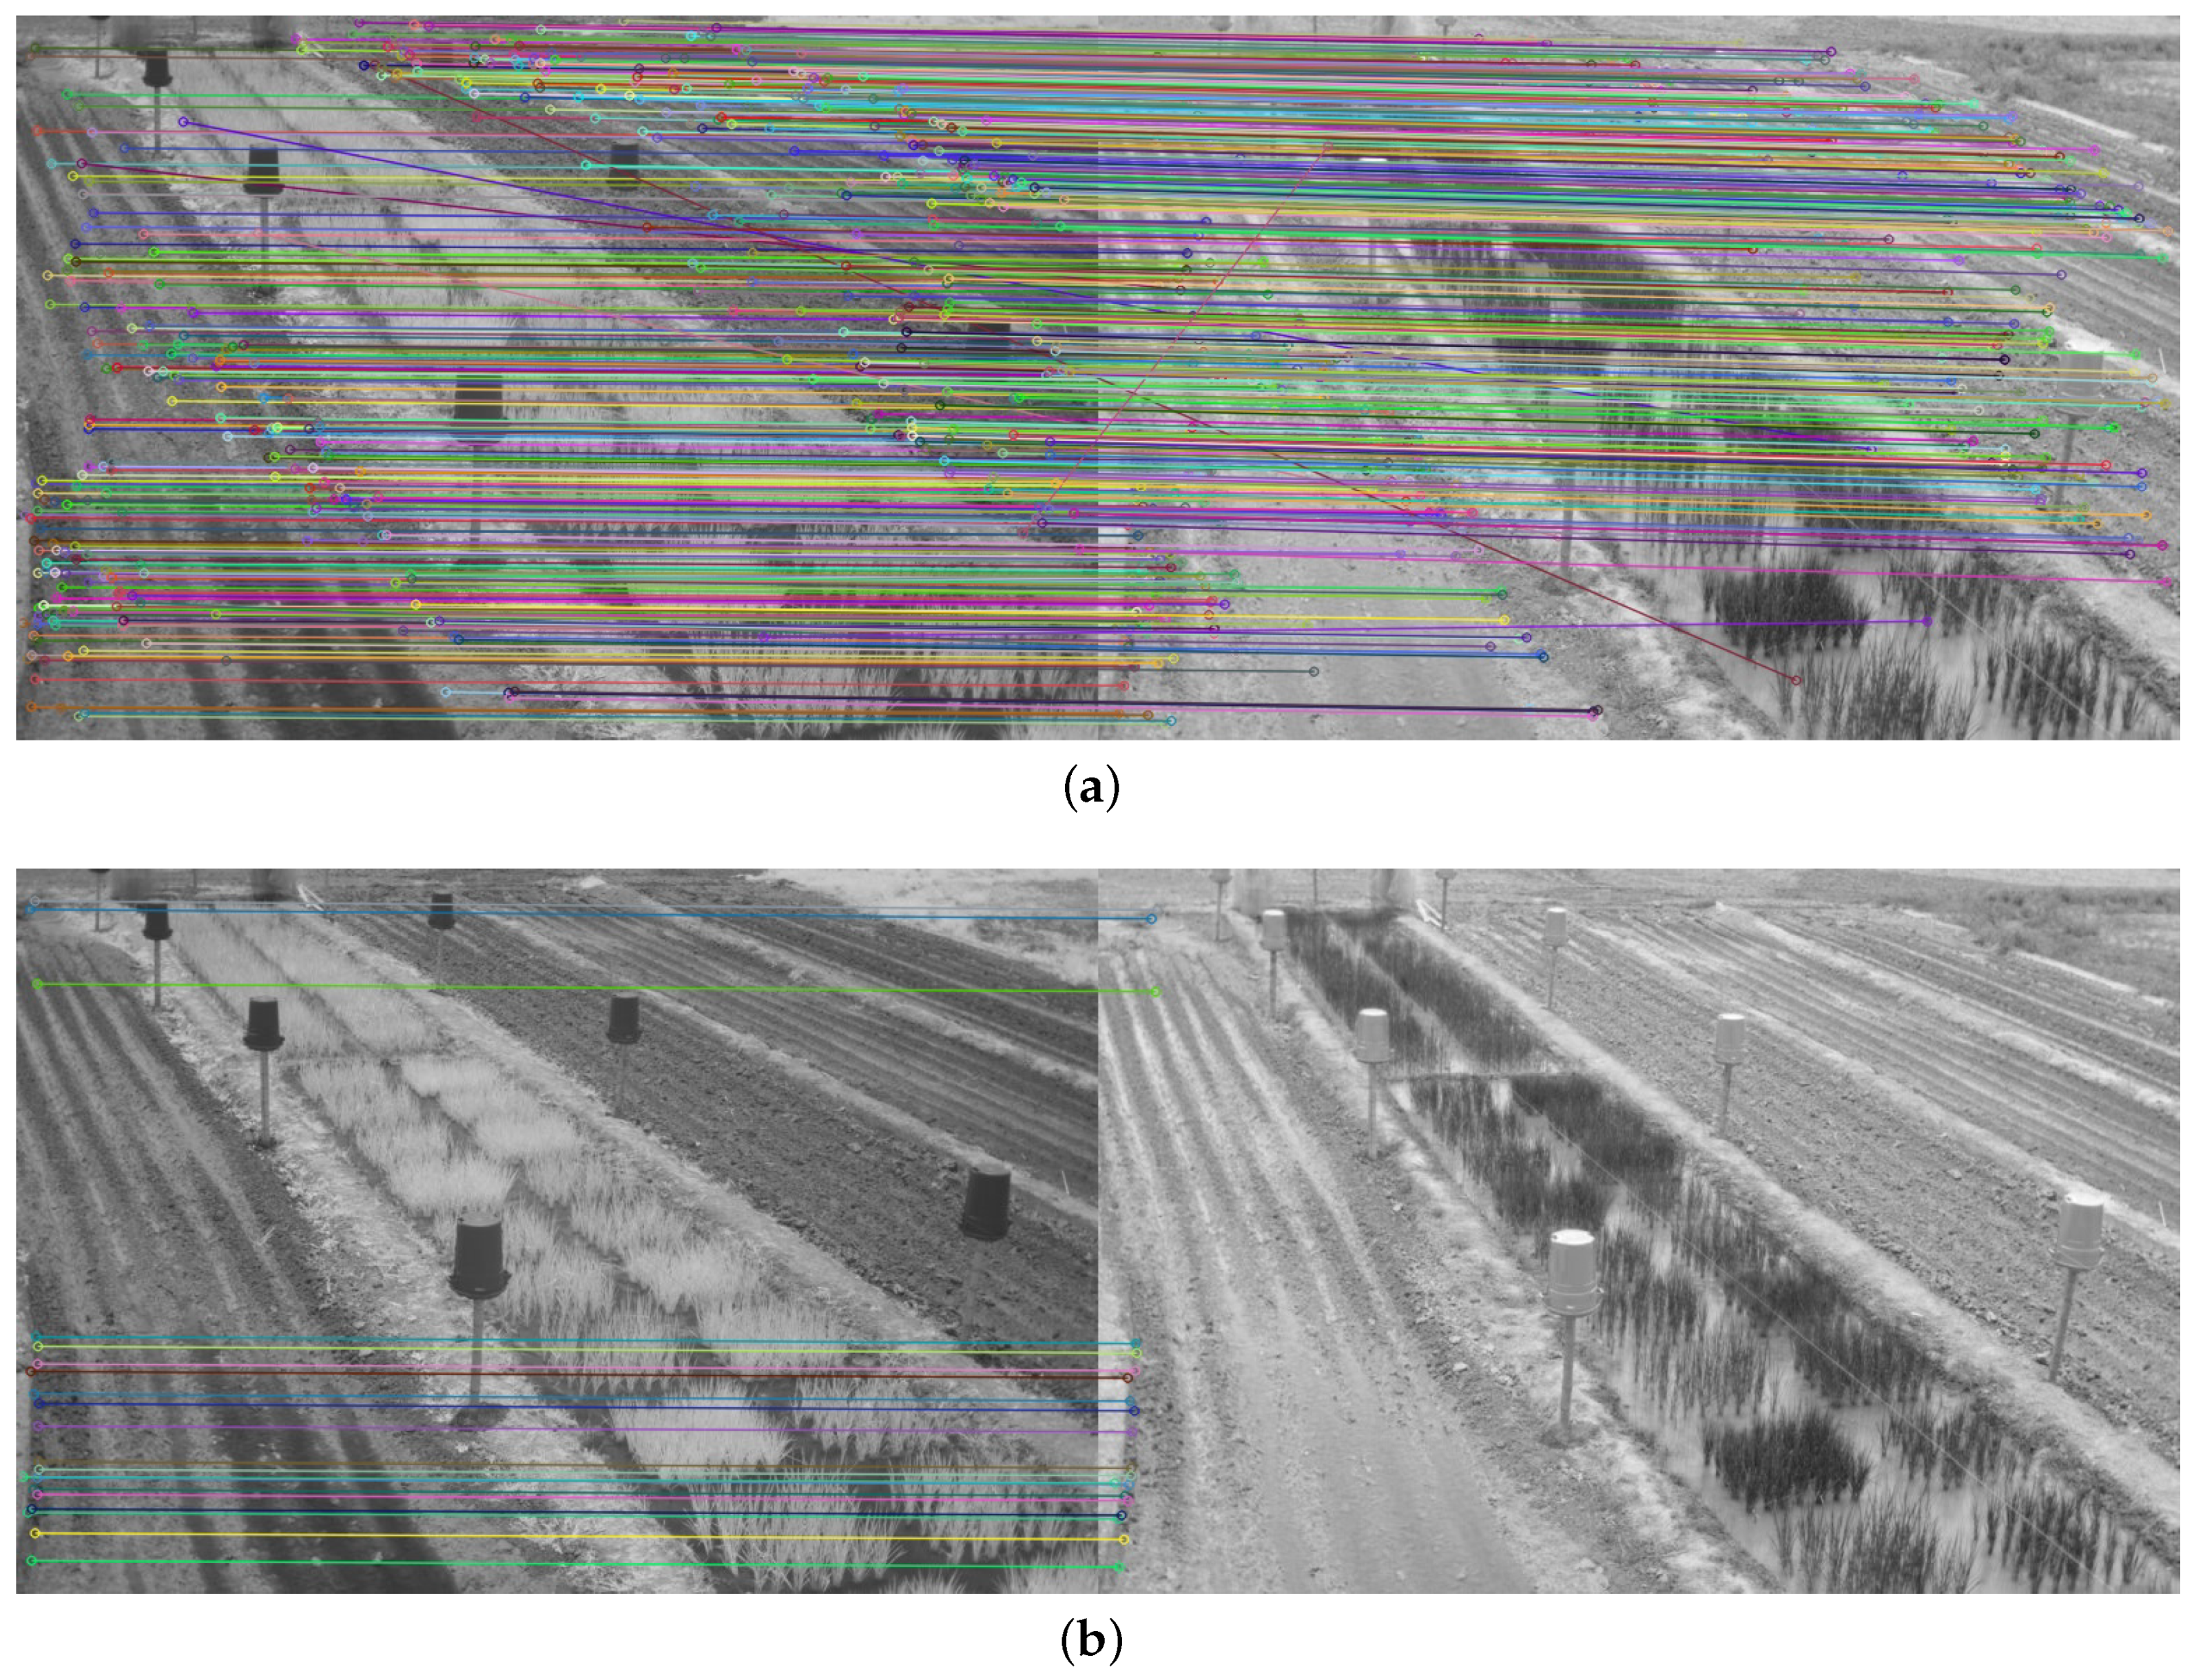
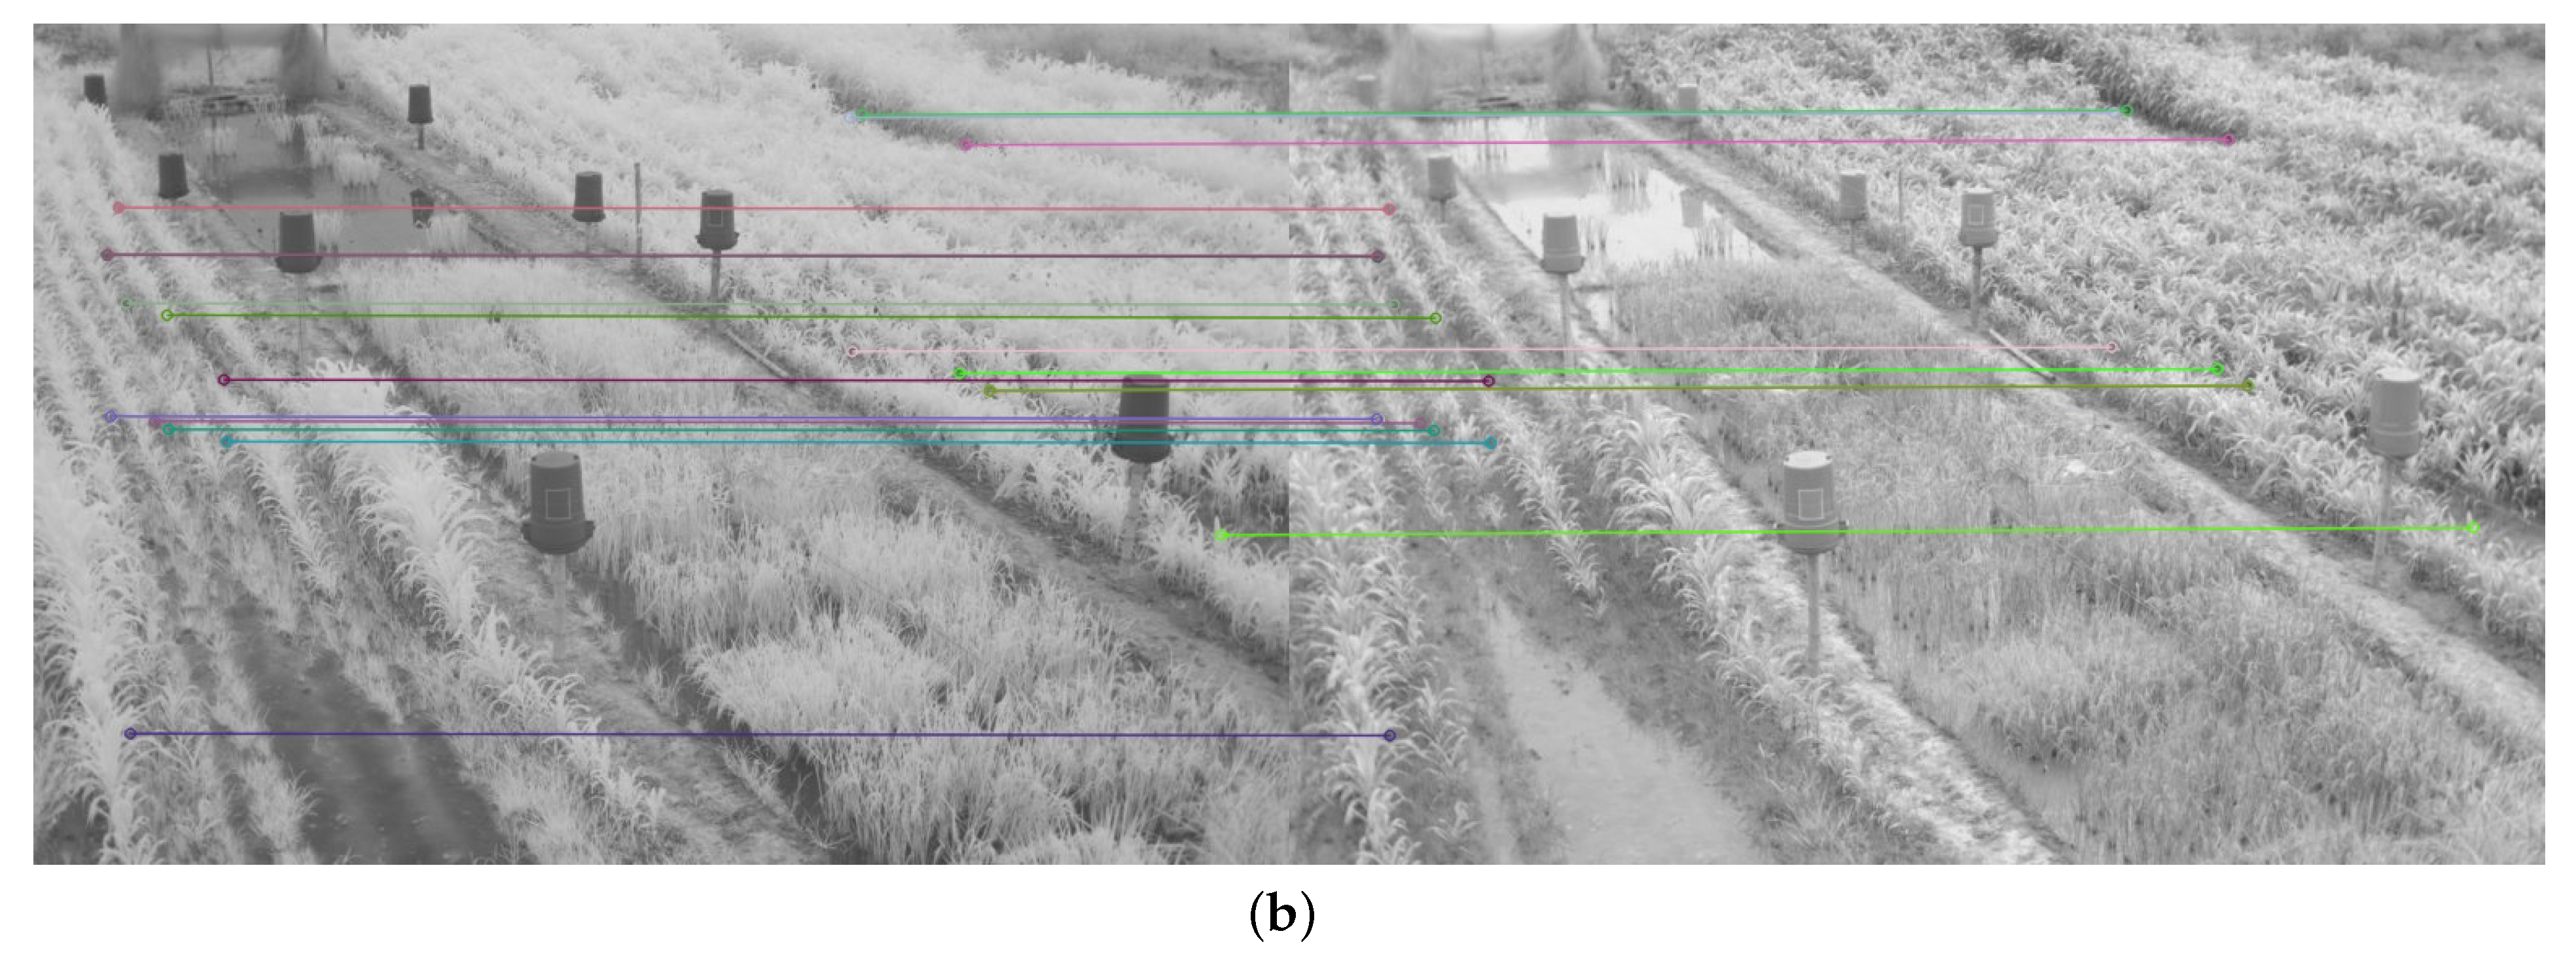
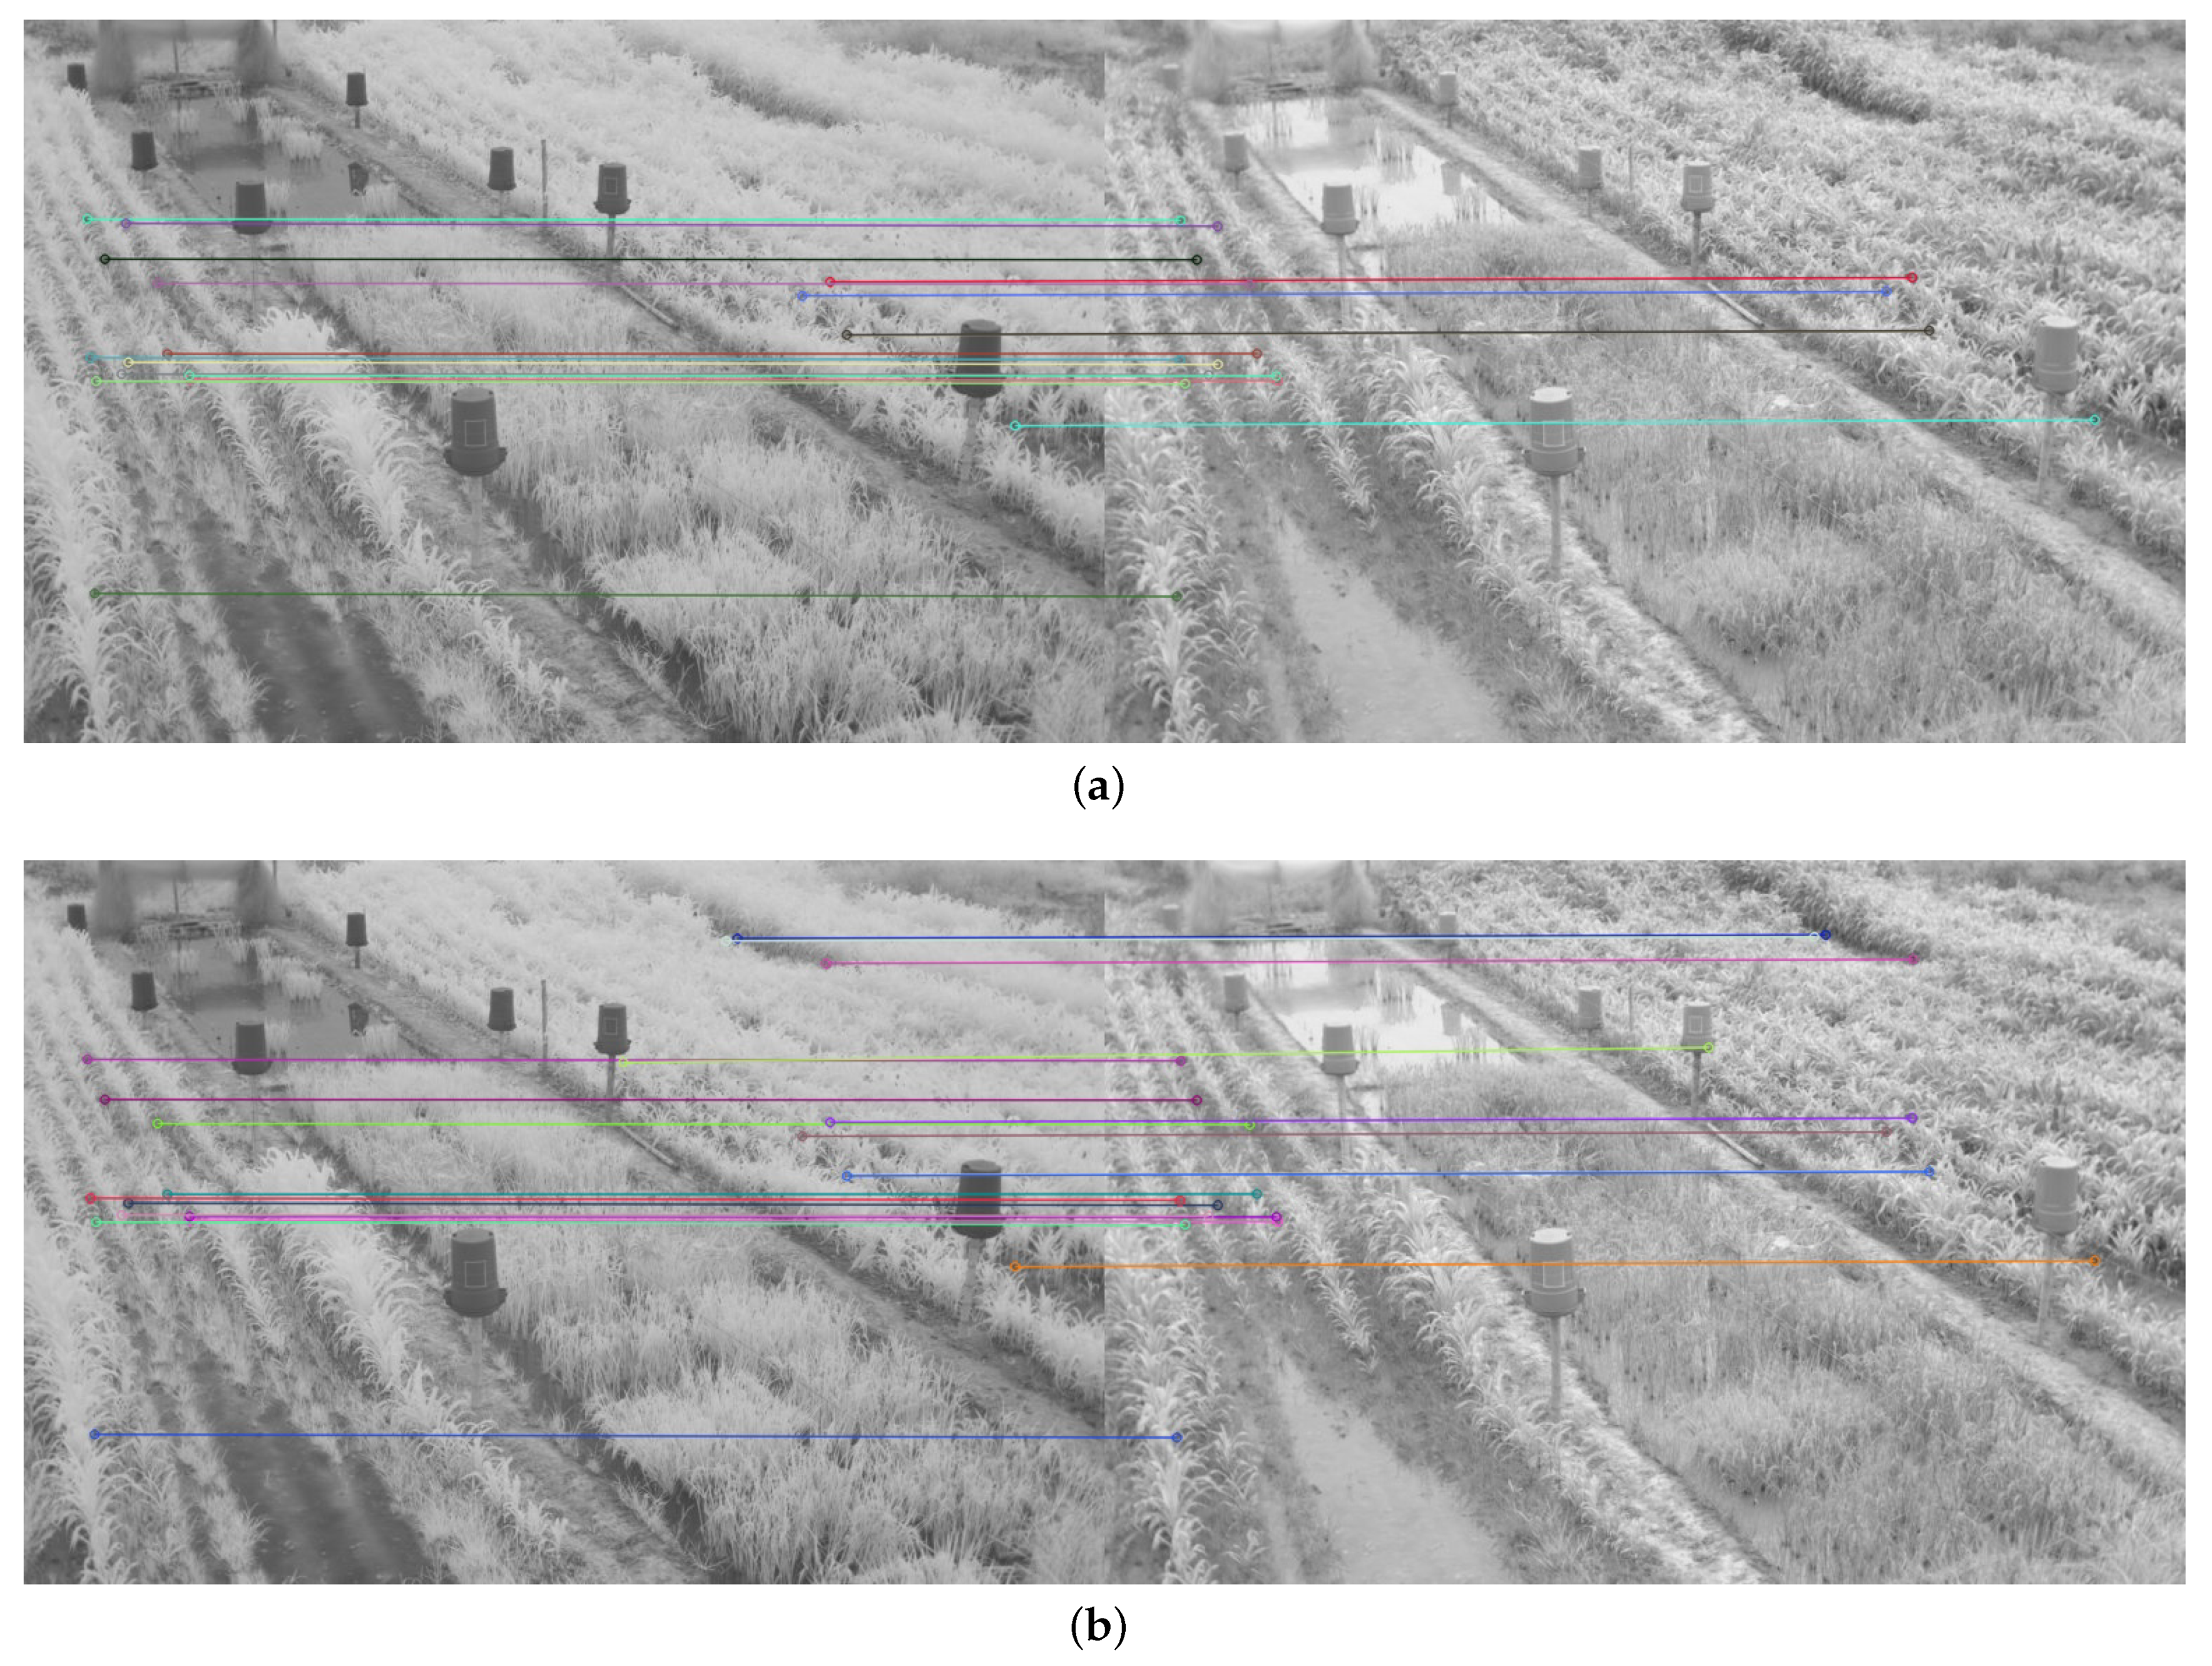
2.2.2. Evaluation Process
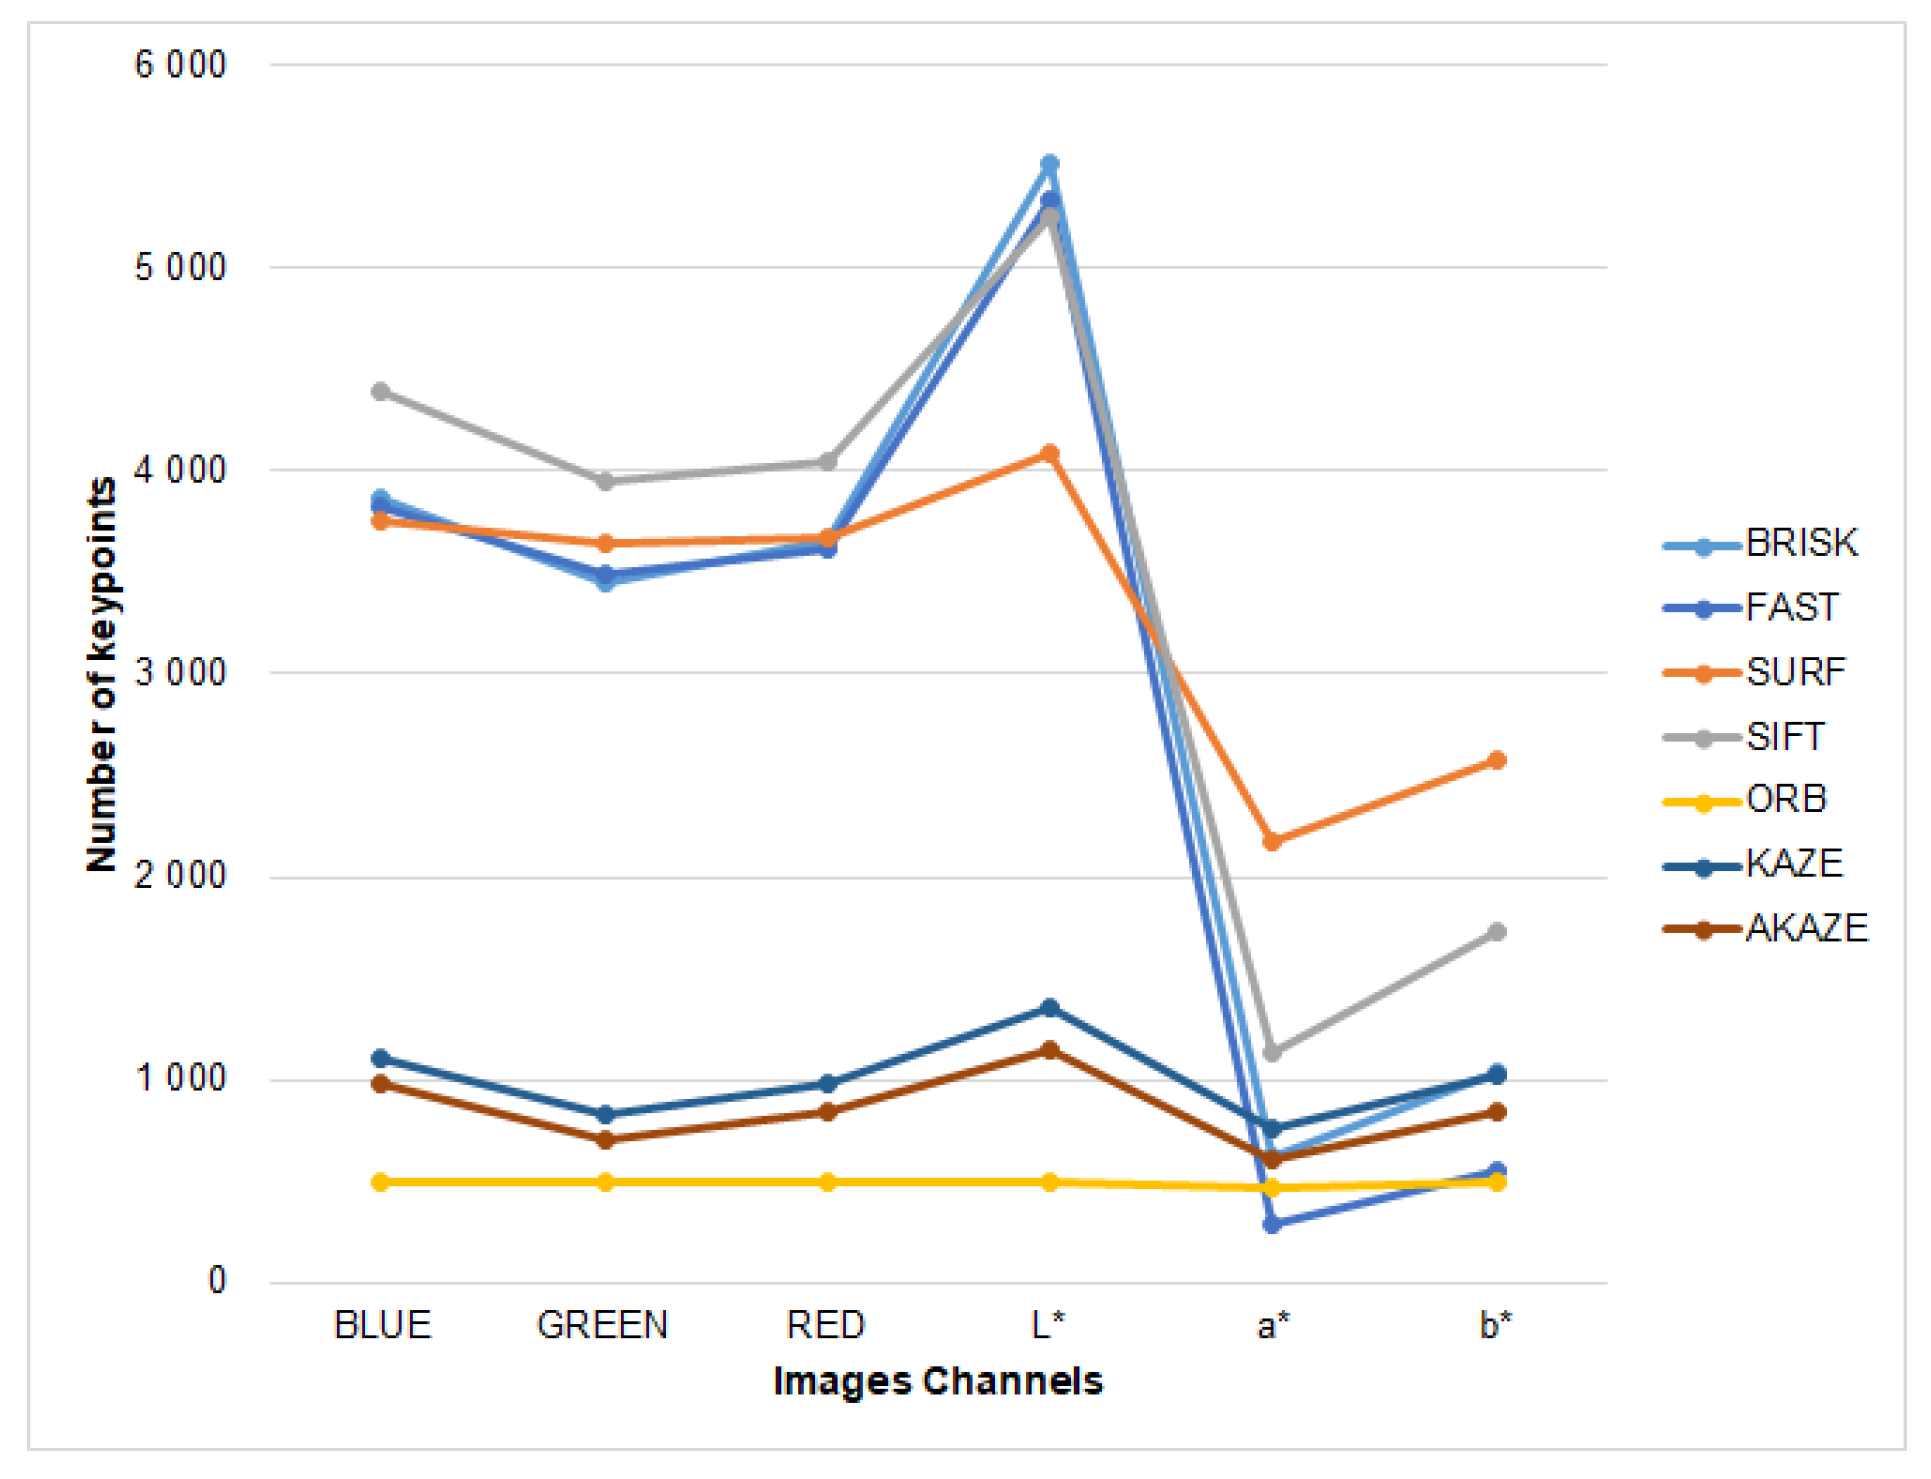
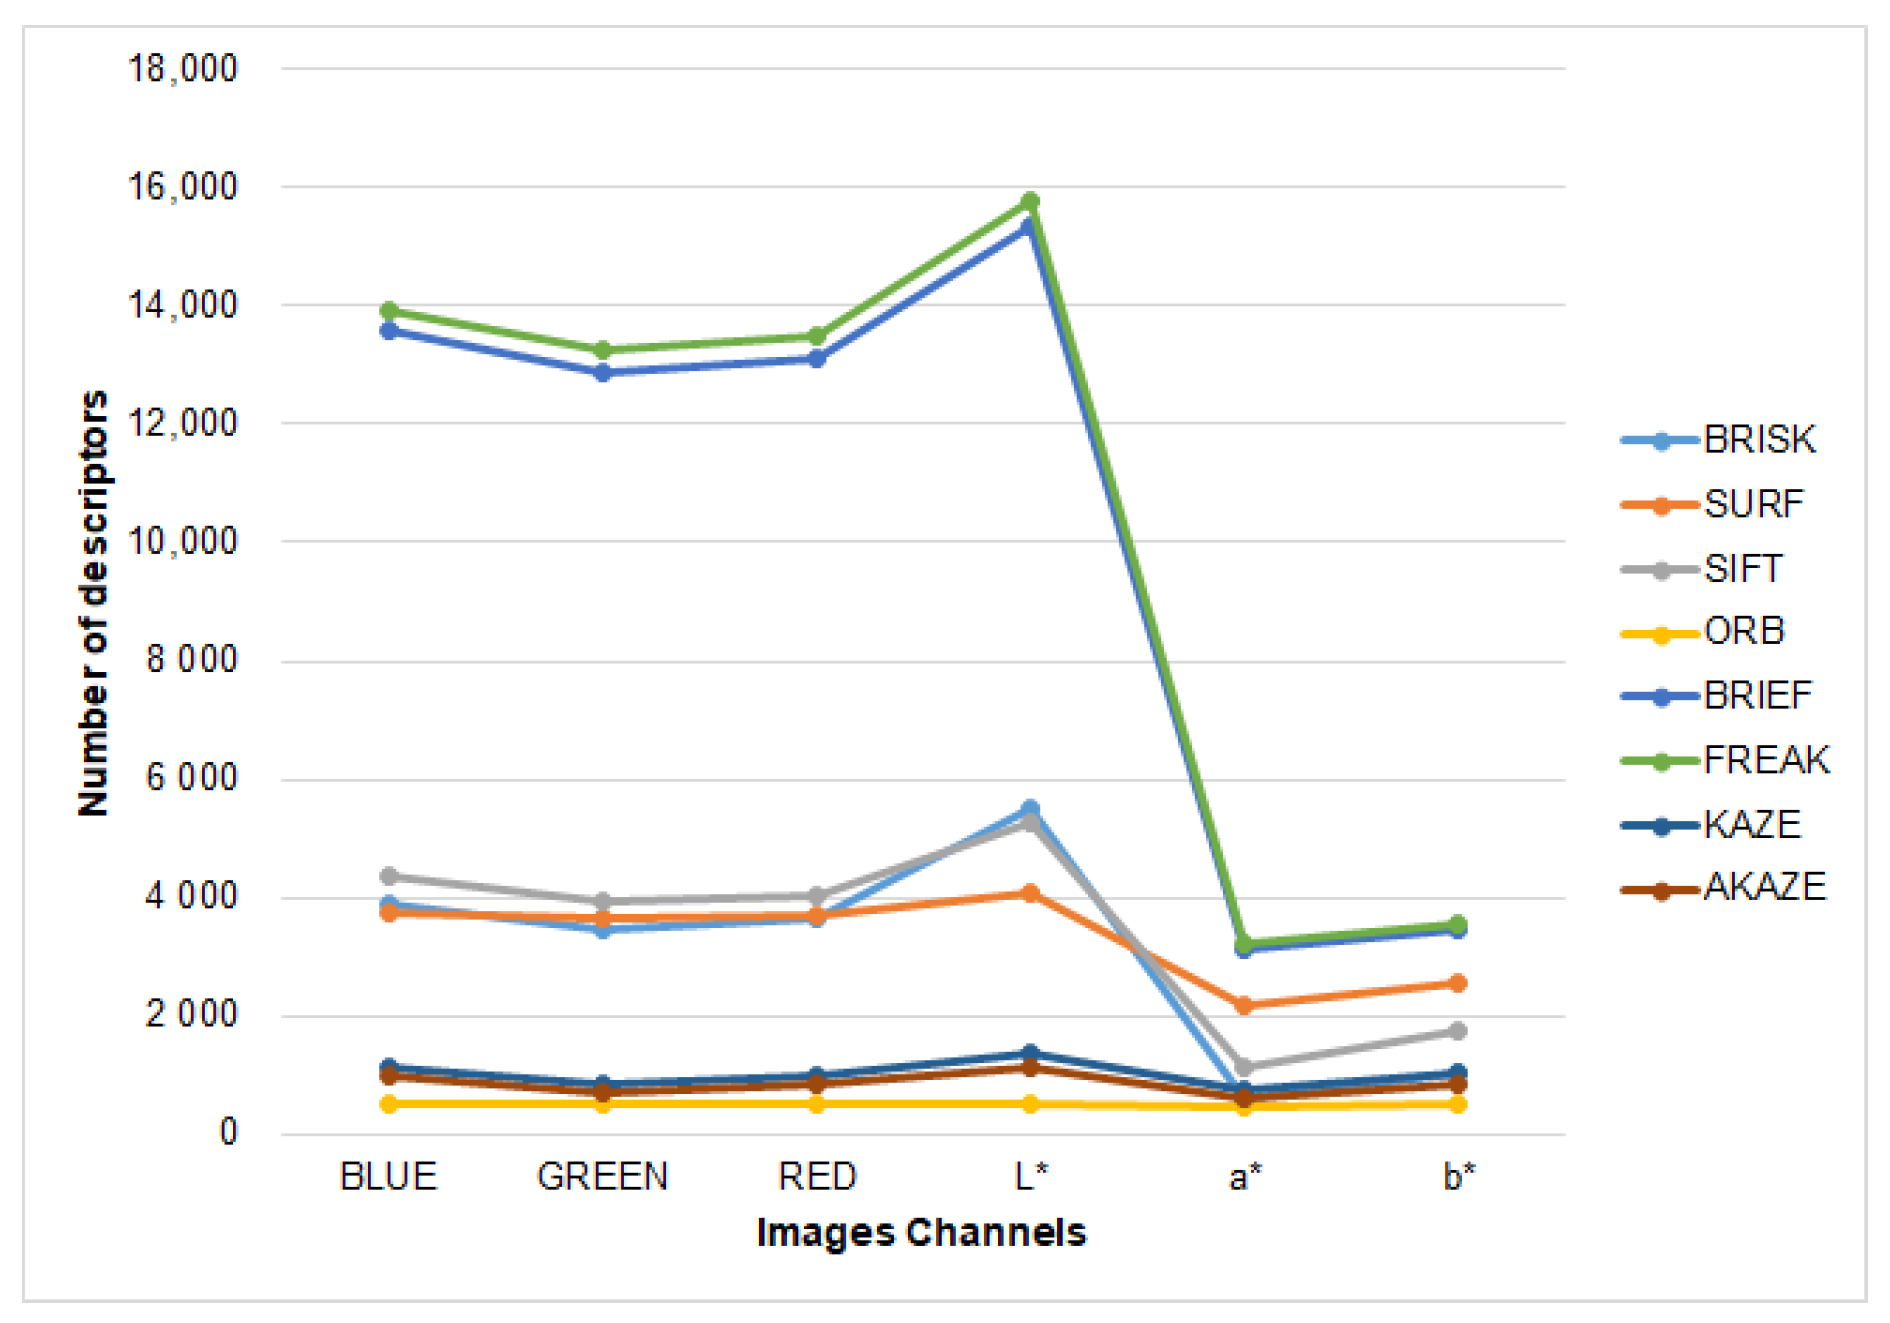
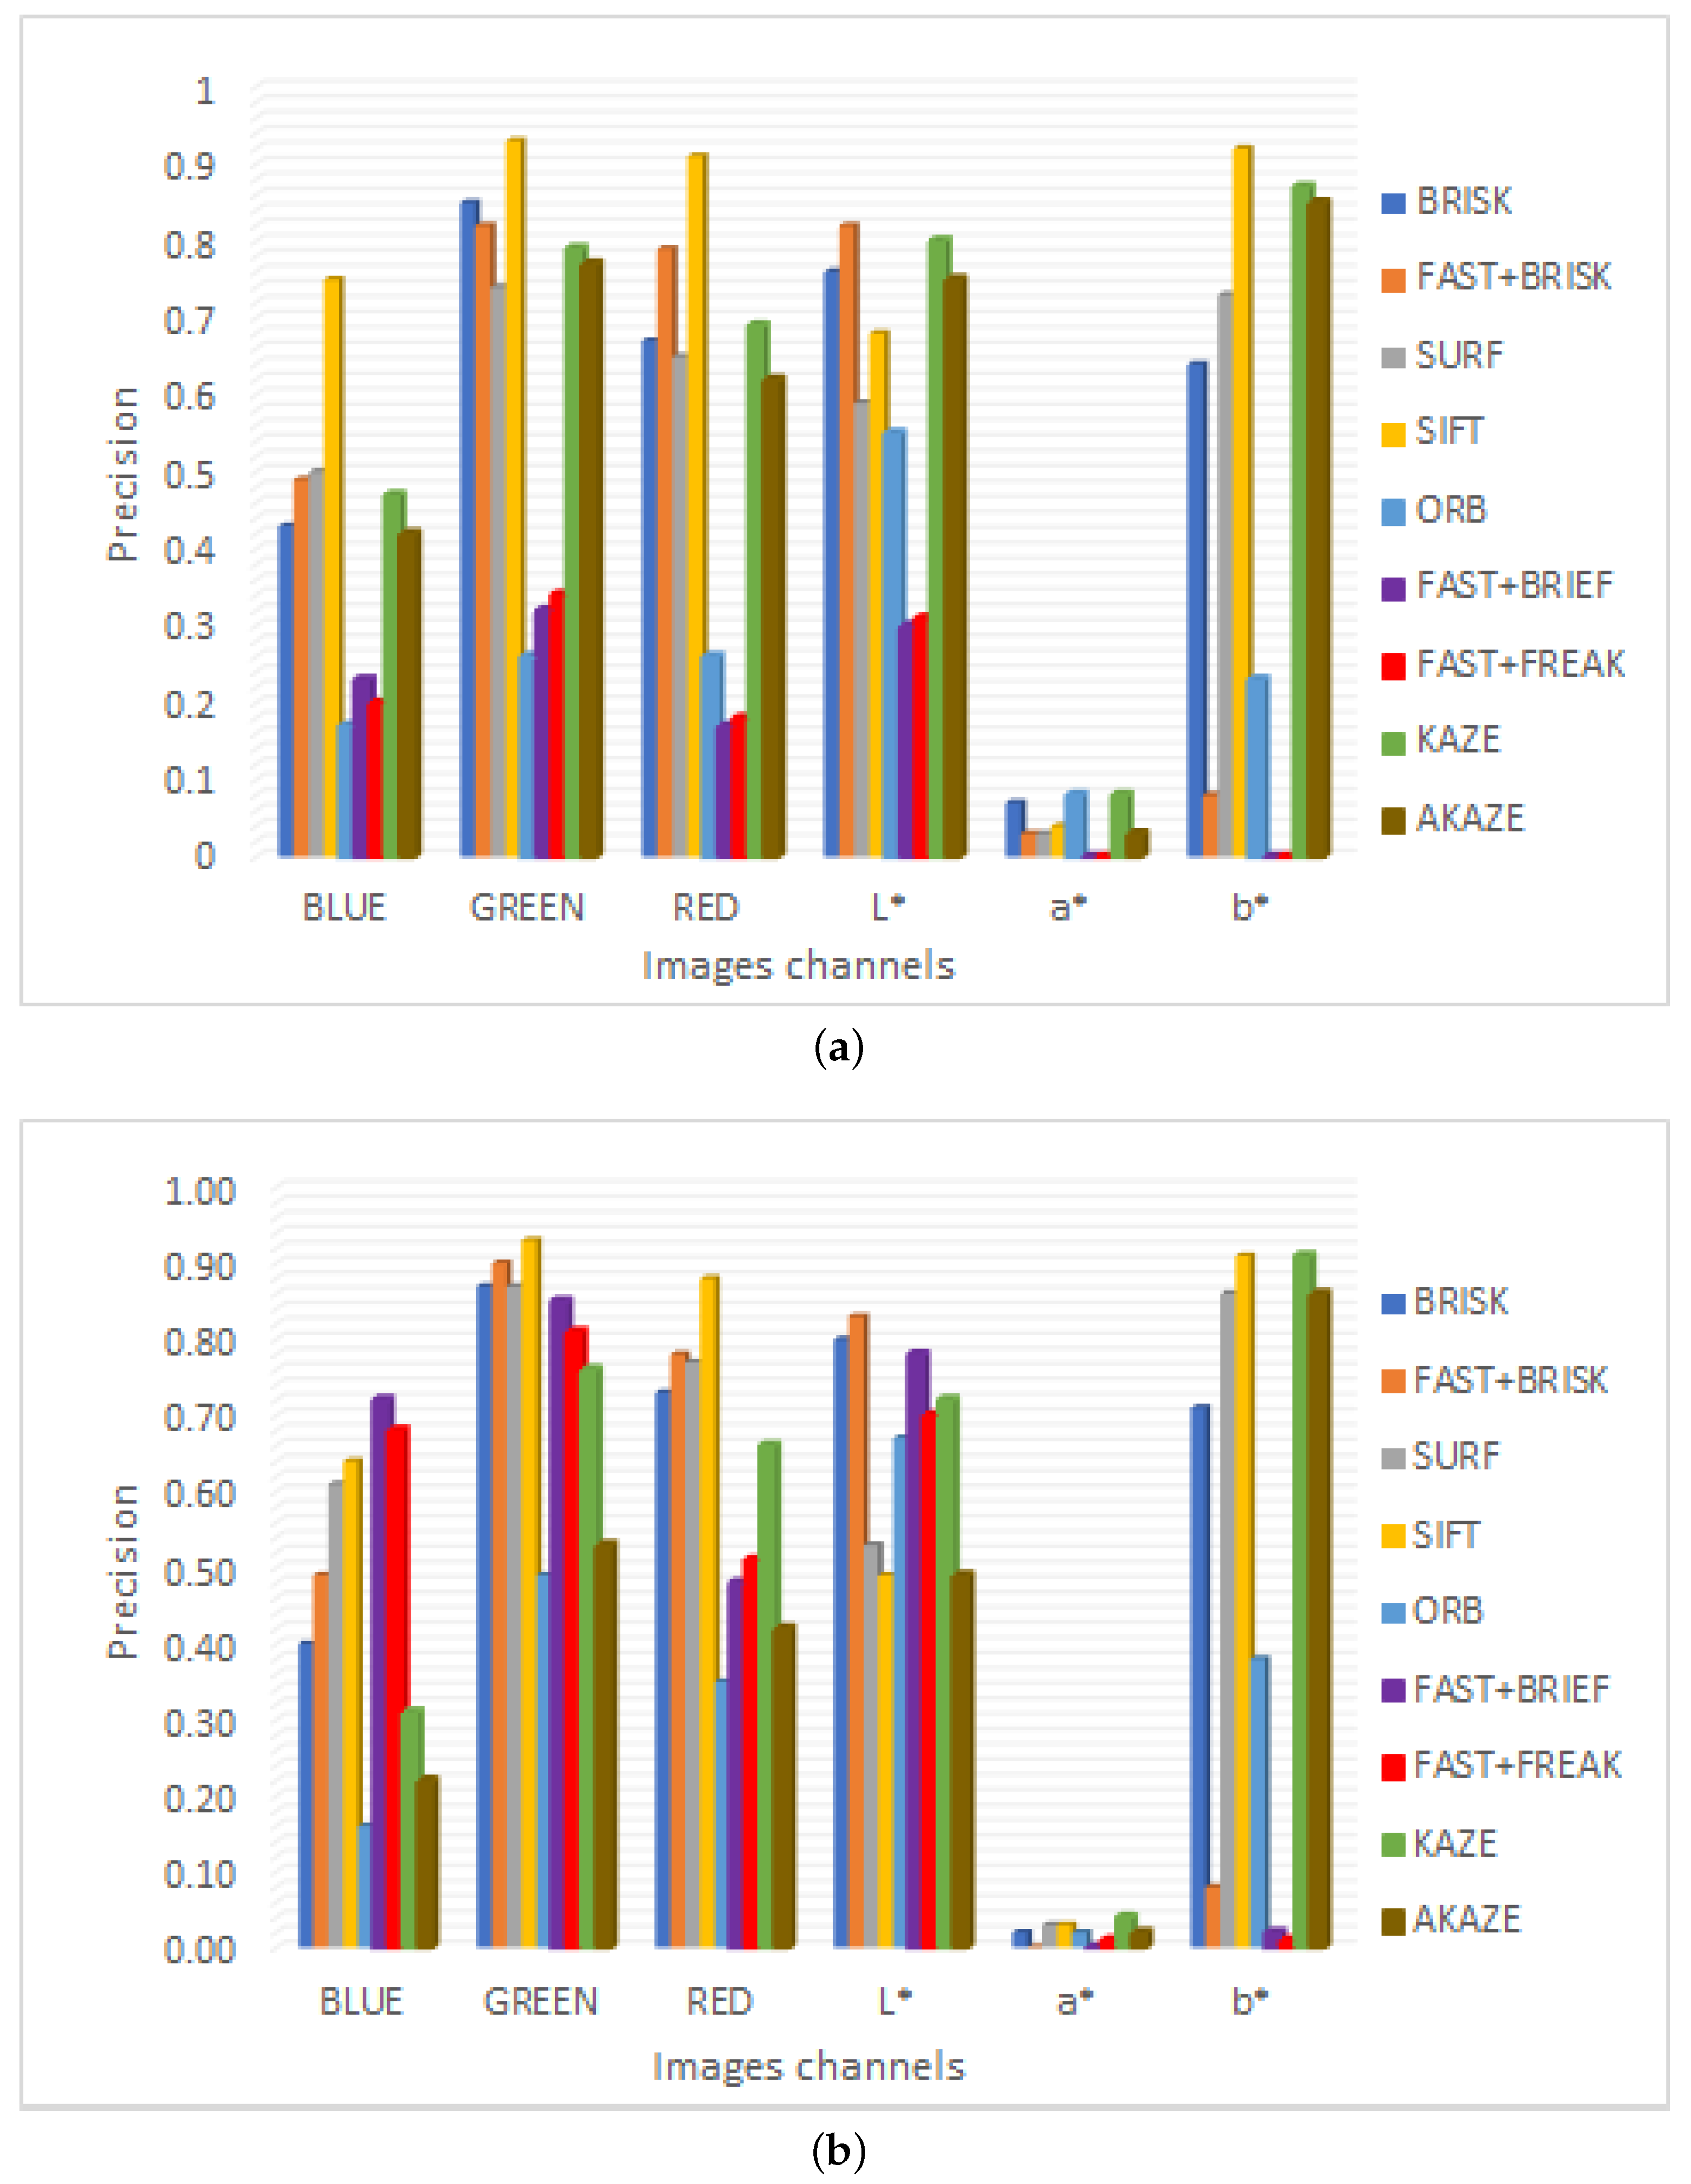
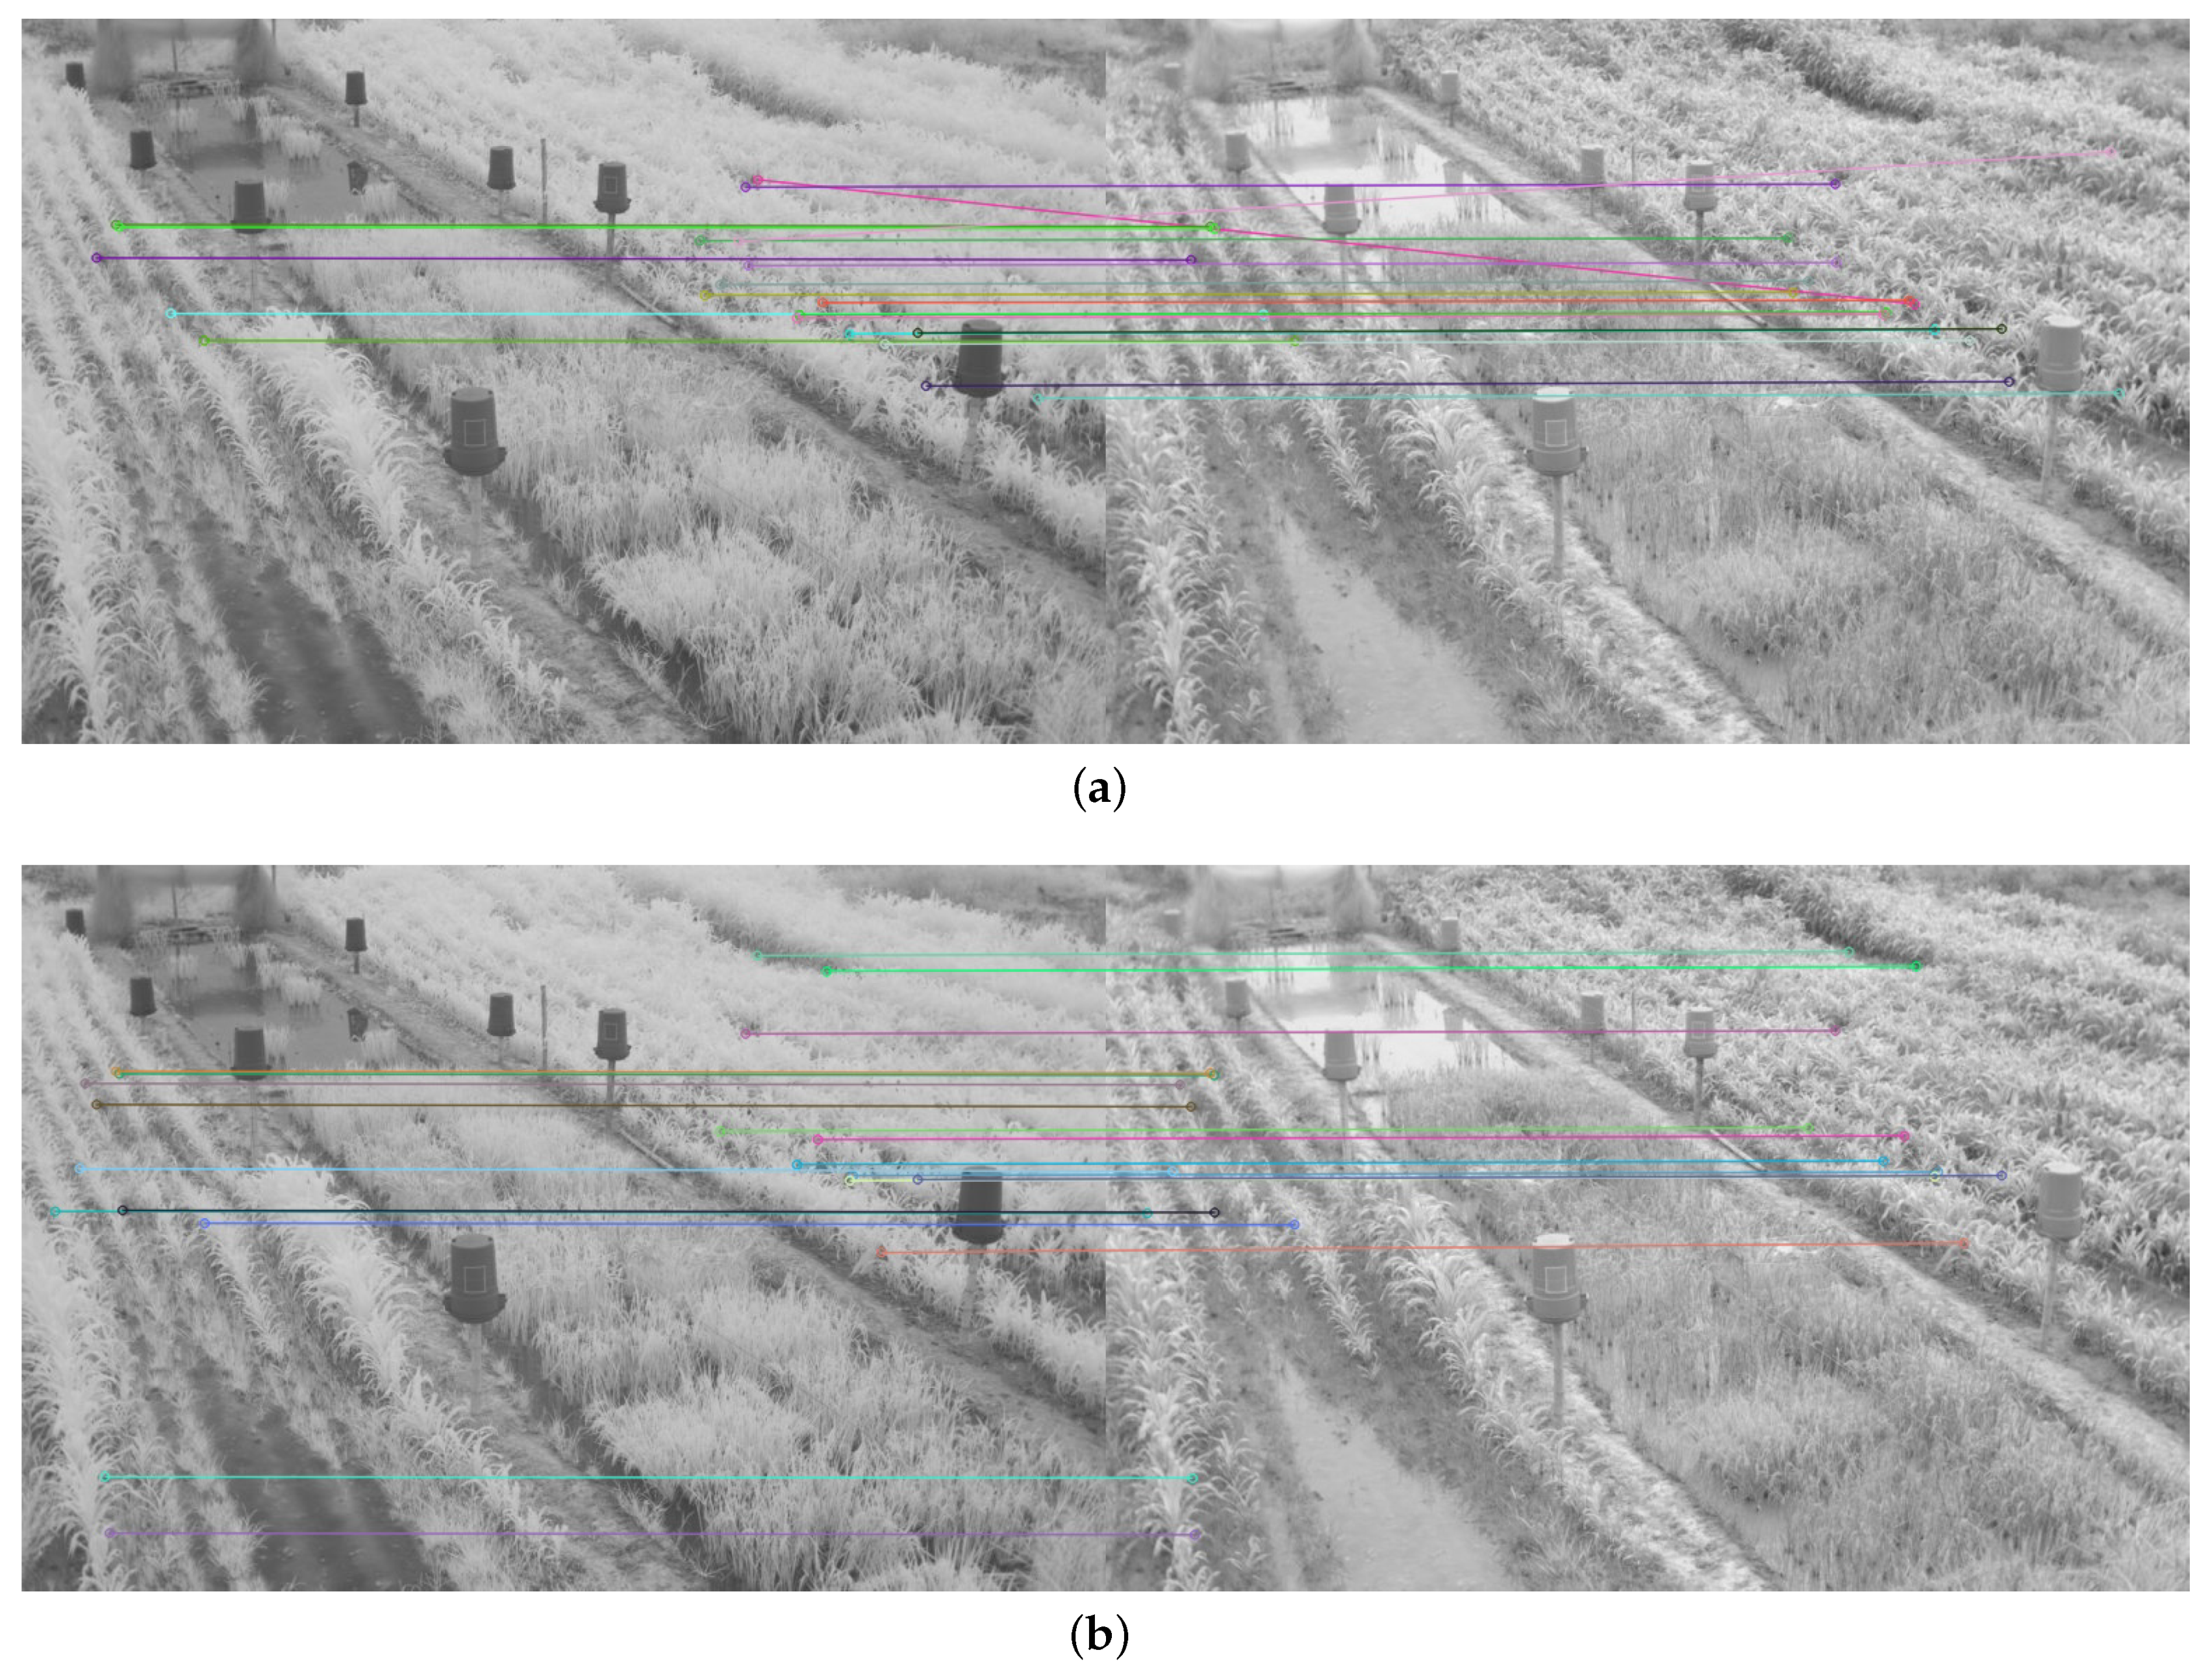
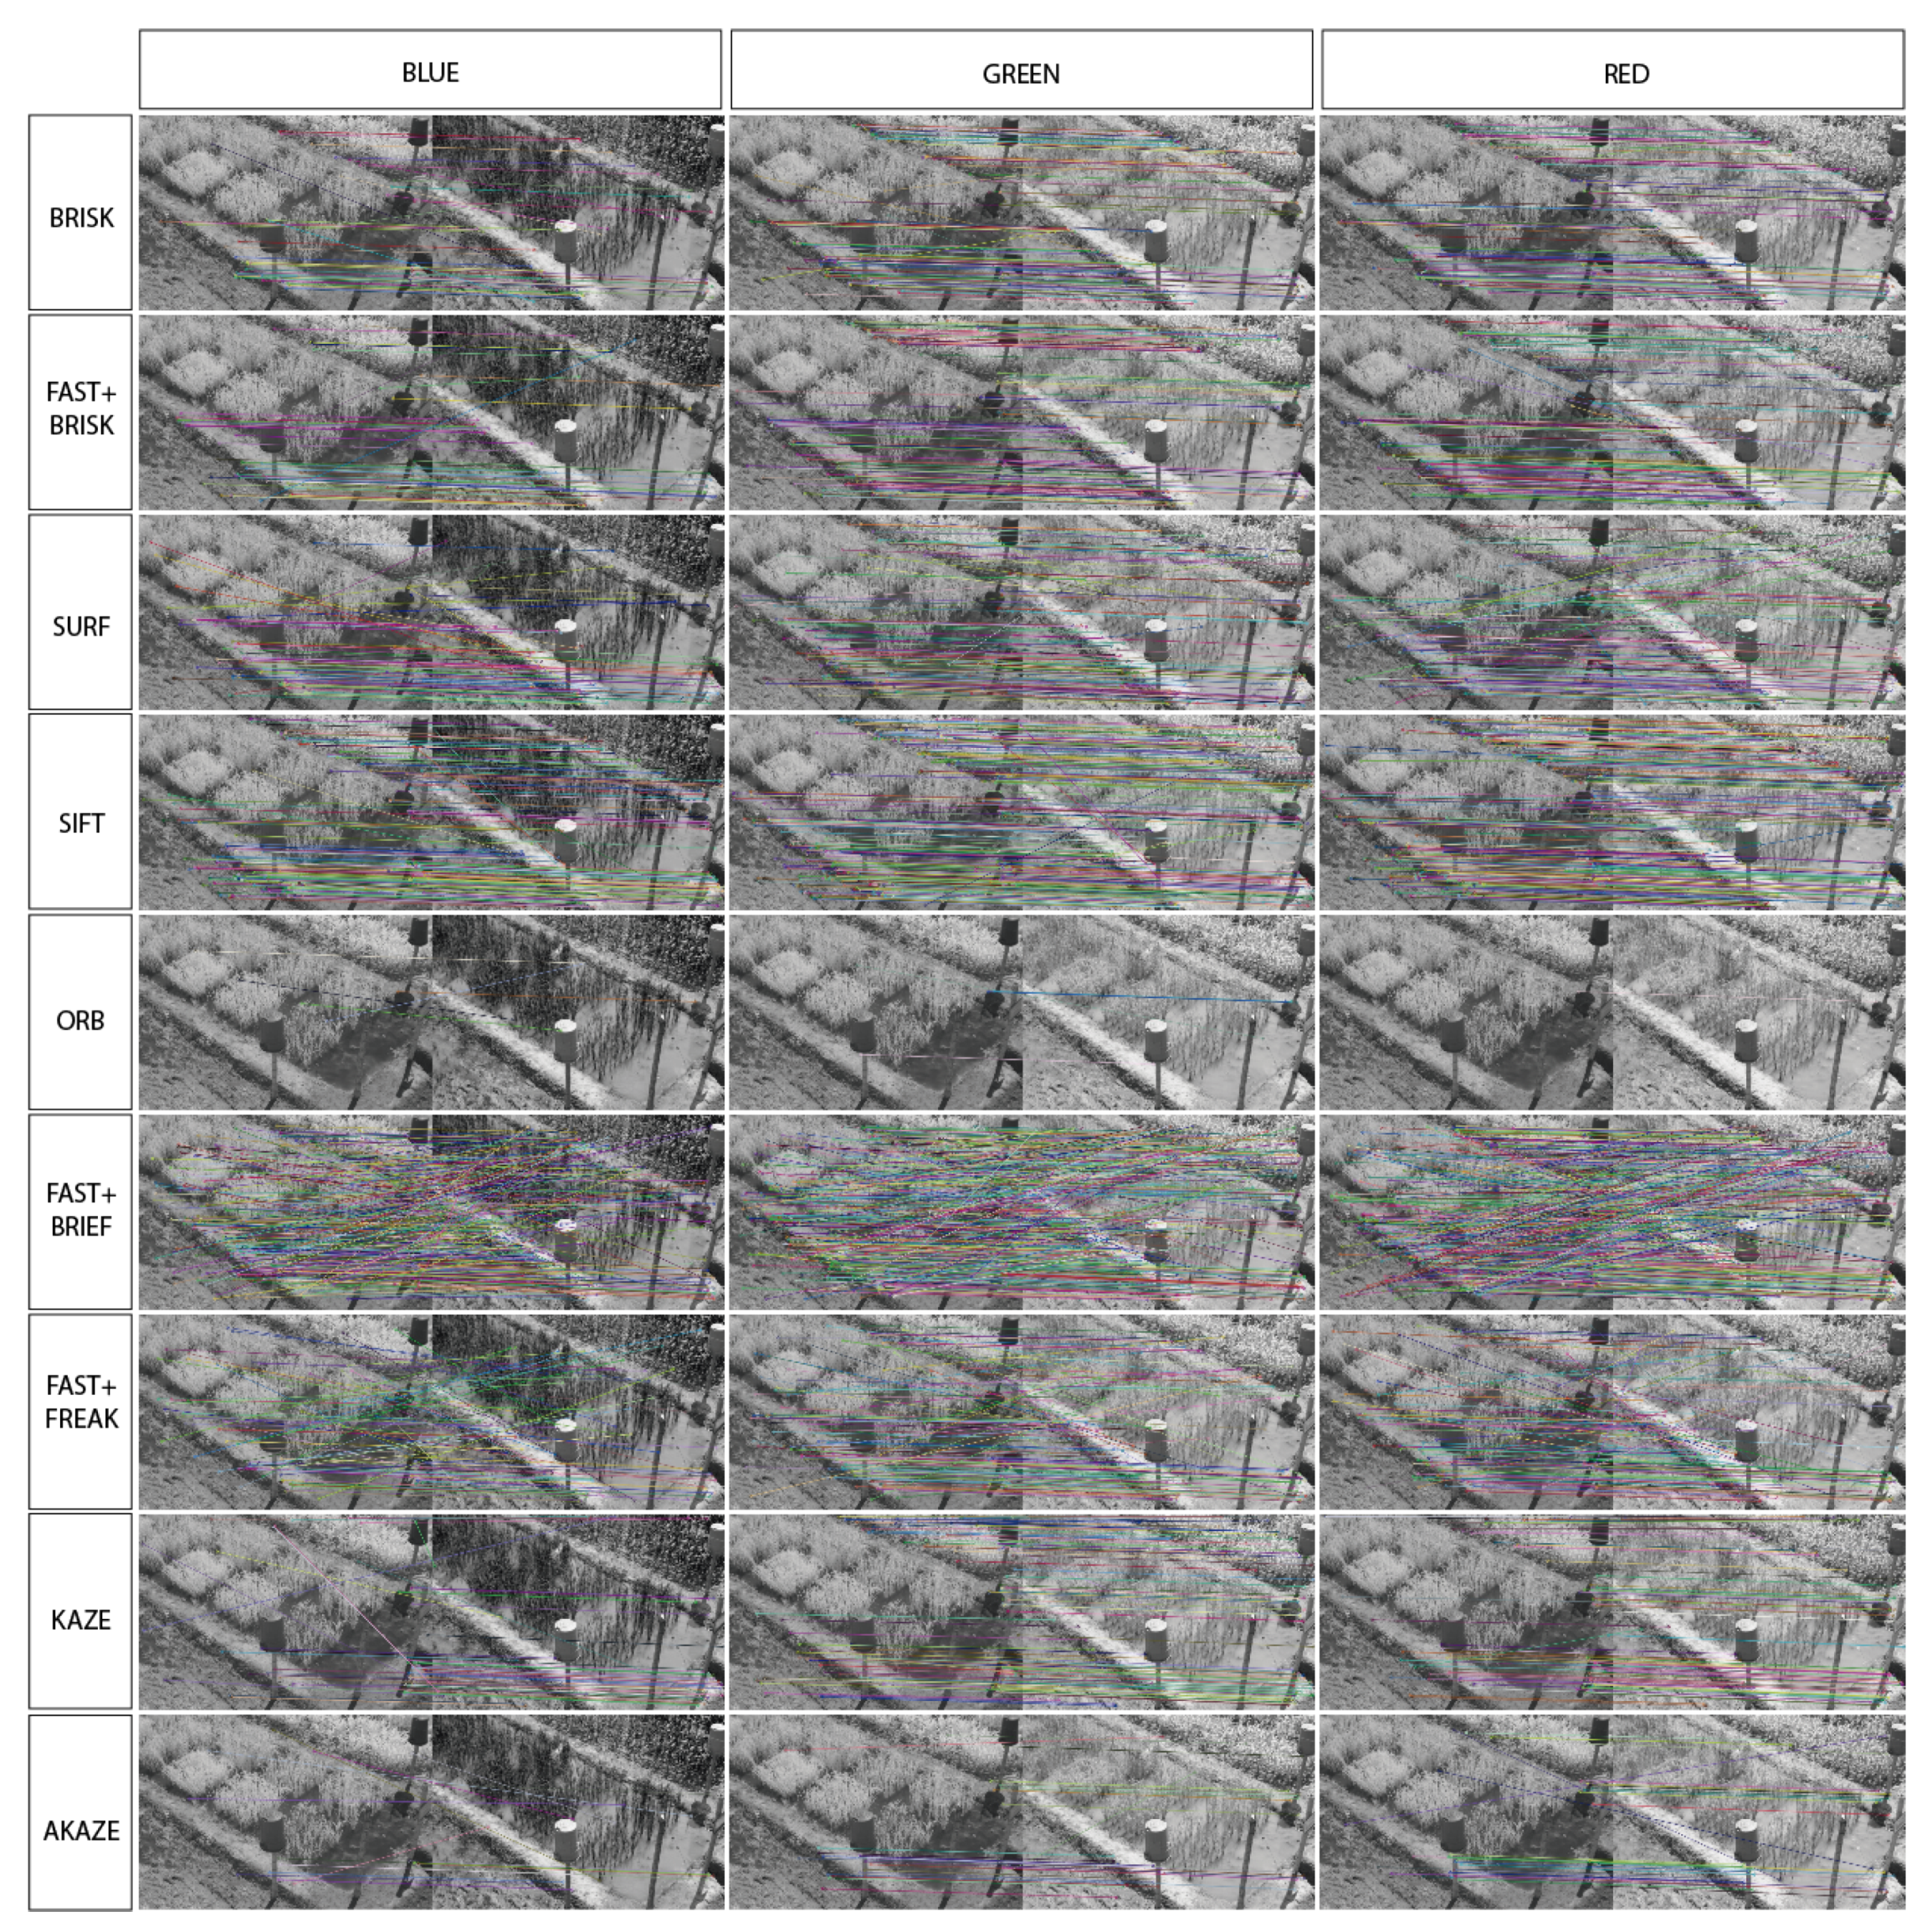
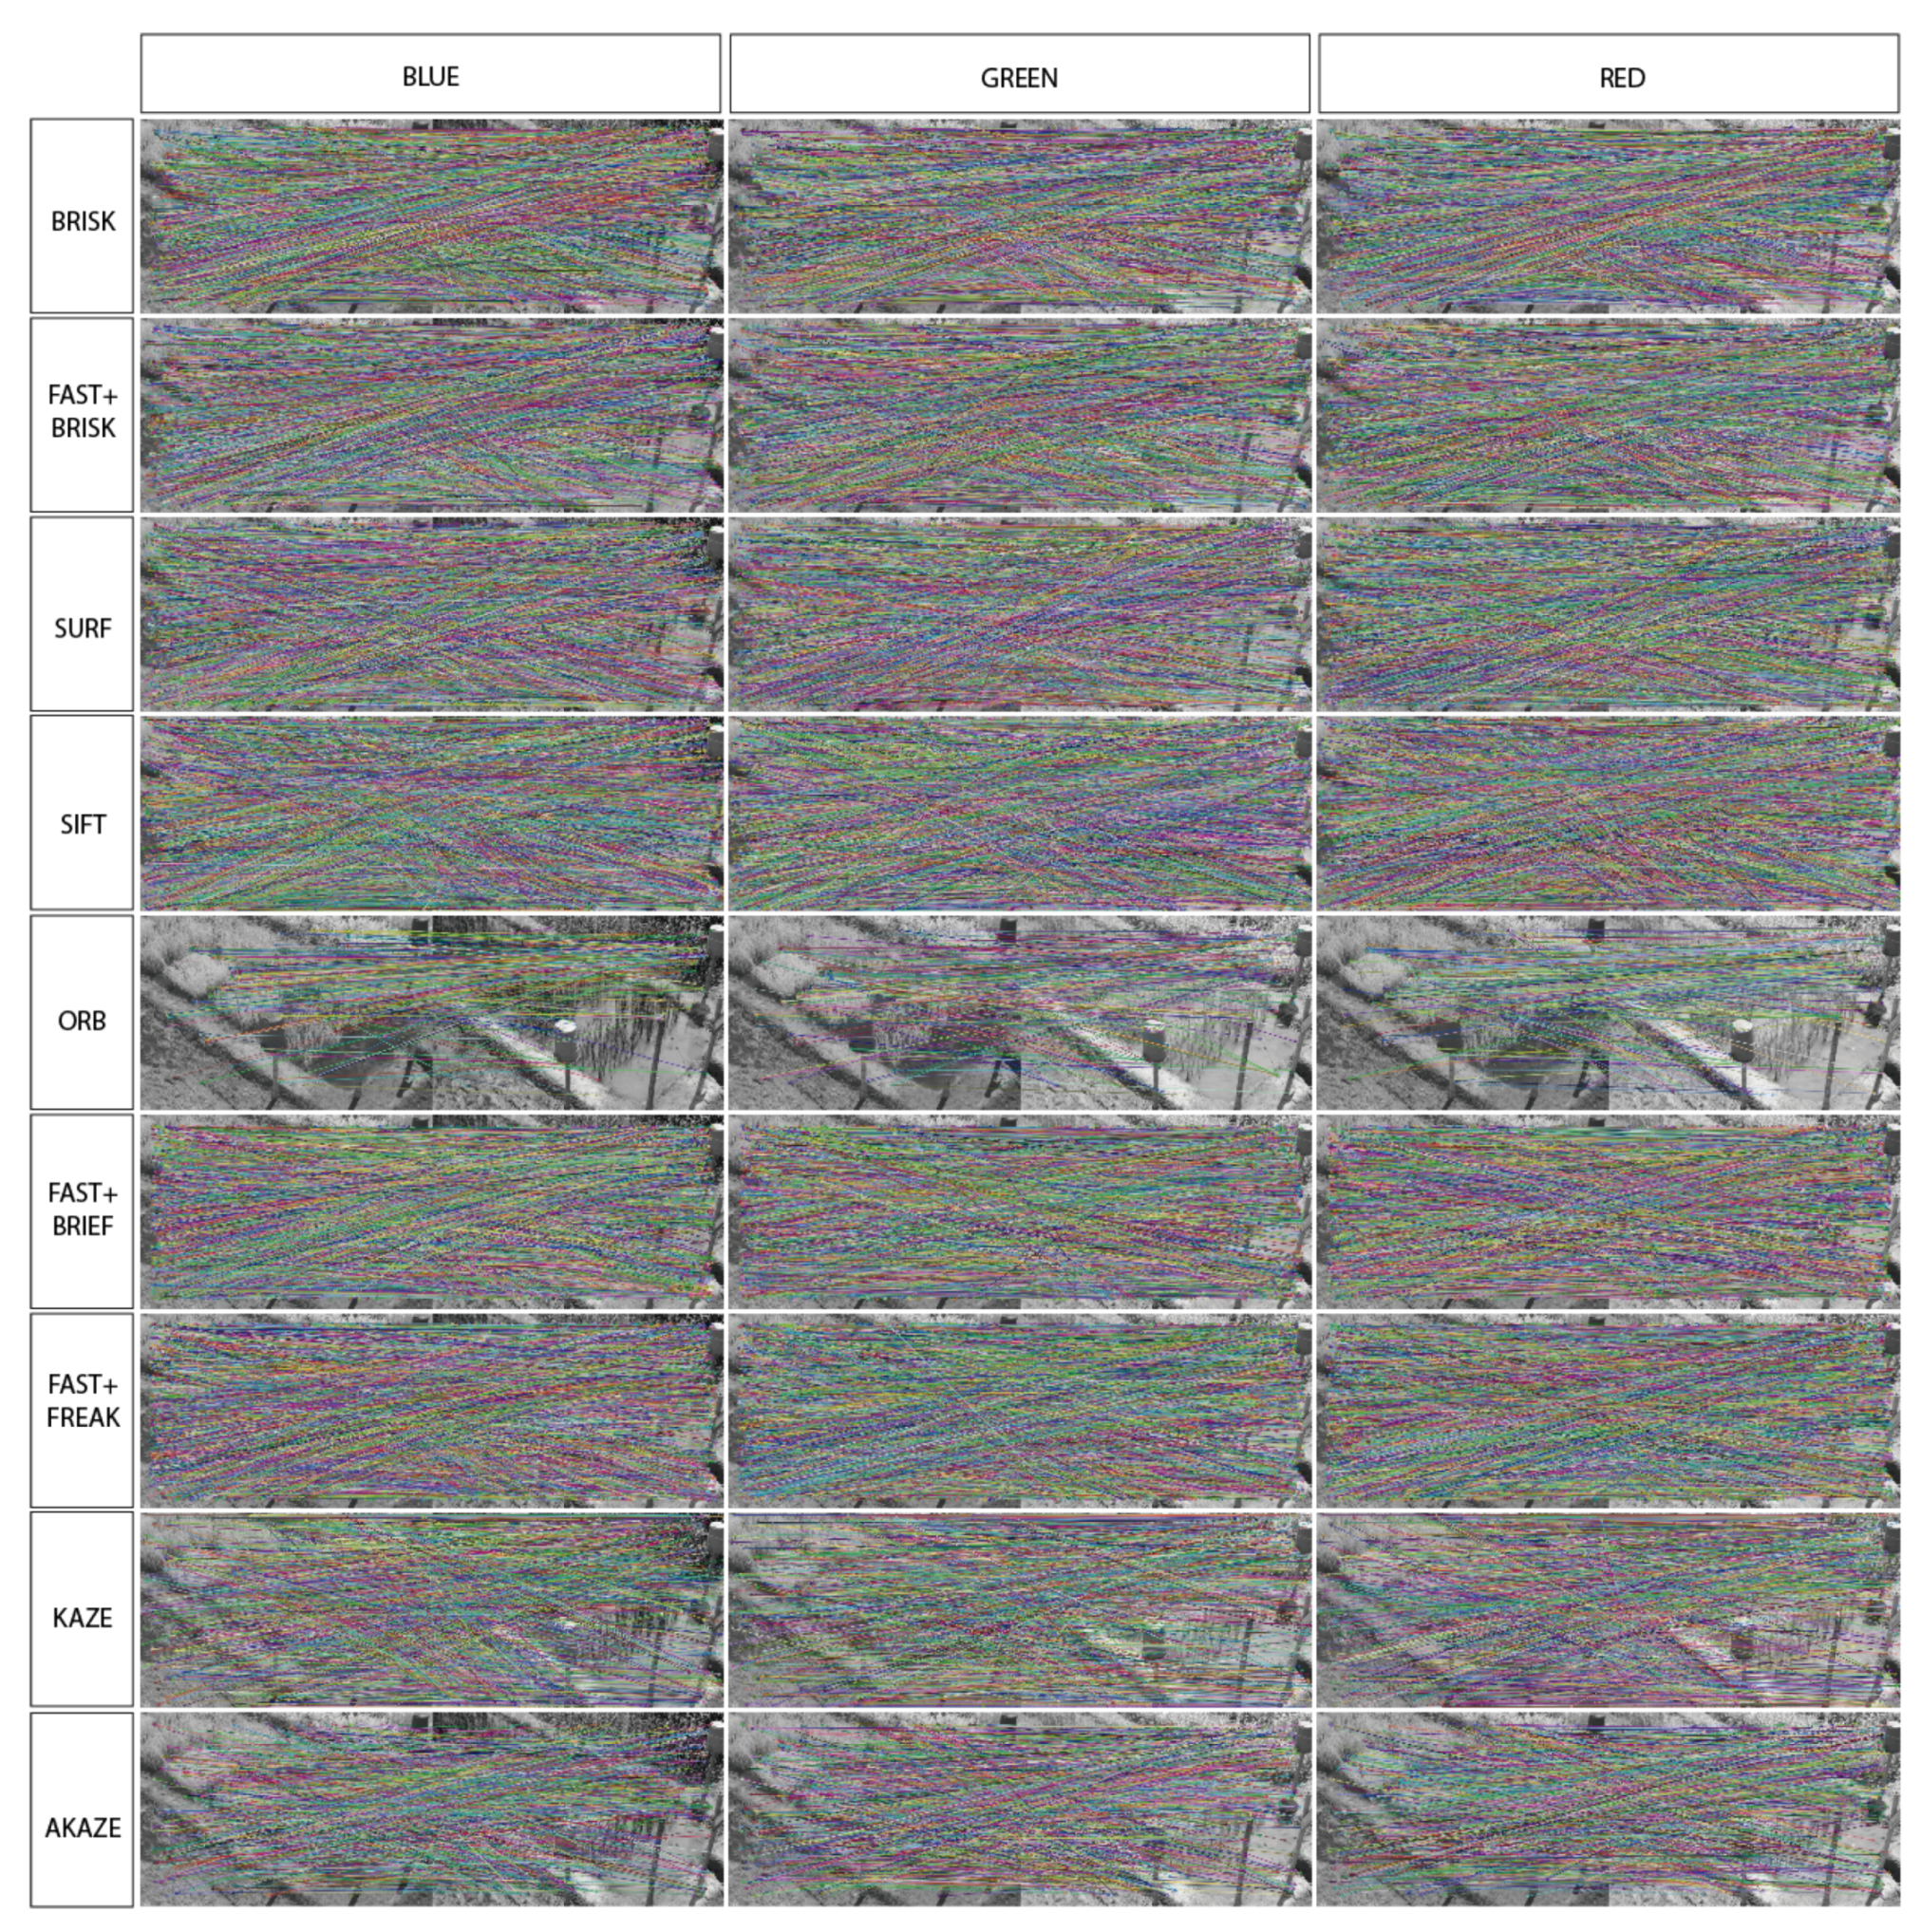
3. Results and Discussion
4. Conclusions
Author Contributions
Funding
Data Availability Statement
Conflicts of Interest
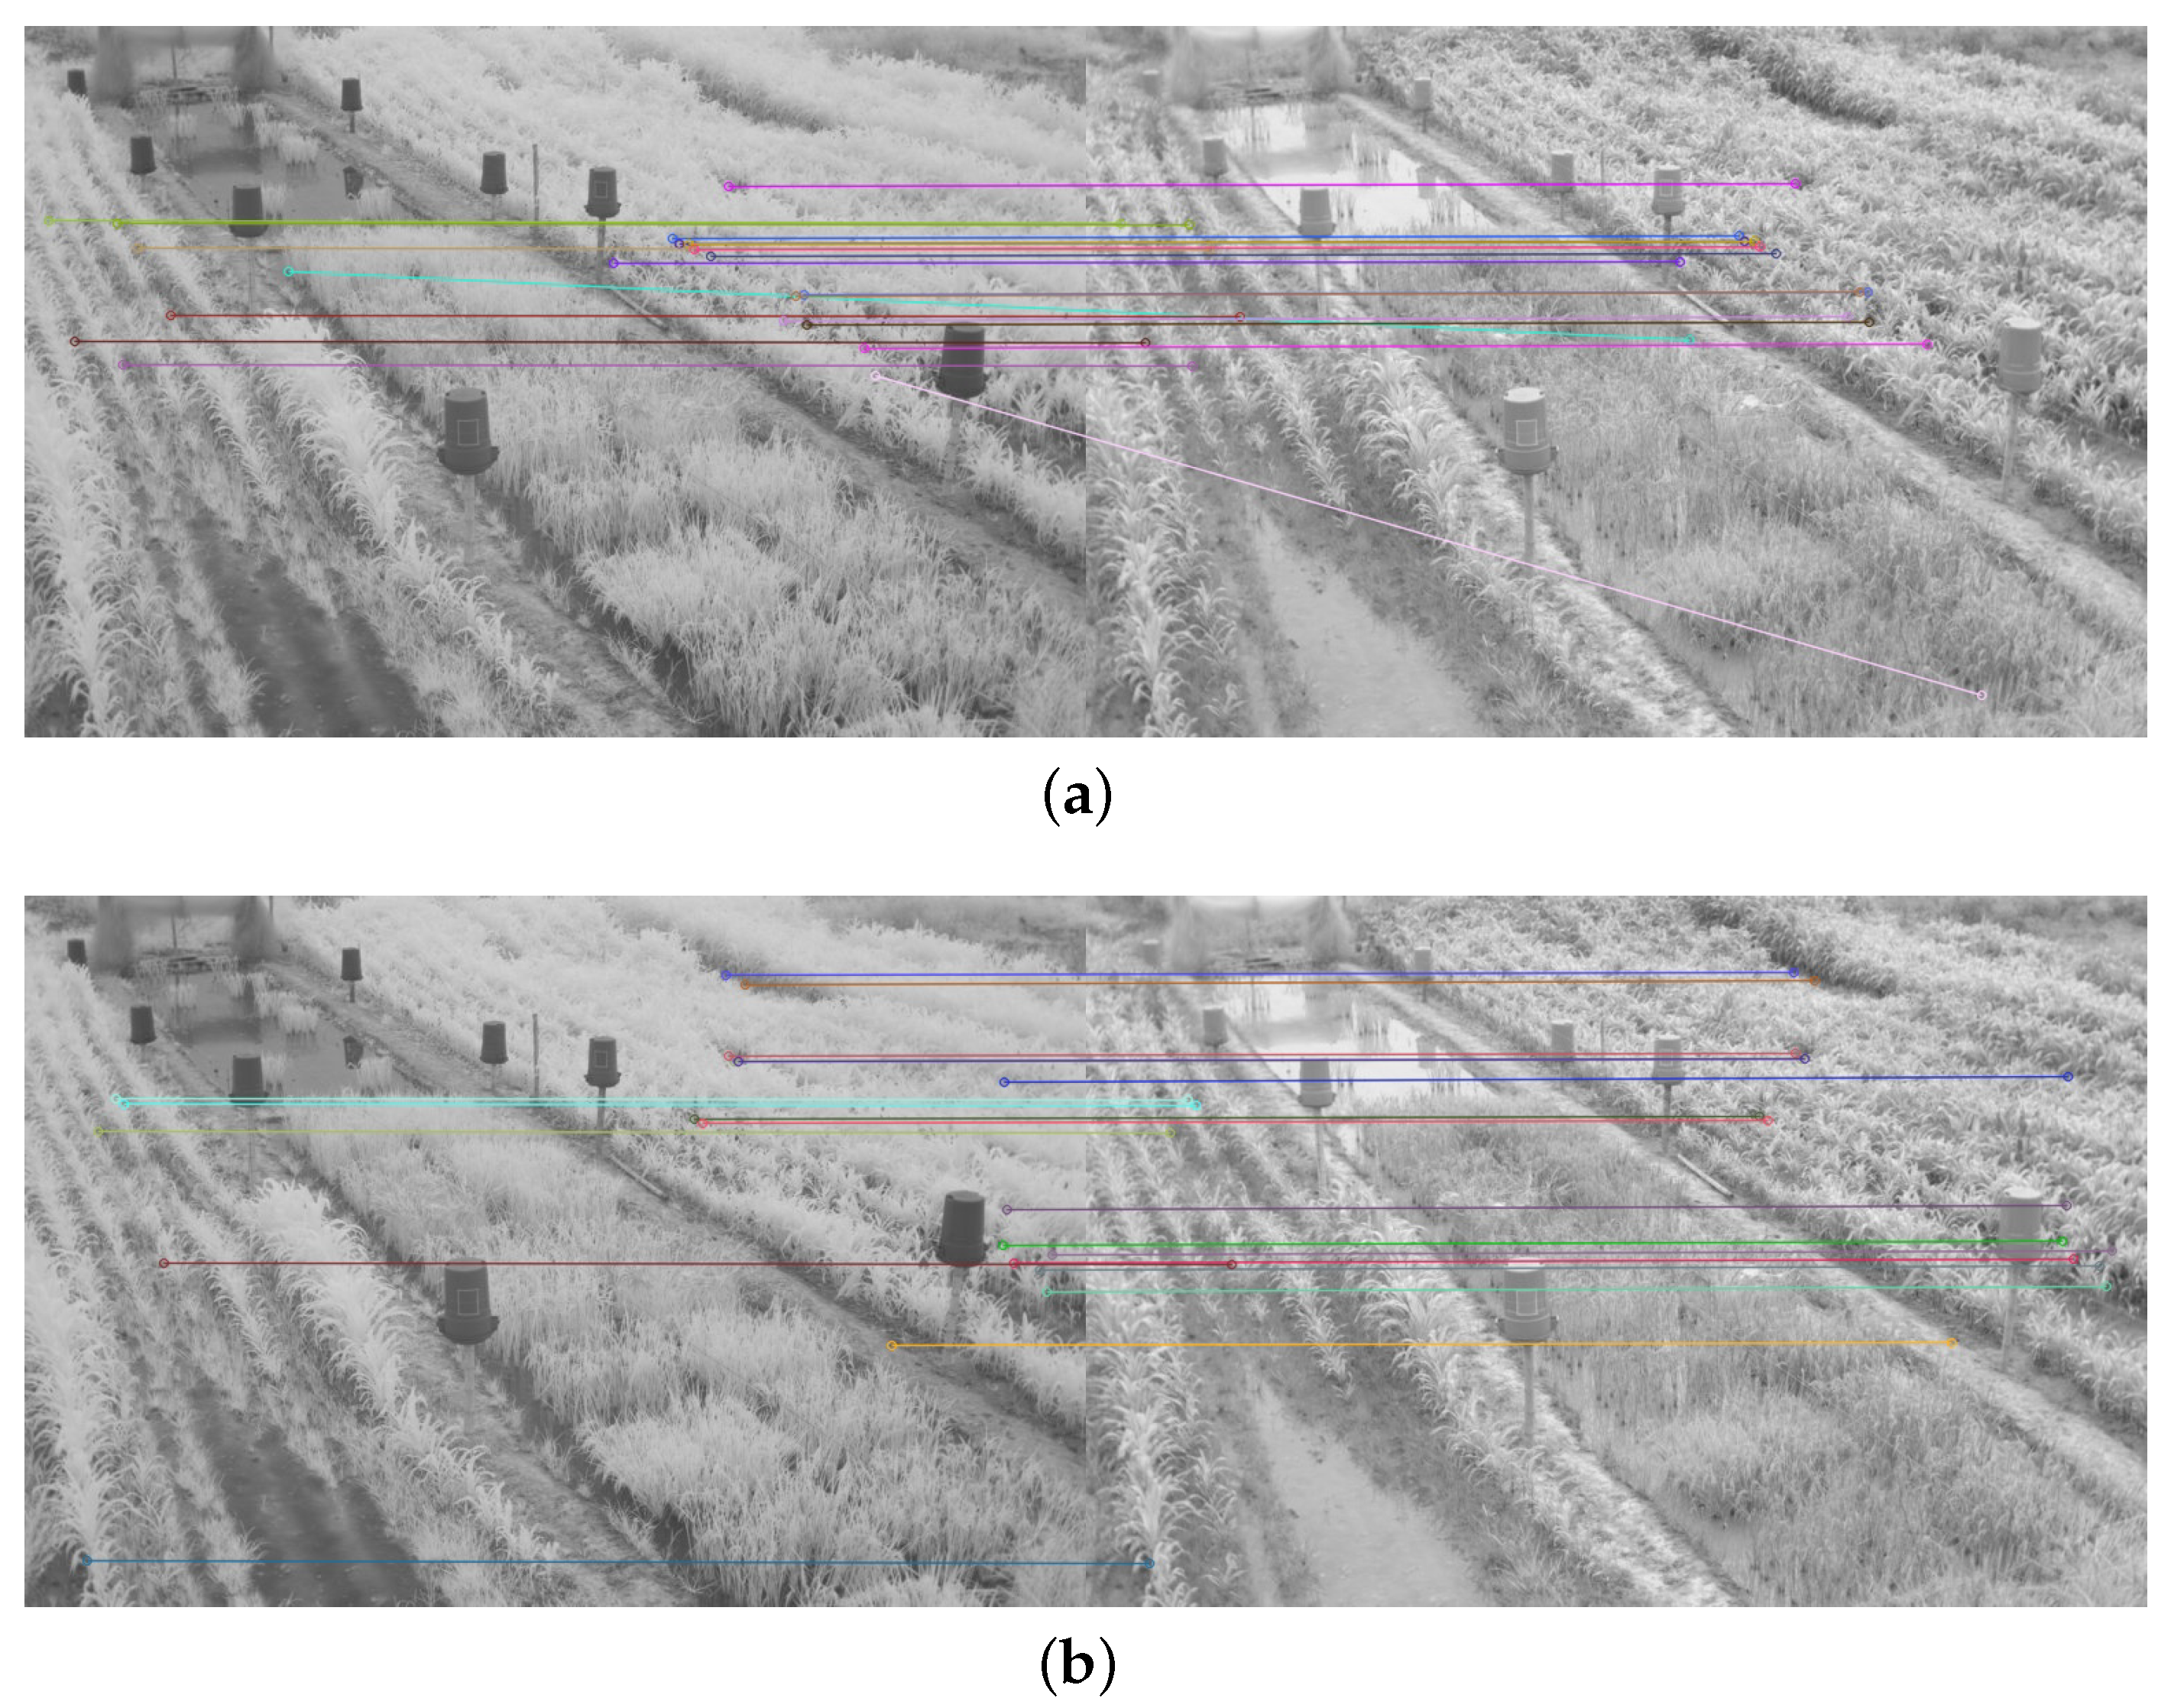
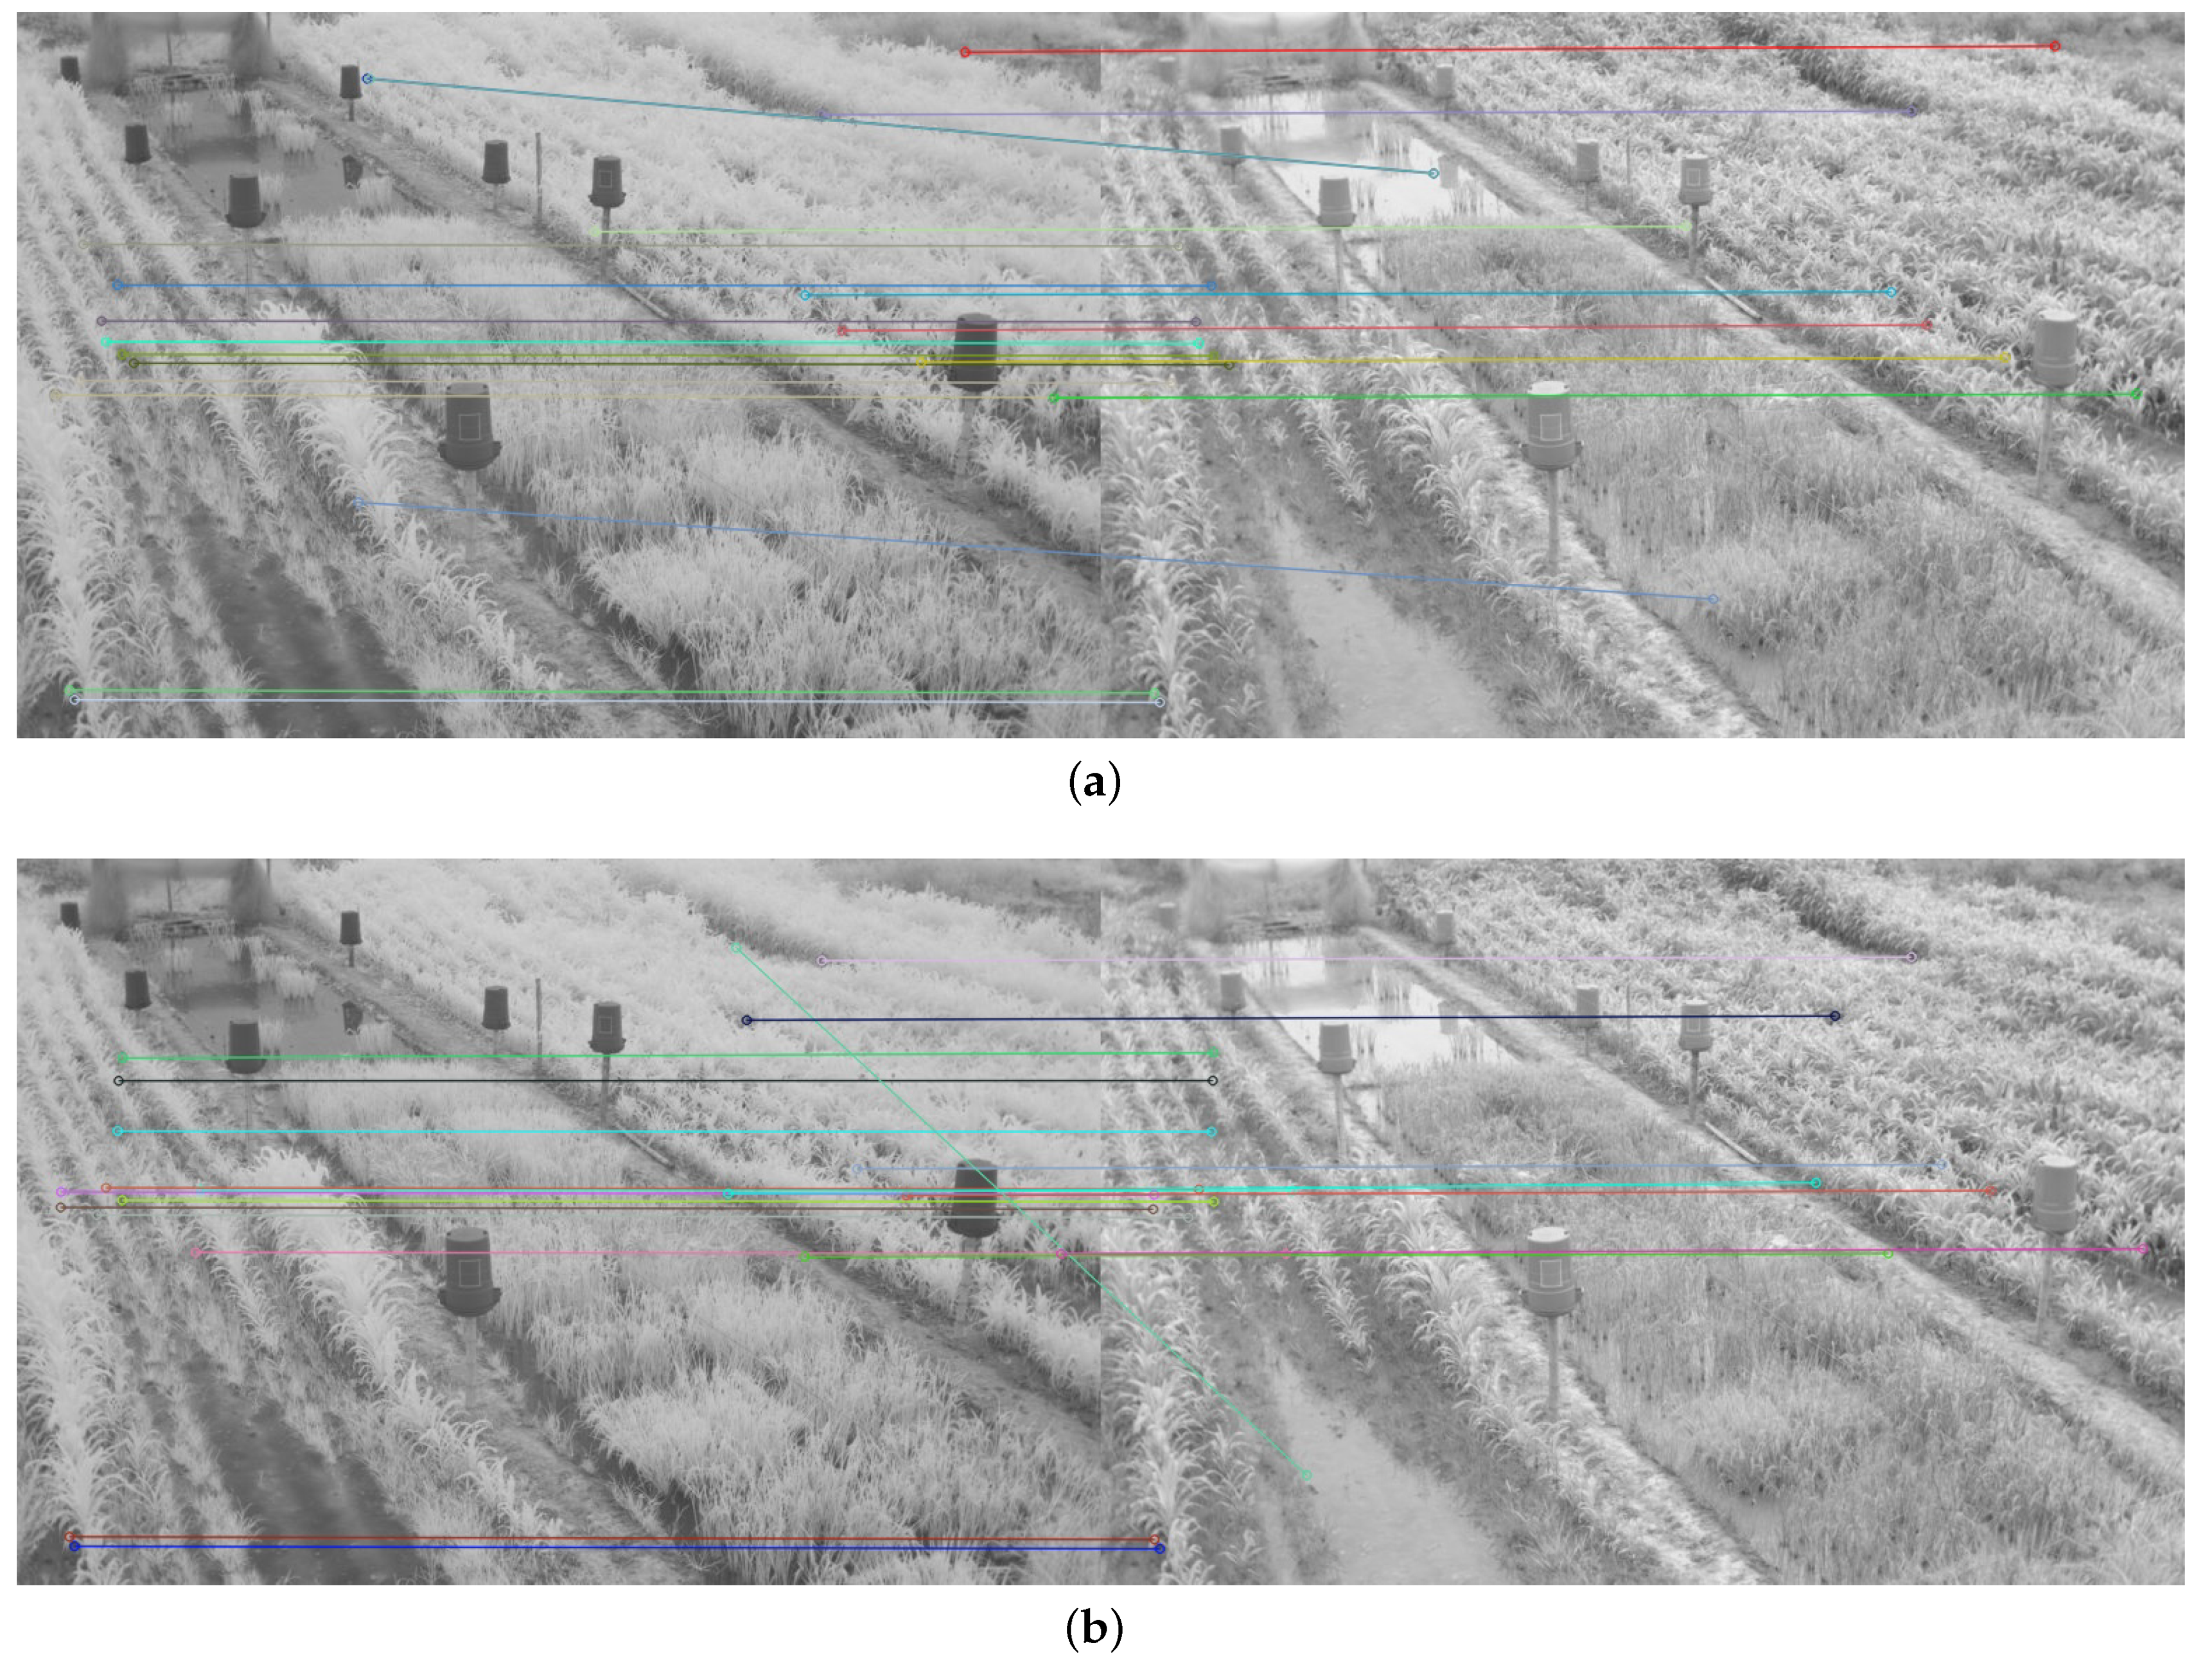
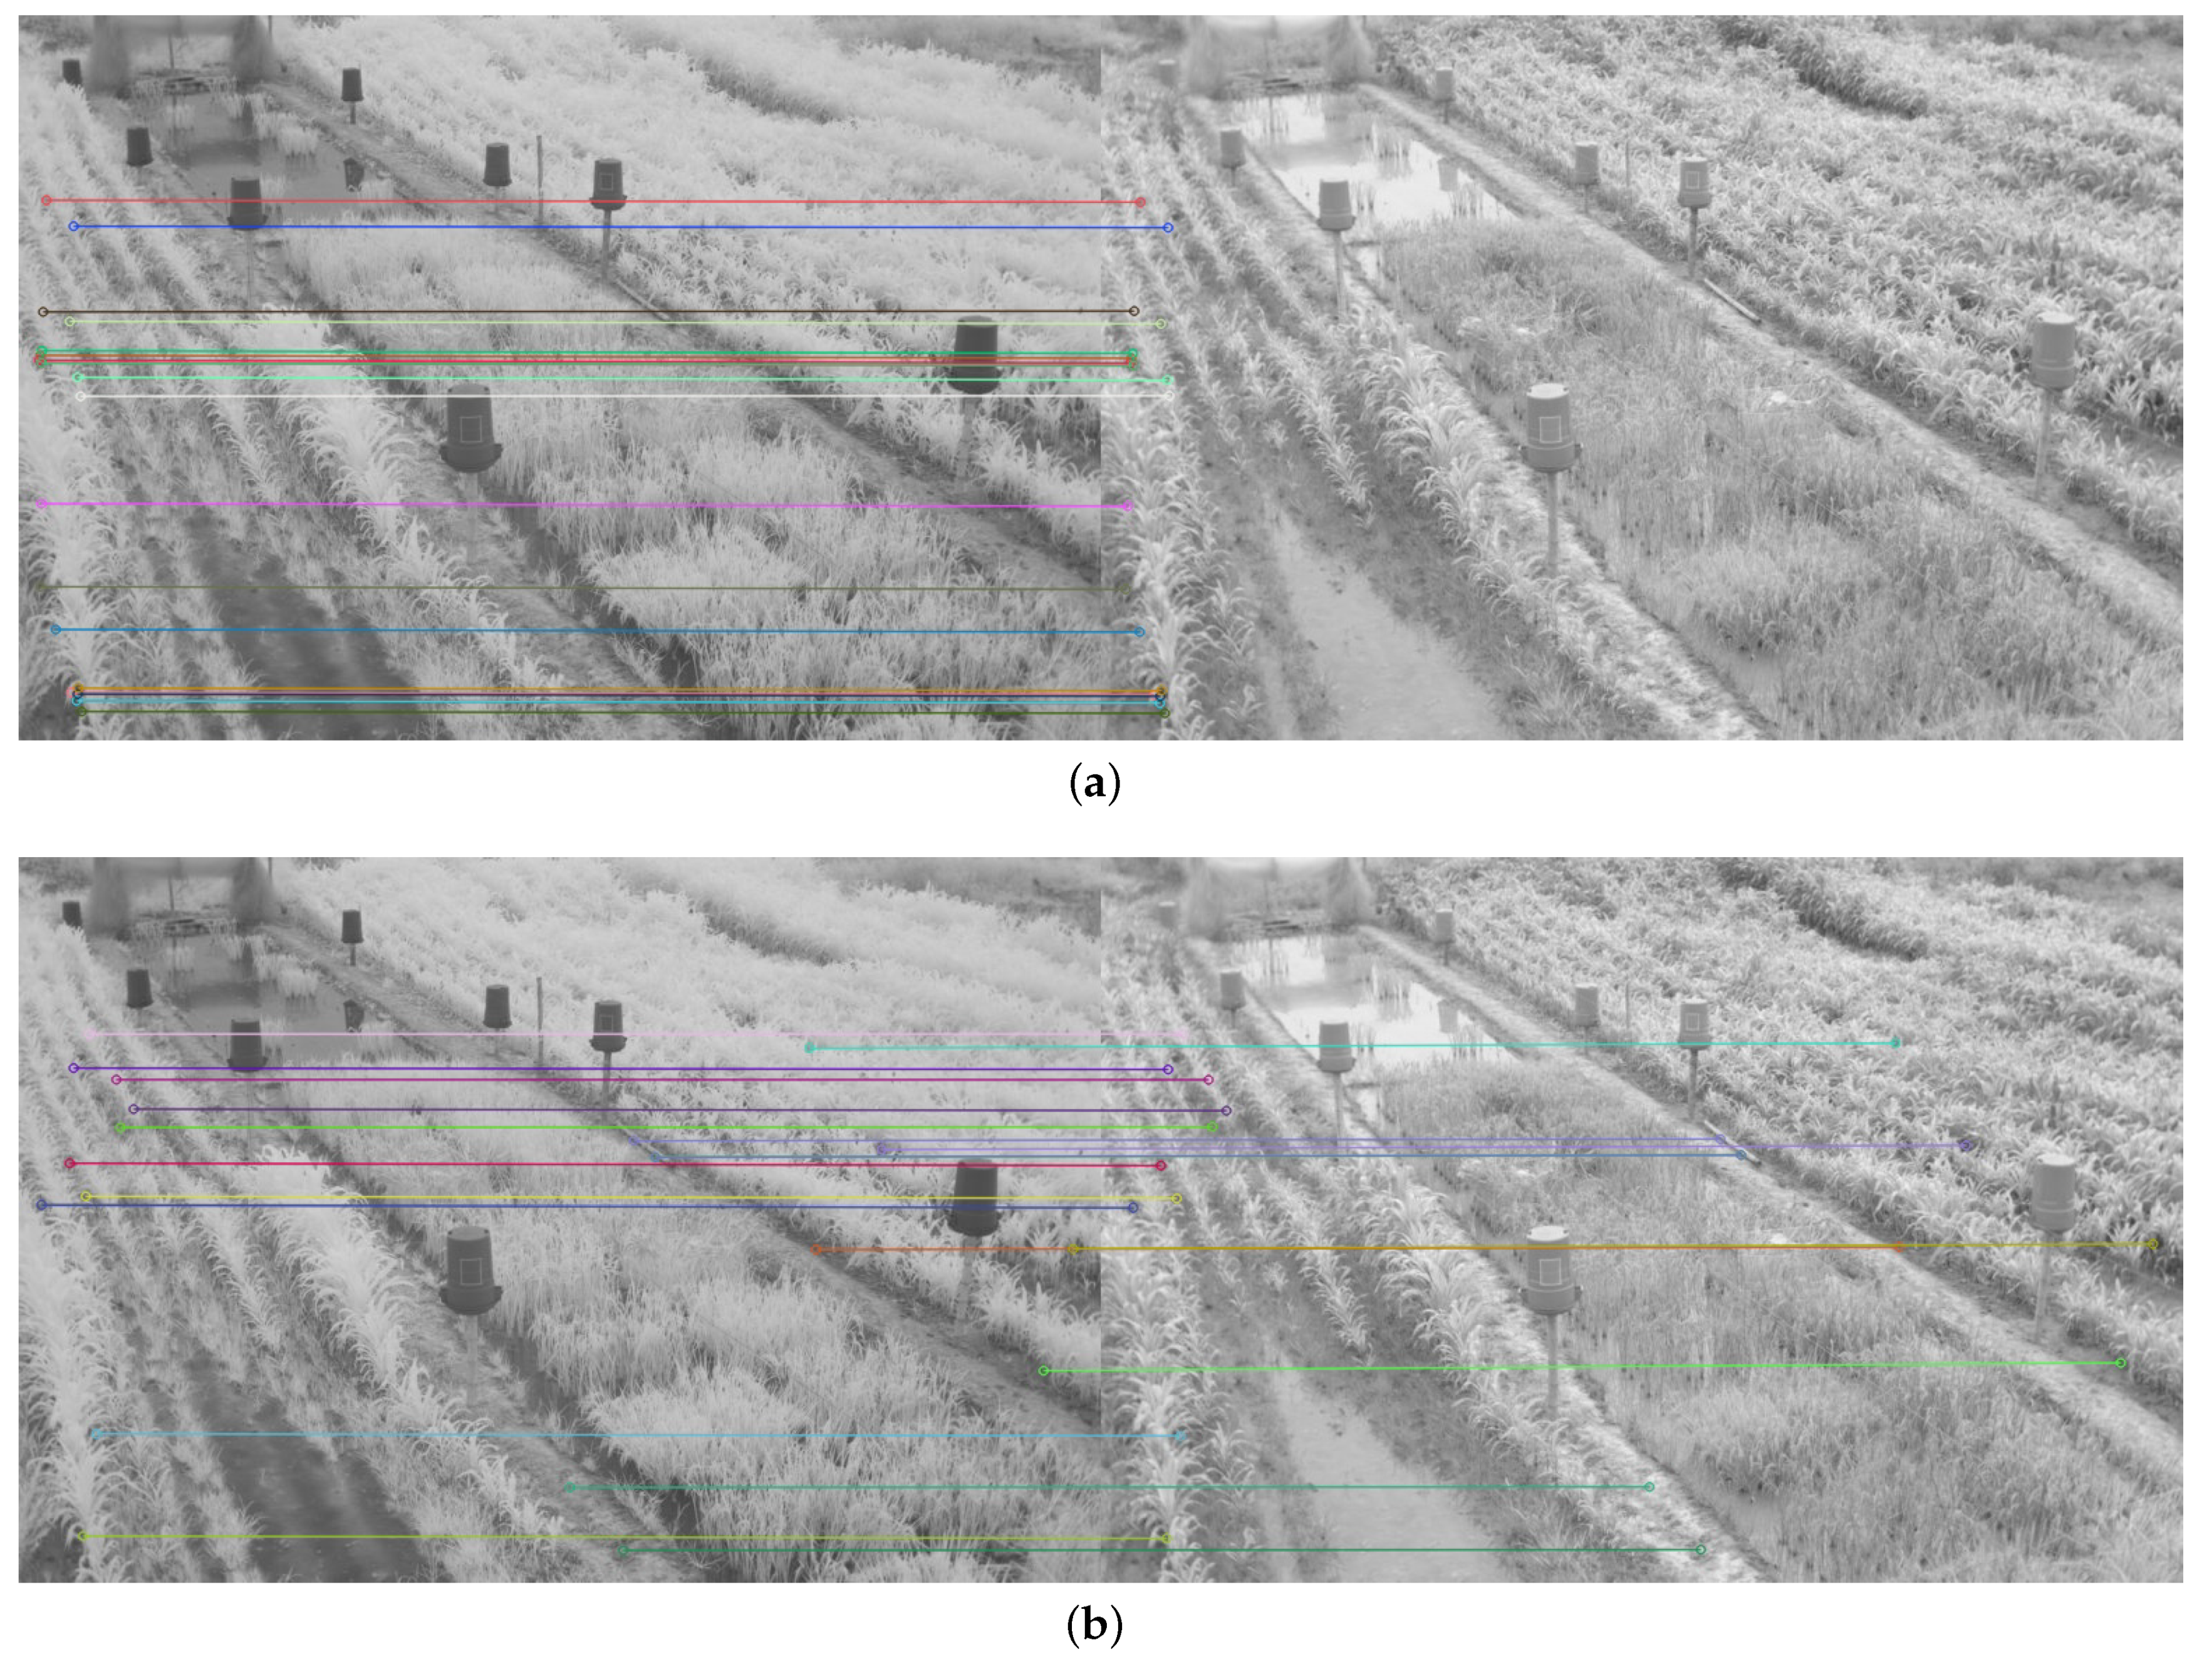
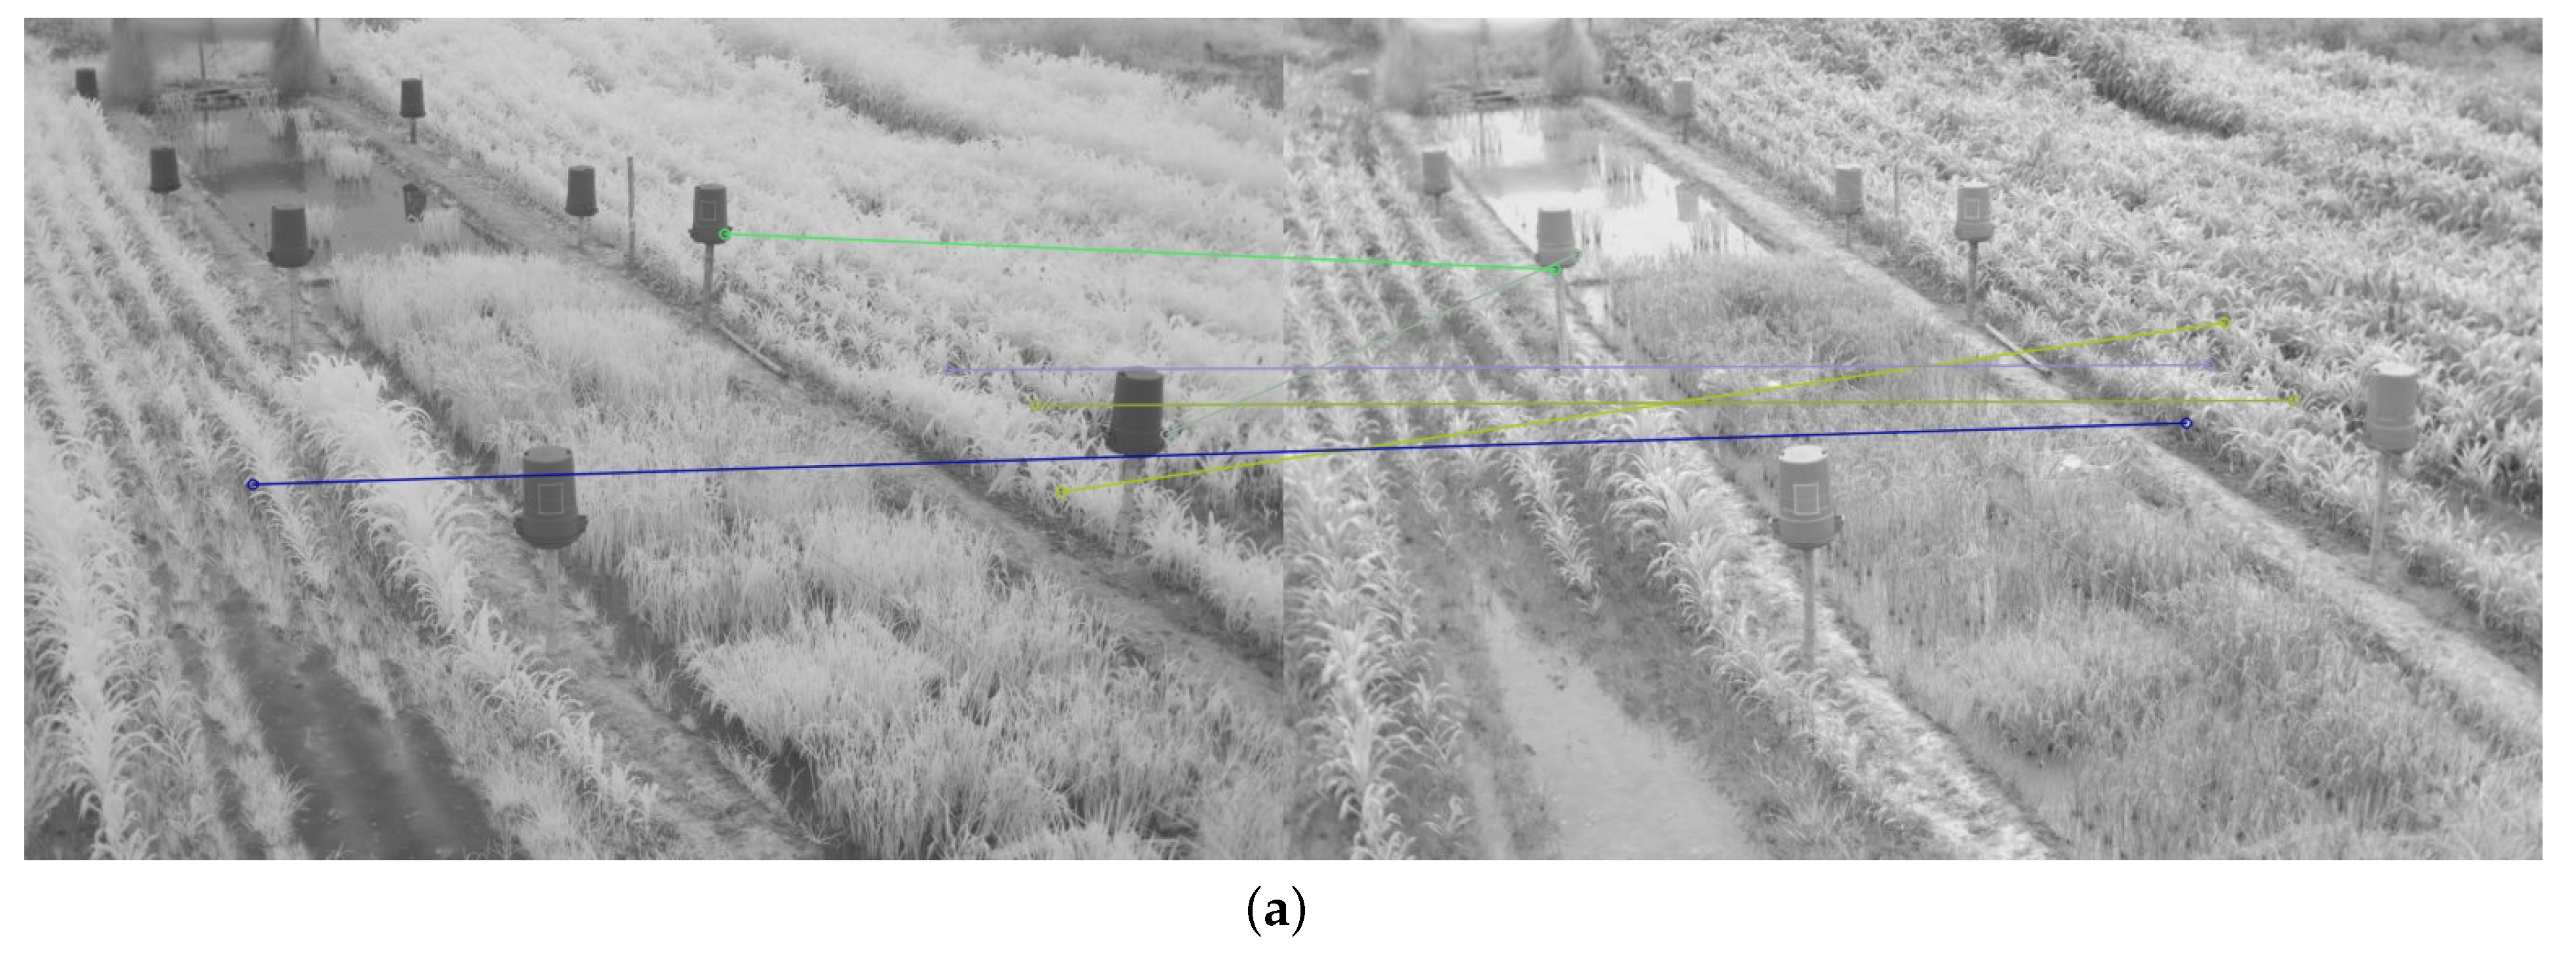
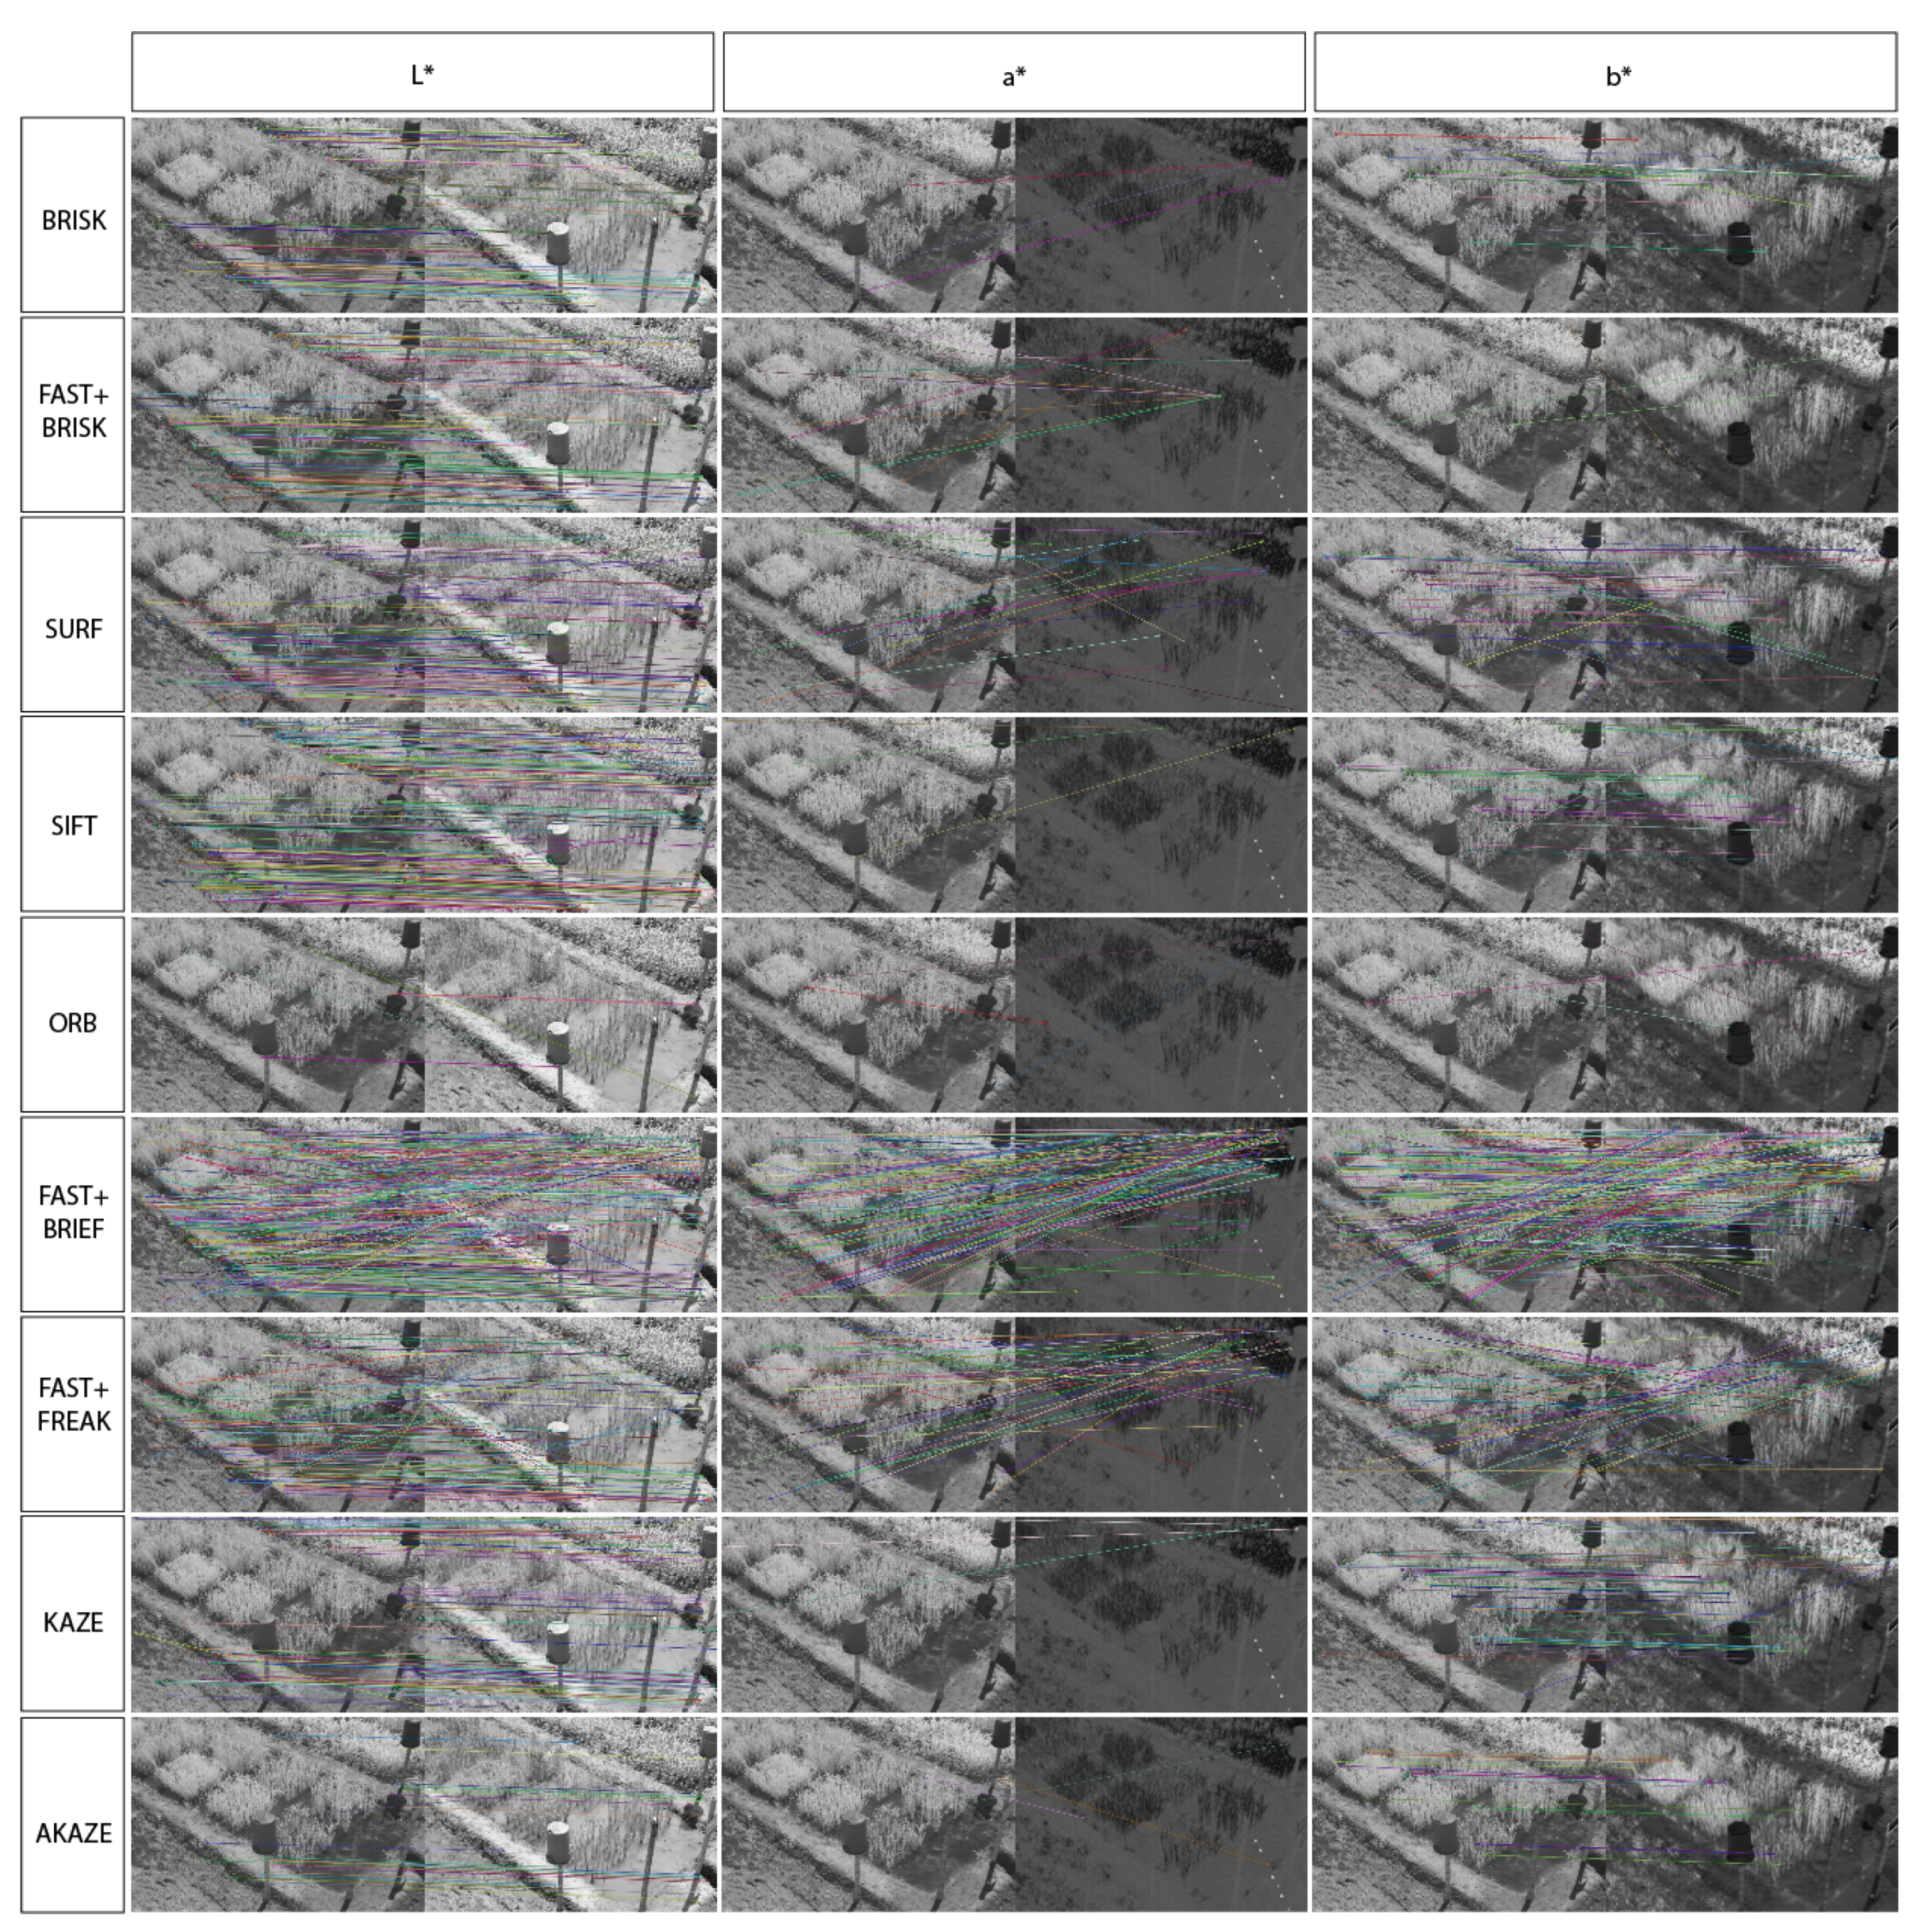
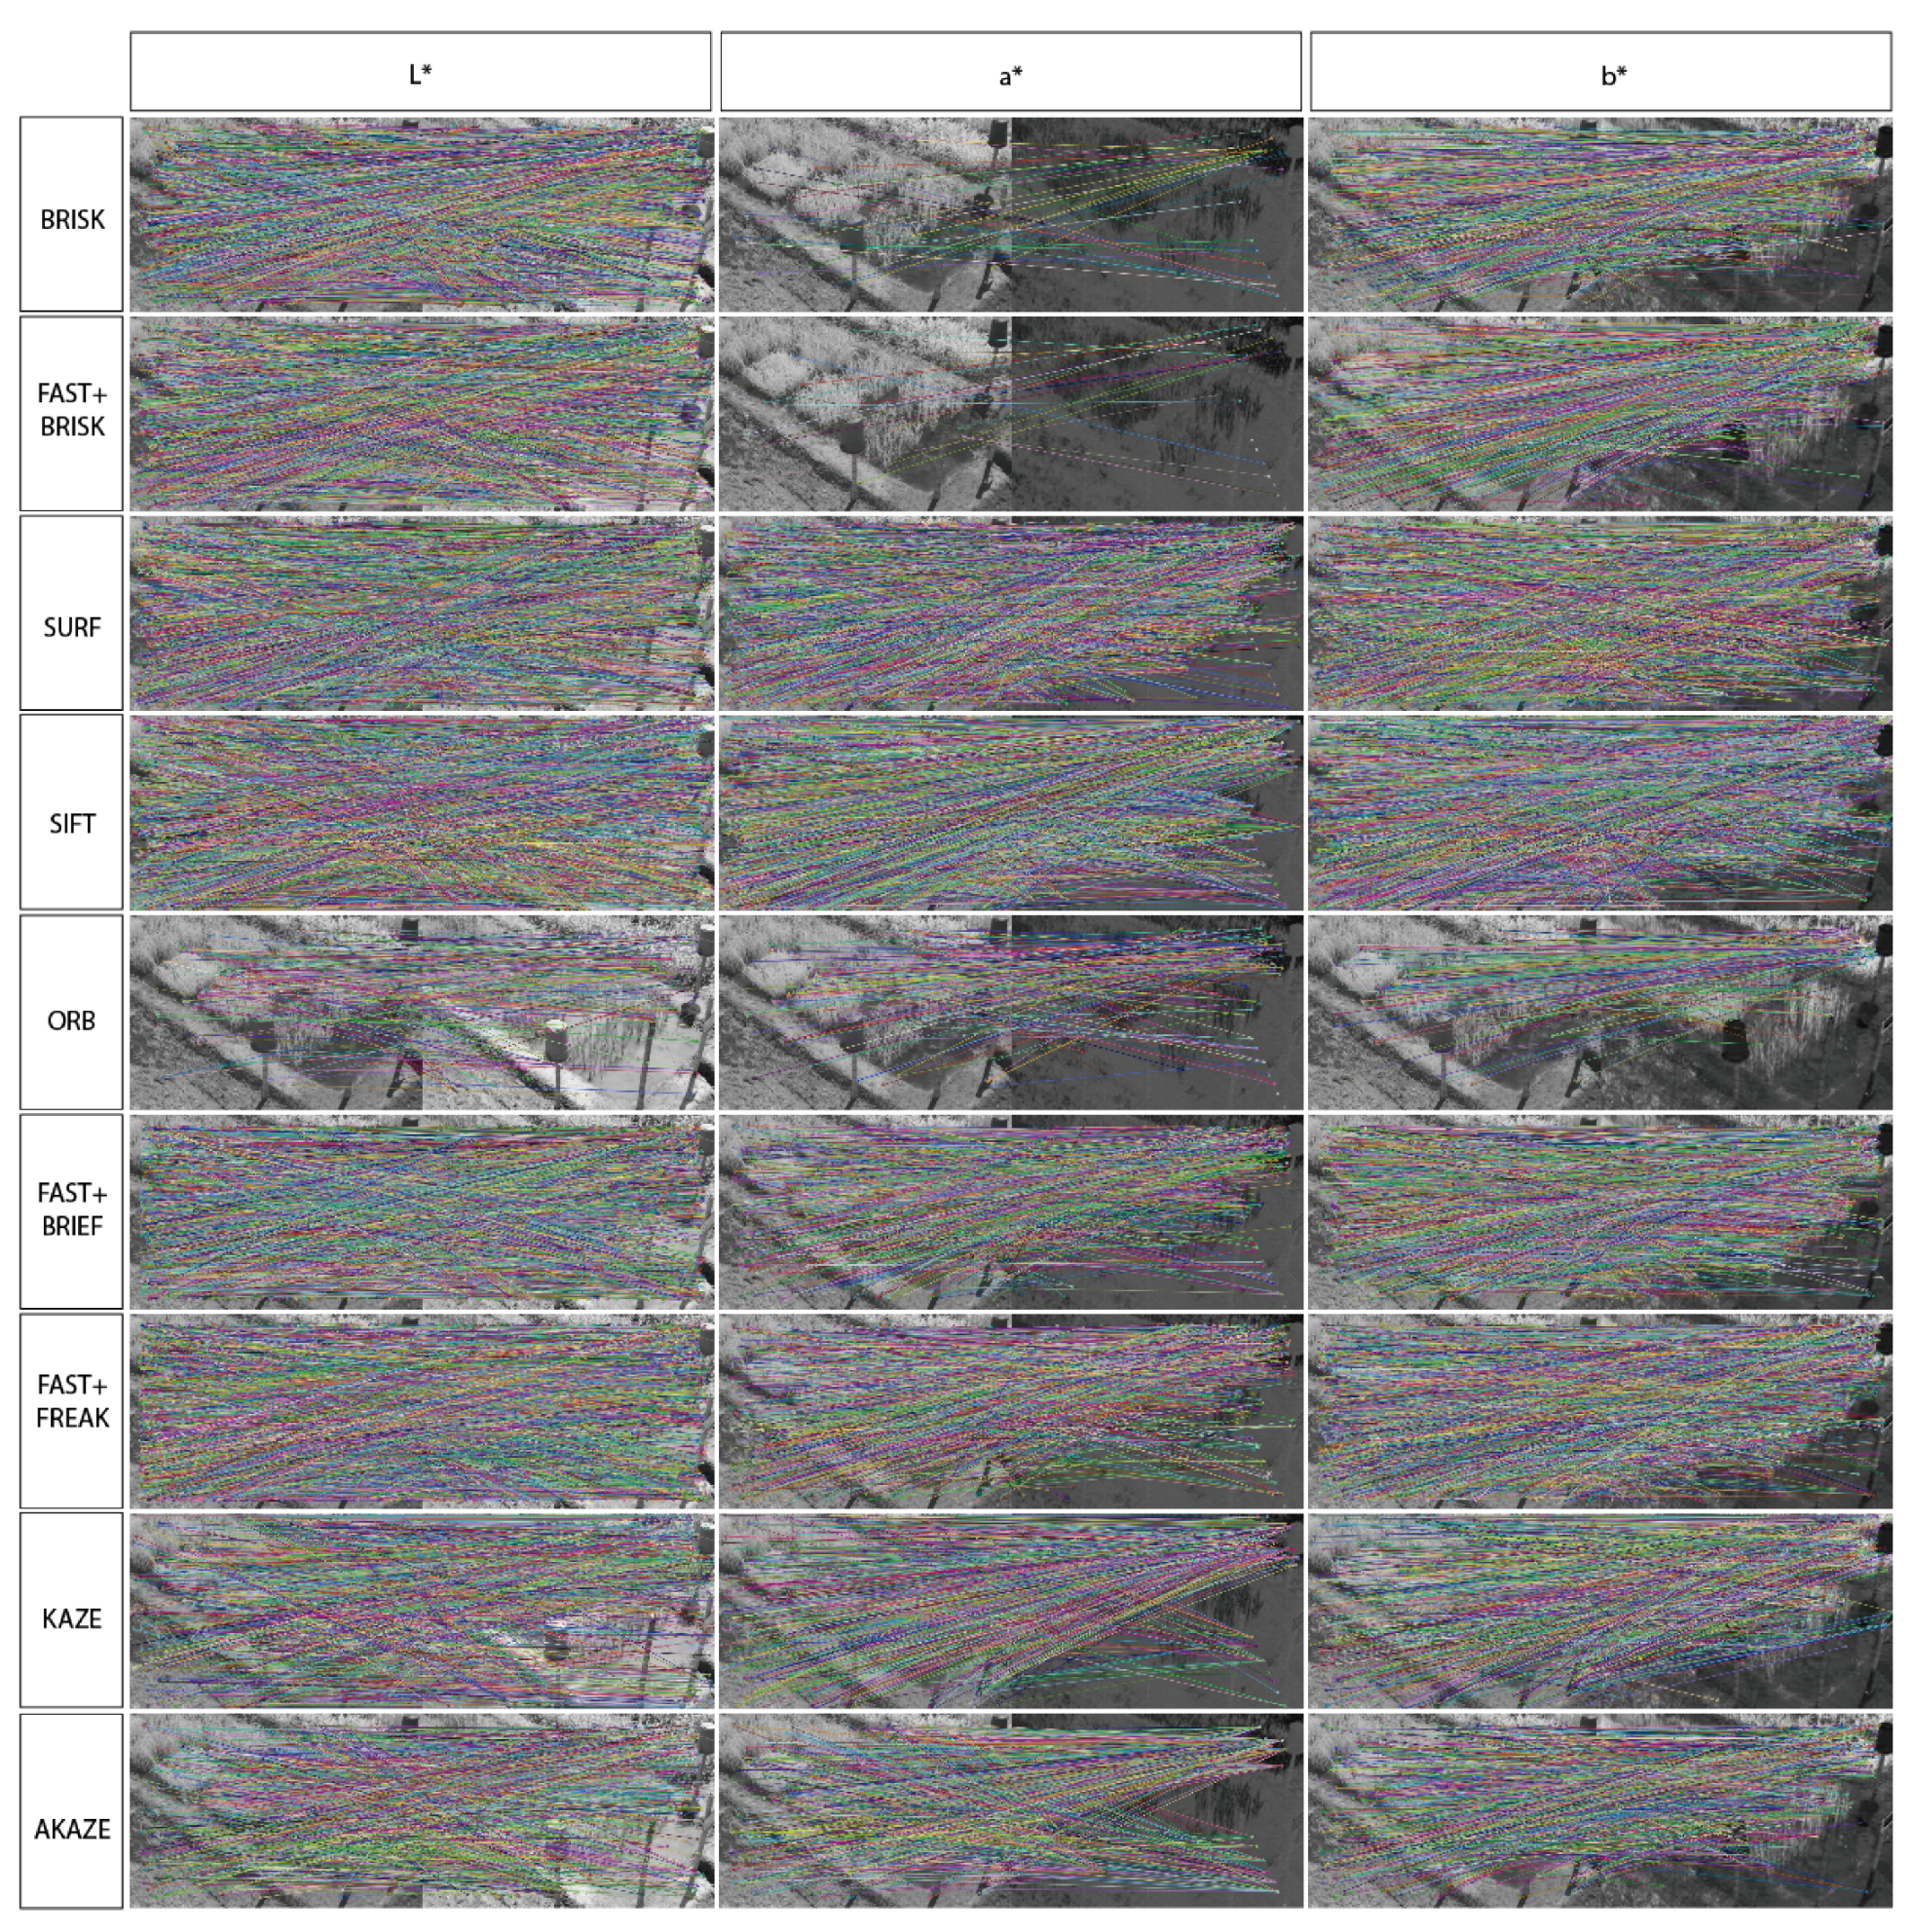
Appendix A. Feature Matching Results with all Detectors and Descriptors on RGB and CIE L*a*b* Images Using FLANN and BF Matching


References
- Tang, Y.; Dananjayan, S.; Hou, C.; Guo, Q.; Luo, S.; He, Y. A survey on the 5G network and its impact on agriculture: Challenges and opportunities. Comput. Electron. Agric. 2021, 180, 105895. [Google Scholar] [CrossRef]
- Barzin, R.; Pathak, R.; Lotfi, H.; Varco, J.; Bora, G.C. Use of UAS Multispectral Imagery at Different Physiological Stages for Yield Prediction and Input Resource Optimization in Corn. Remote Sens. 2020, 12, 2392. [Google Scholar] [CrossRef]
- Saleem, S.; Bais, A.; Sablatnig, R. Towards feature points based image matching between satellite imagery and aerial photographs of agriculture land. Comput. Electron. Agric. 2016, 126, 12–20. [Google Scholar] [CrossRef]
- Russello, H. Convolutional Neural Networks for Crop Yield Prediction. Ph.D. Thesis, University of Amsterdam, Amsterdam, The Netherlands, 2018. [Google Scholar]
- Habib, A.; Han, Y.; Xiong, W.; He, F.; Zhang, Z.; Crawford, M. Automated ortho-rectification of UAV-based hyperspectral data over an agricultural field using frame RGB imagery. Remote Sens. 2016, 8, 796. [Google Scholar] [CrossRef] [Green Version]
- Rondao, D.; Aouf, N.; Richardson, M.A.; Dubois-Matra, O. Benchmarking of local feature detectors and descriptors for multispectral relative navigation in space. Acta Astronaut. 2020, 172, 100–122. [Google Scholar] [CrossRef]
- Yan, J.; Liu, Y. A Stereo Visual Obstacle Detection Approach Using Fuzzy Logic and Neural Network in Agriculture. In Proceedings of the 2018 IEEE International Conference on Robotics and Biomimetics, ROBIO 2018, Kuala Lumpur, Malaysia, 12–15 December 2018; pp. 1539–1544. [Google Scholar] [CrossRef]
- Chen, S.; Yuan, X.; Yuan, W.; Niu, J.; Xu, F.; Zhang, Y. Matching Multi-Sensor Remote Sensing Images via an Affinity Tensor. Remote Sens. 2018, 10, 1104. [Google Scholar] [CrossRef] [Green Version]
- Jiang, J.; Feng, X.; Liu, F.; Xu, Y.; Huang, H. Multi-Spectral RGB-NIR Image Classification Using Double-Channel CNN. IEEE Access 2019, 7, 20607–20613. [Google Scholar] [CrossRef]
- Yang, Q.; Shi, L.; Han, J.; Zha, Y.; Zhu, P. Deep convolutional neural networks for rice grain yield estimation at the ripening stage using UAV-based remotely sensed images. Field Crop. Res. 2019, 235, 142–153. [Google Scholar] [CrossRef]
- Forero, M.G.; Acosta, A.; Ducuara, A.S.; Godoy, Y.A.; Moreno, J.G. Comparative Analysis of Interest Points Detection Techniques for the Registration of Infrared and Visible Aerial Photographs in Pasture Crops. In Proceedings of the SPIE 11137, Applications of Digital Image Processing XLII, 111370G, San Diego, CA, USA, 6 September 2019. [Google Scholar] [CrossRef]
- Haghverdi, A.; Washington-Allen, R.A.; Leib, B.G. Prediction of cotton lint yield from phenology of crop indices using artificial neural networks. Comput. Electron. Agric. 2018, 152, 186–197. [Google Scholar] [CrossRef]
- Noble, F.K. Comparison of OpenCV’s feature detectors and feature matchers. In Proceedings of the 2016 23rd International Conference on Mechatronics and Machine Vision in Practice (M2VIP), Nanjing, China, 28–30 November 2016; pp. 1–6. [Google Scholar] [CrossRef]
- Cowan, B.; Imanberdiyev, N.; Fu, C.; Dong, Y.; Kayacan, E. A performance evaluation of detectors and descriptors for UAV visual tracking. In Proceedings of the 2016 14th International Conference on Control, Automation, Robotics and Vision (ICARCV), Phuket, Thailand, 1–6, November 2016; pp. 1–6. [Google Scholar] [CrossRef]
- Jafari Malekabadi, A.; Khojastehpour, M.; Emadi, B. A comparative evaluation of combined feature detectors and descriptors in different color spaces for stereo image matching of tree. Sci. Hortic. 2018, 228, 187–195. [Google Scholar] [CrossRef]
- Fairchild, M.D. CIE 015:2018 Colorimetry, 4th ed.; The International Commission on Illumination: Vienna, Austria, 2019; Volume 44, pp. 674–675. [Google Scholar] [CrossRef]
- Lowe, D.G. Object Recognition from Local Scale-Invariant Features. In Proceedings of the IEEE International Conference on Computer Vision, Corfu, Greece, 20–27 September 1999; p. 150. [Google Scholar] [CrossRef]
- Bay, H.; Tuytelaars, T.; Gool, L.V. LNCS 3951—SURF: Speeded Up Robust Features. In Proceedings of the 9th European Conference on Computer Vision (ECCV 2006), Graz, Austria, 7–13 May 2006; pp. 404–417. [Google Scholar] [CrossRef]
- Rosten, E.; Drummond, T. Machine learning for high-speed corner detection. In Computer Vision—ECCV 2006; Leonardis, A., Bischof, H., Pinz, A., Eds.; Springer: Berlin/Heidelberg, Germany, 2006; pp. 430–443. [Google Scholar] [CrossRef]
- Leutenegger, S.; Chli, M.; Siegwart, R.Y. BRISK: Binary Robust invariant scalable keypoints. In Proceedings of the IEEE International Conference on Computer Vision, Barcelona, Spain, 6–13 November 2011; pp. 2548–2555. [Google Scholar] [CrossRef] [Green Version]
- Calonder, M.; Lepetit, V.; Strecha, C.; Fua, P. BRIEF: Binary Robust Independent Elementary Features. In Computer Vision—ECCV 2010; Daniilidis, K., Maragos, P., Paragios, N., Eds.; Springer: Berlin/Heidelberg, Germany, 2010; Volume 6314, pp. 778–792. [Google Scholar] [CrossRef] [Green Version]
- Rublee, E.; Rabaud, V.; Konolige, K.; Bradski, G. ORB: An efficient alternative to SIFT or SURF. In Proceedings of the IEEE International Conference on Computer Vision, Barcelona, Spain, 6–13 November 2011; pp. 2564–2571. [Google Scholar] [CrossRef]
- Alahi, A.; Ortiz, R.; Vandergheynst, P. FREAK: Fast Retina Keypoint. In Proceedings of the 2012 IEEE Conference on Computer Vision and Pattern Recognition, Providence, RI, USA, 16–21 June 2012; pp. 510–517. [Google Scholar] [CrossRef] [Green Version]
- Alcantarilla, P.F.; Bartoli, A.; Davison, A.J. KAZE features. Lect. Notes Comput. Sci. 2012, 7577, 214–227. [Google Scholar] [CrossRef]
- Alcantarilla, P.F.; Nuevo, J.; Bartoli, A. Fast explicit diffusion for accelerated features in nonlinear scale spaces. In Proceedings of the BMVC 2013—Electronic Proceedings of the British Machine Vision Conference 2013, Bristol, UK, 9–13 September 2013; pp. 1–11. [Google Scholar] [CrossRef] [Green Version]
- Schmittmann, O.; Lammers, P.S. A True-Color Sensor and Suitable Evaluation Algorithm for Plant Recognition. Sensors 2017, 17, 1823. [Google Scholar] [CrossRef] [PubMed] [Green Version]


| Feature Descriptor | Matching Distance | OpenCV Function |
|---|---|---|
| SURF | L1 norm | NORM_L1 |
| SIFT | ||
| BRISK | ||
| KAZE | ||
| AKAZE | ||
| ORB | Hamming norm | NORM_HAMMING2 |
| BRISK | Hamming norm | NORM_HAMMING |
| FAST + BRIEF | ||
| FAST + BRISK | ||
| FAST + FREAK |
| FLANN Matching | ||||||||||
|---|---|---|---|---|---|---|---|---|---|---|
| Images | BRISK | FAST + BRISK | SURF | SIFT | ORB | FAST + BRIEF | FAST + FREAK | KAZE | AKAZE | |
| RGB | Blue | 6.00 | 8.00 | 9.45 | 13.00 | 0.70 | 4.55 | 3.90 | 4.50 | 2.55 |
| Red | 10.25 | 12.45 | 12.20 | 16.80 | 1.30 | 3.40 | 3.50 | 9.30 | 5.05 | |
| Green | 13.85 | 13.90 | 13.90 | 17.40 | 1.35 | 6.45 | 6.75 | 12.00 | 6.70 | |
| CIE L*a*b | L* | 11.55 | 13.70 | 14.00 | 17.00 | 1.20 | 6.00 | 6.15 | 11.45 | 6.10 |
| a* | 0.20 | 0.05 | 0.50 | 0.20 | 0.50 | 0.00 | 0.00 | 0.25 | 0.05 | |
| b* | 6.20 | 0.35 | 10.90 | 12.70 | 2.45 | 0.00 | 0.00 | 14.60 | 12.50 | |
| BF Matching | ||||||||||
|---|---|---|---|---|---|---|---|---|---|---|
| Images | BRISK | FAST + BRISK | SURF | SIFT | ORB | FAST + BRIEF | FAST + FREAK | KAZE | AKAZE | |
| RGB | Blue | 7.80 | 9.35 | 11.30 | 11.70 | 2.70 | 14.40 | 13.60 | 5.65 | 4.30 |
| Red | 14.05 | 15.15 | 14.80 | 15.30 | 6.25 | 9.50 | 10.20 | 12.15 | 8.10 | |
| Green | 16.90 | 17.25 | 16.60 | 16.50 | 8.55 | 17.00 | 16.20 | 13.65 | 10.05 | |
| CIE L*a*b* | L* | 11.55 | 16.15 | 16.50 | 16.60 | 6.60 | 15.50 | 14.00 | 12.90 | 9.55 |
| a* | 0.20 | 0.00 | 0.45 | 0.55 | 0.40 | 0.05 | 0.10 | 0.75 | 0.45 | |
| b* | 6.20 | 1.60 | 9.45 | 9.05 | 11.20 | 0.20 | 0.10 | 17.10 | 16.75 | |
| Time (s) | ||||||||||
|---|---|---|---|---|---|---|---|---|---|---|
| Matching Method | Image Channel | BRISK | FAST+ BRISK | SURF | SIFT | ORB | FAST+ BRIEF | FAST+ FREAK | KAZE | AKAZE |
| FLANN | Blue | 0.567 | 0.469 | 0.537 | 0.535 | 0.054 | 0.472 | 0.842 | 1.133 | 0.231 |
| Green | 0.552 | 0.461 | 0.546 | 0.530 | 0.052 | 0.469 | 0.844 | 1.152 | 0.229 | |
| Red | 0.556 | 0.459 | 0.559 | 0.533 | 0.052 | 0.460 | 0.843 | 1.096 | 0.220 | |
| L* | 0.489 | 0.377 | 0.586 | 0.547 | 0.055 | 0.368 | 0.652 | 1.113 | 0.228 | |
| a* | 0.340 | 0.273 | 0.471 | 0.377 | 0.050 | 0.196 | 0.368 | 1.107 | 0.227 | |
| b* | 0.374 | 0.299 | 0.502 | 0.428 | 0.051 | 0.239 | 0.387 | 1.160 | 0.241 | |
| Brute Force | Blue | 0.596 | 0.438 | 0.822 | 1.028 | 0.050 | 1.303 | 1.781 | 1.298 | 0.215 |
| Green | 0.452 | 0.409 | 0.727 | 0.909 | 0.049 | 1.043 | 1.250 | 1.207 | 0.194 | |
| Red | 0.437 | 0.367 | 0.651 | 0.850 | 0.038 | 0.997 | 1.503 | 1.133 | 0.218 | |
| L* | 0.824 | 0.654 | 1.326 | 1.676 | 0.062 | 1.870 | 2.575 | 1.397 | 0.275 | |
| a* | 0.471 | 0.395 | 0.830 | 0.624 | 0.049 | 0.422 | 0.651 | 1.382 | 0.262 | |
| b* | 0.487 | 0.384 | 0.980 | 0.865 | 0.051 | 0.570 | 0.795 | 1.401 | 0.269 | |
Publisher’s Note: MDPI stays neutral with regard to jurisdictional claims in published maps and institutional affiliations. |
© 2021 by the authors. Licensee MDPI, Basel, Switzerland. This article is an open access article distributed under the terms and conditions of the Creative Commons Attribution (CC BY) license (https://creativecommons.org/licenses/by/4.0/).
Share and Cite
Forero, M.G.; Mambuscay, C.L.; Monroy, M.F.; Miranda, S.L.; Méndez, D.; Valencia, M.O.; Gomez Selvaraj, M. Comparative Analysis of Detectors and Feature Descriptors for Multispectral Image Matching in Rice Crops. Plants 2021, 10, 1791. https://doi.org/10.3390/plants10091791
Forero MG, Mambuscay CL, Monroy MF, Miranda SL, Méndez D, Valencia MO, Gomez Selvaraj M. Comparative Analysis of Detectors and Feature Descriptors for Multispectral Image Matching in Rice Crops. Plants. 2021; 10(9):1791. https://doi.org/10.3390/plants10091791
Chicago/Turabian StyleForero, Manuel G., Claudia L. Mambuscay, María F. Monroy, Sergio L. Miranda, Dehyro Méndez, Milton Orlando Valencia, and Michael Gomez Selvaraj. 2021. "Comparative Analysis of Detectors and Feature Descriptors for Multispectral Image Matching in Rice Crops" Plants 10, no. 9: 1791. https://doi.org/10.3390/plants10091791