
Role of Synthetic Plant Extracts on the Production of Silver-Derived Nanoparticles

 , , ,
, , ,
Abstract
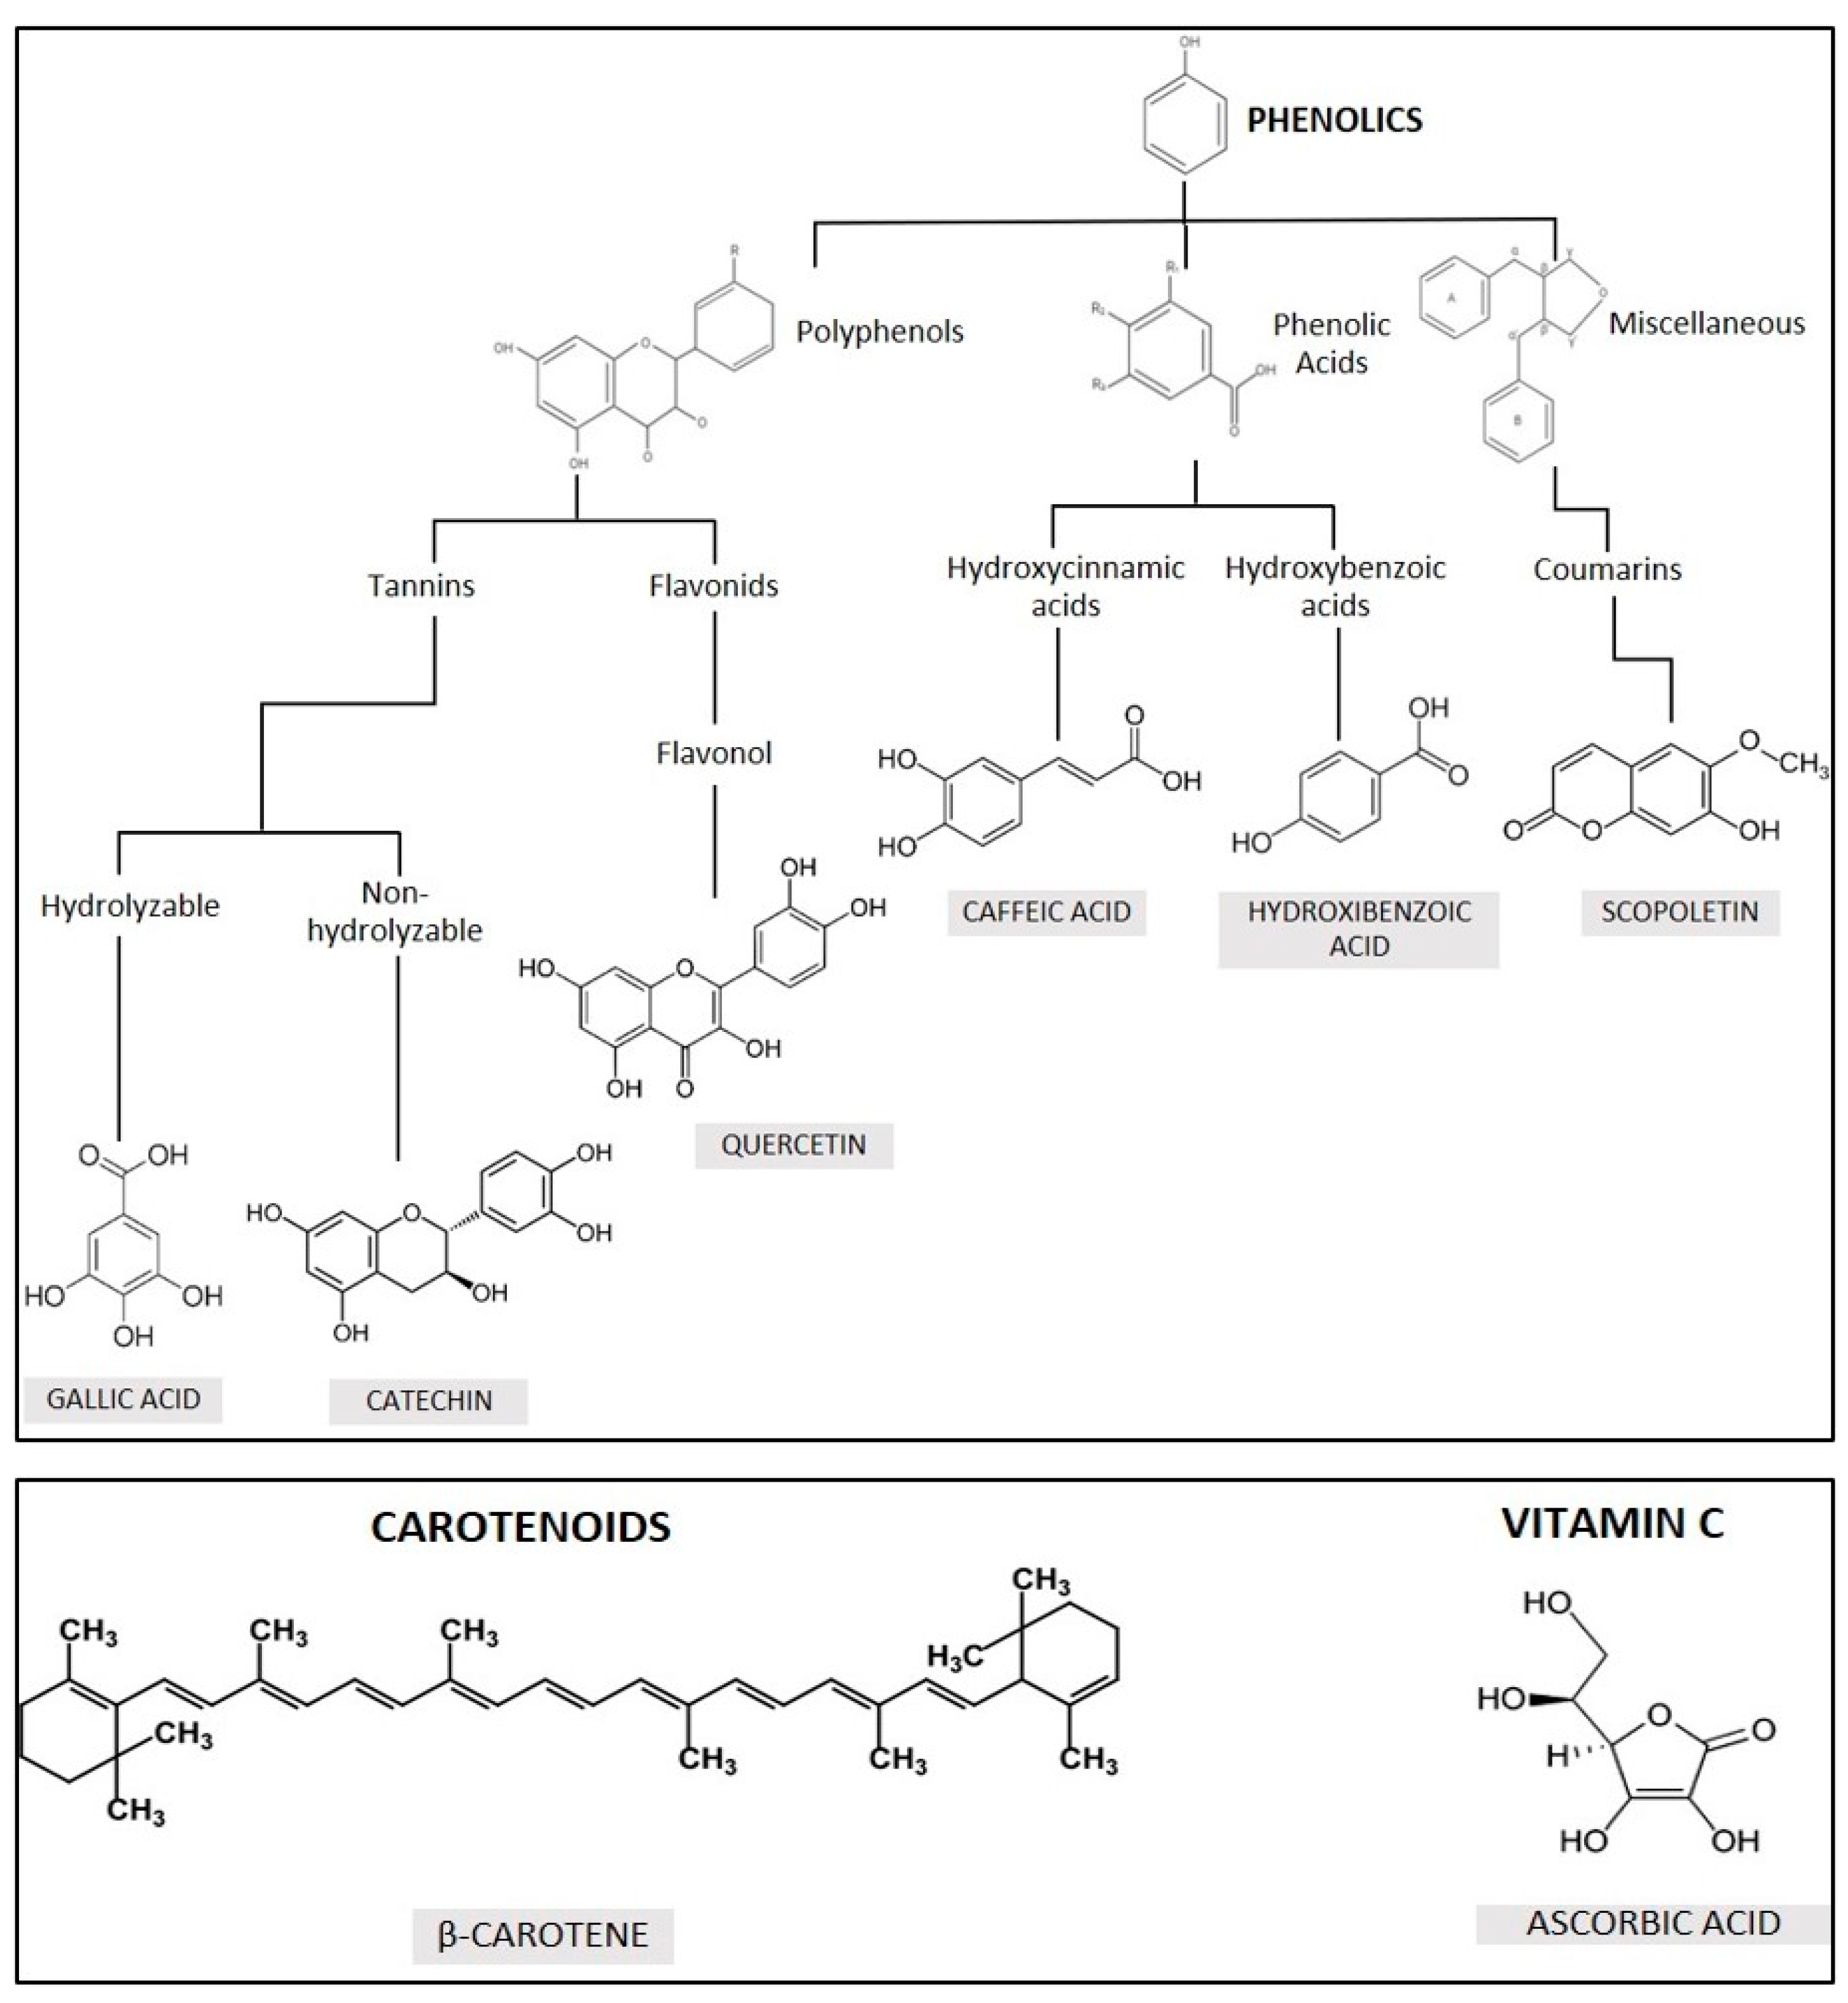
:1. Introduction
2. Results and Discussion
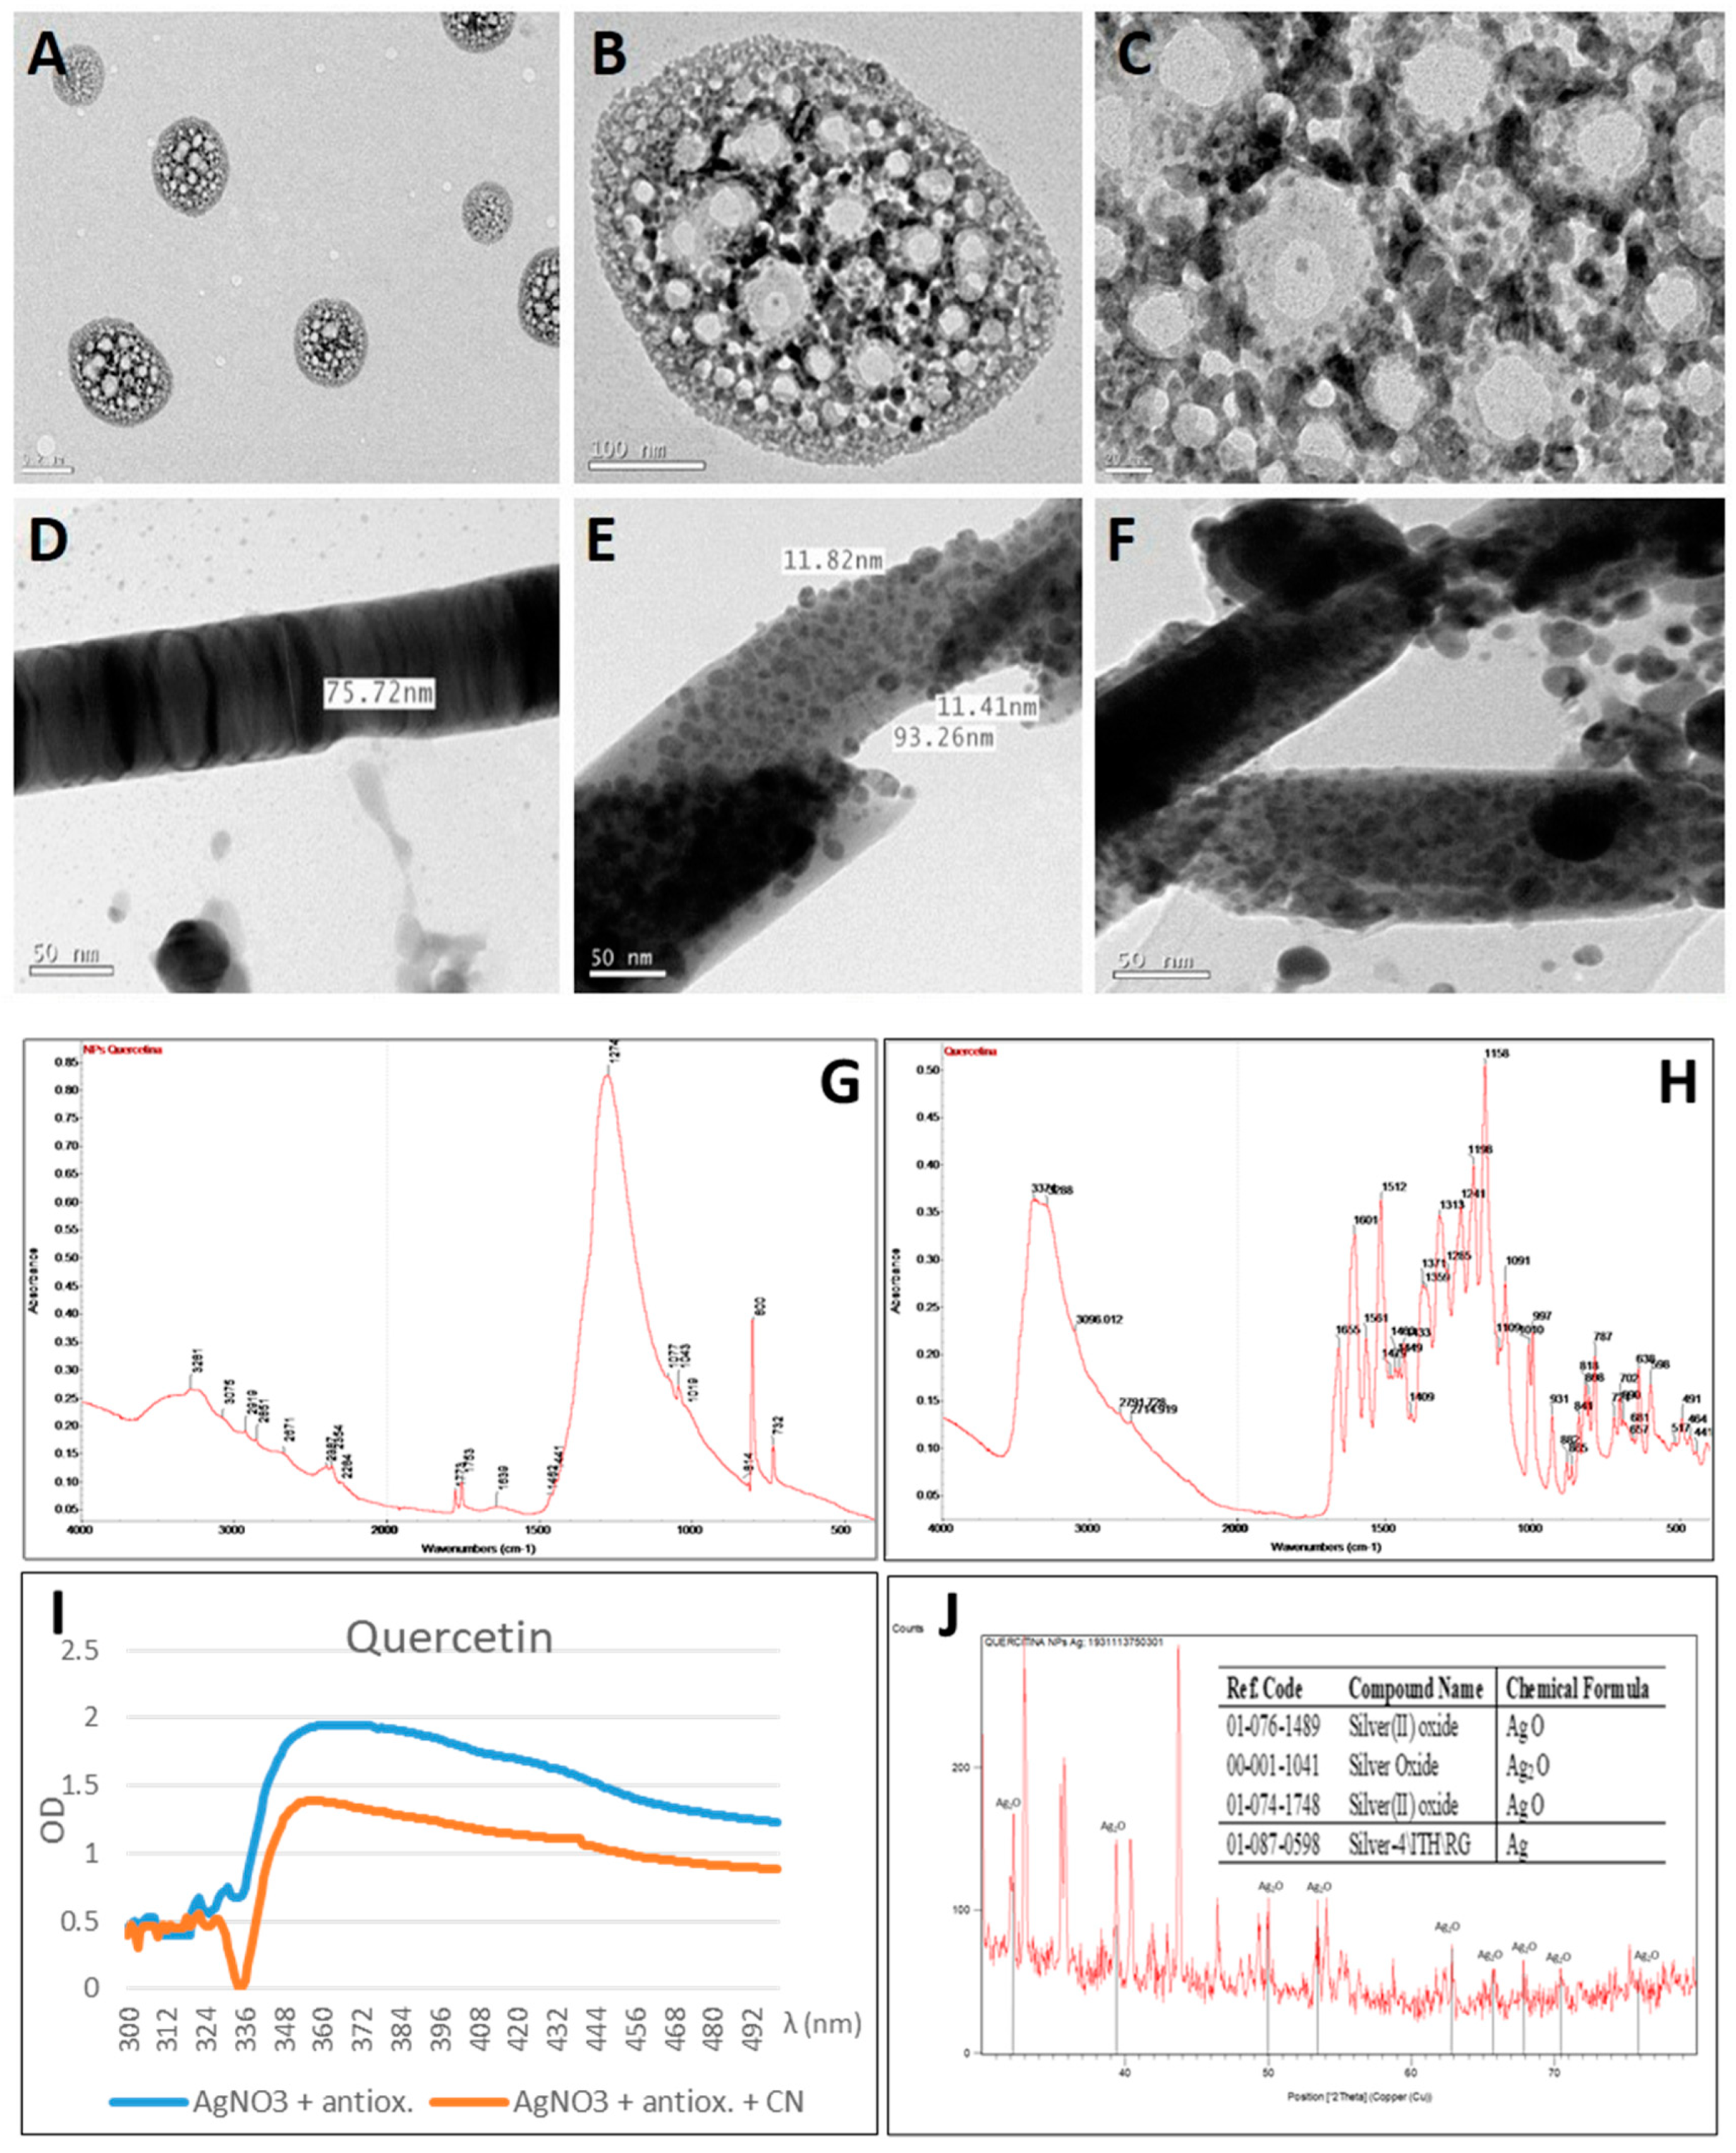
2.1. Synthesis of Silver Nanoparticles by Quercetin
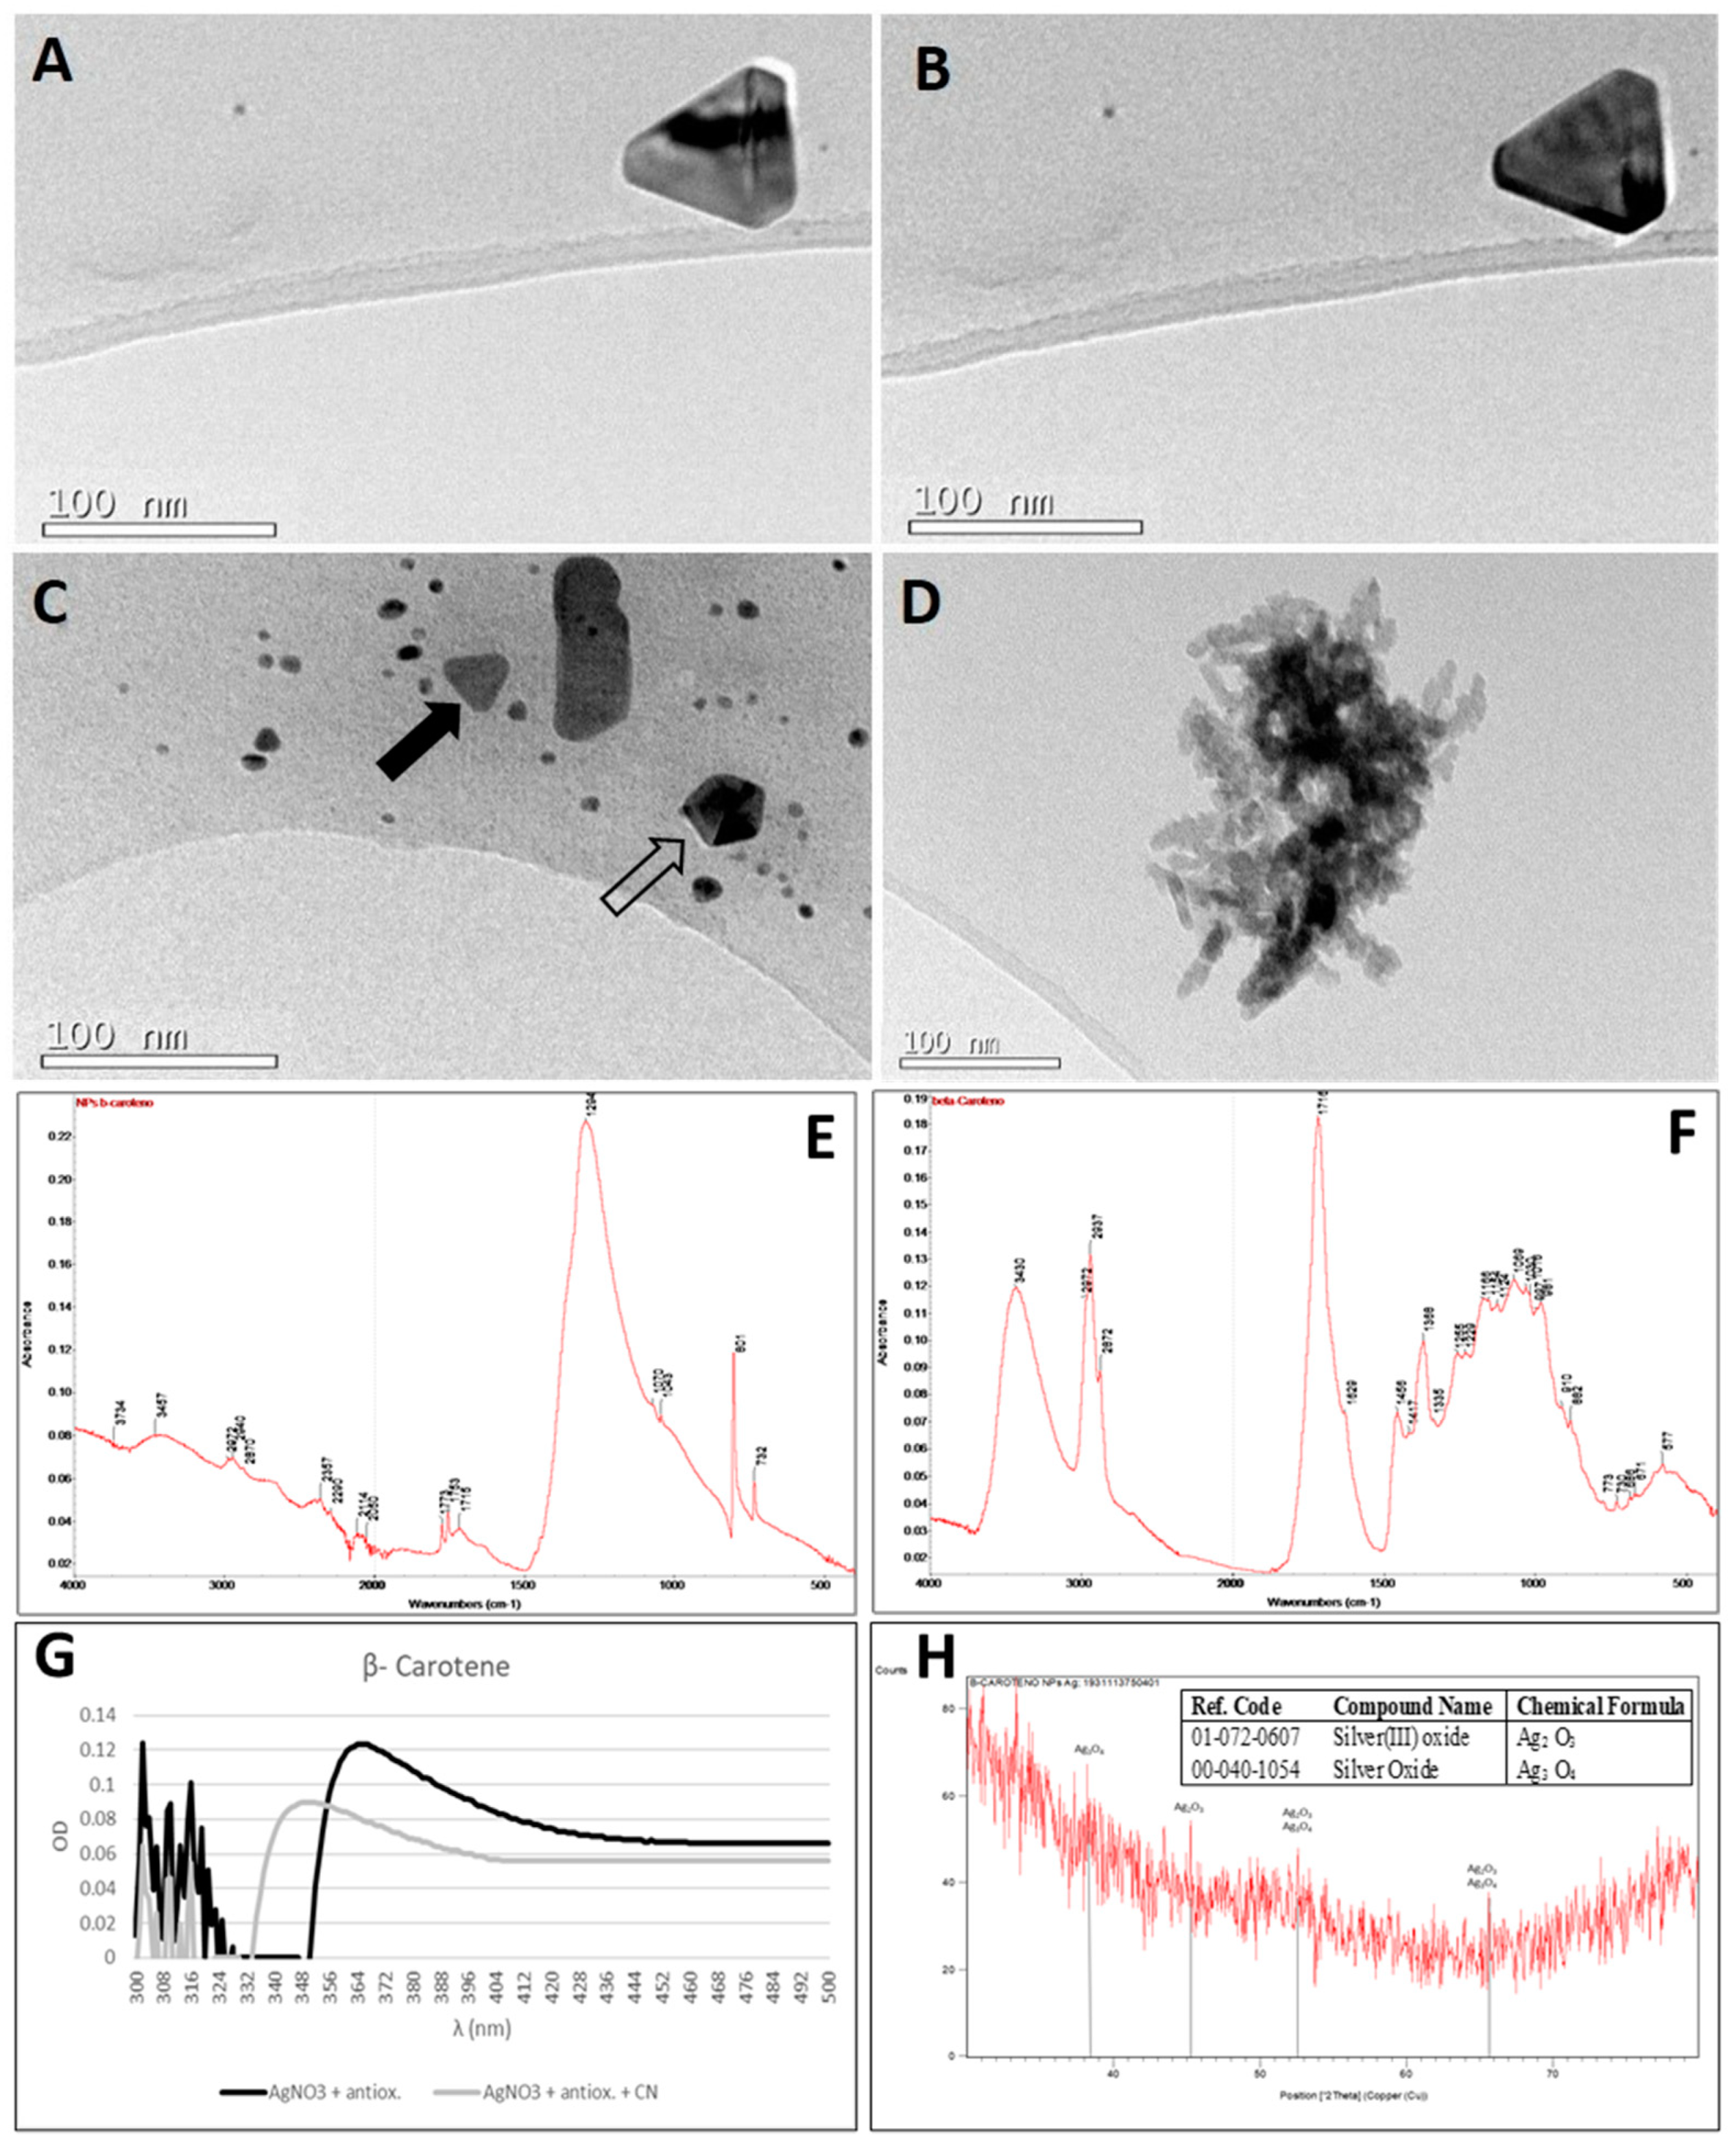
2.2. Synthesis of Silver Nanoparticles by β-Carotene
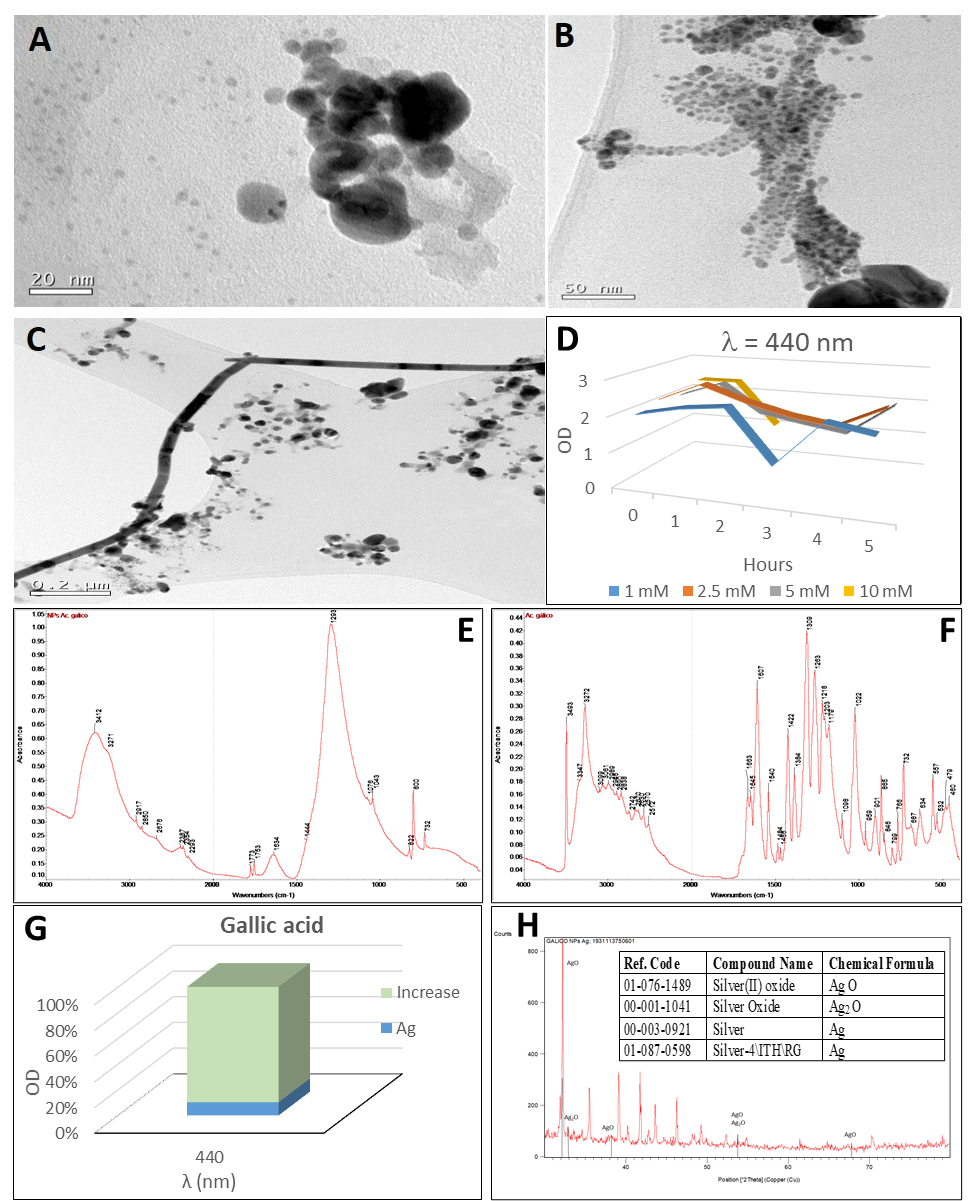
2.3. Synthesis of Silver Nanoparticles by Gallic Acid
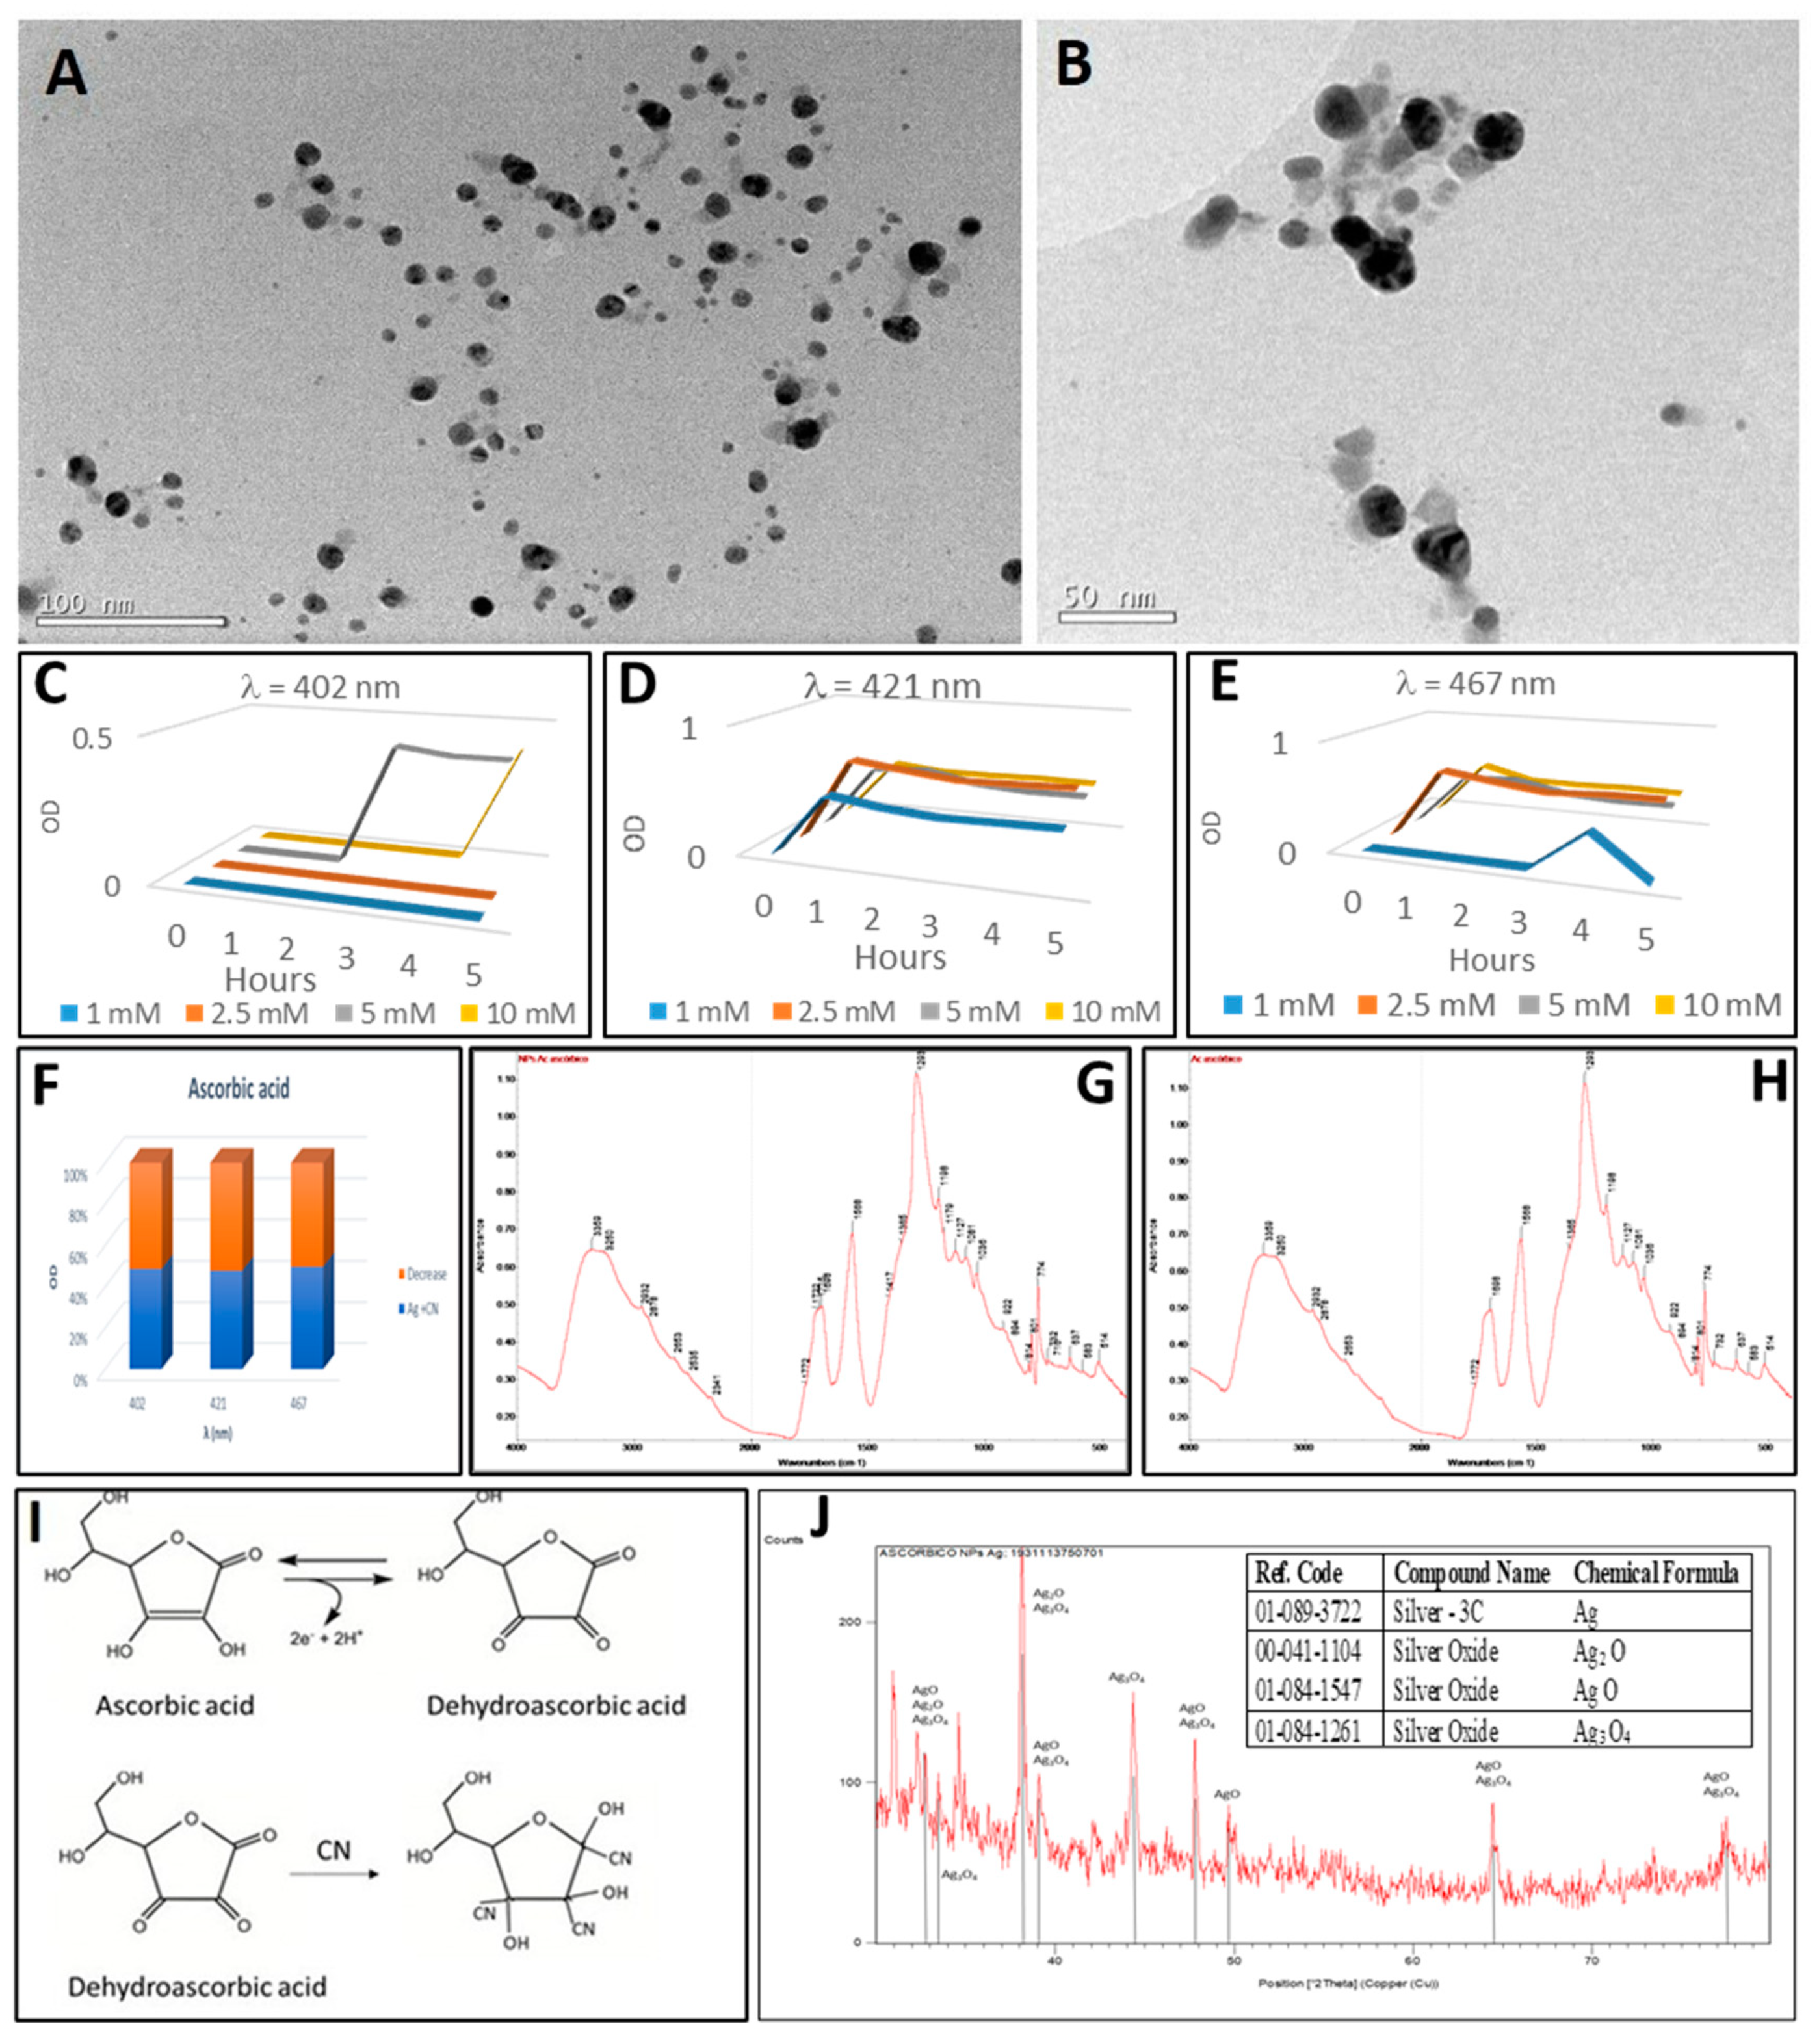
2.4. Synthesis of Silver Nanoparticles by Ascorbic Acid
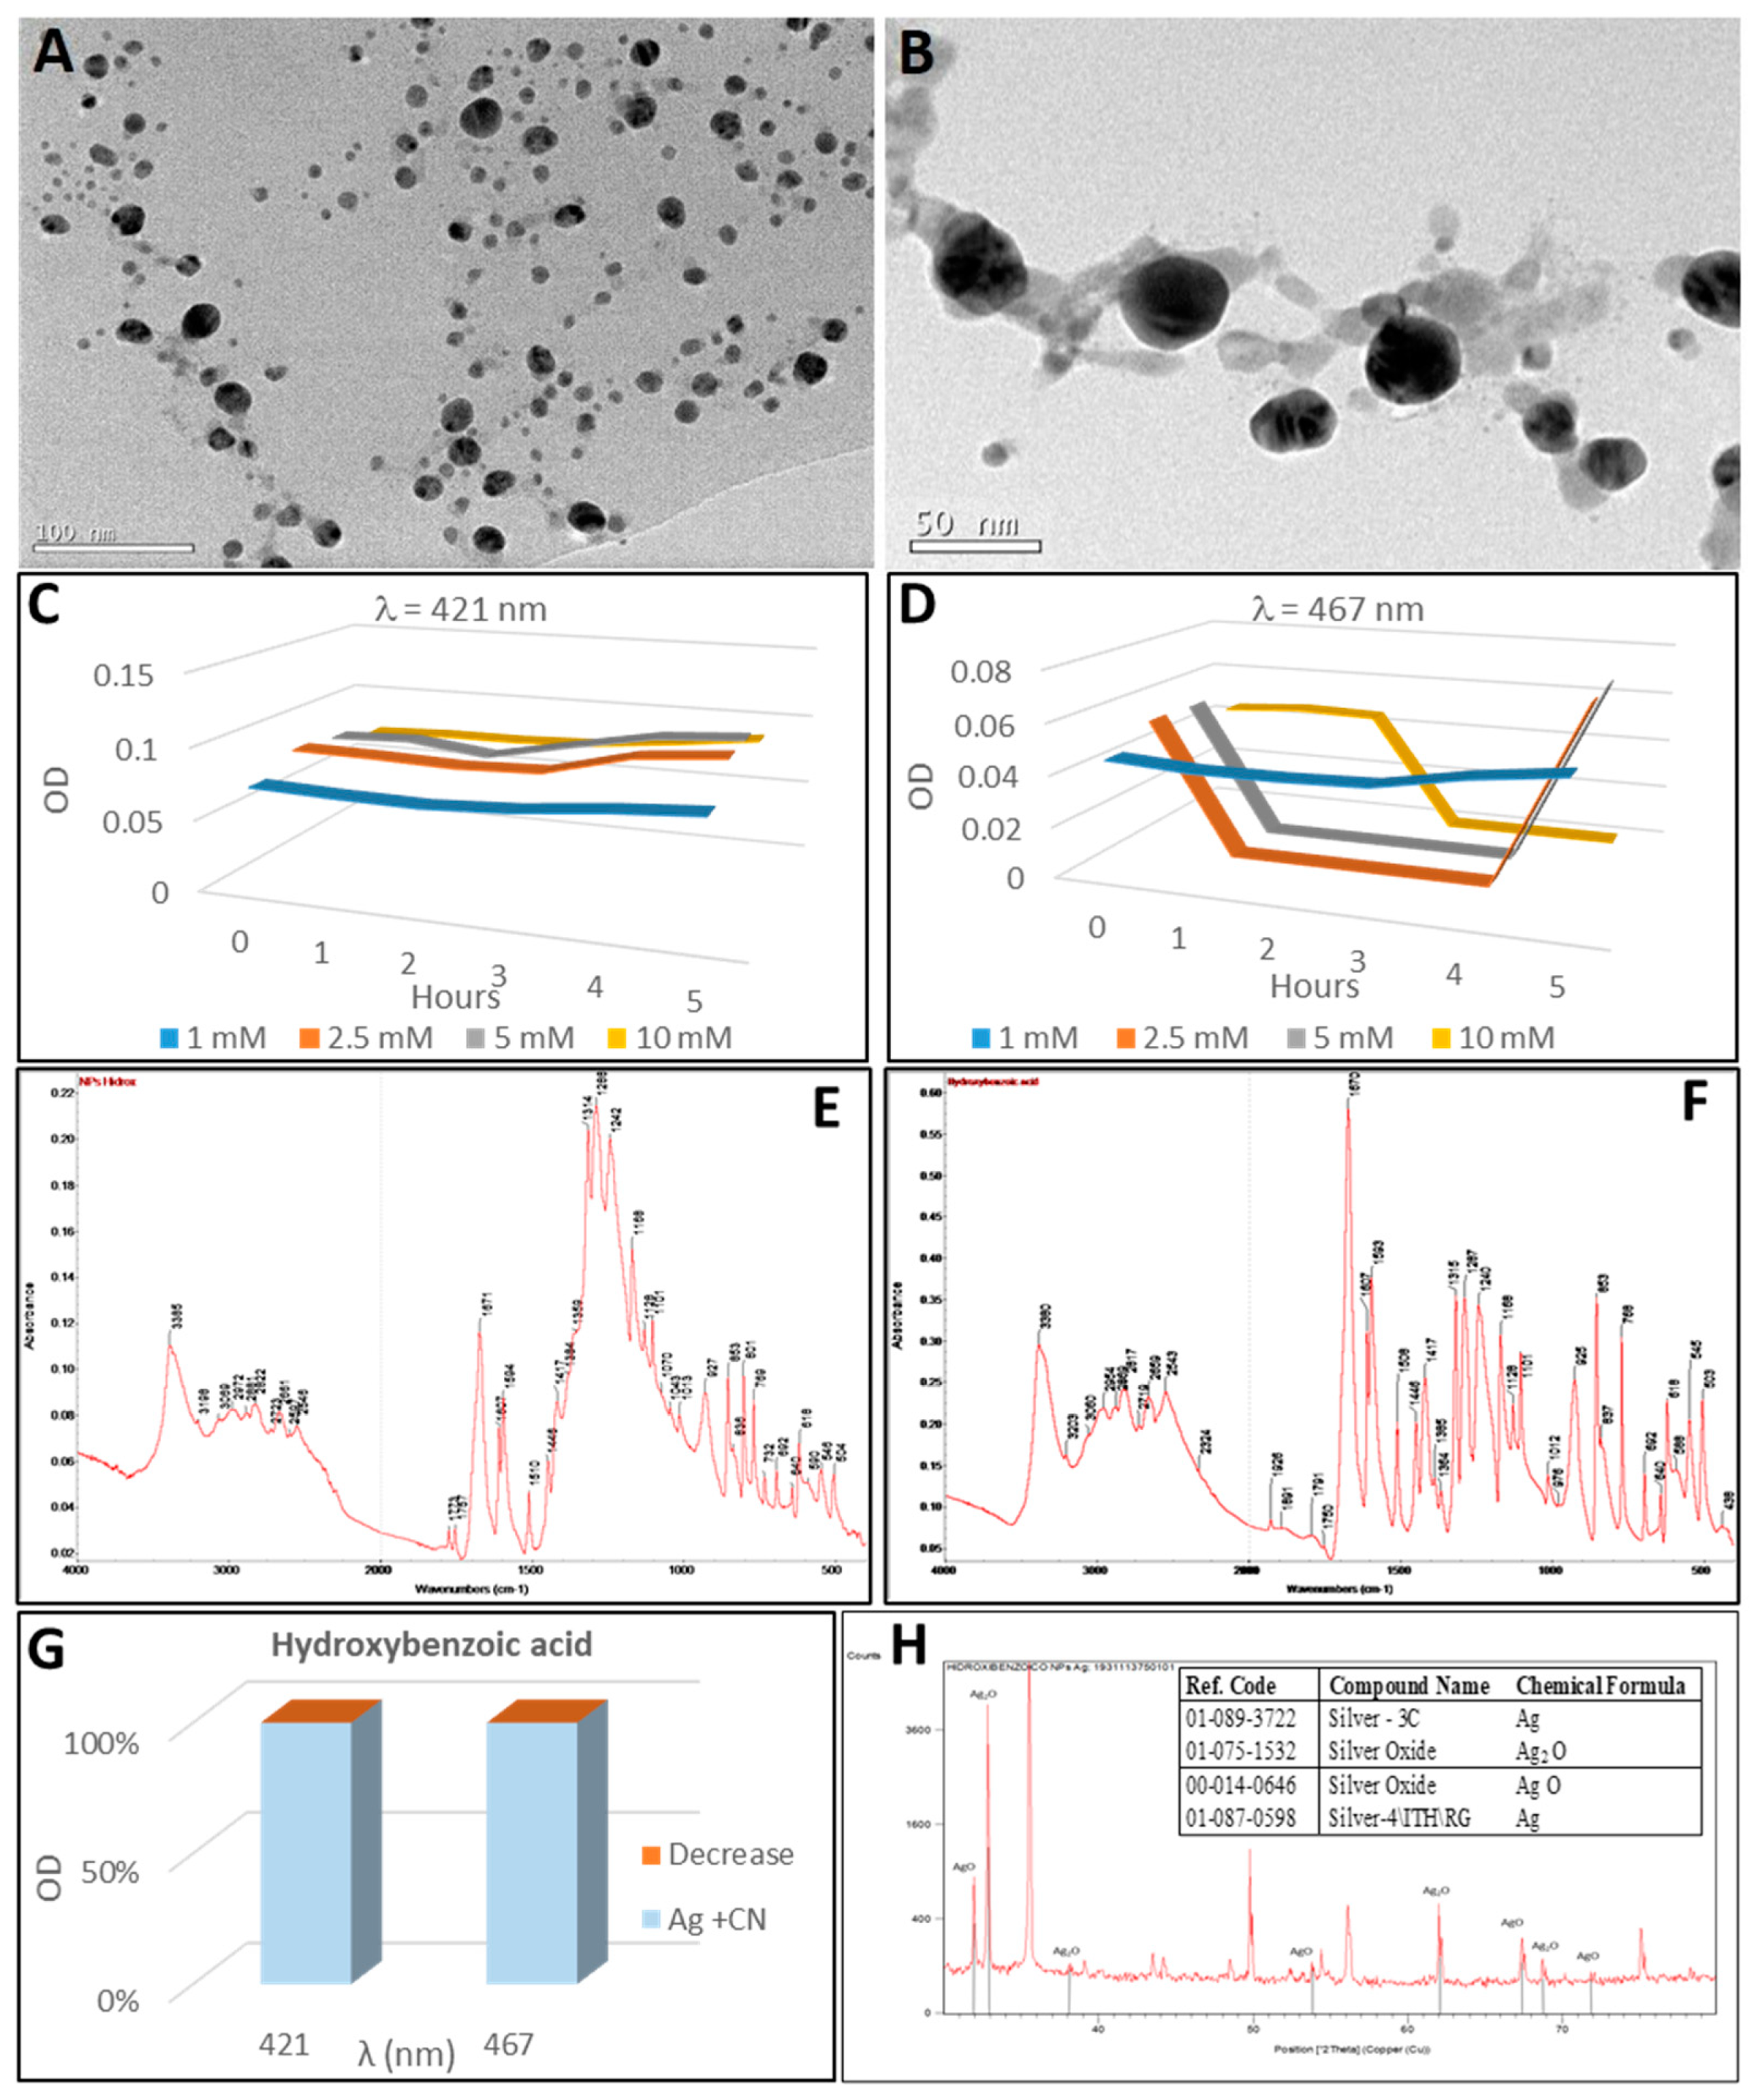
2.5. Synthesis of Silver Nanoparticles by 2-Hydroxybenzoic Acid
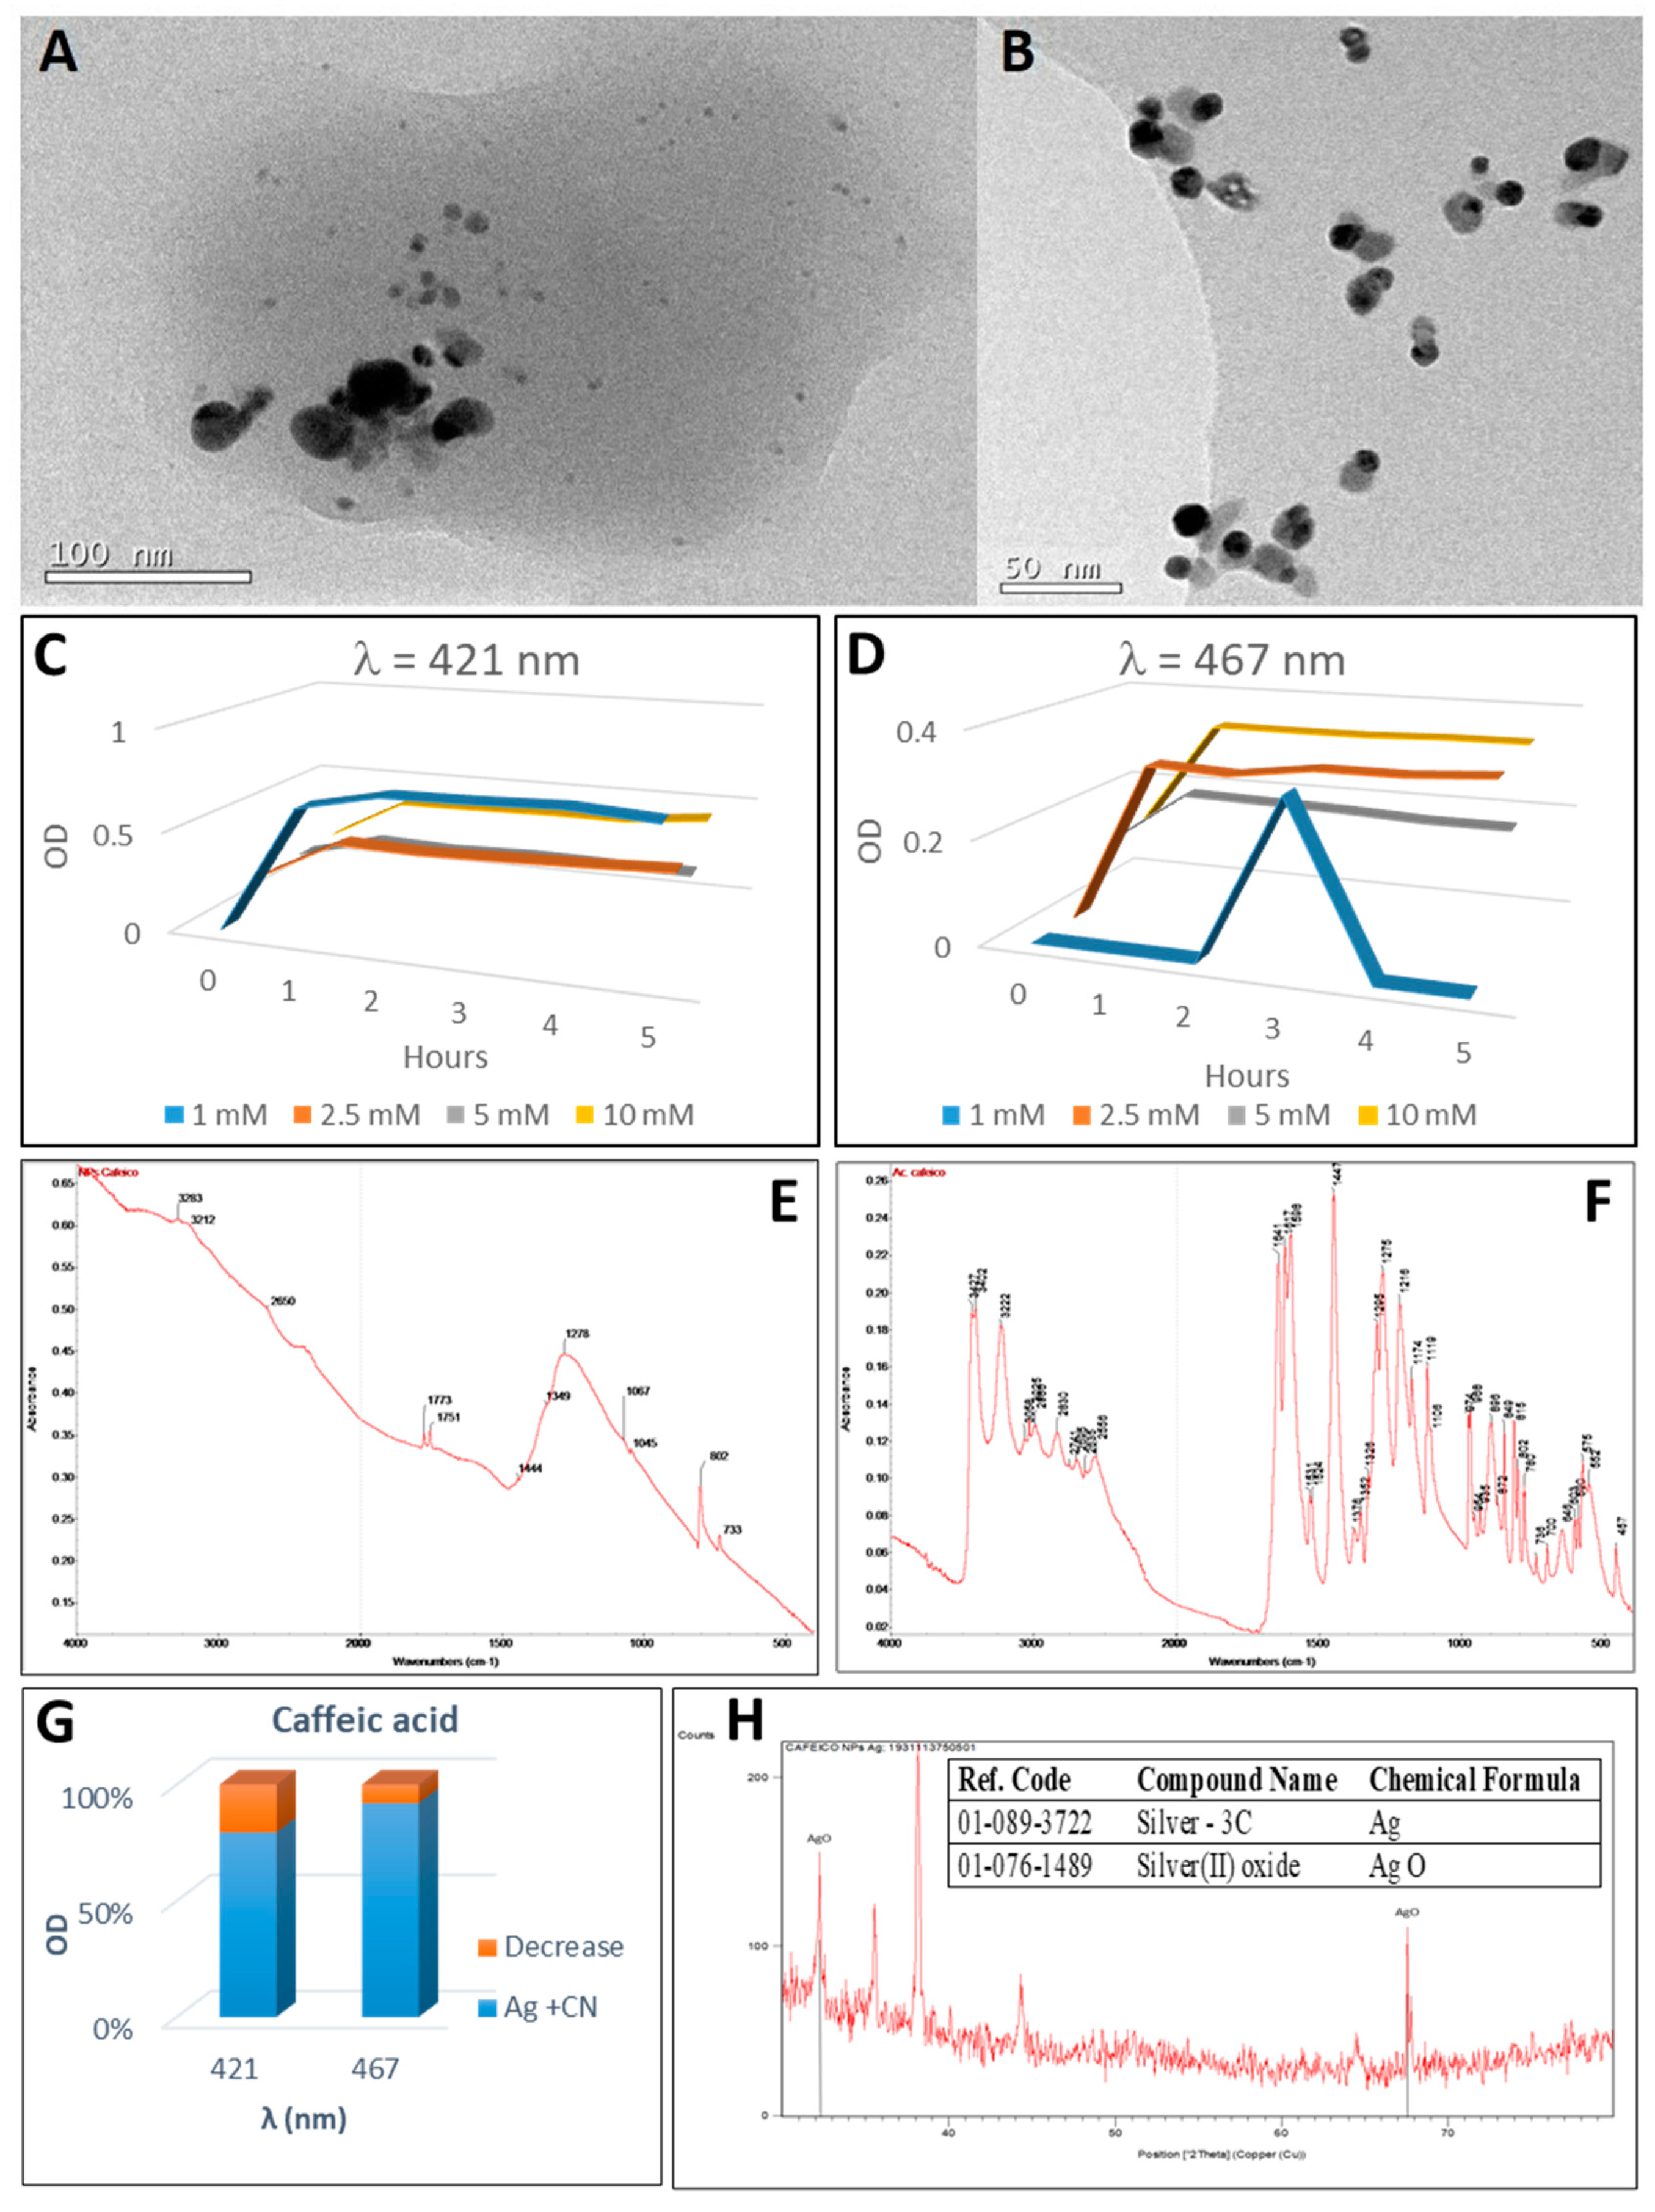
2.6. Synthesis of Silver Nanoparticles by Caffeic Acid
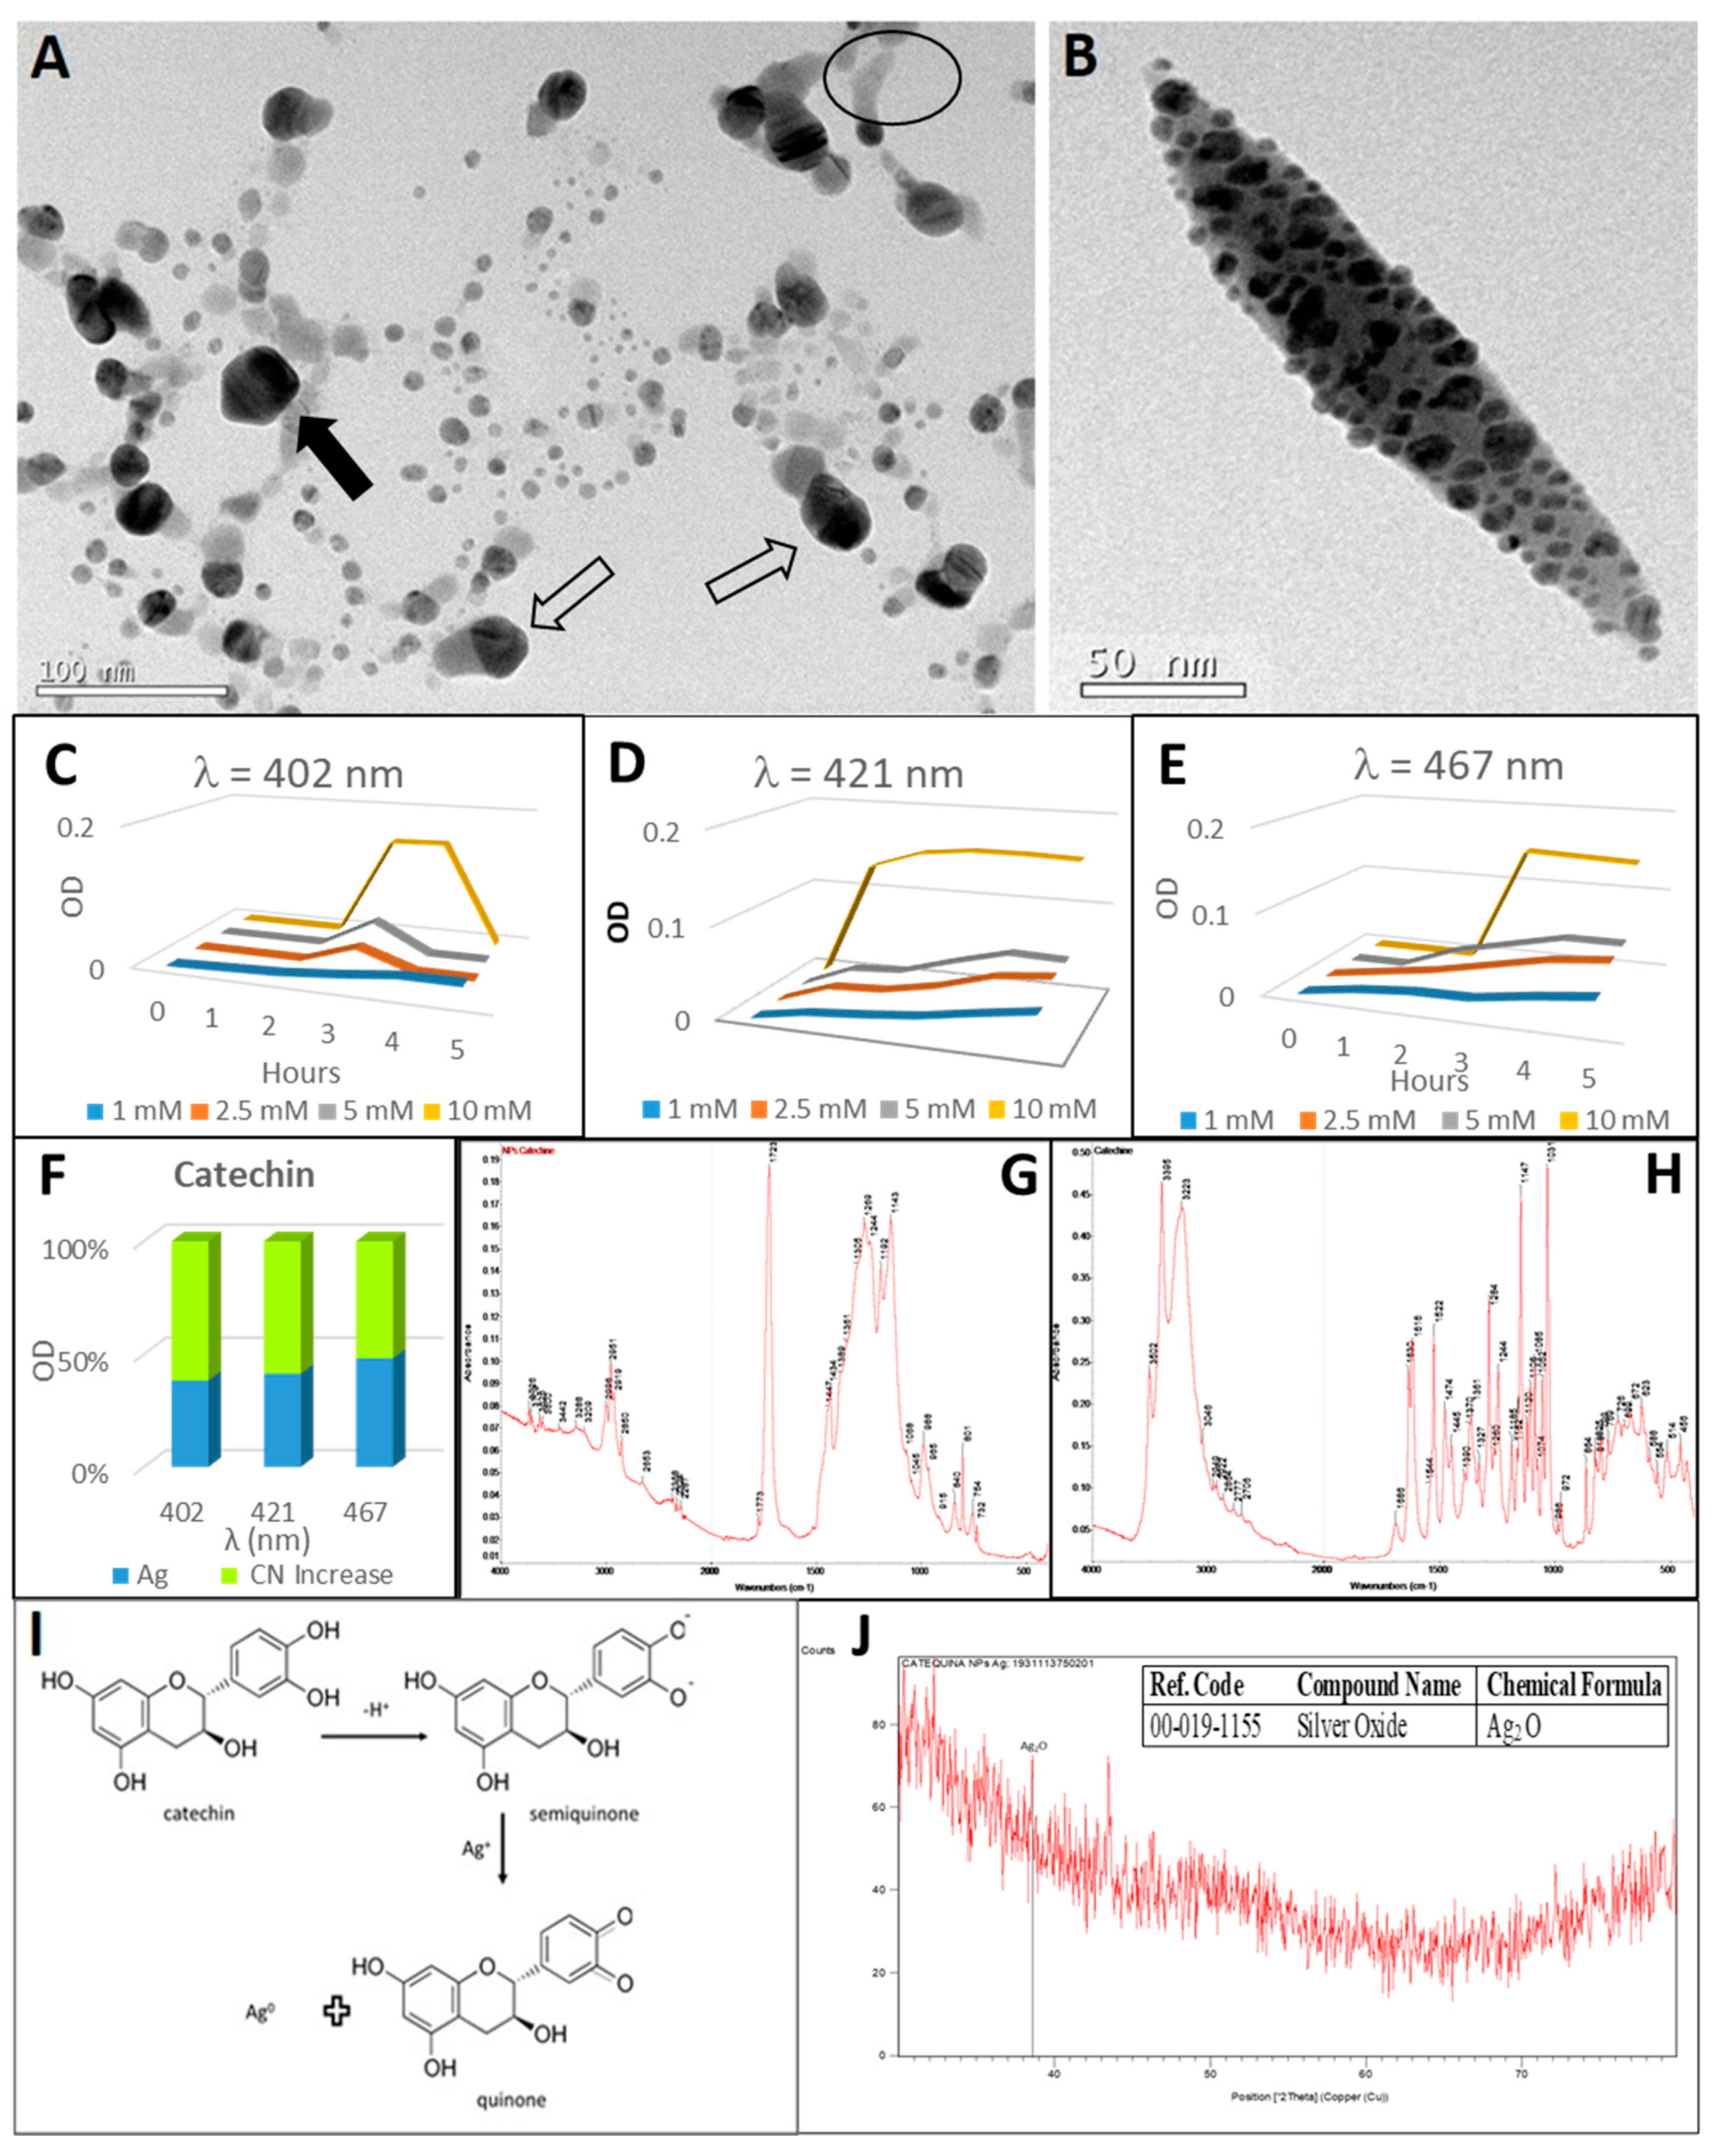
2.7. Synthesis of Silver Nanoparticles by Catechin
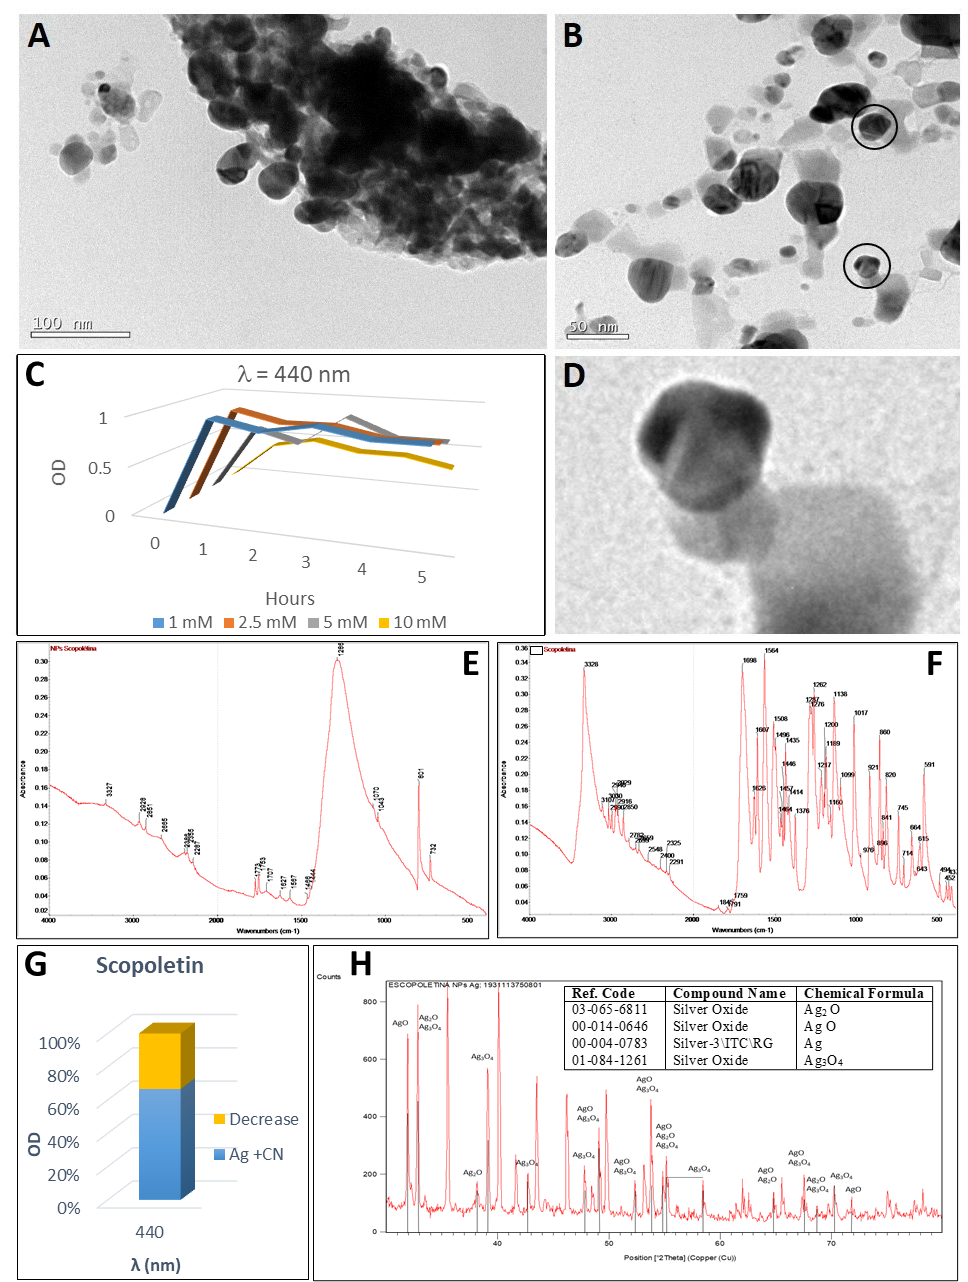
2.8. Synthesis of Silver Nanoparticles by Scopoletin
3. Material and Methods
3.1. Materials
3.2. Preparation of Chemical Solutions
3.3. Preparation of Nanoparticles
3.4. Characterization of Nanoparticles
3.4.1. Spectrophotometry
3.4.2. Transmission Electron Microscopy (TEM)
3.4.3. X-ray Powder Diffraction
3.4.4. Fourier-Transform Infrared Spectroscopy
3.4.5. Oxidation of AgNPs in the Presence of Cyanide
 Ag(CN)2− + e−
3.4.6. Estimation of the Concentration of Silver Nanoparticles
4. Conclusions
Author Contributions
Funding
Acknowledgments
Conflicts of Interest
References
- European Commision. 2018. Available online: https://ec.europa.eu/programmes/horizon2020/en/h2020-section/nanotechnologies (accessed on 8 May 2021).
- Raveendran, P.; Fu, J.; Wallen, S.L. A simple and “green” method for the synthesis of Au, Ag, and Au–Ag alloy nanoparticles. Green Chem. 2006, 8, 34–38. [Google Scholar] [CrossRef]
- Saratale, R.G.; Saratale, G.D.; Shin, H.S.; Jacob, J.M.; Pugazhendhi, A.; Bhaisare, M.; Kumar, G. New insights on the green synthesis of metallic nanoparticles using plant and waste biomaterials: Current knowledge, their agricultural and environmental applications. Environ. Sci. Pollut. Res. 2018, 25, 10164–10183. [Google Scholar] [CrossRef]
- Rotello, V.M. (Ed.) Nanoparticles: Building Blocks for Nanotechnology; Springer Science & Business Media: Berlin/Heidelberg, Germany, 2004. [Google Scholar]
- Srikar, S.K.; Giri, D.D.; Pal, D.B.; Mishra, P.K.; Upadhyay, S.N. Green Synthesis of Silver Nanoparticles: A Review. Green Sustain. Chem. 2016, 6, 34–56. [Google Scholar] [CrossRef] [Green Version]
- Iqbal, S.; Fakhar-E-Alam, M.; Akbar, F.; Shafiq, M.; Atif, M.; Amin, N.; Ismail, M.; Hanif, A.; Farooq, W.A. Application of silver oxide nanoparticles for the treatment of cancer. J. Mol. Struct. 2019, 1189, 203–209. [Google Scholar] [CrossRef]
- Korkmaz, N.; Karadağ, A. Microwave Assisted Green Synthesis of Ag, Ag2O, and Ag2O3 Nanoparticles. J. Turk. Chem. Soc. Sect. A Chem. 2021, 8, 585–592. [Google Scholar] [CrossRef]
- Abdelghany, T.M.; Al-Rajhi, A.M.H.; Al Abboud, M.A.; AlAwlaqi, M.M.; Magdah, A.G.; Helmy, E.A.M.; Mabrouk, A.S. Recent Advances in Green Synthesis of Silver Nanoparticles and Their Applications: About Future Directions. A Review. BioNanoScience 2018, 8, 5–16. [Google Scholar] [CrossRef]
- Iravani, S. Green synthesis of metal nanoparticles using plants. Green Chem. 2011, 13, 2638–2650. [Google Scholar] [CrossRef]
- Rauwel, P.; Küünal, S.; Ferdov, S.; Rauwel, E. A Review on the Green Synthesis of Silver Nanoparticles and Their Morphologies Studied via TEM. Adv. Mater. Sci. Eng. 2015, 2015, 1–9. [Google Scholar] [CrossRef] [Green Version]
- Ahmed, S.; Ahmad, M.; Swami, B.L.; Ikram, S. A review on plants extract mediated synthesis of silver nanoparticles for antimicrobial applications: A green expertise. J. Adv. Res. 2016, 7, 17–28. [Google Scholar] [CrossRef] [Green Version]
- Sharma, D.; Kanchi, S.; Bisetty, K. Biogenic synthesis of nanoparticles: A review. Arab. J. Chem. 2019, 12, 3576–3600. [Google Scholar] [CrossRef] [Green Version]
- Siddiqi, K.S.; Husen, A.; Rao, R.A.K. A review on biosynthesis of silver nanoparticles and their biocidal properties. J. Nanobiotechnol. 2018, 16, 14. [Google Scholar] [CrossRef]
- Kasote, D.; Katyare, S.S.; Hegde, M.V.; Bae, H. Significance of Antioxidant Potential of Plants and its Relevance to Therapeutic Applications. Int. J. Biol. Sci. 2015, 11, 982–991. [Google Scholar] [CrossRef] [PubMed] [Green Version]
- Geoprincy, G.; Srri, B.V.; Poonguzhali, U.; Gandhi, N.N.; Renganathan, S. A review on green synthesis of silver nanoparticles. Asian J. Pharm. Clin. Res. 2013, 6, 8–12. [Google Scholar]
- Janků, M.; Luhová, L.; Petřivalský, M. On the Origin and Fate of Reactive Oxygen Species in Plant Cell Compartments. Antioxidants 2019, 8, 105. [Google Scholar] [CrossRef] [PubMed] [Green Version]
- Ahmad, P.; Jaleel, C.A.; Salem, M.A.; Nabi, G.; Sharma, S. Roles of enzymatic and nonenzymatic antioxidants in plants during abiotic stress. Crit. Rev. Biotechnol. 2010, 30, 161–175. [Google Scholar] [CrossRef] [PubMed]
- Kessler, A.; Kalske, A. Plant Secondary Metabolite Diversity and Species Interactions. Annu. Rev. Ecol. Evol. Syst. 2018, 49, 115–138. [Google Scholar] [CrossRef]
- Barton, K.E.; Boege, K. Future directions in the ontogeny of plant defence: Understanding the evolutionary causes and consequences. Ecol. Lett. 2017, 20, 403–411. [Google Scholar] [CrossRef]
- Dicke, M.; Baldwin, I.T. The evolutionary context for herbivore-induced plant volatiles: Beyond the ‘cry for help’. Trends Plant Sci. 2010, 15, 167–175. [Google Scholar] [CrossRef]
- Yang, L.; Wen, K.-S.; Ruan, X.; Zhao, Y.-X.; Wei, F.; Wang, Q. Response of Plant Secondary Metabolites to Environmental Factors. Molecules 2018, 23, 762. [Google Scholar] [CrossRef] [Green Version]
- Shelton, A.L. Within-Plant Variation in Glucosinolate Concentrations of Raphanus sativus Across Multiple Scales. J. Chem. Ecol. 2005, 31, 1711–1732. [Google Scholar] [CrossRef]
- Herrera, C.M. Multiplicity in Unity: Plant Subindividual Variation & Interactions with Animals; University of Chicago Press: Chicago, IL, USA, 2009; pp. 1–437. [Google Scholar]
- Lopresti, E.F.; Weber, M.G. Breaking Barriers in Evolutionary Biology: A Pioneering Woman in Science and Her Early Theory of Plant Chemical Macroevolution. Am. Nat. 2016, 188, 2–4. [Google Scholar] [CrossRef] [PubMed]
- Jørgensen, K.; Rasmussen, A.V.; Morant, M.; Nielsen, A.H.; Bjarnholt, N.; Zagrobelny, M.; Bak, S.; Møller, B.L. Metabolon formation and metabolic channeling in the biosynthesis of plant natural products. Curr. Opin. Plant Biol. 2005, 8, 280–291. [Google Scholar] [CrossRef] [PubMed]
- Kutchan, T.M. A role for intra- and intercellular translocation in natural product biosynthesis. Curr. Opin. Plant Biol. 2005, 8, 292–300. [Google Scholar] [CrossRef] [PubMed]
- Wink, M. Biochemistry of Plant Secondary Metabolism, 2nd ed.; Blackwell Publishing Ltd.: Hoboken, NJ, USA, 2010. [Google Scholar]
- Phaniendra, A.; Jestadi, D.B.; Periyasamy, L. Free Radicals: Properties, Sources, Targets, and Their Implication in Various Diseases. Ind. J. Clin. Biochem. 2015, 30, 11–26. [Google Scholar] [CrossRef] [PubMed] [Green Version]
- Gulcin, İ. Antioxidants and antioxidant methods: An updated overview. Arch. Toxicol. 2020, 94, 651–715. [Google Scholar] [CrossRef] [Green Version]
- De la Rosa, L.A.; Moreno-Escamilla, J.O.; Rodrigo-García, J.; Alvarez-Parrilla, E. Phenolic compounds. In Postharvest Physiology and Biochemistry of Fruits and Vegetables; Elsevier: Amsterdam, The Netherlands, 2018; pp. 253–271. ISBN 9780128132784. [Google Scholar] [CrossRef]
- Kumar, N.; Goel, N. Phenolic acids: Natural versatile molecules with promising therapeutic applications. Biotechnol. Rep. 2019, 24, e00370. [Google Scholar] [CrossRef] [PubMed]
- Panche, A.N.; Diwan, A.D.; Chandra, S.R. Flavonoids: An overview. J. Nutr. Sci. 2016, 5, e47. [Google Scholar] [CrossRef] [PubMed] [Green Version]
- Okuda, T.; Yoshida, T.; Hatano, T.; Ito, H.; Quideau, S. Ellagitannins Renewed the Concept of Tannins. In Chemistry and Biology of Ellagitannins; World Scientific Pub Co Pte Lt Singapore: Singapore, 2009; pp. 1–54. [Google Scholar]
- Smeriglio, A.; Barreca, D.; Bellocco, E.S.; Trombetta, D. Proanthocyanidins and hydrolysable tannins: Occurrence, dietary intake and pharmacological effects. Br. J. Pharmacol. 2016, 174, 1244–1262. [Google Scholar] [CrossRef] [PubMed] [Green Version]
- Borges Bubols, G.; da Rocha Vianna, D.; Medina-Remon, A.; von Poser, G.; Maria Lamuela-Raventos, R.; Lucia Eifler-Lima, V.; Cristina Garcia, S. The antioxidant activity of coumarins and flavonoids. Mini Rev. Med. Chem. 2003, 13, 318–334. [Google Scholar]
- De Souza, T.A.J.; Souza, L.R.R.; Franchi, L.P. Silver nanoparticles: An integrated view of green synthesis methods, transformation in the environment, and toxicity. Ecotoxicol. Environ. Saf. 2019, 171, 691–700. [Google Scholar] [CrossRef] [PubMed]
- Khan, M.; Shaik, M.R.; Adil, S.F.; Khan, S.T.; Al-Warthan, A.; Siddiqui, M.R.H.; Tahir, M.N.; Tremel, W. Plant extracts as green reductants for the synthesis of silver nanoparticles: Lessons from chemical synthesis. Dalton Trans. 2018, 47, 11988–12010. [Google Scholar] [CrossRef]
- Rothwell, J.; Day, A.J.; Morgan, M.R.A. Experimental Determination of Octanol−Water Partition Coefficients of Quercetin and Related Flavonoids. J. Agric. Food Chem. 2005, 53, 4355–4360. [Google Scholar] [CrossRef]
- Bukhari, S.B.; Memon, S.; Mahroof-Tahir, M.; Bhanger, M. Synthesis, characterization and antioxidant activity copper–quercetin complex. Spectrochim. Acta Part A Mol. Biomol. Spectrosc. 2009, 71, 1901–1906. [Google Scholar] [CrossRef] [PubMed]
- Egorova, E.; Revina, A. Synthesis of metallic nanoparticles in reverse micelles in the presence of quercetin. Colloids Surfaces A Physicochem. Eng. Asp. 2000, 168, 87–96. [Google Scholar] [CrossRef]
- Tasca, F.; Antiochia, R. Biocide Activity of Green Quercetin-Mediated Synthesized Silver Nanoparticles. Nanomaterials 2020, 10, 909. [Google Scholar] [CrossRef]
- Pandian, S.; Kunjiappan, S.; Ravishankar, V.; Sundarapandian, V. Synthesis of quercetin-functionalized silver nanoparticles by rapid one-pot approach. Biotechnology 2021, 102, 75–84. [Google Scholar] [CrossRef]
- Petit, C.; Lixon, P.; Pileni, M.P. In situ synthesis of silver nanocluster in AOT reverse micelles. J. Phys. Chem. 1993, 97, 12974–12983. [Google Scholar] [CrossRef]
- Jurasekova, Z.; Domingo, C.; García-Ramos, J.V.; Sánchez-Cortés, S. Effect of pH on the chemical modification of quercetin and structurally related flavonoids characterized by optical (UV-visible and Raman) spectroscopy. Phys. Chem. Chem. Phys. 2014, 16, 12802–12811. [Google Scholar] [CrossRef] [PubMed] [Green Version]
- Zenkevich, I.G.; Eshchenko, A.Y.; Makarova, S.V.; Vitenberg, A.G.; Dobryakov, Y.G.; Utsal, V.A. Identification of the Products of Oxidation of Quercetin by Air Oxygenat Ambient Temperature. Molcules 2007, 12, 654–672. [Google Scholar] [CrossRef] [Green Version]
- Shume, W.M.; Murthy, H.C.A.; Zereffa, E.A. A Review on Synthesis and Characterization of Ag2O Nanoparticles for Photocatalytic Applications. J. Chem. 2020, 2020, 9479. [Google Scholar] [CrossRef]
- Kędziora, A.; Speruda, M.; Krzyżewska, E.; Rybka, J.; Łukowiak, A.; Bugla-Płoskońska, G. Similarities and Differences between Silver Ions and Silver in Nanoforms as Antibacterial Agents. Int. J. Mol. Sci. 2018, 19, 444. [Google Scholar] [CrossRef] [PubMed] [Green Version]
- Lee, S.; Jung, H.J.; Choi, H.C.; Hwang, Y.S.; Choi, M.Y. Solvent Acting as a Precursor: Synthesis of AgCN From AgNO3 in N,N-DMF Solvent by Laser Ablation. Bull. Korean Chem. Soc. 2017, 38, 136–139. [Google Scholar] [CrossRef]
- Burton, G.; Ingold, K.U. beta-Carotene: An unusual type of lipid antioxidant. Science 1984, 224, 569–573. [Google Scholar] [CrossRef] [PubMed]
- Horiuchi, S.; Tachibana, Y.; Yamashita, M.; Yamamoto, K.; Masai, K.; Takase, K.; Matsutani, T.; Kawamata, S.; Kurashige, Y.; Yanai, T.; et al. Multinuclear metal-binding ability of a carotene. Nat. Commun. 2015, 6, 6742. [Google Scholar] [CrossRef] [PubMed] [Green Version]
- Umadevi, M.; Shalini, S.; Bindhu, M.R. Synthesis of silver nanoparticle using D. carota extract. Adv. Nat. Sci. Nanosci. Nanotechnol. 2012, 3, 025008. [Google Scholar] [CrossRef] [Green Version]
- Rycenga, M.; Cobley, C.M.; Zeng, J.; Li, W.; Moran, C.H.; Zhang, Q.; Qin, D.; Xia, Y. Controlling the Synthesis and Assembly of Silver Nanostructures for Plasmonic Applications. Chem. Rev. 2011, 111, 3669–3712. [Google Scholar] [CrossRef] [Green Version]
- Irudayaraj, J.M. Biomedical Nanosensors; Pan Stanford: Boca Ratón, FL, USA, 2012. [Google Scholar]
- Loiseau, A.; Asila, V.; Boitel-Aullen, G.; Lam, M.; Salmain, M.; Boujday, S. Silver-Based Plasmonic Nanoparticles for and Their Use in Biosensing. Biosensors 2019, 9, 78. [Google Scholar] [CrossRef] [Green Version]
- Tsuji, M.; Gomi, S.; Maeda, Y.; Matsunaga, M.; Hikino, S.; Uto, K.; Tsuji, T.; Kawazumi, H. Rapid Transformation from Spherical Nanoparticles, Nanorods, Cubes, or Bipyramids to Triangular Prisms of Silver with PVP, Citrate, and H2O2. Langmuir 2012, 28, 8845–8861. [Google Scholar] [CrossRef] [PubMed]
- Tao, A.R.; Habas, S.; Yang, P. Shape Control of Colloidal Metal Nanocrystals. Small 2008, 4, 310–325. [Google Scholar] [CrossRef]
- Zhang, Q.; Li, N.; Goebl, J.; Lu, Z.; Yin, Y. A systematic study of the synthesis of silver nanoplates: Is citrate a “magic” reagent? J. Am. Chem. Soc. 2011, 133, 18931–18939. [Google Scholar] [CrossRef]
- Pastoriza-Santos, I.; Liz-Marzán, L.M. Colloidal silver nanoplates. State of the art and future challenges. J. Mater. Chem. 2008, 18, 1724–1737. [Google Scholar] [CrossRef]
- Millstone, J.; Hurst, S.J.; Métraux, G.S.; Cutler, J.I.; Mirkin, C.A. Colloidal Gold and Silver Triangular Nanoprisms. Small 2009, 5, 646–664. [Google Scholar] [CrossRef] [PubMed]
- Zhang, Q.; Hu, Y.; Guo, S.; Goebl, J.; Yin, Y. Seeded Growth of Uniform Ag Nanoplates with High Aspect Ratio and Widely Tunable Surface Plasmon Bands. Nano Lett. 2010, 10, 5037–5042. [Google Scholar] [CrossRef]
- Bhatt, R.R.; Shah, B.A. Sorption studies of heavy metal ions by salicylic acid–formaldehyde–catechol terpolymeric resin: Isotherm, kinetic and thermodynamics. Arab. J. Chem. 2015, 8, 414–426. [Google Scholar] [CrossRef] [Green Version]
- Standke, B.; Jansen, M. Ag3O4, the First Silver(II,III) Oxide. Angew. Chem. Int. Ed. 1986, 25, 77–78. [Google Scholar] [CrossRef]
- Hammad, A.H.; Abdel-Wahab MS, H.; Alshahrie, A. Structural and morphological properties of sputtered silver oxide thin films: The effect of thin film thickness. Dig. J. Nanomater. Bios. 2016, 11, 1245–1252. [Google Scholar]
- Materials Project ID: mp-11872 Ag2O3. Available online: https://materialsproject.org/materials/mp-11872/ (accessed on 8 July 2021).
- Materials Project ID: mp-1605 Ag3O4. Available online: https://materialsproject.org/materials/mp-1605/ (accessed on 8 July 2021).
- Wexler, R.B.; Qiu, T.; Rappe, A.M. Automatic Prediction of Surface Phase Diagrams Using Ab Initio Grand Canonical Monte Carlo. J. Phys. Chem. C 2019, 123, 2321–2328. [Google Scholar] [CrossRef]
- Michaelides, A.; Reuter, K.; Scheffler, M. When seeing is not believing: Oxygen on Ag(111), a simple adsorption system? J. Vac. Sci. Technol. A 2005, 23, 1487. [Google Scholar] [CrossRef]
- Zhang, X.-F.; Liu, Z.-G.; Shen, W.; Gurunathan, S. Silver Nanoparticles: Synthesis, Characterization, Properties, Applications, and Therapeutic Approaches. Int. J. Mol. Sci. 2016, 17, 1534. [Google Scholar] [CrossRef]
- Della Pelle, F.; Scroccarello, A.; Sergi, M.; Mascini, M.; Del Carlo, M.; Compagnone, D. Simple and rapid silver nanoparticles based antioxidant capacity assays: Reactivity study for phenolic compounds. Food Chem. 2018, 256, 342–349. [Google Scholar] [CrossRef]
- Nascimento, C.; Amarasiriwardena, D.; Xing, B. Comparison of natural organic acids and synthetic chelates at enhancing phytoextraction of metals from a multi-metal contaminated soil. Environ. Pollut. 2006, 140, 114–123. [Google Scholar] [CrossRef]
- Amini, S.M. Preparation of antimicrobial metallic nanoparticles with bioactive compounds. Mater. Sci. Eng. C 2019, 103, 109809. [Google Scholar] [CrossRef] [PubMed]
- Li, D.; Liu, Z.; Yuan, Y.; Liu, Y.; Niu, F. Green synthesis of gallic acid-coated silver nanoparticles with high antimicrobial activity and low cytotoxicity to normal cells. Process. Biochem. 2015, 50, 357–366. [Google Scholar] [CrossRef]
- Riaz, M.; Mutreja, V.; Sareen, S.; Ahmad, B.; Faheem, M.; Zahid, N.; Jabbour, G.; Park, J. Exceptional antibacterial and cytotoxic potency of monodisperse greener AgNPs prepared under optimized pH and temperature. Sci. Rep. 2021, 11, 1–11. [Google Scholar] [CrossRef] [PubMed]
- Martínez-Castañón, G.A.; Niño, N.; Martinezgutierrez, F.; Martínez-Mendoza, J.R.; Ruiz, F. Synthesis and antibacterial activity of silver nanoparticles with different sizes. J. Nanoparticle Res. 2008, 10, 1343–1348. [Google Scholar] [CrossRef]
- Kim, D.-Y.; Sung, J.S.; Kim, M.; Ghodake, G. Rapid production of silver nanoparticles at large-scale using gallic acid and their antibacterial assessment. Mater. Lett. 2015, 155, 62–64. [Google Scholar] [CrossRef]
- Popescu, L.; Ababei, G.; Babusca, D.; Creanga, D.; Benchea, C.A.; Lupu, N.; Oprica, L. Spectral Investigation of Surface Plasmon Resonance Bands of Silver Nanoparticles Capped with Gallic Acid. In Proceedings of the VI Latin American Congress on Biomedical Engineering CLAIB 2014, Paraná, Argentina, 29–31 October 2014; Springer: Cham, Switzerland, 2019; pp. 305–309. [Google Scholar]
- Park, J.; Cha, S.-H.; Cho, S.; Park, Y. Green synthesis of gold and silver nanoparticles using gallic acid: Catalytic activity and conversion yield toward the 4-nitrophenol reduction reaction. J. Nanoparticle Res. 2016, 18, 1–13. [Google Scholar] [CrossRef]
- Lok, C.-N.; Ho, C.-M.; Chen, R.; He, Q.-Y.; Yu, W.-Y.; Sun, H.; Tam, P.K.-H.; Chiu, J.-F.; Che, C.-M. Silver nanoparticles: Partial oxidation and antibacterial activities. JBIC J. Biol. Inorg. Chem. 2007, 12, 527–534. [Google Scholar] [CrossRef] [PubMed]
- Nair, L.S.; Laurencin, C.T. Silver Nanoparticles: Synthesis and Therapeutic Applications. J. Biomed. Nanotechnol. 2007, 3, 301–316. [Google Scholar] [CrossRef]
- Prabhu, S.; Poulose, E.K. Silver nanoparticles: Mechanism of antimicrobial action, synthesis, medical applications, and toxicity effects. Int. Nano Lett. 2012, 2, 32. [Google Scholar] [CrossRef] [Green Version]
- Cholula-Díaz, J.L.; Marroquin, D.L.L.; Pramanick, B.; Nieto-Argüello, A.; Cantú-Castillo, L.A.; Hwang, H. Synthesis of colloidal silver nanoparticle clusters and their application in ascorbic acid detection by SERS. Colloids Surfaces B Biointerfaces 2018, 163, 329–335. [Google Scholar] [CrossRef]
- Chen, P.; Yan, S.; Sawyer, E.; Ying, B.; Wei, X.; Wu, Z.; Geng, J. Rapid and simple detection of ascorbic acid and alkaline phosphatase via controlled generation of silver nanoparticles and selective recognition. Analyst 2019, 144, 1147–1152. [Google Scholar] [CrossRef] [PubMed] [Green Version]
- Harraz, F.A.; Faisal, M.; Al-Salami, A.; El-Toni, A.M.; Almadiy, A.; Al-Sayari, S.; Al-Assiri, M.S. Silver nanoparticles decorated stain-etched mesoporous silicon for sensitive, selective detection of ascorbic acid. Mater. Lett. 2019, 234, 96–100. [Google Scholar] [CrossRef]
- Liu, J.; Wang, L.; Bao, H. A novel fluorescent probe for ascorbic acid based on seed-mediated growth of silver nanoparticles quenching of carbon dots fluorescence. Anal. Bioanal. Chem. 2018, 411, 877–883. [Google Scholar] [CrossRef] [PubMed]
- Park, H.W.; Alam, S.M.; Lee, S.H.; Karim, M.M.; Wabaidur, S.M.; Kang, M.; Choi, J.H. Optical ascorbic acid sensor based on the fluorescence quenching of silver nanoparticles. Luminescence 2009, 24, 367–371. [Google Scholar] [CrossRef] [PubMed]
- Siddiqui, M.R.H.; Adil, S.; Assal, M.; Ali, R.; Al-Warthan, A.A. Synthesis and Characterization of Silver Oxide and Silver Chloride Nanoparticles with High Thermal Stability. Asian J. Chem. 2013, 25, 3405–3409. [Google Scholar] [CrossRef]
- Xiong, J.; Wang, Y.; Xue, Q.; Wu, X. Synthesis of highly stable dispersions of nanosized copper particles using l-ascorbic acid. Green Chem. 2011, 13, 900–904. [Google Scholar] [CrossRef]
- Khatha, P.; Phutthaphongloet, T.; Timpa, P.; Ninwong, B.; Income, K.; Ratnarathorn, N.; Dungchai, W. Distance-Based Paper Device Combined with Headspace Extraction for Determination of Cyanide. Sensors 2019, 19, 2340. [Google Scholar] [CrossRef] [Green Version]
- Pecci, J.; Foye, W.O. The Avidity of Salicylic, Gentisic, and Salicyluric Acids for Heavy Metal Cations**Received August 21 1959, from the Department of Chemistry, Massachusetts College of Pharmacy, Boston. J. Am. Pharm. Assoc. 1960, 49, 411–414. [Google Scholar] [CrossRef]
- Gusrizal, G.; Santosa, S.J.; Kunarti, E.S.; Rusdiarso, B. Synthesis of Silver Nanoparticles by Reduction of Silver Ion with m-Hydroxybenzoic Acid. Asian J. Chem. 2017, 29, 1417–1422. [Google Scholar] [CrossRef]
- Susanthy, D.; Fadliah; Wahyuni, E.T.; Santosa, S.J. Synthesis of Silver Nanoparticles Using o-Hydroxybenzoic, p-Hydroxybenzoic, and o,p-Dihydroxybenzoic Acids as Reducing Agents. Mater. Sci. Forum 2017, 901, 26–31. [Google Scholar] [CrossRef]
- Krishtalik, L.I. pH-dependent redox potential: How to use it correctly in the activation energy analysis. Biochim. Biophys. Acta (BBA) Bioenerg. 2003, 1604, 13–21. [Google Scholar] [CrossRef] [Green Version]
- Gülçin, I. Antioxidant activity of caffeic acid (3,4-dihydroxycinnamic acid). Toxicology 2006, 217, 213–220. [Google Scholar] [CrossRef]
- Guo, D.; Dou, D.; Ge, L.; Huang, Z.; Wang, L.; Gu, N. A caffeic acid mediated facile synthesis of silver nanoparticles with powerful anti-cancer activity. Colloids Surfaces B Biointerfaces 2015, 134, 229–234. [Google Scholar] [CrossRef]
- Kim, K.; Han, J.W. Effect of caffeic acid adsorption in controlling the morphology of gold nanoparticles: Role of surface coverage and functional groups. Phys. Chem. Chem. Phys. 2016, 18, 27775–27783. [Google Scholar] [CrossRef] [PubMed]
- Liu, Y.-S.; Chang, Y.-C.; Chen, H.-H. Silver nanoparticle biosynthesis by using phenolic acids in rice husk extract as reducing agents and dispersants. J. Food Drug Anal. 2018, 26, 649–656. [Google Scholar] [CrossRef] [Green Version]
- Cuevas-Valenzuela, J.; Gonzalez, A.; Wisniak, J.; Apelblat, A.; Perez-Correa, J. Solubility of (+)-catechin in water and water-ethanol mixtures within the temperature range 277.6–331.2K: Fundamental data to design polyphenol extraction processes. Fluid Phase Equilibria 2014, 382, 279–285. [Google Scholar] [CrossRef]
- Katalinić, V.; Milos, M.; Modun, D.; Musić, I.; Boban, M. Antioxidant effectiveness of selected wines in comparison with (+)-catechin. Food Chem. 2004, 86, 593–600. [Google Scholar] [CrossRef]
- Martinez, S.; Valek, L.; Petrović, Ž.; Metikoš-Huković, M.; Piljac, J. Catechin antioxidant action at various pH studied by cyclic voltammetry and PM3 semi-empirical calculations. J. Electroanal. Chem. 2005, 584, 92–99. [Google Scholar] [CrossRef]
- Torreggiani, A.; Jurasekova, Z.; Sanchez-Cortes, S.; Tamba, M. Spectroscopic and pulse radiolysis studies of the antioxidant properties of (+) catechin: Metal chelation and oxidizing radical scavenging. J. Raman Spectrosc. Int. J. Orig. Work. Asp. Raman Spectrosc. Incl. High. Order Process. Brillouin Rayleigh Scatt. 2008, 39, 265–275. [Google Scholar] [CrossRef]
- Souza, R.F.; De Giovani, W.F. Antioxidant properties of complexes of flavonoids with metal ions. Redox Rep. 2004, 9, 97–104. [Google Scholar] [CrossRef] [PubMed] [Green Version]
- Li, Y.; Wang, S.; Liu, Q.-Y.; Chen, Z. A Chrono-Colorimetric Sensor Array for Differentiation of Catechins Based on Silver Nitrate-Induced Metallization of Gold Nanoparticles at Different Reaction Time Intervals. ACS Sustain. Chem. Eng. 2019, 7, 17306–17312. [Google Scholar] [CrossRef]
- Das, S.; Langbang, L.; Haque, M.; Belwal, V.K.; Aguan, K.; Roy, A.S. Biocompatible silver nanoparticles: An investigation into their protein binding efficacies, anti-bacterial effects and cell cytotoxicity studies. J. Pharm. Anal. 2020. [Google Scholar] [CrossRef]
- Rengga, W.D.P.; Yufitasari, A.; Adi, W. Synthesis of Silver Nanoparticles from Silver Nitrate Solution Using Green Tea Extract (Camelia Sinensis) as Bioreductor. J. Bahan Alam Terbarukan 2017, 6, 32–38. [Google Scholar] [CrossRef] [Green Version]
- Oliver, S.; Wagh, H.; Liang, Y.; Yang, S.; Boyer, C. Enhancing the antimicrobial and antibiofilm effectiveness of silver nanoparticles prepared by green synthesis. J. Mater. Chem. B 2018, 6, 4124–4138. [Google Scholar] [CrossRef] [PubMed]
- Keunen, R.; Cathcart, N.; Kitaev, V. Plasmon mediated shape and size selective synthesis of icosahedral silver nanoparticles via oxidative etching and their 1-D transformation to pentagonal pins. Nanoscale 2014, 6, 8045–8051. [Google Scholar] [CrossRef]
- Elechiguerra, J.L.; Reyes-Gasga, J.; Yacaman, M.J. The role of twinning in shape evolution of anisotropic noble metal nanostructures. J. Mater. Chem. 2006, 16, 3906–3919. [Google Scholar] [CrossRef]
- Pawar, O.; Deshpande, N.; Dagade, S.; Waghmode, S.; Joshi, P.N. Green synthesis of silver nanoparticles from purple acid phosphatase apoenzyme isolated from a new sourceLimonia acidissima. J. Exp. Nanosci. 2016, 11, 28–37. [Google Scholar] [CrossRef]
- Kumaran, K.T.; Kiruthika, G.V.M.; Arulraj, I.; Ragupathy, P. Quinone-Wrapped Nanostructured MnO2: A Synergetic Approach to Enhanced Supercapacitive Behavior and Magnetic Properties. J. Electrochem. Soc. 2016, 163, A1743–A1752. [Google Scholar] [CrossRef]
- Goldstein, W.S.; Spencer, K.C. Inhibition of Cyanogenesis by tannins. J. Chem. Ecol. 1985, 11, 847–858. [Google Scholar] [CrossRef]
- Raja, P.B.; Rahim, A.A.; Qureshi, A.K.; Awang, K. Green synthesis of silver nanoparticles using tannins. Mater. Sci. 2014, 32, 408–413. [Google Scholar] [CrossRef] [Green Version]
- Braghiroli, F.L.; Fierro, V.; Szczurek, A.; Gadonneix, P.; Ghanbaja, J.; Parmentier, J.; Medjahdi, G.; Celzard, A. Hydrothermal Treatment of Tannin: A Route to Porous Metal Oxides and Metal/Carbon Hybrid Materials. Inorganics 2017, 5, 7. [Google Scholar] [CrossRef] [Green Version]
- Thuong, P.T.; Hung, T.M.; Ngoc, T.M.; Ha, D.T.; Min, B.S.; Kwack, S.J.; Bae, K. Antioxidant activities of coumarins from Korean medicinal plants and their structure–activity relationships. Phytother. Res. Int. J. Devoted Pharmacol. Toxicol. Eval. Nat. Prod. Deriv. 2010, 24, 101–106. [Google Scholar]
- Catapano, M.C.; Karlíčková, J.; Tvrdý, V.; Sharma, S.; Prasad, A.K.; Saso, L.; Chhillar, A.K.; Kuneš, J.; Pour, M.; Parmar, V.S.; et al. Mono and dihydroxy coumarin derivatives: Copper chelation and reduction ability. J. Trace Elements Med. Biol. 2018, 46, 88–95. [Google Scholar] [CrossRef] [PubMed]
- Huang, T.; Xu, X.-H.N. Synthesis and characterization of tunable rainbow colored colloidal silver nanoparticles using single-nanoparticle plasmonic microscopy and spectroscopy. J. Mater. Chem. 2010, 20, 9867–9876. [Google Scholar] [CrossRef] [PubMed] [Green Version]
- Patterson, A.L. The Scherrer Formula for X-Ray Particle Size Determination. Phys. Rev. 1939, 56, 978–1939. [Google Scholar] [CrossRef]
- Scherrer, P. Göttinger Nachrichten Math. Physical 1918, 2, 98–100. [Google Scholar]
- Callejas, F.R. Tablas de Espectroscopía Infrarroja; Departamento de Física y Química, UNAM (Universidad Nacional Autónoma de México): Mexico City, Mexico, 2000. [Google Scholar]
- Hajizadeh, S.; Farhadi, K.; Forough, M.; Sabzi, R.E. Silver nanoparticles as a cyanide colorimetric sensor in aqueous media. Anal. Methods 2011, 3, 2599–2603. [Google Scholar] [CrossRef]
- Paramelle, D.; Sadovoy, A.; Gorelik, S.; Free, P.; Hobley, J.; Fernig, D. A rapid method to estimate the concentration of citrate capped silver nanoparticles from UV-visible light spectra. Analyst 2014, 139, 4855–4861. [Google Scholar] [CrossRef]
- Kalishwaralal, K.; Deepak, V.; Pandian, S.R.K.; Kottaisamy, M.; BarathManiKanth, S.; Kartikeyan, B.; Gurunathan, S. Biosynthesis of silver and gold nanoparticles using Brevibacterium casei. Colloids Surfaces B Biointerfaces 2010, 77, 257–262. [Google Scholar] [CrossRef]
- Liu, Y.; Lu, Y.; Yang, X.; Zheng, X.; Wen, S.; Wang, F.; Vidal, X.; Zhao, J.; Liu, D.; Zhou, Z.; et al. Amplified stimulated emission in upconversion nanoparticles for super-resolution nanoscopy. Nat. Cell Biol. 2017, 543, 229–233. [Google Scholar] [CrossRef] [PubMed]


| Concentration (nM) | ||||
|---|---|---|---|---|
| Antioxidant | 20 nm | 50 nm | 70 nm | 80 nm |
| Gallic acid | - | - | 30 | - |
| Ascorbic acid | 73.6 | 11.4 | - | 4.6 |
| Hydroxybenzoic acid | - | 1.9 | - | 0.6 |
| Caffeic acid | - | 13.5 | - | 3.2 |
| Catechin | 27.3 | 2.9 | - | 1.1 |
| Scopoletin | - | - | 11.1 | - |
| Theoretical | 4000 | 260 | 100 | 53 |
Publisher’s Note: MDPI stays neutral with regard to jurisdictional claims in published maps and institutional affiliations. |
© 2021 by the authors. Licensee MDPI, Basel, Switzerland. This article is an open access article distributed under the terms and conditions of the Creative Commons Attribution (CC BY) license (https://creativecommons.org/licenses/by/4.0/).
Share and Cite
Al-Zahrani, S.; Astudillo-Calderón, S.; Pintos, B.; Pérez-Urria, E.; Manzanera, J.A.; Martín, L.; Gomez-Garay, A. Role of Synthetic Plant Extracts on the Production of Silver-Derived Nanoparticles. Plants 2021, 10, 1671. https://doi.org/10.3390/plants10081671
Al-Zahrani S, Astudillo-Calderón S, Pintos B, Pérez-Urria E, Manzanera JA, Martín L, Gomez-Garay A. Role of Synthetic Plant Extracts on the Production of Silver-Derived Nanoparticles. Plants. 2021; 10(8):1671. https://doi.org/10.3390/plants10081671
Chicago/Turabian StyleAl-Zahrani, Sabah, Sergio Astudillo-Calderón, Beatriz Pintos, Elena Pérez-Urria, José Antonio Manzanera, Luisa Martín, and Arancha Gomez-Garay. 2021. "Role of Synthetic Plant Extracts on the Production of Silver-Derived Nanoparticles" Plants 10, no. 8: 1671. https://doi.org/10.3390/plants10081671