Article

Evaluation and Selection of Interspecific Lines of Groundnut (Arachis hypogaea L.) for Resistance to Leaf Spot Disease and for Yield Improvement

by
Nicholas N. Denwar
1,2,†,
Charles E. Simpson
3,
James L. Starr
4,
Terry A. Wheeler
5 and
Mark D. Burow
2,5,*
1
Savanna Agricultural Research Institute, Tamale P.O. Box TL52, Ghana
2
Department of Plant and Soil Science, Texas Tech University, Lubbock, TX 79409, USA
3
Texas A&M AgriLife Research, Stephenville, TX 76401, USA
4
Department of Plant Pathology and Microbiology, College Station, Texas A&M University, Corpus Christi, TX 77843, USA
5
Texas A&M AgriLife Research, Lubbock, TX 79403, USA
*
Author to whom correspondence should be addressed.
This work was done in partial fulfillment of the work for the Ph.D. degree.
Plants 2021, 10(5), 873; https://doi.org/10.3390/plants10050873
Submission received: 7 March 2021 / Revised: 14 April 2021 / Accepted: 14 April 2021 / Published: 26 April 2021

Abstract

:
Early and late leaf spot are two devastating diseases of peanut (Arachis hypogaea L.) worldwide. The development of a fertile, cross-compatible synthetic amphidiploid, TxAG-6 ([A. batizocoi × (A. cardenasii × A. diogoi)]4x), opened novel opportunities for the introgression of wild alleles for disease and pest resistance into commercial cultivars. Twenty-seven interspecific lines selected from prior evaluation of an advanced backcross population were evaluated for resistance to early and late leaf spot, and for yield in two locations in Ghana in 2006 and 2007. Several interspecific lines had early leaf spot scores significantly lower than the susceptible parent, indicating that resistance to leaf spot had been successfully introgressed and retained after three cycles of backcrossing. Time to appearance of early leaf spot symptoms was less in the introgression lines than in susceptible check cultivars, but the opposite was true for late leaf spot. Selected lines from families 43-08, 43-09, 50-04, and 60-02 had significantly reduced leaf spot scores, while lines from families 43-09, 44-10, and 63-06 had high pod yields. One line combined both resistance to leaf spot and high pod yield, and several other useful lines were also identified. Results suggest that it is possible to break linkage drag for low yield that accompanies resistance. However, results also suggest that resistance was diluted in many of the breeding lines, likely a result of the multigenic nature of resistance. Future QTL analysis may be useful to identify alleles for resistance and allow recombination and pyramiding of resistance alleles while reducing linkage drag.

1. Introduction

Early leaf spot (ELS) (caused by Passalora arachidicola (Hori) U Braun [Cercospora arachidicola S. Hori]) and late leaf spot (LLS) (caused by Nothopassalora personata (Berk. and M.A. Curtis) U. Braun, C. Nakash, Videira and Crous [Cercosporidium personatum [Berk. and Curtis] Deighton]) diseases are two of the most yield-limiting biotic stresses in peanut (Arachis hypogaea L.) production worldwide [1], causing yield losses of up to 50% [2,3] or even 70% in West Africa [4,5]. Although it has been suggested that resistance to each of these fungal diseases is inherited independently [6], both often occur together, with one predominating in different years and locations, making it imperative to deploy resistance to both pathogens. In the United States these diseases are controlled by fungicides, but application increases production costs by about 10% [7]. A study in Ghana [8] has confirmed that foliar application of fungicides can increase biomass and kernel yields in rainfed peanuts by 39% and 75%, respectively. However, the use of fungicides is not feasible for peasant farmers in Ghana and in most parts of West Africa. Credit facilities for the purchase of inputs and the input availability and delivery systems are not adequately developed. Various biological control agents have been proposed for control of leaf spots [9,10,11]; however, the limited effectiveness of these make them rarely suitable by themselves and they have been rarely used in practice. Better results have been obtained by combining varietal resistance with chemical or biological control and in some cases improved weed management [12,13]. In any case, effective control of these diseases for these farmers includes the use of host plant resistance.
Cultivated peanut [Arachis hypogaea L. (2n = 4x = 40)] is an allotetraploid that is native to South America, and contains two genomes that originated from different diploid wild species ancestors [14]. Earlier investigators [15,16,17] reported the existence of high levels of resistance in wild species in section Arachis to many pests and diseases. Attempts to utilize wild species sources have been difficult because introgressing wild alleles into A. hypogaea is complicated by genomic (A and B genomes) and ploidy (diploid and tetraploid) barriers [16].
Wild species introgression efforts have had some notable successes in peanut, namely in introduction of resistance to the root-knot nematode Meloidogyne arenaria (Neal) Chitwood. A cross was made between the A-genome diploid wild species A. cardenasii and the cultivated A. hypogaea [18,19], followed by doubling the triploid hybrid to the hexaploid level, followed by backcrossing to A. hypogaea and multiple generations of selfing to recover the tetraploid level. This cross resulted in introduction of alleles for resistance to nematodes and identification of markers to two linked genes associated with a reduction in egg counts or galling [20].
A second route for introduction of wild species alleles has also been employed, and which has resulted in the release of nematode-resistant cultivars. A three-way cross, originally proposed by Smartt et al. [21] to introduce alleles for leaf spot resistance, was made, resulting in development of a synthetic amphidiploid, TxAG-6 ([A. batizocoi × (A. cardenasii × A. diogoi)]4x) [17]. This was backcrossed to a component line of the runner cultivar Florunner [22], which was a highly successful cultivar grown for three decades, but lacking significant resistance to disease or pests. Six commercial nematode-resistant cultivars (COAN, NemaTam, Tifguard, Webb, TifN/V OL, and Georgia 14N) resulting from this cross have been released [23,24,25,26,27,28]. The latter five were developed using COAN as allele donor, and many of these cultivars were developed using DNA markers to the Ma-1 gene [29,30,31,32]. However, this resistance was based on selection for a single chromosomal region which gave near-immunity to nematodes.
Tanksley and Nelson [33] proposed the advanced backcross-QTL method as an effective way to couple population advancement with gene discovery. Demonstrated benefits included making introgressed chromosome segments available in a suitable genetic background, sufficient polymorphism for mapping using the markers of that day, and well as reduced genetic background differences for enhancing the statistical power of QTL analysis, and potential to identify cryptic QTLs not expected based on the phenotypes of the parents. Using this approach in peanut, it was demonstrated that seven additional nematode resistance QTLs are present in a re-synthesized BC3 population and are spread over multiple chromosomes [34]. Most of these additional QTLs have weaker phenotypic effects than the Ma-1 allele and were missed in the initial work, which relied on bulked segregant analysis. It is not known whether any of these have been incorporated into any of the commercial cultivars.
In general, introgressing useful alleles from wild species into cultivated crops has challenges because the beneficial alleles for yield and seed quality traits are often in tight linkages with undesirable traits that require several cycles of backcrossing to recover most of the desirable agronomic traits. In the case of the first nematode-resistant cultivar COAN, developed after five backcross generations, resistance was accompanied by linkage drag for low yield. It took two additional cycles of backcrossing to break this linkage, and the cultivar NemaTAM was released as a result [24].
In the case of leaf spots, it is generally considered that resistance is a multigenic trait, unlikely to be controlled by a single major gene [35,36,37], with many components, including initial infection, lesion size, sporulation and defoliation contributing to resistance [38,39,40,41]. High levels of resistance have also been associated with low yield suggesting linkage or pleitropic effects [42], thus breeding for high-yielding cultivars with resistance requires this linkage to be broken.
QTL analysis has in general confirmed these expectations. Khedikar et al., (2010) [43] reported in a cross between TAG24 and GPBD4 the identification of 11 QTLs for LLS that explained from 1.7% to 6.5% of phenotypic variation in three environments. Likewise, 11 QTLs with small-to-moderate effect on resistance to rust were identified, with 1.7% to 7.0% contribution to phenotypic variance each; however, one major QTL accounting for 6.9% to 55.2% of phenotypic variance (depending on environment) was identified, demonstrating that major-effect QTLs do exist for resistance to foliar disease. SNP chip analysis [44] has identified chromatin from A. cardenasii in GPBD 4 and leaf spot-resistant cultivars Bailey [45] and NkatieSARI [46]. Leal-Bertioli et al. [47] reported the mapping of 35 candidate genes and five quantitative trait loci (QTLs) for late leaf spot disease resistance and also indicated several regions within the Arachis genome involved in disease control.
Starting with TxAG-6, a new set of backcross materials was developed using the adapted cultivar Florunner [22] as the recurrent parent, and a genetic map was made from the BC1 generation [48]. BC3F1 single plants developed by the AB-QTL method were tested in the greenhouse for resistance to early leaf spots, and significant differences in lesion number and diameter, incubation period, latency period, and chlorosis were found. Burow et al. [49], using RFLP markers identified three QTLs for incubation period and one each for latency period, lesion number and diameter. QTLs for latency period and lesion number were overlapping, suggesting either linkage between the two or a QTL with pleiotropic effects. Selected progeny of these were advanced and were tested in the field for resistance to rust, early and late leaf spot in Texas, Burkina Faso and Ghana in a continuing effort to develop improved cultivars with acceptable agronomic characters and resistance to leaf spot diseases. Analyses of field data generated in Texas and West Africa over several years [50] was used to select backcross families with resistance to rust, early and late leaf spots, as well as having high yield and other agronomic characters.
However, there was the need to do an in-depth characterization of specific lines to identify those with adaptation to northern Ghana where over 90% of peanut production occurs in that country. Given the similarities in results between the U.S. (Texas), Ghana, and Burkina Faso in previous work [50], it is expected that results of characterization of theses breeding lines will be broadly applicable.
Our hypotheses are that (1) given the high levels of resistance to leaf spots in wild species, it is possible to introduce alleles for resistance to leaf spots into the cultivated species, and that (2) given the linkage drag for yield observed in COAN and the large number of QTLs for leaf spot resistance observed in previous QTL studies, we expect that multiple generations of backcrossing will be needed to break linkage drag for yield. We expect that it will be possible to identify some accessions with competitive yield and resistance to leaf spots.
The objectives of this study were to test these hypotheses by further field evaluation of selected BC3-derived interspecific lines of peanut for yield and resistance to early and late leaf spot diseases. According to our hypotheses, we expect to find some accessions with resistance to leaf spots, and competitive yield. Additionally, we expected to identify promising accessions that can be used as parents for donating useful alleles for varietal development.

2. Results

2.1. Leaf Spots

The combined analyses of early leaf spot scores of the 27 interspecific lines, three susceptible check varieties, and recurrent parent Florunner (Table 1) over environments in Ghana indicated that 20 entries had lower area under disease progress curves (AUDPC) than the susceptible local checks (Spanish, Chinese, and 55-437). Although there was a significant genotype × environment interaction for this and all other traits presented herein (Supplementary Table S1), the effect of genotype was nonetheless significant. In addition, in all Ghanaian environments where there was a statistically significant difference among accessions, the three Spanish check varieties Spanish, Chinese, and 55-437 were in the most susceptible statistical categories (denoted ‘a’ or ‘b’ in the means separation tests). Florunner (average score = 250) was less susceptible than Spanish (average score = 287) or 55-437 (average score = 267). Three introgression lines (50-02-04-01, 50-04-01-03, and 43-08-07-02) were also significantly less susceptible than Florunner across Ghanaian environments, and three additional introgression lines (43-09-03-02, 41-05-05-03, and 43-09-03-01) had means numerically lower than Florunner and were significantly lower in one or two environments, including Ghana and the U.S. Six introgression lines (50-02-04-01, 43-08-07-02, 41-05-05-03, 60-02-02-03, 43-09-03-02, and 19-05-06-03), including four of the aforementioned ones, also had means in the most resistant statistical category (for example, group ‘d’ at Manga in 2006) in three or four of the four environments where differences were significant. Materials were also tested in the United States at Yoakum, Texas. Four lines (43-08-07-02, 60-02-02-03, 43-09-03-02, and 41-05-05-03) were significantly more resistant than Florunner at Yoakum, as was 45-04-02-01, which had an overall mean higher than Florunner in Ghana, despite having a significantly lower early leaf spot score in two environments. In general, the most resistant entries in the Texas location were also the most resistant ones in Ghana.
For late leaf spot, there were no significant differences over environments in Ghana (Table 2). This was in part due to the lack of significant differences at Manga in 2007; however, 10 entries were statistically more resistant than the susceptible check varieties in two of the three remaining environments. The three entries (43-09-03-02, 60-02-02-03, and 43-08-07-02) that had the numerically lowest late leaf spot scores were also resistant to early leaf spot. One of these was among the three entries statistically better than Florunner for early leaf spot in Ghana, and all three were among the five entries with the lowest early leaf spot scores. Two entries (43-09-03-02 and 43-08-07-02) were in the most resistant statistical category in 3 environments, as was 19-05-06-03. At the Texas location, there were no differences between ratings in any of the entries (data not presented), as late leaf spot incidence was negligible.

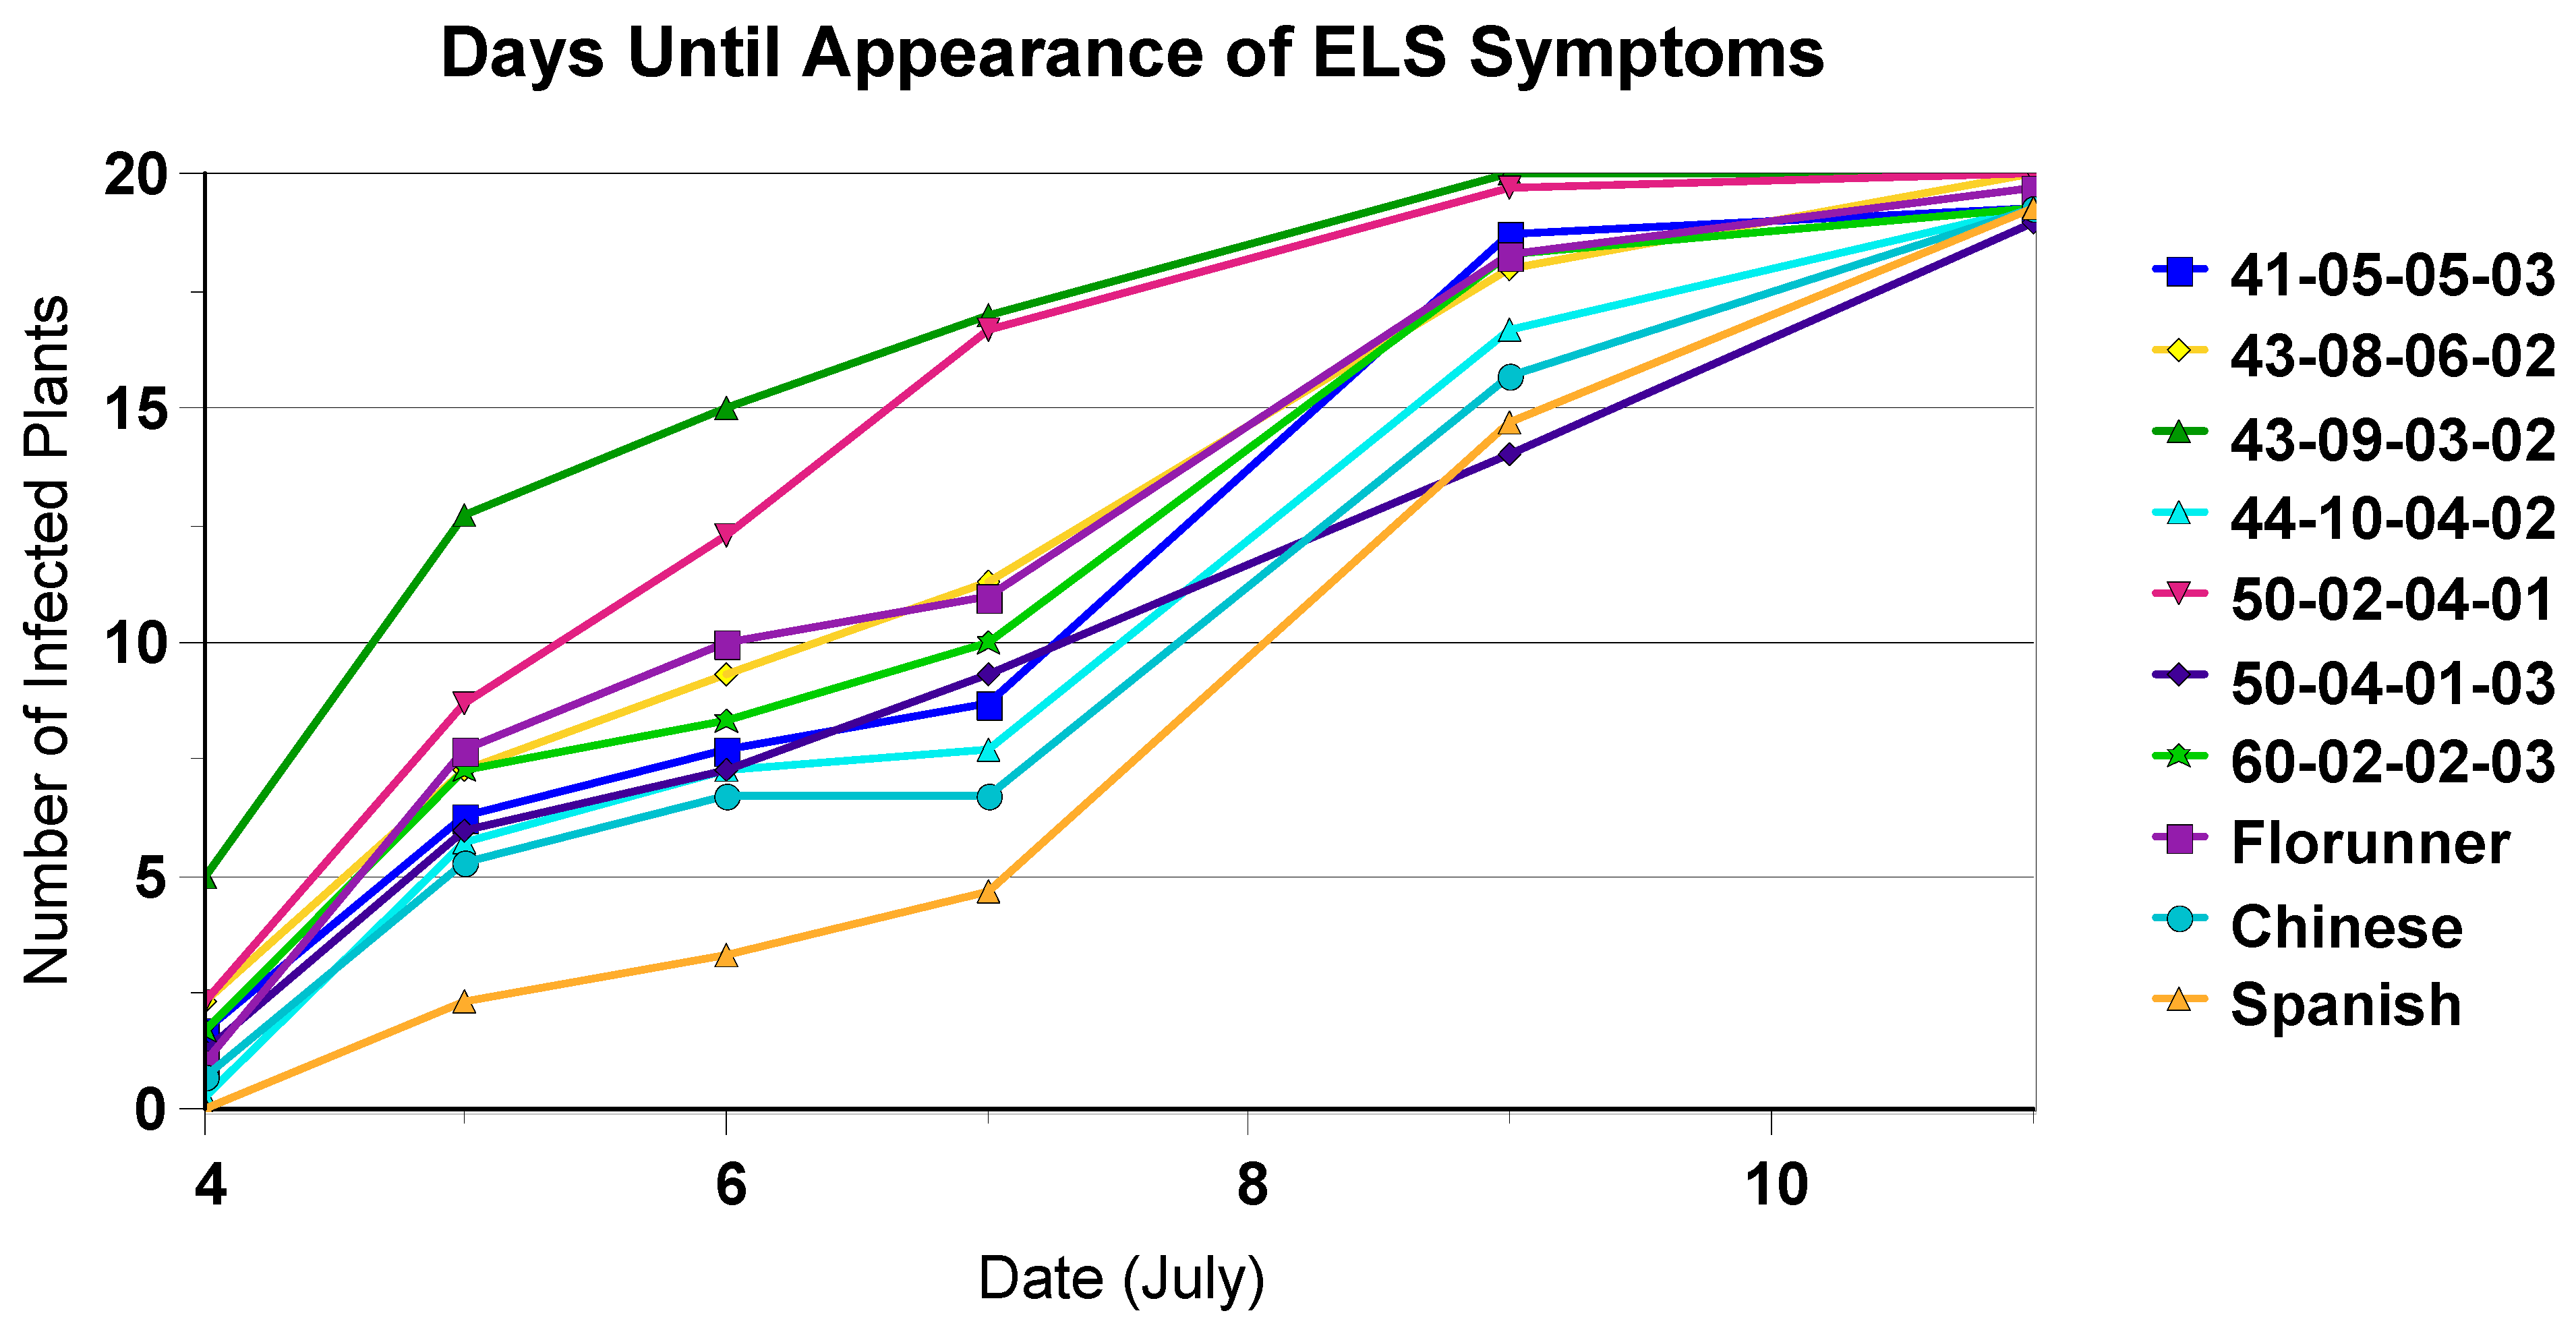
2.2. Time to Appearance of Symptoms

Significant differences existed among the genotypes for time to appearance of the first early leaf spots. This ranged from 27.6 to 34.4 days after planting (DAP) (Table 3) at Nyankpala in 2006 to 36.6 to 48.9 DAP at Manga in 2007. Over all environments, there were large differences among introgression lines when symptoms first appeared. Many of the introgression lines developed initial symptoms earlier than the susceptible checks. Over environments, 19-05-06-03 and 70-03-07-01 were the earliest to manifest symptoms. Lines 45-04-02-01, and 50-04-01-03 were later than most of the introgression lines, but not different than the Chinese, Spanish, and 55-437 check varieties, which were numerically the latest three entries to manifest symptoms, and were the only accessions in the latest statistical category in two or three environments.
Comparing the time to development of early leaf spot symptoms to progression of early leaf spot suggested that the Spanish checks developed symptoms later than the resistant introgression lines (Table 3, Figure 1), but once disease had infected the plants, disease progressed faster in the susceptible materials (Figure 2). It should be noted that at least two of the early leaf spot ratings were taken at dates later than those used for scoring for the appearance of disease symptoms, depending on environment and timing of the onset of disease symptoms. In this case, by the time that the Florida scale ratings were taken, all the plants in a plot had disease symptoms.
For late leaf spot ratings, days to appearance of symptoms were taken in two environments (Manga 2006 and Nyankpala 2006) (Table 4), but results were different than for early leaf spot. Mean time for appearance of late leaf spots appeared for Spanish and Chinese earlier than for all introgression lines, 40 to 42 DAP at Manga, and 44 DAP at Nyankpala. Over environments, ten introgression lines had symptoms appear later than the susceptible checks and the recurrent parent Florunner, and seven lines were in the latest statistical category at both environments.

2.3. Pod Yield

Analysis of pod yields demonstrated that several interspecific lines outyielded the recurrent parent or susceptible checks. Examining means across environments, entries 43-09-03-01 and 44-10-01-02 outyielded the susceptible checks and recurrent parent Florunner; the mean of 63-06-08-02 outyielded susceptible checks across environments (Table 5). Lines 43-09-03-01 and 44-10-01-02 were in the top five yielders in all four environments, while 63-06-08-02 was in the top five in three environments, and 43-09-02-03, 43-08-06-02, and 43-09-03-02 were among the top five in two environments. Entries 46-06-07-02 and 50-02-04-01 were also in the highest-yielding statistical category in two environments.
By comparison, yields of the variety Spanish were numerically less than the overall mean in all four environments; 55–437 yielded less than the mean in three of three environments and Chinese yielded numerically less in one of two environments.
In 2006 in Manga, two introgression lines (43-09-03-01 and 44-10-01-02) yielded over 2 t/ha, while the susceptible checks all yielded 1.0 t/ha or less. Of the three highest-yielding entries in Manga 2006, two of them were of the family 43-09. In Nyankpala in 2006, the susceptible cultivar Chinese yielded numerically higher than all entries but not statistically greater than 43-08-06-02, 44-10-01-02, 41-10-01-03, 43-09-03-01, or 63-06-08-02. The shorter time to maturity of this variety compared to runners may be responsible for its higher relative yield. During the growing season in Nyankpala for 2006 there was cessation of rains in mid-October, less than three months into crop growth (rainfall data not shown). Rainfall post-planting was 400 mm, thus pod filling was very incomplete for late maturing entries, and yields were low even for early maturing entries such as Spanish and Chinese. The crop was in the field for 85 days, more than a month short of full maturity of approximately 120 days for most medium/late cultivars. Additionally, onset of leaf spot was early, and high disease ratings were obtained compared to other years and locations (Table 1 and Table 2).
In 2007, mean yields (kg/ha) were higher than in 2006. In Manga for 2007, line 43-09-03-01 was the highest yielding of all entries, with a value of 3.4 t/ha; 43-09-03-02 yielded well at 2.3 t/ha. A total of ten interspecific lines yielded over 2.0 t/ha at this location. Cultivar Florunner also yielded over 2.0 t/ha. Out of the 27 interspecific lines grown at Nyankpala in 2007, 21 had yields over one ton per hectare, 13 of them over 1.5 kg/ha, and six yielded over 2.0 t/ha.

2.4. Correlations

Correlation co-efficient values between the traits indicated a consistently strong positive association between AUDPC for early and late leaf spot, for both years and locations in Ghana. Correlation co-efficient values between early and late leaf spot ranged from 0.66 to 0.84 (Table 6). The second consistent result was negative correlations (r = −0.35, −0.31) between AUDPC for late leaf spot and time to appearance of late leaf spot symptoms at both locations in 2006.
In three environments (Nyankpala 2006, Manga 2007, and Nyankpala 2007), correlations between disease scores and yield were not significant statistically. In Manga 2006, there was a weak but significant positive correlation between ELS and LLS scores and yield. Correlation between ELS scores and time to appearance of ELS symptoms was nonsignificant in two environments, but positive at Nyankpala in 2006. This positive correlation indicates that the more resistant lines had earlier symptom expression. In this environment, there was a negative correlation between days to symptom expression and late leaf spot scores (more resistant started symptoms later). In 2007 at both sites, early and late leaf spot scores were correlated, but there was no relationship with day of initial symptom expression. Correlations excluded the susceptible checks, for which as noted earlier, time to appearance of symptoms was higher, but disease progression faster.

3. Discussion

3.1. Test of Hypotheses

Two hypotheses of this study were that (a) it is possible to introgress alleles for resistance to leaf spots into cultivated peanut from the wild species to improve resistance in the cultigen, and (b) that it would be possible to break linkage drag between resistance and low yield.

3.1.1. Introgression

Results confirmed that resistance to early leaf spot had indeed been introgressed into the cultivated species, although results for late leaf spot were less clear. The study found numerous interspecific lines that were significantly more resistant to leaf spot than the standard susceptible check cultivars. However, the recurrent parent Florunner, which is considered to be highly susceptible in the U.S., was more resistant in Ghana than were the local susceptible check cultivars Spanish and Chinese, as well as the Senegalese variety 55-437. In comparing introgression lines to Florunner, three accessions had statistically lower early leaf spot ratings than Florunner in the pooled ANOVA across environments. Six accessions were more resistant than Florunner in two Ghanaian environments, and of these, three were more resistant also at Yoakum, TX. It should be noted that results from Nyankpala in 2007, where leaf spot pressure was lower, did not demonstrate the same pattern as the other three environments where leaf spot pressure was higher.
In the case of late leaf spot, there were no significant differences across all environments, although ten accessions were statically more resistant than Spanish, and five of these were numerically but not statistically superior to Florunner in two of four environments. Thus, if resistance to late leaf spot was present, it was at a degree too small to be distinguished statistically. Alternatively, late leaf spot resistance may have been present, but with measurements being confounded with early leaf spot measurements (see below).
Introgression of alleles from wild species was in accord with previous studies that demonstrated the presence of resistance to leaf spots in wild peanut species, including the parental species of TxAG-6. Indeed, the three parents of the TxAG-6 hybrid were selected based on reports of resistance to leaf spots, and the desire to introduce strong resistance into the cultivated species [15,17,19].
The quantitative nature of resistance to leaf spots is in contrast with that observed for resistance to the root-knot nematode, where one chromosomal locus with strong effect was responsible for a reduction of >90% in the number of nematode eggs per gram of root [29]. However, additional resistance alleles were identified later [30,32,34,51], and in QTL studies where it was possible to measure the strength of these alleles, many were shown to have smaller phenotypic effects than Ma-1 [32,34].
The partial nature of resistance suggests that dilution of resistance may have occurred due to multiple backcrosses. Assuming that at least two [16,17,52], five [49,53], or 12 [43] genes for resistance to early or late leaf spot are present in the TxAG-6 parent, most resistance alleles would be absent in any given line. For a BC3F1 line, 25% of the resistance genes from the wild species amphidiploid would be expected to be present, and only in a heterozygous state. After multiple generations of selfing, one of eight genes would be expected to have resistance alleles present, and in the homozygous state. Depending on the number of resistance loci present in the original donor parent, this suggests from zero to two wild species resistance alleles present in any given introgression line, although more could be present depending on segregation of chromosomes and linkage among genes. In addition, if a large number (say from five to 12) of resistance genes were present in the TxAG-6 parent, it would be expected that the contribution of each would be relatively small, assuming that all made equal contributions to resistance.

3.1.2. Breaking Linkage Drag

There was some support for the hypothesis of breaking linkage drag, at least in some lines. Evidence for breaking of linkage drag comes from identification of accessions with yields equal to or greater than Florunner, but with greater leaf spot resistance. Examples of this were 50-02-04-01, as well as 43-09-03-01 and 43-09-03-02.
However, data from other breeding lines suggest that linkage drag may still be present in the population. Evidence for this comes from the presence of only a few selections combining high yield and resistance. In many cases, the most resistant accessions generally were not the ones with the highest yield. Of the six introgression lines with lowest early leaf spot scores, four yielded numerically less than Florunner, and two numerically but not statistically higher. A second alternative is that there could be genetic linkage between disease resistance and late maturity, although this was not measured. The presence of nonsignificant correlations between leaf spot scores and yield in three of four environments might be evidence of breakage of linkage drag. However, under heavy leaf spot pressure, one might expect a negative correlation if resistance contributed to higher yield (see below for further discussion).
The results of this work stand in partial contrast to work performed previously [50], where larger differences among means of BC3-derived families were observed than those in the current experiment. In the former work, larger differences were observed among families for early and late leaf spot in Texas, and in Burkina Faso for overall leaf spot ratings (where early and late leaf spots were not distinguished). However, the smaller differences observed in the current work in Ghana are consistent with the smaller differences observed previously among families in Ghana. It is not known whether this could be due to differences in the pathogen among locations, or differences in environment.

3.2. Selections

A corollary of breaking linkage drag is that it is possible to identify breeding lines with superior resistance and yield that could be used as parents in a breeding program. This has been performed previously for nematode resistance and has resulted in the release of several nematode-resistant varieties. This implicit objective was fulfilled, identifying accessions with evidence of resistance to early leaf spot and with high yield; however, evidence for superior resistance to late leaf spot was equivocal.
First, for resistance, pooled data analysis across locations confirmed the superiority of several breeding lines for disease resistance. Given the large G × E interaction, identification of the best accessions was attempted using three methods (Supplementary Table S2). Up to six selections were made for each method. The first method was analysis of variance over the four pooled environments, with selections being statistically better than the checks. In this case, three introgression lines (50-02-04-01, 50-04-01-03, and 43-08-07-02) were more resistant than the susceptible checks and the recurrent parent Florunner (Table 1); accessions 60-02-02-03, 43-09-03-02, and 41-05-05-03 rounded out the top six based on means over Ghana environments. The second comparison was the number of environments in which an accession performed better than the susceptible checks and Florunner. Of the introgression lines with early leaf spot means over environments numerically lower than Florunner, four (50-04-01-03, 43-09-03-02, 41-05-05-03, and 43-09-03-01) were statistically lower than the checks and recurrent parent in at least two locations in Ghana, and four (43-08-07-02, 60-02-02-03, 43-09-03-02, and 41-05-05-03) were lower in at least one location in Ghana plus at Yoakum. The third comparison counted the number of Ghanaian environments in which each accession was in the most resistant statistical group; here 43-09-03-02, 41-05-05-03 and 60-02-02-03 were counted 4 times, and 19-05-06-03, 50-02-04-01, and 43-08-07-02 were counted three times each. Counting only the accessions that were in the top six selections using all three methods, three lines were selected–these were 43-08-07-02, 60-02-02-03, and 43-09-03-02; 43-08-07-02 was the only selection in the top three for all three methods.
For late leaf spot (Table 2), there were no significant differences over all environments; however, five introgression lines (60-02-02-03, 43-09-03-02, 43-08-07-02, 50-04-01-03, and 43-09-03-01) had the lowest numerical means. Entry 60-02-02-03 had the lowest mean numerically. Ten interspecific lines were superior to susceptible checks at two environments (43-09-03-02, 43-08-07-02, 50-04-01-03, 43-09-03-01, 19-05-06-03, 41-05-05-03, 44-10-04-02, 46-06-04-01, 41-10-03-03, and 45-04-02-01). Only four lines (43-09-03-02, 50-04-01-03, 43-09-03-01, and 45-04-02-01) were statistically superior to Florunner at even one environment. Three lines (43-09-03-02, 43-08-07-02, and 19-05-06-03) were in the most resistant statistical group in all three Ghanaian environments, and 13 additional lines were in the most resistant statistical group in two environments. Four breeding lines were common to all three selection methods (Supplementary Table S2), namely 43-09-03-02, 43-08-07-02, 50-04-01-03, and 43-09-03-01; 60-02-02-03 could be selected based on commonality among two selection methods.
For late leaf spot, that there were no statistically significant differences in mean over environments has several potential explanations. One is that the donor parent TxAG-6 may be less resistant to late leaf spot than early leaf spot. Another possibility is that there may be more and weaker alleles for resistance to late leaf spot than to early leaf spot. A third possible explanation is that scoring of late leaf spot is confounded with scoring for early leaf spot, and therefore it is more difficult to identify differences for late leaf spot.
For yield, two interspecific lines (43-09-03-01 and 44-10-01-02) were superior to Florunner in the pooled ANOVA across locations (Table 5). One additional line (63-06-08-02) was statistically higher yielding than Spanish. These three introgression lines outyielded the susceptible recurrent parent Florunner by 36% or more. Three additional lines (43-09-02-03, 43-08-06-02, and 43-09-03-02) filled out the top six. Four lines (43-09-03-01, 44-10-01-02 plus 43-09-02-03 and 43-09-03-02) had means numerically higher than both Florunner and Spanish in all four environments, and these plus 63-06-08-02, 46-06-07-02, 19-05-06-03, and 50-02-04-01 had means higher in three of four environments. Two lines (43-09-03-01 and 44-10-01-02) were in the top statistical yield category over all four environments in Ghana; 63-06-08-02 was in the top statistical yield category in three environments; and four lines (43-09-02-03, 43-08-06-02, 43-09-03-02, 46-06-07-02) were in the top statistical yield category in two environments. When selections were made according to selections made using all three methods, 43-09-03-01, 43-09-03-02, 44-10-01-02, and 63-06-08-02 were represented in all three listings.
Surprisingly, only three introgression lines significantly outyielded the susceptible checks Spanish (2006 and 2007), and only four outyielded Chinese (Manga, 2006). One explanation is that Chinese is adapted to the area and is widely grown. Additionally, Chinese and Spanish have Spanish growth habits but the introgression lines are runners, and the Spanish type is typically earlier in maturity by several weeks compared to runners. The short growing season in northern Ghana would favor early-maturing accessions, as terminal drought ends the growing season. This is consistent with yield data from Nyankpala in 2006, in which Chinese yielded the best in the short 85 day growing season that year.
For making selections for both resistance to leaf spots and for high yield (Supplementary Table S2), few lines possessed both high levels of disease resistance and high yield. Selecting based on mean ranks summed across ELS, LLS, and yield, line 43-09-03-02 was the top breeding line, and 43-09-03-01, 43-08-07-02, 50-02-04-01, 19-05-06-03, and 43-08-06-02 made the top six. Based on number of environments where means were superior to susceptible checks, 43-09-03-02 was the top entry, with 43-09-03-01, 50-04-01-03, 41-05-05-03, 43-08-07-02, and 19-05-06-03 filling out the top six. Based on number of times in the most favorable statistical category, entry 43-09-03-02 had the highest score, followed by 19-05-06-03, 41-05-05-03, 50-02-04-01, and 43-09-03-01. Four lines were selections in all three methods of selection—43-09-03-02 was the top entry according to all three methods, and 19-05-06-03, 43-08-07-02, 43-09-03-01 were the other three selections. Three of these were derived from the same BC1 line (#43), and so might be expected to possess some alleles in common. Entries 41-05-05-03, 50-02-04-01, and 60-02-02-03 were selections common to two of the three methods, but 41-05-05-03 and 60-02-02-03 had pooled mean yields that were numerically lower than Florunner. These might be useful sources of resistance that might differ in alleles from the selections based on BC1-43, but their use may require breakage of linkage drag to low yield in additional generations of crossing and selection.
One of these accessions (43-09-03-02) is currently being used in marker-assisted backcrossing breeding programs in Texas and Ghana. In a similar evaluation of interspecific lines, Ouedraogo et al. [54] suggested that at least one interspecific line combined genes conditioning resistance to both leaf spot diseases and high yield in peanut, supporting our conclusion that TxAG-6 was an effective bridge in introgressing resistance alleles from wild ancestors of Arachis into cultivated peanut as the introgressed lines performed better than the recurrent parent in most of the traits studied.

3.3. Early and Late Leaf Spot Ratings

Distinguishing early from late leaf spot was possible, but may not have been reflected fully in the ratings. Measurements of early and late leaf spots were made in an effort to distinguish the two diseases. The two diseases can be distinguished from each other easily by physical appearance of the spots—there is a yellow halo around the brown early leaf spot lesions, and absence of the halo and black color for late leaf spot lesions. As there was a high number of spots of both diseases, scores at these infection levels were based primarily on defoliation, thus rating plants in the field independently for these two traits is difficult and sometimes misleading unless one disease is more prominent. In Yoakum, late leaf spot pressure was low, and so it was possible to make ratings for early leaf spot independently. In general, early leaf spot appears 2 to 4 weeks before late leaf spot, and thus rating for early leaf spot would be less prone to interference from late leaf spot than the opposite case. Given the high incidence of both diseases in Ghana, an alternative for distinguishing the two diseases would be by inoculated growth chamber or greenhouse studies with artificial inoculum.
Significant genotype × environment interactions were observed for all five traits measured. Differences in environment in Ghana involved rainfall between locations. Nyankpala is located in the Guinea Savannah zone and has a long-term average rainfall of approximately 1300 mm. Manga, on the other hand, is located in the Sudan Savannah, and has a lower annual rainfall of approximately 900 mm. An example of the differences could be seen at Nyankpala in 2006, where disease appeared early and high disease scores were obtained, but early cessation of rains resulted in poor yields. At Manga in 2007, onset of early leaf spot was later than at the other two environments where data were taken. Leaf spot ratings among the three environments with high leaf spot pressure were relatively consistent, but rankings at Nyankpala in 2007 were often different from the high-pressure environments. It is possible that this is associated with differences in the speed of development of symptoms.
Despite the presence of significant genotype × environment interactions, differences among genotypes were significant for all traits presented except for late leaf spot AUDPC. A comparison of the number of environments in which an accession was in the most favorable statistical category gave additional support to distinguishing accessions as resistant using means across locations. In addition, the classification of several accessions as resistant both in Ghana and in the U.S. also supported the hypothesis that there were genetic differences for resistance that were consistent across locations.
Additionally, given the wide differences in geography, it is possible that there are differences among the leaf spot pathogens. However, there are no published race-specific differentials for early leaf spot or late leaf spot pathogens. We cannot discount that pathogen differences within a species may exist, but even in this case, the similarity in rankings of the most resistant accessions in Ghana and Texas suggest a common genetic component of resistance.
An exception to this commonality of results between countries appears in comparison of ratings of Florunner in Ghana, which appeared to show that it had some degree of resistance to leaf spots in comparison to the susceptible Spanish checks. However, results from Yoakum in 2005, as well as other environments [55], demonstrate that Florunner is highly susceptible to leaf spots in Texas and numerous introgression lines are significantly more resistant than the recurrent parent. Unfortunately, we did not have seed of the Spanish checks available to plant at Yoakum in 2005, so it is not possible to compare the performance of Florunner to the susceptible Spanish checks at this location. One possibility is that there are differences among strains of the leaf spot pathogens between Texas and West Africa, but no study of this has been performed to date. Alternatively, this could be some effect of environment, or an interaction between infection and senescence of the earlier-maturing Spanish materials.

3.4. Time to Appearance of Symptoms and Disease Incidence

Unexpectedly, almost all the introgression lines had significantly shorter times to appearance of early leaf spot than did the susceptible checks. This apparent contradiction may be an effect of genetic background, in which the Florunner background of all introgression lines develop symptoms sooner than the Spanish background of susceptible check varieties. However, once symptoms developed on the susceptible Spanish varieties, disease progression was faster for early leaf spot. For late leaf spot, the susceptible Spanish checks developed symptoms earlier than the introgression lines. This may indicate that these materials were already succumbing to early leaf spot pressure, and were not able to fight off late leaf spot infection well.
Among the introgression lines, for early leaf spot, there was generally no correlation between AUDPC and time to appearance of symptoms. For late leaf spot, by contrast, there was a strong negative correlation between disease severity and time to appearance of symptoms. This may again signify some difference in response of the groundnut accessions to the two pathogens.
Early leaf spot symptoms appeared earlier at Nyankpala in both years than at Manga. The timing of the appearance of early leaf spot demonstrates differences due to environment. This was also observed by Pande et al. [55]. As the rainfall season normally starts earlier in Nyankpala than Manga, and total rainfall is also higher, the optimum humidity and temperature required to initiate infection is expected to occur earlier at Nyankpala. The rains started in Nyankpala in February of 2006 but it was not until April that rainfall was experienced in Manga; again, while there was rain in Nyankpala in March of 2007, no rain fell in Manga until April.
In field and greenhouse experiments, Pande et al. [55] observed significant differences among interspecific lines and between locations but not between years. They found that the range of incubation period was 8 to 15 days in the greenhouse but 10 to 17 days for the field study. In the current study, incubation period could not be obtained, since disease was initiated naturally. Field results, as reported by Ouedraogo [49], indicated the period to symptom initiation for early leaf spot to be in the range of 15 to 20 days for Yoakum, TX, comparable to what is reported by Tuggle [56] in the range of 18 to 21 days. In the current experiment, disease symptoms appeared later than this, indicating either longer incubation periods, or a delay between planting and presence of sufficient inoculum or interaction phenotype for conditions favorable for disease.

3.5. Correlations

Correlations between early and late leaf spot ratings were high, as has been observed previously. Correlations coefficients between early and late leaf spot AUDPC ratings ranged from 0.65 to 0.89, comparable to those obtained by Anderson et al. [37] that ranged from 0.41 to 0.86. They suggested the high correlation could be due to possible genetic linkage of genes for resistance, or host plant physiology that conferred resistance to both diseases in a population, or confounding of scoring for both diseases.
In the current study, there was a lack of correlation between early leaf spot score and time to appearance of early leaf spot symptoms among introgression lines; however, a negative correlation was found for these under late leaf spot. Chiteka et al. [57,58] found no correlation between resistance and time to appearance of symptoms; however, Dwivedi et al. [59] found that incubation period was negatively correlated with leaf spot score.

3.6. Utility of the AB-QTL Method

Tanksley and Nelson [33] proposed the AB-QTL method as a modification of the inbred-backcross method, to couple introgression with gene discovery. Advantages of this approach were putting introgressed chromatin into a suitable genetic background, breaking of linkage drag, and enhanced statistical power. It was also shown [60] that this could identify cryptic alleles present in the wild species, and two such QTLs for enhanced yield were discovered in Oryza rufipogon. By a similar procedure, additional QTLs for root-knot nematode resistance were found, and cryptic alleles were also found [34].
In the current work, the presence of several accessions with yield greater than the susceptible checks suggests either a favorable combination of alleles for yield and resistance to leaf spots, or perhaps the presence of cryptic alleles for yield. Molecular marker dissection of the response will be necessary to distinguish these.
However, the AB-QTL method has its limitations as is evident here. The current data from Ghana suggest that the introgression lines studied possess moderate resistance to leaf spots. Specifically, multiple cycles of backcrossing have apparently diluted the strength of resistance from what was expected based on reports of resistance of the wild species parents. We might expect few if any major QTLs, although the limited results from Yoakum presented herein may indicate a difference among locations for this. Nevertheless, the use of multiple backcrosses was necessary, as visual observation of BC1 and BC2 breeding lines (Simpson, Starr, and Burow, unpublished observation) in the greenhouse indicated that the BC3 generation from the TxAG-6 x Florunner cross was the first to generate significant numbers of progeny with agronomic characteristics similar to the cultivated recurrent parent.

3.7. Continuing Work

The identification of interspecific introgression lines with enhanced resistance to leaf spots offers the possibility of introduction of novel alleles for resistance into the cultivated species. To do this will involve use of selected breeding lines and crossing by elite materials lacking only resistance to leaf spots. Several introgression lines, including 43-09-03-02 are promising, as they offer both demonstrable resistance to early leaf spot, possibly resistance to late leaf spot, and yield as good as or superior to Florunner under disease conditions.
Development of SNP-based markers and QTL analysis would be beneficial in identification of QTLs. Previously, RFLP and SSR-based maps were developed for the earlier BC1 population [48]. RFLP markers for greenhouse response to early leaf spot have been identified [49], and SSR markers [61] for oil content and composition were identified in BC3F1 and BC3F6 materials, respectively. Use of SNP-based markers would be a substantial improvement in methodology, and allow high-throughput marker-assisted breeding. Initial efforts in this have been reported [62,63].
Carrying these alleles forward can be performed in two ways. The first is directly by marker-assisted backcrossing. The breeding line 43-09-03-02 when under disease pressure has resistance to early leaf spot significant enough to be detected, and has high enough yield to be useful without significant linkage drag. Selection of potential SNP-based QTLs would allow for selection of resistance QTLs in a backcross scheme.
A second, longer-term project would be selection for smaller introgressed chromosome segments due to genetic recombination, and intercrossing to recombine QTLs. Genetic mapping and QTL analysis are expected to identify breeding lines with relatively small introgressed chromosome segments less likely to be accompanied by linkage drag, and possessing genes conferring resistance to leaf spots. Hybridization of introgression lines possessing different, small chromosome segments containing QTLs for resistance has the potential to enhance resistance to levels similar in the wild species parental accessions, but without the undesirable alleles present in the wild species.

4. Materials and Methods

4.1. Plant Materials

The 27 interspecific lines were derived from interspecific crosses made between the amphidiploid TxAG-6 and the component line UF439-16-10-3-2 of the cultivar Florunner [22] and selected on the basis of previous analyses [17,34,48,49,50]. Designations of the introgression lines consist of four sets of two-digit numbers in the pedigree of the materials, referring to BC1 line, BC2 line, BC3F3 line, and BC3F3 single plant, respectively. Backcross materials used in Ghana in 2006 and 2007 were in the BC3F6 and BC3F7 generations, respectively, and in the BC3F5 generation in Texas in 2005. Cultivar Chinese (also known as Shi Tao Chi) was used as a susceptible check and is an early maturing, erect cultivar that has been grown by farmers for many decades in northern Ghana [64]. Spanish has similar characteristics as Chinese. Both have good confectionery and culinary qualities, but are highly susceptible to both diseases. The variety 55-437 is a drought-tolerant, disease-susceptible Spanish type peanut, commonly grown in Senegal [65].

4.2. Field Plot Design and Operations

All 27 interspecific lines were planted in all 5 environments, namely at Nyankpala, Northern Region (9°25′ N, 0°58′ W) and Manga, Upper East Region (11°01′ N, 0°16′ W), Ghana in 2006 and 2007 (BC3F7), and at the former Texas Agricultural Experiment Station experimental farm at Yoakum TX (29°16′ N, 97°07′ W) (BC3F5) in 2005. The design in all three years was a randomized complete block with three replications. Each plot in Ghana consisted of 2 rows at a planting distance of 60 cm between rows and 30 cm between plants, plots 5 m in length. Fertilizer was applied at the rate of 30 kg K2O and 60 kg P2O5 per hectare. Weeds were controlled by hand hoeing at 2 and 6 weeks after planting. Additional weed control was performed as necessary. Plants in Texas were grown in two-row plots 2.4 m in length, 1.5 m between ranges, and 0.91 m between plots. Spreader rows of the susceptible cultivar Florunner were planted between each pair of plots, so that each plot was adjacent to a spreader row. In addition, Florunner was planted at the front and rear of the test.

4.3. Defoliation Ratings

The severity of early and late leaf spot was estimated using the Florida scale (1–10) as follows: 1 = no leaf spot; 2 = very few lesions on leaves, none on the upper canopy; 3 = few lesions on the leaves, very few on the upper canopy; 4 = some lesions, with more on the upper canopy, 5% defoliation; 5 = lesions noticeable even on upper canopy, 20% defoliation; 6 = lesions numerous and very evident on upper canopy, 50% defoliation; 7 = lesions numerous on upper canopy, 75% defoliation; 8 = upper canopy covered with lesions, 90% defoliation; 9 = very few leaves remaining and those covered with lesions, 98% defoliation; and 10 = plants completely defoliated and killed by leaf spot [53].
Early leaf spot scores in Ghana were taken every two weeks beginning one month after emergence. Two ratings were taken at Manga in 2006, three ratings were taken at Nyankpala in 2006, and three ratings each were taken at Manga and Nyankpala in 2007. Late leaf spot scores were taken beginning two months after emergence, the same number of ratings as for early leaf spot. In Yoakum in 2005, only one rating was taken due to the distance between the site and the home base. Even though both early and late leaf lesions occurred on the same plant, they were distinguishable. Early leaf spot is characterized by a light brown lesion with a yellow halo as opposed to the dark brown or black lesions of late leaf spot that lack halos.
Data from Ghana were transformed using the area under the disease progress curve calculation to give a time-weighted mean of Florida scale ratings. This was needed because high disease pressure resulted in high defoliation in some environ-ments by the time of the last rating, making it difficult to distinguish differences among accessions. AUDPC gives a summary of the disease progress from the time of first rating to the last rating [66]:
A U D P C = i n 1 ( y i + y i + 1 2 ) ( t i + 1 t i )
where y = disease intensity, n = number of assessment times and t = time (in days) of the ith rating.

4.4. Time to Appearance of Symptoms

After emergence, each leaf of every plant for each entry was inspected periodically for the appearance of the first leaf lesion; intervals between ratings ranged from 1 to 7 days. The number of days from emergence to the appearance of the first lesion was recorded for that plant. Time to appearance of symptoms for the plot for each foliar disease was calculated by interpolation as the time at which 50% of the plants had at least one lesion from that disease. Ratings were taken at six dates in 2006 at Manga for late leaf spot, and six ratings were taken for early leaf spot and four for late leaf spot in 2006 at Nyankpala. In 2007, six early leaf spot ratings were taken at Manga, and five at Nyankpala. Due to distance and labor constraints, it was not possible to collect data on symptoms initiation period for early leaf spot at Manga in 2006, or for late leaf spot at Manga or Nyankpala in 2007.
Linear interpolation between time points to estimate the time (days after planting) at which 50% of the plants in a plot demonstrated symptoms was performed using the software program CalcIP6 (Supplementary Table S3).

4.5. Pod Yield

Yield per hectare was estimated by converting the pod yield per plot to kilograms per hectare by multiplying the pod yield per plot times the ratio of the area of a hectare divided by the area per plot.

4.6. Statistical Analysis

For analysis over environments, a mixed model was used, with environment and replication within environments as random effects, and accessions as fixed effects. Environments (year and location) were used instead of year and location separately to avoid imbalance in cases where data were not taken in one environment. Mean separation tests were performed using Fisher’s protected LSD when the analysis of variance indicated significant treatment effects at p ≤ 0.05 [67]. Data were analyzed using PROC GLM of SYSTAT 7.0 (SYSTAT Inc., Chicago, IL, USA). Pearson correlations were performed using PROC CORR of SYSTAT 7.0, for backcross introgression lines.

5. Conclusions

Results supported the hypothesis that it is possible to introgress alleles for resistance to early leaf spot from wild species into the cultigen by use of the synthetic amphidiploid TxAG-6 as a parent. Specific resistant accessions were identified. There is evidence that alleles for resistance to late leaf spot may have been introduced also, but evidence was not conclusive. Three accessions were identified with yields superior to the susceptible recurrent parent under disease conditions, suggesting a breakage of linkage between resistance and low yield, or at least that resistance in these materials was sufficient to overcome loss of yield in the recurrent parent under disease.
Lines with low early leaf spot and high yield were identified in the introgression population; these have potential use as parents for future population development. Resistance in introgression lines was lower than expected in Ghana, suggesting that repeated backcrossing resulted in a dilution of resistance alleles effective in that environment. Limited data from Texas suggested that resistant lines were more effective in that environment compared to the recurrent parent.
Identification of QTLs is expected to assist in use of these materials for marker-assisted backcrossing to develop leaf spot-resistant cultivars. Breakage of long introgressed chromosome regions and recombination of alleles by hybridization of different introgression lines is expected to make it possible to recover higher levels of resistance more characteristic of the wild species parents.

Supplementary Materials

The following are available online at https://www.mdpi.com/article/10.3390/plants10050873/s1: Supplementary Table S1, Analysis of variance table; Supplementary Table S2, Summary of selections; Supplementary Table S3, CalcIP6.c—computer program to interpolate percentages of diseased plants over time, and estimate days to 50% infected plants.

Author Contributions

Conceptualization, N.N.D., C.E.S. and M.D.B.; methodology, N.N.D., M.D.B., J.L.S. and T.A.W.; software, M.D.B.; validation, M.D.B. and T.A.W.; formal analysis, N.N.D., T.A.W. and M.D.B.; investigation, N.N.D. and M.D.B.; resources, C.E.S., J.L.S. and M.D.B.; data curation, M.D.B.; writing—original draft preparation, N.N.D.; writing—review and editing, all authors; visualization, M.D.B.; supervision, M.D.B.; project administration, M.D.B.; funding acquisition, M.D.B., C.E.S. and N.N.D. All authors have read and agreed to the published version of the manuscript.

Funding

The authors wish to acknowledge funding support from the following entities: United States Agency for International Development (USAID) through Cooperative Agreement No. 7200AA 18CA00003 to the University of Georgia as management entity for U.S. Feed the Future Innovation Lab for Peanut (2018–2023), Award No. AID-ECG-A-00-07-0001 to the University of Georgia as management entity for U.S. Feed the Future Innovation Lab on Peanut Productivity and Mycotoxin Control (2012–2017), and United States Agency for International Development (USAID) to the University of Georgia as management entity for the Peanut Collaborative Research Support Program. The contents are the responsibility of the authors and do not necessarily reflect the views of USAID or the United States Government. Additional funding was provided by USDA-NIFA Hatch Project TX880351 to M.D.B. and from the Texas Peanut Producers Board to M.D.B. and C.E.S.

Institutional Review Board Statement

Not applicable.

Informed Consent Statement

Not applicable.

Data Availability Statement

Datasets including leaf spot scores and pod yields, time to 50% infection, and the CalcIP6 software source code and executable file used to estimate time to 50% infection have been placed online at Figshare (www.figshare.com). Files may be accessed at https://doi.org/10.6084/m9.figshare.14482791.

Acknowledgments

We also appreciate the logistical support provided by the Director of CSIR-Savanna Agricultural Research Institute, Nyankpala.

Conflicts of Interest

The authors declare no conflict of interest.

References

  1. Shokes, F.M.; Culbreath, A.K. Early and late leaf spots. In Compendium of Peanut Diseases, 2nd ed.; Kokalis-Burelle, N., Porter, D.M., Rodriguez-Kabana, R., Smith, D.H., Subrahmanyam, P., Eds.; APS Press: Saint Paul, MN, USA, 1997; pp. 17–20. [Google Scholar]
  2. Smith, D.H. Early and late leaf spots. In Compendium of Peanut Diseases; Porter, D.M., Smith, D.H., Rodriguez-Kabana, R., Eds.; APS Press: Saint Paul, MN, USA, 1984. [Google Scholar]
  3. McDonald, D.; Subrahmanyam, P.; Gibbons, R.W.; Smith, D.H. Early and Late Leaf Spot of Groundnut; Information Bulletin No. 21; International Crops Research Institute for the Semi-Tropics: Patancheru, India, 1985; p. 24. [Google Scholar]
  4. Waliyar, F. Evaluation of yield losses due to groundnut leaf diseases in West Africa. In Proceedings of the Summary Proceedings of the Second ICRISAT Regional Groundnut Meeting for West Africa, Niamey, Niger, 11–14 September 1990; ICRISAT: Patancheru, India, 1991; pp. 32–33. [Google Scholar]
  5. Waliyar, F.; Adamou, M.; Traoré, A. Rational Use of Fungicide Applications to Maximize Peanut Yield Under Foliar Disease Pressure in West Africa. Plant Dis. 2000, 84, 1203–1211. [Google Scholar] [CrossRef] [PubMed] [Green Version]
  6. Wynne, J.C.; Beute, M.K.; Nigam, S.N. Breeding for Disease Resistance in Peanut (Arachis Hypogaea L.). Annu. Rev. Phytopathol. 1991, 29, 279–303. [Google Scholar] [CrossRef]
  7. Coffelt, T.A.; Porter, D.M. Field Screening of Reciprocal Chico x Florigiant Peanut Populations for Resistance to Leafspot in Virginia1. Peanut Sci. 1986, 13, 57–60. [Google Scholar] [CrossRef]
  8. Naab, J.B.; Tsigbey, F.K.; Prasaad, P.V.V.; Boote, K.J.; Bailey, J.E.; Brandenburg, R.L. Effects of sowing date and fungicide application on yield of early and late maturing peanut cultivars under rainfed conditions in Ghana. Crop Prot. 2005, 24, 325–332. [Google Scholar] [CrossRef]
  9. Kokalis-Burelle, N.; Backman, P.A.; Rodríguez-Kábana, R.; Ploper, L.D. Potential for biological control of early leafspot of peanut using Bacillus cereus and chitin as foliar amendments. Biol. Control. 1992, 2, 321–328. [Google Scholar] [CrossRef]
  10. Kishore, G.K.; Pande, S.; Podile, A.R. Management of late leaf spot of Groundnut (Arachis hypogaea) with chlorothalonil-tolerant isolates of Pseudomonas aeruginosa. Plant Pathol. 2015, 54, 401–408. [Google Scholar] [CrossRef]
  11. Nana, T.A. Essai de Lutte Intégrée par Association de la lutte Génétique et de la Lutte Biologique pour le Contrôle de la Rouille et des Cercosporioses de L’arachide (Arachis hypogaea L.) au Burkina Faso. Bachelor’s Thesis, Université de Ouagadougou, Ouagadougou, Burkina Faso, 2015; 169p. [Google Scholar]
  12. Abudulai, M.; Naab, J.; Seini, S.S.; Dzomeku, I.; Boote, K.; Brandenburg, R.; Jordan, D. Peanut (Arachis hypogaea) response to weed and disease management in northern Ghana. Int. J. Pest Manag. 2017, 64, 204–209. [Google Scholar] [CrossRef]
  13. Sanon, E.; Dao, K.; Neya, F.B.; Zagré, B.; Burow, M.; Sankara, P. Essai de Lutte Intégrée Combinant Les Pratiques Culturales, la Résistance Variétale et Chlorothalonil Pour le Contrôle des Cercosporioses de l’arachide au Burkina Faso; Annale de l’Université Joseph KI-ZERBO Série C: Ouagadougou, Burkina Faso, 2019; Volume 15. [Google Scholar]
  14. Smartt, J.; Stalker, H.T. Speciation and cytogenetics in Arachis. In Peanut Science and Technology; Pattee, H.E., Young, C.T., Eds.; American Peanut Research and Education Society: Yoakum, TX, USA, 1982; pp. 21–49. [Google Scholar]
  15. Abdou, Y.A.-M.; Gregory, W.C.; Cooper, W.E. Sources and nature of resistance to Cercospora arachidicola Hori and Cercosporidium personatum (Berk & Curtis) Deighton in Arachis species. Peanut. Sci. 1974, 1, 6–11. [Google Scholar]
  16. Stalker, H.; Moss, J. Speciation, Cytogenetics, and Utilization of Arachis Species. Adv. Agron. 1987, 41, 1–40. [Google Scholar] [CrossRef] [Green Version]
  17. Simpson, C.E.; Nelson, S.C.; Starr, J.L.; Woodard, K.E.; Smith, O.D. Registration of TxAG-6 and TxAG-7 Peanut Germplasm Lines. Crop Sci. 1993, 33, 1418. [Google Scholar] [CrossRef]
  18. Smartt, J.; Gregory, W.C. Interspecific cross-compatibility between the cultivated peanut Arachis hypogaea L. and other members of the genus Arachis. Oléagineux 1967, 22, 455–459. [Google Scholar]
  19. Stalker, H.T.; Wynne, J.C.; Company, M. Variation in progenies of an Arachis hypogaea x diploid wild species hybrid. Euphytica 1979, 28, 675–684. [Google Scholar] [CrossRef]
  20. Garcia, G.M.; Stalker, H.T.; Shroeder, E.; Kochert, G. Identification of RAPD, SCAR, and RFLP markers tightly linked to nematode resistance genes introgressed from Arachis cardenasii into Arachis hypogaea. Genome 1996, 39, 836–845. [Google Scholar] [CrossRef]
  21. Smartt, J.; Gregory, W.C.; Gregory, M.P. The genomes of Arachis hypogaea 2. The implications in interspecific breeding. Euphytica 1978, 27, 677–680. [Google Scholar] [CrossRef]
  22. Norden, A.J.; Lipscomb, R.W.; Carver, W.A. Registration of Florunner Peanuts 1 (Reg. No. 2). Crop. Sci. 1969, 9, 850. [Google Scholar] [CrossRef]
  23. Simpson, C.E.; Starr, J.L. Registration of ‘COAN’ Peanut. Crop Sci. 2001, 41, 918. [Google Scholar] [CrossRef]
  24. Simpson, C.E.; Starr, J.L.; Church, G.T.; Burow, M.D.; Paterson, A.H. Registration of ‘NemaTAM’ Peanut. Crop Sci. 2003, 43, 1561. [Google Scholar] [CrossRef]
  25. Holbrook, C.C.; Timper, P.; Culbreath, A.K.; Kvien, C.K. Registration of ‘Tifguard’ peanut. J. Plant Regist. 2008, 2, 92–94. [Google Scholar] [CrossRef]
  26. Simpson, C.E.; Starr, J.L.; Baring, M.R.; Burow, M.D.; Cason, J.M.; Wilson, J.N. Registration of ‘Webb’ peanut. J. Plant Regist. 2013, 7, 265–268. [Google Scholar] [CrossRef]
  27. Holbrook, C.C., Jr.; Ozias-Akins, P.; Chu, Y.; Culbreath, A.K.; Kvien, C.K.; Brenneman, T.B. Registration of ‘TifNV-High O/L’ peanut. J. Plant Regist. 2017, 11, 228–230. [Google Scholar] [CrossRef]
  28. Branch, W.D.; Brenneman, T.B. Registration of ‘Georgia-14N’ Peanut. J. Plant Regist. 2015, 9, 159–161. [Google Scholar] [CrossRef]
  29. Burow, M.D.; Simpson, C.E.; Paterson, A.H.; Starr, J.L. Identification of peanut (Arachis hypogaea L.) RAPD markers diagnostic of root-knot nematode (Meloidogyne arenaria) (Neal) Chitwood) resistance. Mol. Breed. 1996, 2, 369–379. [Google Scholar] [CrossRef]
  30. Church, G.T.; Simpson, C.E.; Burow, M.D.; Paterson, A.H.; Starr, J.L. Use of RFLP markers for identification of individuals homozygous for resistance to Meloidogyne arenaria in peanut. Nematology 2000, 2, 575–580. [Google Scholar] [CrossRef]
  31. Chu, Y.; Holbrook, C.C.; Timper, P.; Ozias-Akins, P. Development of a PCR-Based Molecular Marker to Select for Nematode Resistance in Peanut. Crop. Sci. 2007, 47, 841–845. [Google Scholar] [CrossRef] [Green Version]
  32. Clevenger, J.; Chu, Y.; Guimaraes, L.A.; Maia, T.; Bertioli, D.; Leal-Bertioli, S.; Timper, P.; Holbrook, C.C.; Ozias-Akins, P. Gene expression profiling describes the genetic regulation of Meloidogyne arenaria resistance in Arachis hypogaea and reveals a candidate gene for resistance. Sci. Rep. 2017, 7, 1317. [Google Scholar] [CrossRef]
  33. Tanksley, S.D.; Nelson, J.C. Advanced backcross QTL analysis: A method for the simultaneous discovery and transfer of valuable QTLs from unadapted germplasm into elite breeding lines. Theor. Appl. Genet. 1996, 92, 191–203. [Google Scholar] [CrossRef] [PubMed]
  34. Burow, M.D.; Starr, J.L.; Park, C.-H.; Simpson, C.E.; Paterson, A.H. Introgression of homoeologous quantitative trait loci (QTLs) for resistance to the root-knot nematode [Meloidogyne arenaria (Neal) Chitwood] in an advanced backcross-QTL population of peanut (Arachis hypogaea L.). Mol. Breed. 2014, 34, 393–406. [Google Scholar] [CrossRef]
  35. Kornegay, J.L.; Beute, M.K.; Wynne, J.C. Inheritance of Resistance to Cercospora arachidicola and Cercosporidium personatum in Six Virginia-type Peanut Lines1,3. Peanut Sci. 1980, 7, 4–9. [Google Scholar] [CrossRef]
  36. Jogloy, S.; Wynne, J.C.; Beute, M.K. Inheritance of Late Leafspot Resistance and Agronomic Traits in Peanut1. Peanut Sci. 1987, 14, 86–90. [Google Scholar] [CrossRef]
  37. Anderson, W.F.; Holbrook, C.C.; Wynne, J.C. Heritability and Early-Generation Selection for Resistance to Early and Late Leafspot in Peanut. Crop. Sci. 1991, 31, 588–593. [Google Scholar] [CrossRef]
  38. Green, C.C.; Wynne, J.C. Field and greenhouse evaluations of the components of partial resistance to early leafspot in peanut. Euphytica 1986, 35, 561–573. [Google Scholar]
  39. Anderson, W.F.; Holbrook, C.C.; Brenneman, T.B. Resistance to Cercosporidium Personatum Within Peanut Germplasm1. Peanut Sci. 1993, 20, 53–57. [Google Scholar] [CrossRef] [Green Version]
  40. Waliyar, F.; McDonald, D.W.; Rao, P.V.S.; Reddy, P.M. Components of Resistance to an Indian Source of Cercospora Arachidicola in Selected Peanut Lines1. Peanut Sci. 1993, 20, 93–96. [Google Scholar] [CrossRef] [Green Version]
  41. Waliyar, F.B.; Shew, B.; Shidamed, R.; Beute, M.K. Effects of host resistance on germination of Cercospora arachidicola on peanut leaf surfaces. Peanut Sci. 1995, 22, 154–157. [Google Scholar] [CrossRef] [Green Version]
  42. Iroume, R.N.; Knauft, D.A. Heritabilities and correlations for early leafspot resistance in peanut (Arachis hypogaea L.): Implications for early generation selection. Peanut Sci. 1987, 14, 46–50. [Google Scholar] [CrossRef]
  43. Khedikar, Y.P.; Gowda, M.V.C.; Sarvamangala, C.; Patgar, K.V.; Upadhyaya, H.D.; Varshney, R.K. A QTL study on late leaf spot and rust revealed one major QTL for molecular breeding for rust resistance in groundnut (Arachis hypogaea L.). Theor. Appl. Genet. 2010, 121, 971–984. [Google Scholar] [CrossRef] [Green Version]
  44. Clevenger, J.; Chu, Y.; Chavarro, C.; Agarwal, G.; Bertioli, D.J.; Leal-Bertioli, S.C.; Pandey, M.K.; Vaughn, J.; Abernathy, B.; Barkley, N.A.; et al. Genome-wide SNP Genotyping Resolves Signatures of Selection and Tetrasomic Recombination in Peanut. Mol. Plant 2017, 10, 309–322. [Google Scholar] [CrossRef] [PubMed] [Green Version]
  45. Isleib, T.G.; Milla-Lewis, S.R.; Pattee, H.E.; Copeland, S.C.; Zuleta, M.C.; Shew, B.B.; Hollowell, J.E.; Sanders, T.H.; Dean, L.O.; Hendrix, K.W.; et al. Registration of ‘Bailey’ peanut. J. Plant Regist. 2011, 5, 27–39. [Google Scholar] [CrossRef]
  46. Padi, F.K.; Frimpong, A.; Kombiok, J.; Salifu, A.B.; Marfo, K.O. Registration of ‘Nkatiesari’ Peanut. Crop Sci. 2006, 46, 1397–1398. [Google Scholar] [CrossRef]
  47. Leal-Bertioli, S.C.M.; José, A.C.V.F.; Alves-Freitas, D.M.T.; Moretzson, M.C.; Guimarães, P.M.; Nielsen, S.; Vidigal, B.S.; Pereira, R.W.; Pike, J.; Fávero, A.P.; et al. Identification of candidate genome regions controlling disease resistance in Arachis. BMC Plant Biol. 2009, 9, 112. [Google Scholar] [CrossRef] [Green Version]
  48. Burow, M.D.; Simpson, C.E.; Starr, J.L.; Paterson, A.H. Transmission genetics of chromatin from a synthetic amphidiploid in cultivated peanut (Arachis hypogaea L.): Broadening the gene pool of a monophyletic polyploid species. Genetics 2001, 159, 823–837. [Google Scholar] [PubMed]
  49. Burow, M.D.; Starr, J.L.; Park, H.; Simpson, C.E.; Paterson, A.H. Identification of QTLs for resistance to early leafspot (Cercospora arachidicola S. Hori.) in an introgression population of peanut (Arachis hypogaea L.). In Proceedings of the Plant & Animal Genome XVI Conference, San Diego, CA, USA, 14 January 2008. [Google Scholar]
  50. Burow, M.D.; M’Bi Zagré, B.; Denwar, N.N.; Sankara, P.; Neya, F.; Sanon, E.; Baring, M.R.; Grichar, J.; Simpson, C.E. Evaluation of a peanut interspecific introgression population for resistance to leafspot and rust, and for yield and maturity. (in preparation)
  51. Branch, W.D.; Brenneman, T.B.; Noe, J.P. Evidence for a second RKN resistance gene in peanut. Peanut Sci. 2016, 43, 49–51. [Google Scholar] [CrossRef]
  52. Wynne, J.C.; Halward, T. Cytogenetics and genetics of Arachis. Crit. Rev. Plant Sci. 1989, 8, 189–220. [Google Scholar] [CrossRef]
  53. Nigam, D.J. A review of the present status of the genetic resources of the ICRISAT Regional Groundnut Improvement Program, of the Southern African Cooperative Regional Yield Trials, and of rosette virus resistance breeding. In Proceedings of the Second Regional Groundnut Workshop for Southern Africa. Harare, Zimbabwe, 10–14 February 1986, 2nd ed.; International Crops Research Institute for the Semi-Arid Tropics: Patancheru, Andhra Pradesh, India, 1986; pp. 15–30. [Google Scholar]
  54. Ouedraogo, M. Yield and Leafspot Responses of Interspecific Peanut Crosses in Early Generation Tests. Ph.D. Thesis, Soil and Crop Science, Department, Texas A.&M University, College Station, TX, USA, 1995; 186p. [Google Scholar]
  55. Pande, S.; Rao, J.N.; Dwivedi, S.L. Components of resistance to late leaf spot caused by Phaeoisariopsis personata in inter-specific derivatives of groundnut. Indian Phytopath. 2002, 55, 444–450. [Google Scholar]
  56. Tuggle, J.C. Selection of Agronomically Acceptable, Early Leaf Spot (Cercospora arachidicola Hori.) Resistant Peanut (Arachis hypogaea L.) Breeding Lines in Interspecific Derived Populations and Implications of Pathogen Variability on Stability of Breeding Programs. Ph.D. Thesis, Soil and Crop Science Department, Texas A&M University, College Station, TX, USA, 1998; 109p. [Google Scholar]
  57. Chiteka, Z.A.; Gorbet, D.W.; Knauft, D.A.; Shokes, F.M.; Kucharek, T.A. Components of resistance to late leafspot in peanut: I. Levels and variability: Implications for selection. Peanut Sci. 1988, 15, 25–30. [Google Scholar] [CrossRef]
  58. Chiteka, Z.A.; Gorbet, D.W.; Knauft, D.A.; Shokes, F.M.; Kucharek, T.A. Components of Resistance to Late Leafspot in Peanut. II. Correlations Among Components and Their Significance in Breeding for Resistance1. Peanut Sci. 1988, 15, 76–81. [Google Scholar] [CrossRef]
  59. Dwivedi, S.L.; Pande, S.; Rao, J.N.; Nigam, S.N. Components of resistance to late leafspot and rust among interspecific derivatives and their significance in foliar disease resistance breeding in groundnut (Arachis hypogaea L.). Euphytica 2002, 125, 81–88. [Google Scholar] [CrossRef]
  60. Xiao, J.; Li, J.; Grandillo, S.; Ahn, S.N.; Yuan, L.; Tanksley, S.D.; McCouch, S.R. Identification of trait-improving quantitative trait loci alleles from a wild rice relative. Oryza rufipogon. Genetics 1998, 150, 899–909. [Google Scholar]
  61. Wilson, J.N.; Chopra, R.; Baring, M.R.; Selvaraj, M.G.; Simpson, C.E.; Chagoya, J.; Burow, M.D. Advanced backcross quantitative trait loci (QTL) analysis of oil concentration and oil quality traits in peanut (Arachis hypogaea L.). Trop. Plant Biol. 2016, 10, 1–17. [Google Scholar] [CrossRef]
  62. Tengey, T.K.; Hillhouse, A.; Mendu, V.; Burow, M.D. Analysis of a BC3F6 interspecific peanut introgression population using genome-specific SNP markers. Proc. Am. Peanut Res. Edu. Soc. 2018, in press. [Google Scholar]
  63. Tengey, T.K. Genetic Mapping of Leafspot Resistant QTLs, and Introgression into West African Adapted and US-high Oleic peanuts. Ph.D. Thesis, Texas Tech University, Department of Plant and Soil Science, Lubbock, TX, USA, 2018. [Google Scholar]
  64. Kombiok, J.M.; Buah, S.S.J.; Dzomeku, I.K.; Abdulai, H. Sources of pod yield losses in groundnut in the Northern Savanna Zone of Ghana. W. Afr. J. Appl. Ecol. 2004, 20, 53–63. [Google Scholar]
  65. Clavel, D.; Sarr, B.; Marone, E.; Ortiz, R. Potential agronomic and physiological traits of Spanish groundnut varieties (Arachis hypogaea L.) as selection criteria under end-of-cycle drought conditions. Agronomie 2004, 24, 101–111. [Google Scholar] [CrossRef] [Green Version]
  66. Shaner, G.; Finney, R.E. The effect of nitrogen fertilization on the expression of slow-mildewing resistance in Knox wheat and barley. Plant Dis. 1977, 71, 927–930. [Google Scholar] [CrossRef] [Green Version]
  67. Steele, R.G.D.; Torrie, J.H. Principles and Procedures of Statistics: A Biometric Approach, 2nd ed.; McGraw-Hill: New York, NY, USA, 1989. [Google Scholar]
Figure 1. Days until appearance of early leaf spot symptoms, illustrating time to development of symptoms in 50% of plants at Nyankpala in 2006.
Plants 10 00873 g001
Figure 2. Disease ratings for early leaf spot using the Florida scale. Rating dates were after those used for the time course for development of symptoms, and were taken at 2-week intervals.
Plants 10 00873 g002
Table 1. Response of cultivars to early leaf spot at five environments. Values are AUDPC scores for Manga and Nyankpala in Ghana, and Florida scale score for Yoakum, TX in the U.S.
AccessionMean 12006 Manga2006 Nyankpala2007 Manga2007 Nyankpala2005 YoakumN MFG 2
Spanish287a 3225a360a400ns 4163a-dn.d. 5 0
Chinesen.d. 225a320bn.d. n.d. n.d. 0
55-437267b216a–c315bc370 167abn.d. 0
26-10-06-03260bc215a–c285c–e375 165a–c7.33a–e0
45-03-06-01258b–d225a280de375 152a–h7.16a–e0
31-04-10-03257b–d225a295b–d360 147b–h6.00c–f0
31-04-05-02256b–d205b–d295b–d370 155a–f7.00a–e0
63-04-02-03256b–d210a–d295b–d375 142c–h7.66a–d0
63-04-02-02256b–d210a–d275d–f380 157a–f6.66a–f0
50-04-03-03253b–d215a–c255e–g380 163a–d8.33ab0
45-04-02-01252c–e225a280de375 128h4.83fg2
44-10-04-02252c–e200cd275d–f360 173a7.50a–d1
70-03-07-01252c–e225a265d–f380 137e–h5.66d–g2
41-10-03-03250c–f200cd280de355 167a–b7.33a–e1
63-06-08-02250c–f220ab270d–f350 160a–e8.33ab0
Florunner250c–f215a–c265d–f355 164a–c7.67a–d0
46-06-04-01250c-f210a–d260ef375 153a–g8.17ab1
46-06-07-02249c–g220ab265d–f370 142c–h8.17ab1
41-10-01-03249c–h215a–c265d–f360 155a–f8.00a–c0
43-09-02-03248c–h225a270d–f350 145b–h5.83d–f1
63-04-05-02247c–h220ab270d–f350 149a–h7.33a–e1
43-09-03-01246c–h220ab260ef375 128h5.83d–f1
44-10-01-02245d–h215a–c275d–f350 141c–h5.67d–g1
19-05-06-03245d–h204b–d255e–g375 146b–h8.00a–c3
43-08-06-02245d–h210a–d265d–f365 139d–h8.50a1
41-05-05-03244d–h195d255e–g375 150a–h4.91fg4
43-09-03-02239e–i210a–d255e–g360 130gh5.33e–g4
60-02-02-03236f–i205b–d255e–g335 150a–h4.67fg4
43-08-07-02235g–i220ab245fg335 139d–h3.67g3
50-04-01-03235hi220ab225g360 134f–h8.67a2
50-02-04-01228i210a–d225g330 147b–h6.33b–f3
p0.0044 0.0070 0.0001 0.2056 0.0207 0.0001
Mean250 215 273 364 150 6.82
LSD15 17 32 24 2.02
CV7.6% 4.7% 7.2% 6.5% 9.2% 15.1%
1 Mean refers to a combined analysis for the four Ghana locations, but does not include the Texas location. 2 N MFG, number of environments in which the accession occurred in the most favorable [resistant] statistical group. 3 Values sharing the same letter are not statistically different at the p = 0.05 level of probability. 4 ns, not statistically significant. 5 n.d., no data.
Table 2. Response of cultivars to late leaf spot. Values are AUDPC scores.
AccessionMean2006
Manga
2006
Nyankpala
2007
Manga
2007
Nyankpala
N MFG 1
Spanish238ns 2195a 3380a260ns118a–d0
Chinesen.d. 4 195a340bn.d. n.d. 0
55-437227 185a–c345b250 129ab0
45-04-02-01213 195a290c–e275 92hi0
26-10-06-03210 185a–c280c–g255 121a–d0
31-04-10-03210 190ab280c–g255 114a–f0
43-09-02-03209 195a290c–e240 110b–h0
45-03-06-01207 185a–c275c–h260 109b–i2
41-10-01-03207 175b–e290c–e250 113a–g1
70-03-07-01207 185a–c260e–h270 113a–g1
63-06-08-02206 185a–c285c–f235 120a–d1
31-04-05-02206 170c–e305c235 115a–f0
41-10-03-03205 165de270d–h255 131a2
44-10-01-02204 180a–d295cd235 107c–i1
63-04-02-02204 170c–e270d–h260 114a–f2
63-04-02-03203 175b–e290c–e240 109c–i2
46-06-07-02203 185a–c260e–h255 114a–f1
63-04-05-02202 180a–d280c–g240 107c–i1
46-06-04-01202 165de265d–h255 122a–d2
44-10-04-02201 165de280c–g235 125a–c1
43-08-06-02201 180a–d275c–h245 103d–i2
50-02-04-01200 180a–d260e–h255 104d–i2
50-04-03-03199 175b–e250gh260 112a–h2
41-05-05-03198 160e265d–h250 119a–d2
19-05-06-03197 167de265d–h250 107c–i3
43-09-03-01196 185a–c255f–h250 96f–i2
50-04-01-03195 190ab245h250 93g–i2
Florunner193 170c–e260e–h225 118a–d2
43-08-07-02193 175b–e255f–h245 97e–i3
43-09-03-02191 175b–e260e–h240 89i3
60-02-02-03190 170c–e250gh230 110b–h2
p0.1024 0.0003 0.0001 0.7600 0.0106
Mean204 179 280 249 111
LSD 17 33 21
CV12.1% 5.7% 7.2% 9.1% 10.4%
1 N MFG, number of environments in which the accession occurred in the most favorable statistical group. 2 ns, not statistically significant. 3 Values sharing the same letter are not statistically different at the p = 0.05 level of probability. 4 n.d., no data.
Table 3. Number of days for initial appearance of symptoms of early leaf spot on 50% of plants.
AccessionMeanNyankapala
2006
Manga
2007
Nyankpala
2007
N MFG 1
55-43736.30a 234.42a47.17ab27.33a-c3
Spanish36.07ab31.09bc47.37ab29.76a2
Chinesen.d.3 30.29b–gn.d. n.d. 1
50-04-01-0334.79a–d30.43b–g44.10bc29.85a1
45-04-02-0134.06a–e30.11b–h43.10cd28.96a1
50-04-03-0333.87b–f30.91b–e42.63c–e28.07a–c1
43-09-03-0233.71c–f27.64l44.03bc29.46a1
43-08-06-0233.68c–g29.30d–l43.13cd28.62a1
43-08-07-0233.60c–g31.17b41.37c–f28.27a–c1
26-10-06-0333.50c–g29.08f–l44.10bc27.31a–d1
41-05-05-0333.42d–g30.02b–i40.83c–f29.40a1
45-03-06-0133.24d–g29.69b–j41.90c–e28.13a–c1
63-06-08-0233.20d–g28.71g–l43.70bc27.20a–e1
46-06-04-0133.18d–g31.04b–d39.83d–g28.65a1
Florunner33.15d–g29.33c–l42.07c–e28.07a–c1
31-04-05-0232.98d–g29.36c–l40.90c–f28.69a1
63-04-05-0232.98d–g30.11b–h40.43c–f28.40ab1
31-04-10-0332.94d–g29.27d–l41.60c–f27.94a–c1
60-02-02-0332.92d–g29.44b–k40.77c–f28.57ab1
46-06-07-0232.92d–g29.38c–l40.93c–f28.44ab1
44-10-04-0232.92d–g30.01b–i41.37c–f27.38a–c1
63-04-02-0332.91d–g29.80b–i40.67c–f28.25a–c1
50-02-04-0132.79d–g28.30i–l42.10c–e27.97a–c1
41-10-03-0332.78d–g28.38h–l41.83c–e28.13a–c1
43-09-02-0332.72d–g28.45h–l41.60c–f28.10a–c1
43-09-03-0132.39e–g27.69kl41.13c–f28.35ab1
63-04-02-0232.31e–g30.80b–f41.63c–f24.50ef0
41-10-01-0331.63f–h27.96j–l41.37c–f25.57c–f0
44-10-01-0231.33gh29.20e–l38.93e–g25.85b–f0
70-03-07-0129.78h27.87kl37.93fg23.53f0
19-05-06-0329.65h27.81kl36.60g24.55d–f0
p0.0003 0.0001 0.0001 0.0008
Mean33.15 29.58 42.06 27.79
LSD2.36 1.79 3.76 2.76
CV7.5% 3.7% 5.5% 5.8%
1 N MFG, number of environments in which the accession occurred in the most favorable statistical group. 2 Values sharing the same letter are not statistically different at the p = 0.05 level of probability. 3 n.d., no data.
Table 4. Number of days for initial appearance of late leaf spot symptoms on 50% of plants.
AccessionMeanManga 2006Nyankpala 2006N MFG 1
63-04-05-0252.12a 251.33a52.91a2
63-04-02-0251.67ab50.78ab52.55ab2
43-08-07-0250.77bc49.71a–c51.83ab2
70-03-07-0150.71bc49.38a–d52.03ab2
41-10-03-0350.25c49.09a–e51.42a–c2
50-04-03-0350.35c49.06a–e51.63a–c2
46-06-04-0150.23c49.06a–e51.40a–d2
44-10-01-0248.69d48.68a–f48.70c–g1
63-04-02-0348.23d48.13a–g48.33d–h1
44-10-04-0248.58d47.68a–h49.48b–f1
41-05-05-0346.75fg46.88b–h46.61e–j0
46-06-07-0248.09de46.50b–h49.69b–e0
31-04-05-0246.77fg46.43b–h47.11e–i0
31-04-10-0346.61fg46.35c–i46.86e–j0
43-09-03-0146.90ef45.82c–i47.99e–i0
43-09-02-0346.14f–i45.57c–i46.71e–j0
Florunner45.89f–j45.07d–i46.71e–j0
41-10-01-0346.41f–h45.05d–i47.77e–i0
26-10-06-0346.21f–i45.02d–i47.40e–i0
45-03-06-0145.65f–k44.96e–i46.33g–j0
50-04-01-0345.58g–k44.82e–j46.33g–j0
60-02-02-0345.12i–k44.66f–j45.58h–j0
45-04-02-0145.32h–k44.64f–j46.00g–j0
63-06-08-0245.54g–k44.63f–j46.44f–j0
43-08-06-0245.87f–j44.63f–j47.11e–i0
55-43744.85jk44.36f–j45.33h–j0
19-05-06-0345.03i–k44.07g–j45.99g–j0
50-02-04-0144.50k43.78g–j45.21ij0
43-09-03-0244.66jk43.65h–j45.67g–j0
Chinese42.99l41.99ij44.00j0
Spanish42.23l40.45j44.00j0
p0.0001 0.0029 0.0001
Mean46.07 46.20 47.91
LSD1.27 4.39 3.08
CV2.1% 4.7% 3.9%
1 N MFG, number of environments in which the accession occurred in the most favorable statistical group. 2 Values sharing the same letter are not statistically different at the p = 0.05 level of probability.
Table 5. Pod yield (kg ha−1).
AccessionMeanManga
2006
Nyankpala
2006
Manga
2007
Nyankpala
2007
N MFG 1
43-09-03-012027a 22400a336a–c3407a1966a–c4
44-10-01-021787ab2067ab342a–c2487a–c2251ab4
63-06-08-021546a–c933c–g314a–c2687ab2249ab3
43-09-02-031529a–d1733a–c294b–e2293a–d1793b–d2
43-08-06-021518b–d867d–g398ab2013b–i2795a2
43-09-03-021476b–d1170c–f270c–h2347a–d2103a–c2
46-06-07-021394b–e1600a–d261c–i2260a–e1453b–f2
19-05-06-031358b–f1533b–e286b–f2233a–f1627b–e1
41-10-01-031276c–g933c–g342a–c2033b–h1795b–d1
26-10-06-031262c–g833d–g227c–i1833b–i2153a–c1
45-04-02-011245c–g933c–g284b–g2173a–g1590b–e1
50-02-04-011224c–h1067c–g305a–d1553b–i1969a–c2
63-04-05-021219c–h933c–g171e–j1700b–i2073a–c1
44-10-04-021196c–i933c–g271c–h2280a–e1301c–f0
Florunner1134c–i500fg228c–i2147b–g1661b-e0
41-10-03-031125c–i667fg259c–i1740b–i1835b–d0
43-08-07-021097c–i1267b–f285b–f1420c–i1417b–f0
Spanish1026d–j1000c–g142ij1540b–i1421b–f0
31-04-05-02954e–k933c–g252c–i1373c–i1257c–f0
45-03-06-01939e–k867d–g138ij1760b–i991d–f0
50-04-03-03913e–k733e–g217c–i1753b–i949d–f0
41-05-05-03878f–k833d–g312a–c1113d–i1255c–f1
60-02-02-03841g–k733e–g160f–j1000f–i1470b–f0
50-04-01-03831g–k1333b–f168f–j1200d–i622f0
70-03-07-01779g–k733e–g181d–j1213d–i989d–f0
46-06-04-01721h–k667fg240c–i967g–i1009d–f0
63-04-02-03712i–k567fg155h–j1047e–i861ef0
31-04-10-03565jk667fg229c–i793i570f0
63-04-02-02501k267g158g–j887hi625f0
Chinesen.d. 733e–g425an.d. n.d. 0
55-437n.d. n.d. 55j1600b–i799ef0
p<0.0001 0.0003 <0.0001 0.0161 0.0002
Mean1140 1006 249 1762 1495
LSD506 895 127 1239 916
CV54.0% 48.1% 31.2% 43.0% 35.4%
1 N MFG, number of environments in which accession occurred in most favorable statistical group. 2 Values sharing the same letter are not statistically different at the p = 0.05 level of probability. 3 n.d., no data.
Table 6. Pearson correlations among traits, by site.
2006 MangaAUDPCELSAUDPCLLST50ELST50LLSPODYIELD
AUDPCELS1.0000
AUDPCLLS0.8423*** 21.0000
T50ELSn.d. n.d. n.d.
T50LLS−0.1654 −0.3492**n.d. 1.0000
PODYIELD0.2675*0.2768**n.d. 0.0913 1.0000
2006 NyankpalaAUDPCELSAUDPCLLST50ELST50LLSPODYIELD
AUDPCELS1.0000
AUDPCLLS0.7735***1.0000
T50ELS0.2565*0.2740**1.0000
T50LLS−0.1009 −0.3126**0.1037 1.0000
PODYIELD−0.1271 −0.0050 −0.2816**−0.0379 1.0000
2007 MangaAUDPCELSAUDPCLLST50ELST50LLSPODYIELD
AUDPCELS1.0000
AUDPCLLS0.6608***1.0000
T50ELS−0.0160 0.0409 1.0000
T50LLSn.d. n.d. n.d. n.d.
PODYIELD−0.0613 −0.1501 0.1178 n.d. 1.0000
2007 NyankpalaAUDPCELSAUDPCLLST50ELST50LLSPODYIELD
AUDPCELS1.0000
AUDPCLLS0.8104***1.0000
T50ELS0.0483 −0.0492 1.0000
T50LLSn.d. n.d. n.d. n.d.
PODYIELD−0.0634 −0.1161 0.0551 n.d. 1.0000
1 AUDPCELS, AUDPC for early leaf spot; AUDPCLLS, AUDPC for late leaf spot; T50ELS, days to early leaf spot lesions on 50% of plants; T50LLS, days to appearance of late leaf spot; PODYIELD, pod yield per plot in kg ha−1. 2 *, significant at the p = 0.05 level of probability; **, significant at p = 0.01; *** significant at p = 0.001. 3 n.d., no data.
Publisher’s Note: MDPI stays neutral with regard to jurisdictional claims in published maps and institutional affiliations.

