Article

Genetic and Molecular Characterization of a Self-Compatible Brassica rapa Line Possessing a New Class II S Haplotype

1
National Sub-Center of Rapeseed Improvement in Wuhan, National Key Laboratory of Crop Genetic Improvement, College of Plant Science and Technology, Huazhong Agricultural University, Wuhan 430070, China
2
Wuhan Vegetable Research Institute, Wuhan Academy of Agricultural Sciences, Wuhan 430345, China
3
Hunan Vegetable Research Institute, Hunan Academy of Agricultural Science, Changsha 410125, China
*
Authors to whom correspondence should be addressed.
Plants 2021, 10(12), 2815; https://doi.org/10.3390/plants10122815
Submission received: 4 November 2021 / Revised: 1 December 2021 / Accepted: 3 December 2021 / Published: 20 December 2021

Abstract

:
Most flowering plants have evolved a self-incompatibility (SI) system to maintain genetic diversity by preventing self-pollination. The Brassica species possesses sporophytic self-incompatibility (SSI), which is controlled by the pollen- and stigma-determinant factors SP11/SCR and SRK. However, the mysterious molecular mechanism of SI remains largely unknown. Here, a new class II S haplotype, named BrS-325, was identified in a pak choi line ‘325’, which was responsible for the completely self-compatible phenotype. To obtain the entire S locus sequences, a complete pak choi genome was gained through Nanopore sequencing and de novo assembly, which provided a good reference genome for breeding and molecular research in B. rapa. S locus comparative analysis showed that the closest relatives to BrS-325 was BrS-60, and high sequence polymorphism existed in the S locus. Meanwhile, two duplicated SRKs (BrSRK-325a and BrSRK-325b) were distributed in the BrS-325 locus with opposite transcription directions. BrSRK-325b and BrSCR-325 were expressed normally at the transcriptional level. The multiple sequence alignment of SCRs and SRKs in class II S haplotypes showed that a number of amino acid variations were present in the contact regions (CR II and CR III) of BrSCR-325 and the hypervariable regions (HV I and HV II) of BrSRK-325s, which may influence the binding and interaction between the ligand and the receptor. Thus, these results suggested that amino acid variations in contact sites may lead to the SI destruction of a new class II S haplotype BrS-325 in B. rapa. The complete SC phenotype of ‘325’ showed the potential for practical breeding application value in B. rapa.

1. Introduction

In flowering plants, self-incompatibility (SI) evolved to maintain genetic diversity and prevent self-pollination, in which pistils inhibit pollen germination or pollen tube growth after self-pollination [1]. In Brassica species, the SI system is characterized by sporophytic self-incompatibility (SSI), in which the diploid parental genotype determines the pollen grain self-incompatible phenotype, and is controlled by a single Mendelian locus (named S locus) [2]. The S locus contains multiple physically linked genes and segregates with the SI phenotype [3]. The S locus genes have been identified, including S locus Glycoprotein (SLG), S locus receptor kinase (SRK), and S locus cysteine-rich protein (SCR)/S-locus protein 11 (SP11). SLG was the first identified S locus gene, encoding a protein secreted in stigmatic papilla cells [4] and may play a role as an enhancer of SI in Brassica [5,6,7]. SRK was the second identified gene, and encodes a transmembrane serine/threonine receptor kinase located at the stigmatic papilla cell plasma membrane, which had been testified as being the female determinant factor [8,9,10,11]. SP11/SCR was the third identified gene in the S locus, and encodes a peptide protein located in anther tapetum cells and/or pollen grains, which had been testified as being the male determinant factor [12,13,14]. When pollen comes into contact with the pistil with the same S haplotype, SRK is activated and a signaling cascade is elicited within the stigmatic papilla cell to reject self-pollen [15,16].
Based on the nucleotide sequence similarity, S haplotypes were classified into two groups, class I and class II [17]. Class I S haplotypes are dominant over class II in pollen and the dominance relationship of S haplotypes is involved in SCR/SP11 expression suppression, which is controlled by the SCR methylation inducer (Smi) [18,19,20,21,22]. However, a codominant relationship of S haplotypes is observed in pistils [23,24]. More than 100 S haplotypes have been identified in B. rapa [25], and about 50 S haplotypes have been reported in B. oleracea [26], while several S haplotypes have been identified in B. napus, including BnS-1 to BnS-7 and BnS-1300 [27,28]. However, an interesting phenomenon has been observed, in that there are just four class II S haplotypes in B. rapa, including BrS-40, BrS-60, BrS-29, and BrS-44 and three class II S haplotypes in B. oleracea, including BoS-2b, BoS-5, and BoS-15 [29]. A linear dominance hierarchy among class II S haplotypes has been observed through reciprocal test pollinations in B. rapa (BrS-44 > BrS-60 > BrS-40 > BrS-29) [19,23], and these are controlled by SCR methylation inducer 2 (Smi2) [21]. Some partial genomic regions containing SCR and SRK genes in the recessive class II S haplotypes have been characterized in B. rapa [30,31]. However, the report regarding the comparatively complete S locus organization of the class II S haplotypes was limited to the BrS-60 haplotype [32,33], which extremely limited the understanding of the S locus.
In the last few decades, researchers have concentrated on identifying the SI reaction factors; however, the self-incompatible mechanism and self-compatible pathway remain unexplained. Mutant screening and research are very valuable to identify new factors involved in the SI system [34,35,36,37,38]. Self-compatible mutants are mainly attributed to the disruption of S locus genes, including SCR genes [27,39,40] and SRK genes [38,41,42]. On the other hand, non-S locus gene disruption also changes the SI phenotypes, such as M-locus protein kinase (MLPK) [36,43,44] and ARC1 (Armadillo repeat-containing protein 1(ARC1) [45,46,47,48], which are the self-incompatible factors. With the development of molecular technology and sequencing strategy, transcriptomicse and proteomics have promoted SI signal pathway research [49,50,51]. Some genes, such as exocyst complex subunit A1(EXO70A1), Phospholipase D α1(PLDα1), and Glyoxalase1(GLO1), were identified as self-compatible factors working downstream of ARC1 [47,52,53,54,55]. The GATA transcription factor BnA5.ZML1 participated in SI responses by suppressing the expression of SI responsive genes [56]. Thus, the SI system is a complex and mysterious biological phenomenon and much more work is needed to discover its molecular mechanism.
The screening and establishment of new self-compatible (SC) lines are critical for SI system research in Brassica. Some SC lines have been identified from SI populations [25,35,38,57]. Mutant identification and map-based cloning is a classical genetic method to identify new genes for phenotype mutation [58,59,60,61]. Recently, genome sequencing and transcriptome sequencing accelerated the cloning of genes greatly [62,63,64,65]. Several high-quality assembled genomes have been produced in Brassica rapa subspecies, including heading Chinese cabbage, yellow sarson, and no-heading pak choi [32,33,66], and these high-quality assembled genomes could accelerate the progress in Brassica genomic variation research. In this study, a completely self-compatible line with a single S locus mutation was identified, which had a new class II S haplotype, named BrS-325. Complete genome assembly was gained by means of Nanopore sequencing strategy and the S-intergenic region was determined. The S locus genes were identified, and BrSCR-325 and BrSRK-325b had normal expression levels. Previous reports investigated leaf development, flowering, and LTR-RT expansion based on the assembled genomes in B. rapa [32,33,66]; meanwhile, we concentrated on performing comparative analysis of the S locus of two class II S haplotypes, BrS-60 and BrS-325, which are each other’s closest relatives. The S locus of BrS-60 and BrS-325 showed high sequence polymorphism with few genes’ distribution. Meanwhile, multiple sequence alignment of class II SCRs and SRKs was carried out to reveal amino acid variations in the contact regions (CR II and CR III) of BrSCR-325 and the hypervariable regions (HV I and HV II) of BrSRK-325s, which may influence the interaction between the ligand and the receptor. Here, a complete pak choi genome was obtained and many amino acid variations were identified in the contact regions of BrSCR-325 and the hypervariable regions of BrSRK-325s, which may lead to self-incompatibility destruction.

2. Results

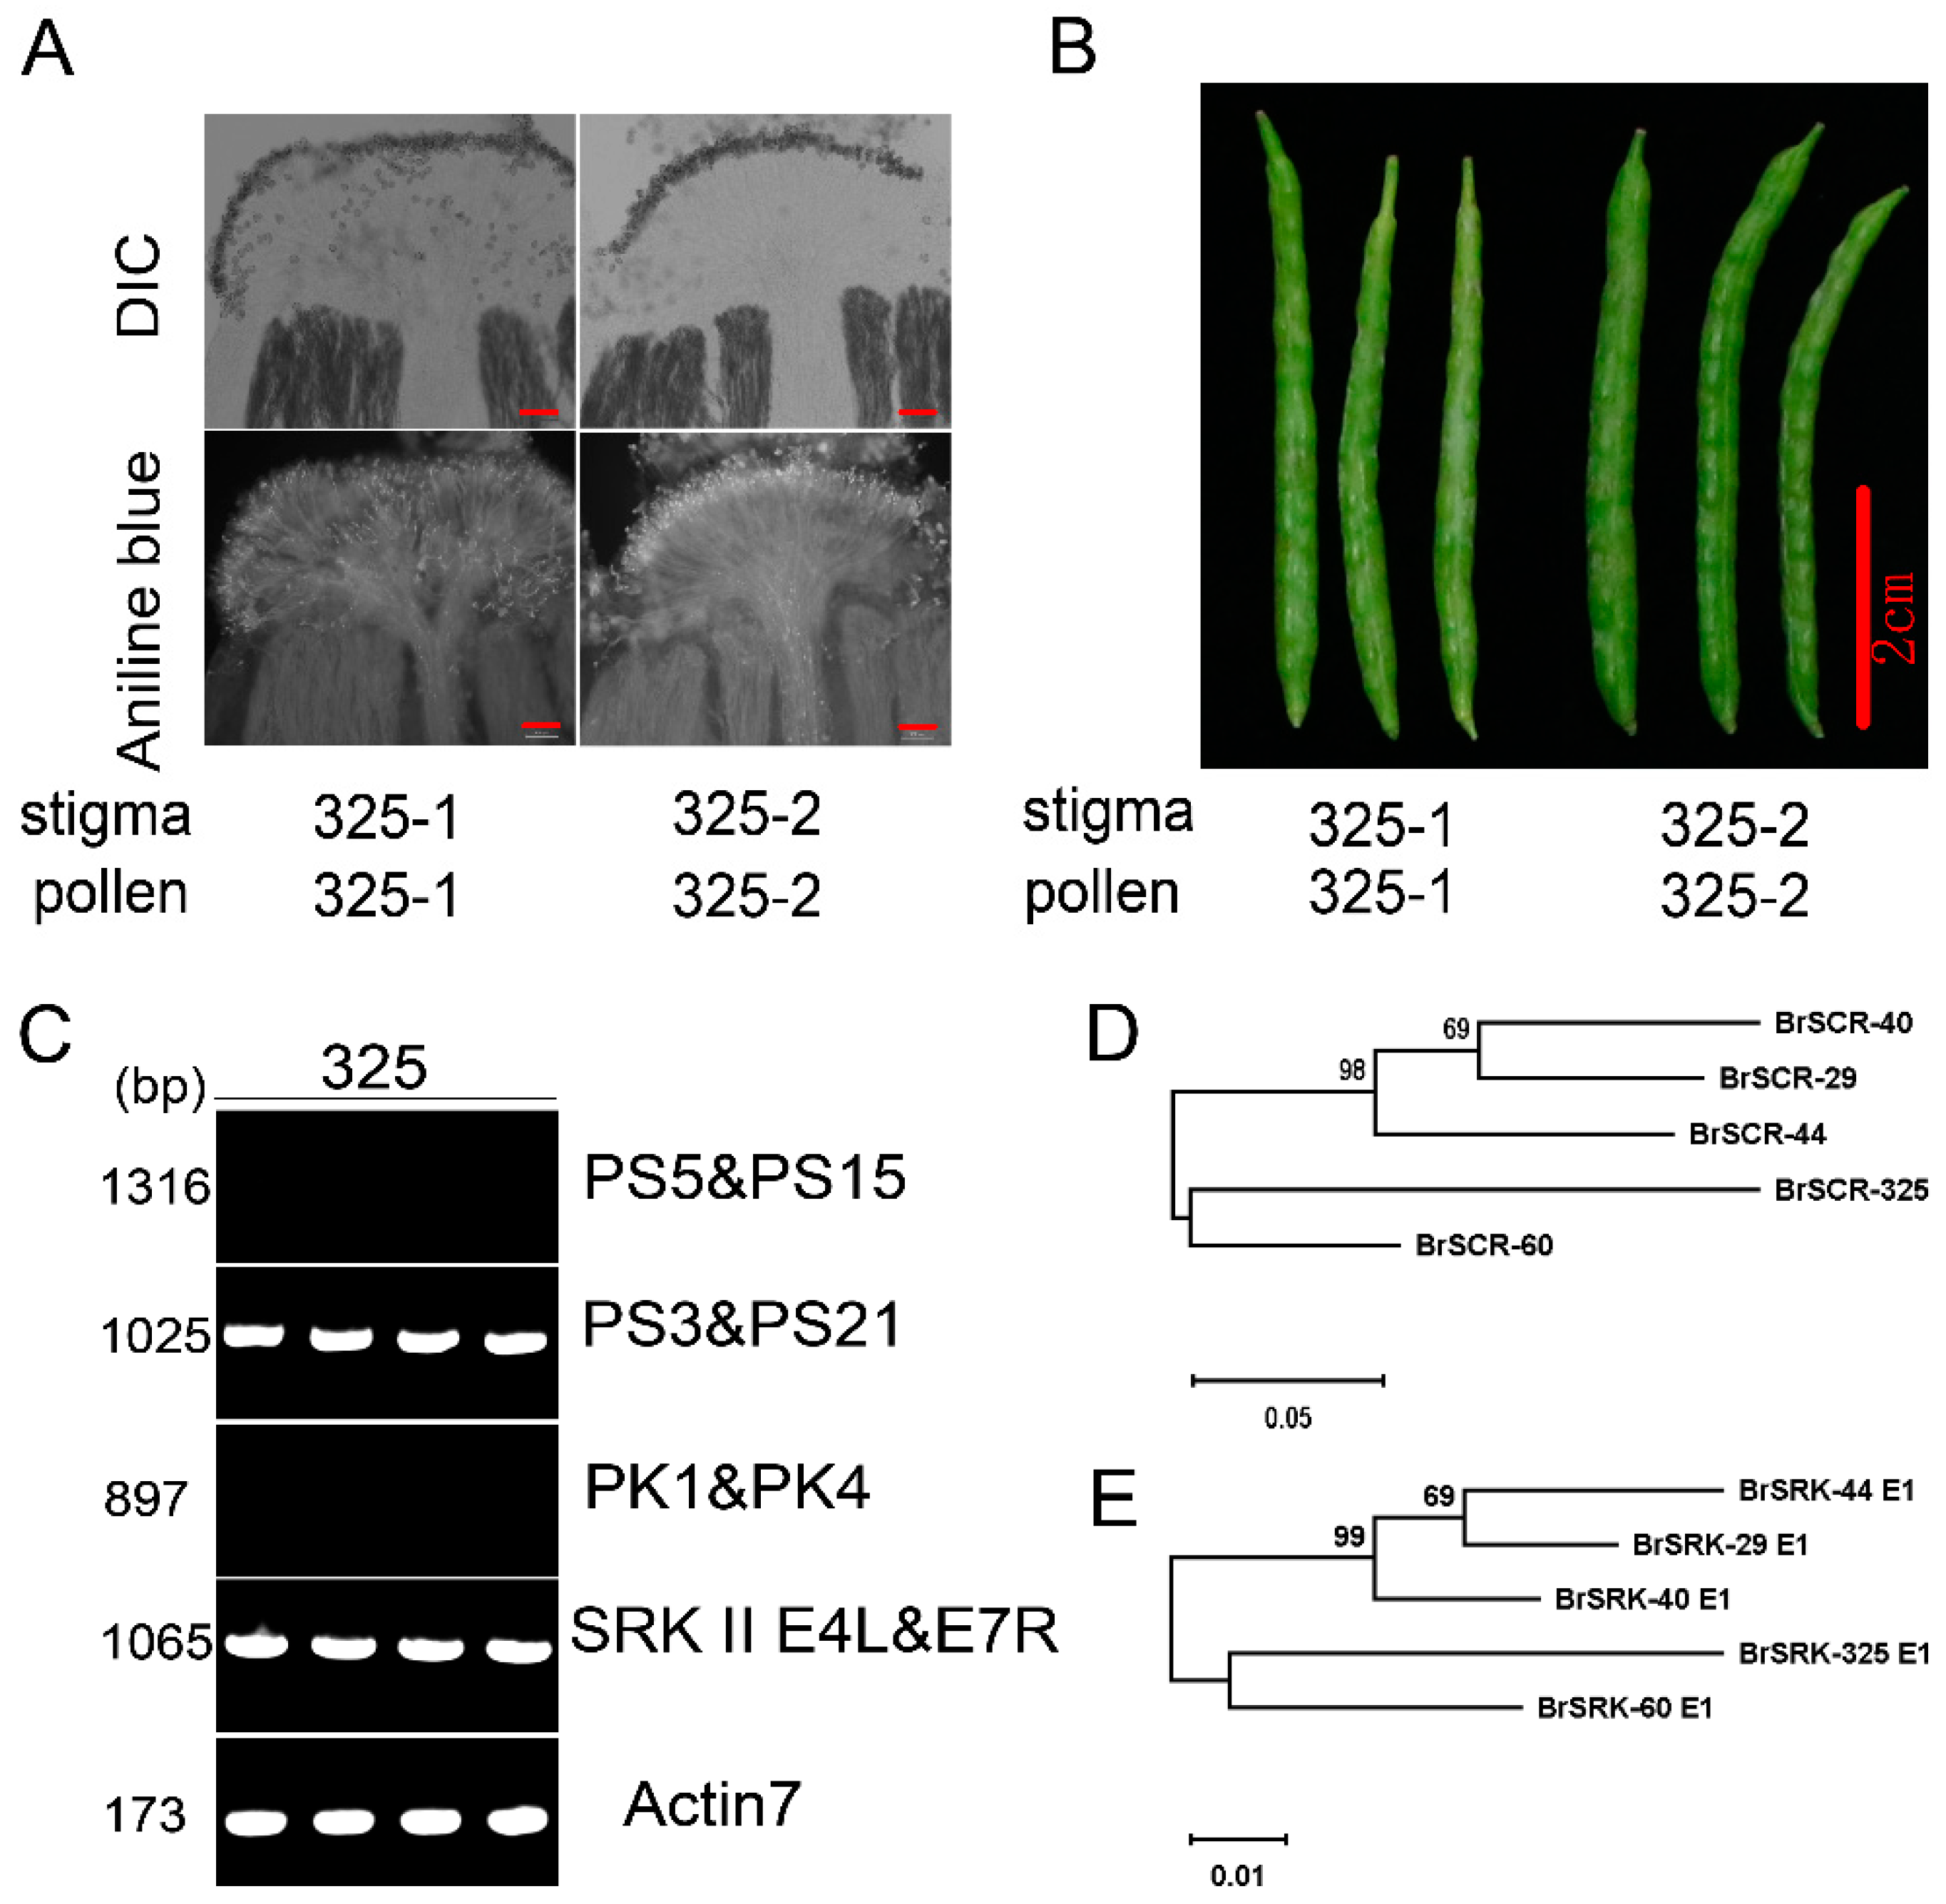
2.1. Determination of a New Class II S Haplotype in an SC B. rapa

In our breeding process, we found that the inbred line ‘325’ was completely self-compatible, the self-pollination of which involved normal pollen germination and produced normal siliques, harboring full seeds (Figure 1A,B). To explore the mechanism of self-compatibility in ‘325’, we determined the S haplotype by cloning and analyzing S locus genes. The line ‘325’ could be amplified by universal primer pairs of class II, but not class I, indicating that a class II S haplotype existed (Figure 1C). Then, based on the sequences of class II SRK and SCR genes, partial sequences of SCR and SRK E1 (the first exon of SRK) were obtained by the means of PCR and sequenced (Figures S1 and S2). Nucleotide sequence comparative analysis revealed that both the SCR and SRK E1 sequences in ‘325’ were different from the reported class II S locus genes and showed the highest sequence similarity with that of BrS-60 (79% sequence similarity of SCR and 91% sequence similarity of SRK E1) (Figures S1 and S2). Phylogenetic analysis results also showed that both the SCR and SRK E1 genes in ‘325’ were the closest relatives to those of BrS-60 (Figure 1D,E). Thus, a new class II S haplotype, named BrS-325, was determined.

2.2. Genetic Analysis of SC Trait in ‘325’

To reveal the genetic basis of the SC trait in ‘325’, reciprocal cross F1 hybrids were created from the SI parent ‘326’ (BrS-12) and SC parent ‘325’ (BrS-325), and pollination behavior displayed self-incompatibility (Table 1). The aniline blue staining results showed that a large amount of pollen grains germinated and passed through the stigma in the SC mutant. However, few pollen grains germinated and passed through the stigma in the SI parent ‘326’and F1 hybrids (Figure 2A). Siliques in SC ‘325’ were dramatically longer than that of the SI parents and F1 hybrids (1.29 and 1.48 cm per silique) (Figure 2B,C). Average seed-set of SI parents and F1 hybrids were 1.14 and 1.76 seeds per silique, respectively, which was dramatically less than the SC mutant (18.47 seeds per silique) (Figure 2B,D). Based on the reciprocal cross F1 hybrid phenotypes, this meant that ‘325’ had a recessive nucleus mutation. In the F2 population, originating from the self-pollination of the F1 hybrid, pollination phenotypes were segregated into SI:SC = 70:22 (3:1, χ2 = 0.094, p < 0.05), indicating that the SC trait in ‘325’ was controlled by a single genetic locus. S haplotypes in the F2 population were segregated into S-12S-12: S-12S-325: S-325S-325 =20:50:22 (1:2:1, χ2 = 0.73, p < 0.05), and all the pollination phenotypes were consistent with the genotypes (Figure 2E and Table 1). All the results show that BrS-325 was responsible for the SC in ‘325’.

2.3. Nanopore Sequencing and De Novo Assembly the Genome of SC Line ‘325’

To obtain complete genomic information for BrS-325 and discover the underlying mechanism of SC in ‘325’, we carried out Nanopore sequencing and next de novo assembly to obtain the pak choi genome [67]. Here, we produced a 376.70 Mb genome assembly, containing 314 contigs with an N50 size of 4.54 Mb, which was longer than previous B. rapa genome assemblies (Table 2, Tables S1 and S2) [66]. To determine the accuracy and completeness of the genome assembly, the second-generation reads and third-generation reads were mapped against the assembled genome. The results showed that the mapping rate reached 99.39% and 99.99%, and the coverage reached 97.79% and 99.98% (Table S3). Next, Benchmarking Universal Single-Copy Orthologs (BUSCOs) were assessed. The results showed that 97.50% were complete BUSCOs, and only 1.74% were missing BUSCOs. Respectively, 84.65% and 12.85% of the complete BUSCOs accounted for the single- and multi-copy genes (Table S4). These results suggest that we acquired a complete pak choi genome assembly (Figure 3).
We then performed gene prediction in our assembled genome. Approximately 52.65% of the genome sequences were annotated as repetitive sequences, including DNA-TE (15.60%), retrotransposons (42.41%), and unclassified elements (3.41%). The annotated retrotransposons mainly consisted of the long terminal repeat retrotransposon (LTR-TE), which covered 120 Mb and occupied 31.96% of the assembled genome (Table S5). In total, 43,855 genes of the coding protein were identified, which had an average size of 2650 bp and consisted of an average of five exons (Table S6). About 42,500 genes could be annotated by utilizing the foreign protein database, which could annotate 96.91% of the predicted genes (Table S7). Meanwhile, a total of 1431 tRNA, 1623 rRNA, 241 microRNA (miRNA), and 1397 small nuclear RNA (snRNA) genes were identified (Table S8). To evaluate the accuracy and completeness of the gene annotation, we carried out BUSCO assessment. The results showed that approximately 97.4% of the embryophyte genes could be detected in our pak choi genome (Table S9). These results indicate that we gained a complete and functionally annotated pak choi assembled genome.

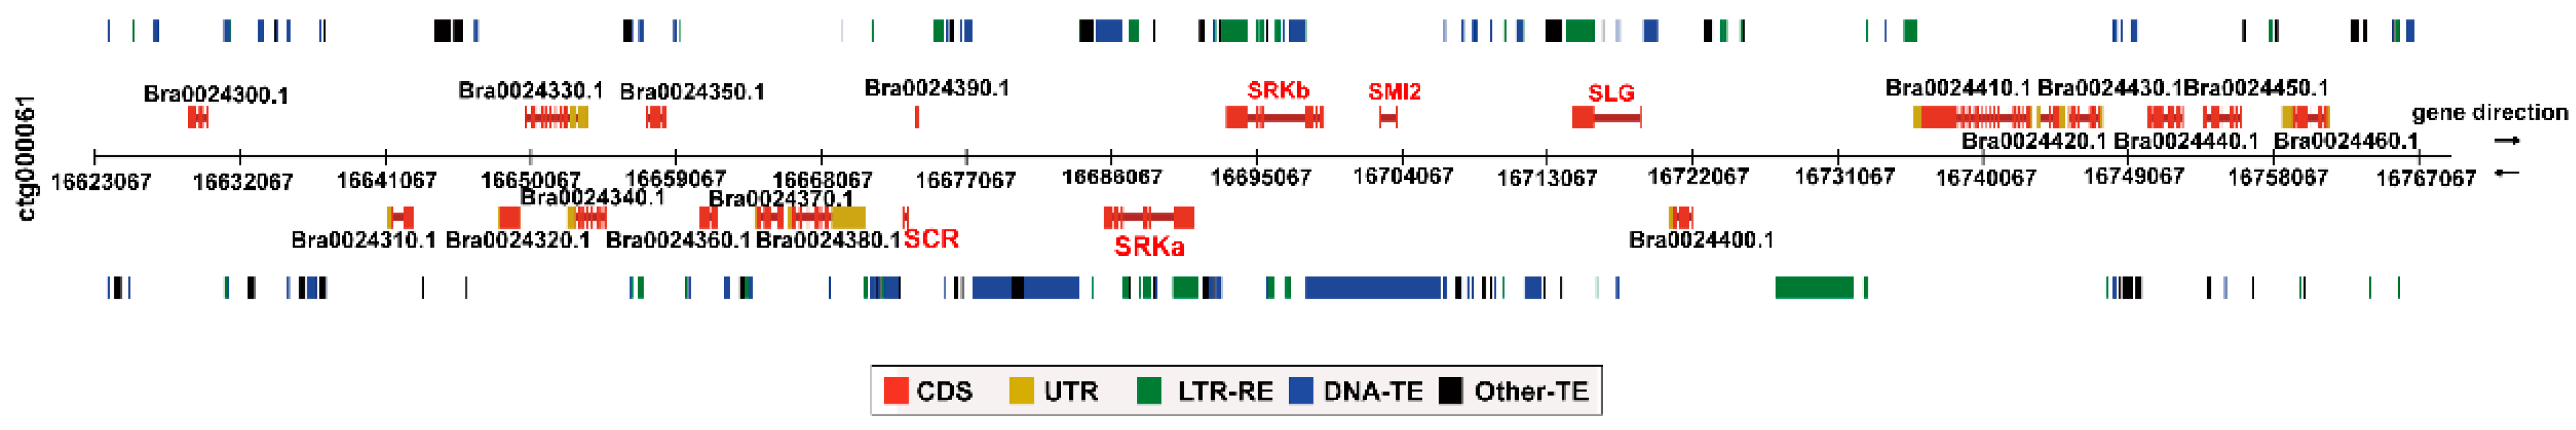
2.4. S Locus Organization of BrS-325

Based on the cloned sequences of SCR and SRK from ‘325’, homologous genes were blasted in our assembled genome. Finally, we obtained a 145 kb sequence from contig, named ctg00061, which covered the whole BrS-325 locus and boundary regions (Figure 4). In ctg000061, the SCR homologous gene BrSCR-325 was found to be located 16,673,067 to 16,673,465 bp of the assembled genome, consisting of two exons and one intron. Meanwhile, we blasted the SLG homologous sequence of BrSLG-60 [32] in ctg000061, and BrSLG-325 was identified 41.173 kb downstream of BrSCR-325, which contained two exons and one intron. Interestingly, two SRK genes, named BrSRK-325a and BrSRK-325b, were found to be located in the intergenic region between BrSCR-325 and BrSLG-325. Both BrSRK-325a and BrSRK-325b consisted of seven exons and six introns, coding 855 AA and 856 AA, respectively. There were just 61 different amino acids in BrSRK-325a and BrSRK-325b (Figure S4B). They showed opposite transcriptional directions and shared a 280 bp common promoter in a 1946 bp intergenic region (Figure S3). Based on the precursor sequences of BrS60-Smi and BrS60-Smi2, BrS60-SMI and BrS60-SMI2 [21], respectively, we blasted the homologous sequence in ctg000061, and only BrS325-SMI2 was identified. In addition, many repeat sequences and genes were also annotated in the upstream and downstream regions of the S locus (Figure 4). In a word, we successfully identified the SI-related genes in BrS-325, including one BrSCR-325, one BrSLG-325, and two SRK genes (BrSRK-325a and BrSRK-325b) (Figure 4 and Table S10).

2.5. Comparative Analysis of the S locus of Two Class II S Haplotypes

As the SI genes in BrS-325 showed the highest sequence similarity with those of BrS-60 (Figures S1 and S2), we carried out S locus comparative analysis between them. By means of a homologous sequence alignment, two sequences covering the whole S locus of BrS-60 were obtained; one had a length of 147 kb from B. rapa cultivars ‘Z1’ [33] and the other had a length of 155 kb from B. rapa cultivars ‘Chiifu’ [32] (Table 3), in which contrast phenotypes were not attributed to the S locus variation [68]. Previous reports suggested that high sequences polymorphism existed in the S locus region, while sequences outside the boundary were highly conservative [69]. Through sequence alignment and collinearity analysis, the S locus was determined. The S locus of BrS-325 covered 67.777 kb, and that of BrS-60 covered 73.764 kb and 54.448 kb in ‘Chiifu’ and ‘Z1’, respectively (Table 3). In the S locus regions, except for BrSRK-325a, the distribution of SI-related genes was completely conserved, with SCR lying upstream of SRK, and SLG lying downstream of SRK (Figure 5). Additionally, all the SI-related genes showed conserved transcription directions (Figure 5). By comparing the intergenic region between SCR and SLG, we found that the spacing distance reached 41.173 kb, containing two duplicated SRK genes in the BrS-325 locus, while the distance reached 41.192 and 24.828 kb in the BrS-60 locus of ‘Chiifu’ and ‘Z1’, respectively. Referring to the BrSRK-325b gene location in the BrS-325 locus, the intergenic region of SCR and SRK reached 19.706 kb in the BrS-325 locus, while an identical spacing distance was observed in the BrS-60 locus of ‘Chiifu’ and ‘Z1’. There was a big difference in the intergenic region of SRK and SLG. The spacing distance reached 15.384 kb in the BrS-325 locus, while the distance reached 26.943 and 11.533 kb in the BrS-60 locus of ‘Chiifu’ and ‘Z1’, respectively (Table 3). LTR-TE, DNA-TE and other-TEs were widely distributed in the intergenic regions of S locus (Figure 5). Meanwhile, a DNA-TE inserted into the intron of BrSLG-325 was identified. Taken together, similar S-intergenic regions with high polymorphism in the S locus and which were relatively conservative in boundary regions existed in different S haplotypes (Figure 5). All of these results further indicate that BrS-325 is a new class II S haplotype.

2.6. Expression Analysis of SRK and SCR

Normal expression of SRK and SCR is a critical first step for the interaction between the receptor and the ligand, which could be supported by SRK and SCR expression suppression [27,39,40,70,71]. To detect whether the SC phenotype of ‘325’ was caused by a change in the expression of SI genes, RT-qPCR was performed in the SC line ‘325’, the SI line ‘326’ (BrS-12 haplotype), and their F1 hybrid. BrSCR-325 showed a higher expression level in the anther of the SC line ‘325’ than that of BrSCR-12 in the SI line ‘326’, while in the F1 hybrid, the expression of BrSCR-325 was hardly detected (Figure 6A). The silence of BrSCR-325 in the F1 hybrid may be attributed to the suppression effect of the dominant class I BrS-12 haplotype in the SI line’326’ [72]. In the stigma side of ‘325’and F1 hybrid, the expression of BrSRK-325a was hardly detected, but BrSRK-325b was expressed normally (Figure 6B). All the results indicate that, at the transcriptional level, the SI genes BrSCR-325 and BrSRK-325b are expressed normally in SC line ‘325’.

2.7. Amino Acid Sequence Alignment and Variation Analysis of Class II SRK and SCR

There are a limited number of class II S haplotypes, including BrS-44, BrS-60, BrS-40 and BrS-29 in B. rapa and BoS-2b, BoS-5, BoS-15 in B. oleracea (Table S10) [73]. To understand whether amino acid sequence variations contribute to the phenotype change, we carried out the multiple sequence alignment of the class II SCR and SRK in B. rapa. The amino acid sequence identities among SCRs were 57% to 73% (Table S11), and among the class II SRKs, they were very conservative, from 86.67% to 94.62% (Table S12). Evolutionary analysis results showed that the phylogenetic tree was divided into two branches, Arabidopsis species and Brassica species. It meant that a closer relationship was identified in different species within the same genus. Furthermore, the branches could be divided into two groups, class I and class II, based on the sequences similarity of Brasssica species. The interspecific pairs were each other’s closest relatives with higher sequence similarity, and BrS-325 was the relative closest to BrS-60 (Figure 7E,F).
As we know, the hypervariable region of SRK and contact regions were necessary for the interaction between SCRs and SRKs with the same S haplotypes [73,74,75]. Based on class II eSRKs and SCRs structure models [75], we compared the contact regions (CR I, CR II, and CR III) of class II SCRs and the hypervariable regions (HV I, HV II, and HV III) of class II SRKs (Figure 7 and Figure S4). Sequence alignment showed that some variable amino acids existed in CR II and CR III of BrSCR-325, in which the amino acid sites were identical in other known class II SCRs, including amino acid alteration (e.g., Met62, Thr75, Ser78 in BrS-325) and amino acid deletion (e.g., Pro83 in BrS-60 and Arg80 in BrS-44).
Referring to the BrSRK-8/BrSRK-9 structure [74,75] and hypervariable regions of class II SRKs [75], we carried out amino acid sequence alignment of class II SRKs (Figure S4). The results showed that the twelve conserved cysteine residues were intact, and several amino acid variations presented in the S domain of BrSRK-325 (Figure S4). The amino acid variation analysis of hypervariable regions showed that HV I and HV II of BrSRK-325 had very high polymorphism, while the HV III variations had very low polymorphism (Figure 7B–D and Figure S4). It is worth noticing that three continuous amino acid deletions (e.g., Phe219, Leu220, Asn221) and two amino acid alterations (e.g., Phe220 and Met222 in BrSRK-325a and Tyr220 and Val222 in BrSRK-325b) were observed in the HV I, (Figure 7B and Figure S4B). Many variation residues were distributed in the HV II, including Ile277, Ser286, Arg291, Gln292, Gly300, Tyr303 and Phe305 in BrSRK-325b and Thr291, Gly299, Tyr302, and Phe304 in BrSRK-325a (Figure 7C and Figure S4B), which may be involved in the interaction of BrSCR-325 and BrSRK-325 and BrSRK-325 homo-dimerization. These observations indicate that these amino acid variations may influence the binding of BrSRK-325 and BrSCR-325.

3. Discussion

The self-incompatible system is one of the best-known physiological outbreeding devices, which can discriminate self-/non-self pollen to maintain genetic diversity and prevent self-inflicted recessions [1]. The SI phenomenon is very significant, not only for basic research, but also for crop breeding. In the past several decades, research has mainly focused on collecting materials, identifying S haplotypes, self-incompatible determinant factors, and self-incompatible signal cascade factors [10,11,36,53,54,55,76,77,78]. However, the mysterious molecular mechanism of SI still remains largely unknown. In Brassica species, many S haplotypes have been identified, including more than100 S haplotypes in B. rapa [25], about 50 S haplotypes in B. oleracea [26] and several S haplotypes in B. napus [27,28]. However, there are just four class II S haplotypes in B. rapa (BrS-44, BrS-60, BrS-40 and BrS-29) and three class II S haplotypes in B. oleracea (BoS-2b, BoS-5, and BoS-15) [29]. In this study, a new class II S haplotype, named BrS-325, was identified in a pak choi line‘325’ (Figure 1). Through Nanopore sequencing and de novo assembly strategy, we obtained the complete pak choi genome of‘325’ (Figure 3 and Table 2). The entire S locus of BrS-325 was extracted from the assembled genome, and functional annotation was performed (Figure 4 and Table S10). Sequence alignment of all the class II S haplotypes showed that BrS-325 had high sequence similarity with other class II S haplotypes. The phylogenetic tree showed that the S haplotypes of Arabidopsis species and Brassica species could be divided into independent branches, based on the sequence polymorphism of SCR and SRK, and BrS-60 was the closest relative to BrS-325 (Figure 7 and Figure S4). As seen in a previous report [31], the distribution and transcription directions of SI related genes were completely conserved in class II S haplotypes (Figure 5). Previous reports indicated that the genetic effects of the class II S haplotypes are masked, when making heterozygotes with any class I S haplotype [38]. In our study, BrSCR-325 showed a high level of expression in the anther of the SC line ‘325’, while the expression of BrSCR-325 was hardly detected in the F1 hybrids (created from the SI line ‘326’and the SC line ‘325’, which possess class I BrS-12 and class II BrS-325, respectively) (Figure 6A). The silence of BrSCR-325 in the F1 hybrids may be attributed to the suppression effect of the dominant class I S haplotype BrS-12 in the SI line ‘326’ [20]. All the evidence suggests that BrS-325 is a new class II S haplotype.
The rapid development of genomics technology will facilitate the exploration of the mechanisms of important trait formation in crops. In this study, the inbreed line ‘325’ was a pak choi SC mutant and possessed a new class II S haplotype BrS-325 (Figure 1). Segregation analysis showed that the SC phenotype in ‘325’ was related to BrS-325 (Figure 2 and Table 1). To obtain the S locus information and discover the mechanism of SC in ‘325’, a complete pak choi assembled genome was acquired by carrying out nanopore sequencing and a de novo assembly strategy (Figure 3 and Tables S1–S9). There are only a few available genome assemblies for the B. rapa cultivars, including the heading Chinese cabbage type, the yellow sarson oilseed type, and the no-heading pak choi, which concentrated on documenting the morphotypes’ phenotypic variations [32,33,66,79]. Some accessions were re-sequenced to investigate the domestication history in B. rapa [80]. Compared with the existed genome assemblies, our pak choi genome assembly had a longer N50 contig and higher coverage (Table 2, Tables S2 and S3). It provides a valuable resource for comparative genomics research and the genetic improvement of the vegetable and crop in Brassica [81,82,83]. According to the results, the candidate genes for leaf morphology and flowering were identified by comparing gene structure and expression in three morphotypes [66]. This is a good strategy to reveal the SI phenotype change by comparing with S locus variation. BrS-325 was the closest relative to BrS-60, and the available genome provided the chance to compare these two class II S haplotypes. Based on the SRK and SCR sequences and location in the genome, we determined the S locus and boundary regions of BrS-325 and BrS-60 (Figure 4 and Figure 5). Comparative analysis showed that high collinearity emerged in the outer boundary region of S locus, while high sequence polymorphism existed in the S locus (Figure 5), which was similar to the results in Arabidopsis thaliana [69].
Several SC mutation materials were collected, and the results showed that changing the S locus genes, SRK, and/or SCR, leads to SI phenotype transition [27,38,39,40,42]. One SCR gene (BrSCR-325) and two duplicated SRK genes (BrSRK-325a and BrSRK-325b) exist in the BrS-325 locus; however, expression analysis results showed that the expression of BrSCR-325 and BrSRK-325b are normal, which may not be responsible for the SC phenotype (Figure 6). Recently, studies with a SCR and SRK structural basis have helped us to understand the specific recognition response in Brassica [74,75]. The specific recognition of SCR and SRK is mediated through three hypervariable regions (HV I, HV II, HV III) of eSRK and contact regions (CR I, CR II, CR III) of SCR, which predominantly contribute to ΔG for their corresponding eSRK. The specific binding induces eSRK homo-dimerization, forming a 2:2 eSRK:SCR hetero-tetramer [74,75]. Referring to the known SRK and SCR structure [74,75], we aligned the class II SRK and SCR amino acid sequences, and especially focused on the hypervariable regions of SRKs and contact regions of SCRs. The results showed that a number of amino acid variations presented in the HV I and HV II of BrSRK-325 compared to other class II SRKs (Figure 7B–D and Figure S4), which may influence the interaction between BrSRK-325 and BrSCR-325. Sequence alignment of the class II SCRs showed that some amino acid variations existed in CR II and CR III of BrSCR-325, and these mutations may influence the interaction between BrSCR-325 and BrSRK-325 (Figure 7). Thus, we speculated that amino acid variations in HV I and HV II of BrSRK-325 and CR II and CR III of BrSCR-325 may destroy the interaction between the receptor and the ligand, leading to the SI phenotype change in B. rapa (Figure 8). The model showed that specific recognition would occur in the contact regions of SCRs and hypervariable regions of SRKs, and lead to self-incompatibility in known class II S haplotypes, while the amino acid variations in contact regions and hypervariable regions may destroy the specific recognition between BrSCR-325 and BrSRK-325 in BrS-325.
In the Brassica vegetable crop breeding process, SI is one of the major obstructions for the development of inbred lines and the propagation of parent plants. SC inbred lines are very important for the seed production of male sterile hybrid, which can greatly reduce the cost. The manipulation of S locus genes is one of the most widely recognized ways so far to convert SI into SC in Brassica. In this study, we identified a new class II S haplotype BrS-325, which had high sequence similarity with other class II S haplotypes, and was responsible for the complete SC of ‘325’. We concluded that BrS-325 showed the potential for practical breeding application value in B. rapa.

4. Materials and Methods

4.1. Plant Materials and Growth Conditions

The self-incompatible line ‘326’, which contains a class I S haplotype BrS-12 and the self-compatible line ‘325’, was provided by the Vegetable Research Institute of the Wuhan Academy of Agricultural Sciences. The self-incompatible line ‘326’ was crossed with the self-compatible line ‘325’ to produce the segregation population. All the materials were grown in a greenhouse at Huazhong Agricultural University under a light intensity of 100 μmolm−2 s−1 with a 16/8 h light/dark photoperiod at 22 °C.

4.2. S Haplotype Determination and Genetic Analysis

Genomic DNA from all individuals was extracted from young leaves as described by Murray and Thompson [81]. The S haplotypes were classified by cloning with the universal primers PS5and PS15 [82] and PK1and PK4 [83] to identify class I S haplotypes and PS3 and PS21 [82] and SRK II E4L and SRK II E7R to identify class II S haplotypes. The polymerase chain reaction (PCR) was performed in a 10 μL reaction system, including 1 μL of DNA, 0.5 μL of each primer at 10 μM, 5 μL of 2× Taq Reaction Buffer (containing Mg2+, dNTPs, and DNA polymerase) (Vazyme, Nanjing, Jiangsu Province, China), and 3 μL of distilled water. The amplification program involved one cycle of 95 °C for 5 min, followed by 35 cycles of 95 °C for 30 s, 56 °C for 30 s, and 72 °C for 1 min. PCR products were electrophoretically-fractionated in a 1% agarose gel, stained with ethidium bromide, and then viewed under a UV illuminator. The SCR sequence was determined using the II SCR-1Land II SCR-1R primer pair, and the partial sequence (included first exon and four to seven exons) of SRK was determined using SRK II E1L and E1R and SRK II E4L&E7R in the self-compatible line “325”. PCR products were sequenced to determine the S haplotype. To explain the mutation locus of the self-compatible inbred line ‘325’, the F1 hybrid was created by crossing the SI parent ‘326’ (BrS-12) and the SC parent ‘325’, and self-pollinated to produce the F2 segregation population. S haplotypes were determined with the specific primer pairs: PK1and PK4 for detecting class I S haplotypes and SRK II E4L and SRK II E7R for detecting class II S haplotypes. PCR was performed under the same conditions mentioned above. Primer information for detecting S haplotypes is listed in Table S14.

4.3. Nanopore Sequencing and Genome Assembly

4.3.1. Genomic DNA Extraction, Nanopore Sequencing, and Genome Assembly

Genomic DNA was extracted from the first young leaves of the self-compatible inbred line ‘325’, according to the procedure described by Belser et al [33]. Genomic DNA quality was evaluated by detecting the purity, concentration, and integrity of genomic DNA, and a sequencing library was created according to the procedure described by Belser et al. [33]. Meanwhile, the library quality was evaluated by detecting the accurate quantification using Qubit 3.0 and the size of the library using Agilent 2100. Finally, the library was sequenced using Nanopore MinION according to the amount of target offline data [84]. After gaining sequencing data, we carried out the genome assembly using the next de novo assembly by NextDenovo tool [84,85,86,87], including, error correction, pruning, and assembly. Each step contains the following stages of data processing: (1) splitting the sequencing data according to the set number of files and converting them into bit2 format; (2) using minimap2 [88] for mutual comparison to find overlapping regions between reads and to remove redundant overlap regions; (3) calibrating the reads according to overlap area; (4) using minimap2 to compare the corrected reads again; and (5) based on the results of mutual comparison, adopting the string Graph algorithm for assembly. Next, the assembled contigs were polished using Nanopore reads with Racon 1.4.3 [89], followed by secondary polishing with Pilon 1.23 [90] utilizing the Illumina reads. Finally, the redundancy of genomes would be removed after initial assembly and error correction using the software Purge-Haplotigs. Meanwhile, based on the sequence similarity and the proportion of the redundant part in the total length of contigs, the redundant contigs were identified and removed.

4.3.2. Genomic Annotation

In our assembled genome, we carried out genomic annotation, including the prediction of repeated sequences, the prediction of non-coding RNA, and the prediction of gene structure and functional annotation. Repetitive sequence annotation is combined with the homologous prediction method and the de novo ab initio prediction method [91]. The homologous prediction method depended on the RepBase library [92] (http://www.girinst.org/repbase; accessed on 21 March 2020) (software:RepeatMasker [93] and RepeatProteinMask). The de novo ab initio prediction method included its own sequence comparison (RepeatModeler (http://www.repeatmasker.org/RepeatModeler/ accessed on 21 March 2020), Piler [94], RepeatScount (http://bix.ucsd.edu/repeatscout/ accessed on 21 March 2020) and repetitive sequence features (software: TRF (https://tandem.bu.edu/trf/trf.html accessed on 21 March 2020) and LTR-Finder [95]).
The structure prediction of coding genes was usually combined with a variety of prediction methods, such as homolog prediction [96], de novo prediction (software: Augustuss [97], Genscan, GlimmerHMM, etc.), and cDNA/EST prediction, etc. Meanwhile, transcripts were obtained by comparing the RNA-seq data with Tophat and assembled by Cufflinks [72]. Then, a non-redundant and complete gene set was obtained by integrating predicted gene sets based on MAKER software [98] and integrating the CEGMA results based on the HiCESAP process. Finally, based on the foreign protein databases (SwissProt, TrEMBL, KEGG, InterPro and GO), proteins in the gene sets were functionally annotated. Based on tRNA structural characteristics, tRNA sequences in the genome were searched by using the tRNAscan-SE software [99]. Based on the highly conserved characteristics of rRNA, the rRNA sequence was blasted with related species’ rRNA sequences. In addition, miRNA and snRNA sequence information on the genome was predicted using the covariance model of the Rfam family (http://rfam.xfam.org/ accessed on 21 March 2020) [100].

4.4. Aniline Blue Staining Assay

The aniline blue staining assay was performed according to the established procedure with minor modifications [54]. The anther was removed the day before flowering. The emasculated stigmas were pollinated with the corresponding pollen on the day of flowering. After 16 h, the pollinated pistils were put into the fixer buffer with anethanol:glacial acetic acid ratio of 3:1 for 2 h, and then the samples were incubated in 1 M NaOH at 65 °C water for 1 h. Next, the pistils were washed three times with distilled water and stained with the basic aniline blue staining (0.1% aniline blue staining in 0.1 M K3PO4) for 3 h. The stained pistils were placed on the glass slide in distilled water to detect the pollen germination and pollen tube growth using the blue channel (UV 340–380 nm) of a fluorescence microscope (SP8; Leica, Wetzlar, Germany).

4.5. RNA Extraction and RT-qPCR

Anthers were cut from medium-size buds (2 to 3 days before flowering) and stigmas were gained from mature buds (on the day of flowering). Total RNA of stigmas and anthers was isolated from more than 30 stigmas and from six anthers of more than 20 buds using the SV Total RNA Isolation System kit (Promega, Madison, WI, USA) following the manufacturer’s instructions. One microgram of total RNA was used for the cDNA synthesis using a PrimeScriptTM RT reagent kit (Takara, Tokyo, Japan). The real-time quantitative polymerase chain reaction (RT-qPCR) was performed using 2× SYBR Green master mix (Toyobo, Osaka, Osaka Prefecture, Japan) with the 10 μL reaction system, including 5 μL of 2× SYBR Green master mix, 0.4 μL of each primer at 10 μM and 4.2 μL of 50× diluted cDNA. Amplification was performed using the CFX96 Touch Real-Time PCR Detection System (Bio-Rad, Hercules, CA, USA). The amplification program involved one cycle of 95 °C for 5 min, followed by 45 cycles at 95 °C for 15 s, 60 °C for 20 s, and 72 °C for 30 s. After each run, a melting curve was performed by heating up the samples from 60 to 95 °C. All analyses were repeated with three biological replicates. Actin gene (GenBank accession No: AF111812) was used as an internal control and actin was used to normalize transcript levels for all expression analyses [101]. Significant differences were calculated by Student’s t-test. The primer pairs coming from S locus genes (SRK and SCR) are developed. All primers are listed in Table S15.

4.6. Sequence Alignment and Phylogenetic Analysis

CDS and amino acid sequences of class II SRK and SCR were obtained from the NCBI and their GenBank or entry name are listed in Table S13. The promoter sequence of BrSRK-60 came from the genome of ‘Chiifu’ [32]. MEGA-X [102] program was used to perform multiple sequence alignment, and the results were modified with geneDoc (http://nrbsc.org/gfx/genedoc 26 August 2015). Class II SCR drafts were drawn referring to the research results [75] and class II SRK drafts were drawn referring to the report [74]. Phylogenetic trees were constructed using MEGA-X software [102] using the neighbor-joining method and a bootstrap test that was replicated 1000 times.

4.7. Synteny Assay of Two Class II S Locus

To display the synteny relationships of two class II S haplotypes, BrS-60 was obtained from the genome of ‘Chiifu’ [32] and ‘Z1’ [33], which possessed the same S haplotype and a contrasting SI phenotype, and BrS-325 was obtained from our assembled genome. Collinearity analysis of S locus sequences was performed using the software: MuMmer [103] and JCVI [104]. The S locus collinearity analysis of BrS-325 and BrS-60 was performed with the MuMmer tool. Then, visualizations of the S locus collinearity analysis were displayed using a JCVI tool.

4.8. Self-Incompatibility Phenotype Assay

The self-incompatibility phenotype was measured as in [105]. When three to five flowers were set on the major inflorescence, a bag was used to cover the major inflorescence and two or three secondary branches after cutting the opened flower and the apical buds for self-pollination. The bags were administered gently every two days to facilitate self-pollination. After two weeks, the bags were removed to allow the growth of seeds. After seeds were mature, the number of seeds was counted, and the self-compatibility index (SCI) was calculated as the ratio of the number of seeds to the number of flowers [106]. Plants with SCI ≥ 2 were referred to as self-compatible, and plants with SCI < 2 were considered self-incompatible. The significant difference was calculated by Student’s t-test.

5. Conclusions

In conclusion, we identified a new class II S haplotype in Brassica, which displayed completely self-compatibility. It is a good resource for breeding practices due to its recessiveness to all class I S haplotypes [20]. Here, we gained a high-quality reference genome, which provides the opportunity to carry out comparative genomics research on different traits [66]. In this study, compared with other class II SRK and SCR, we found many amino acid variations in BrSRK-325 and BrSCR-325, which may influence the interaction between the ligand and the receptor. Based on the above results, we inference that amino acid variations in critical sites may lead to self-incompatibility destruction in a new class II S haplotype in B. rapa.

Supplementary Materials

The following are available online at https://www.mdpi.com/article/10.3390/plants10122815/s1: Figure S1: Multiple nucleotide sequence alignment of the class II SCR, Figure S2: Multiple nucleotide sequence alignment of the first exon in class II SRKs, Figure S3: Promoter sequence alignment of class II SRKs, Figure S4: Multiple amino acid sequence alignment of class II SRKs, Table S1: Statistics for the genome assembly results of the self-compatible line ‘325’, Table S2: Statistics for the sequencing results of the genome assembly, Table S3: Blasting of the second-generation reads and third-generation reads of the genome assembly, Table S4: Statistics of genome completeness in the SC pak choi genome assemblies according to BUSCO, Table S5: Statistics of repetitive sequences in the self-compatible line ‘325’, Table S6: Statistics of gene annotation in the self-compatible line ‘325’, Table S7: Statistics the genes functional annotation in the self-compatible line ‘325’, Table S8: Statistics of non-coding RNA annotation in the self-compatible line ‘325’, Table S9: Statistics of gene annotation completeness in the SC pak choi assembled genome according to BUSCO, Table S10: Function prediction of S locus and boundary regions in BrS-325, Table S11: Amino acid sequence similarity of class II SCR, Table S12: Amino acid sequence similarity of class II SRK. Table S13: The gene information of the known class II SRK and SCR in B. rapa and B. oleracea, Table S14: Primers designed to detect the S haplotypes based on the SLG, SRK and SCR sequence, Table S15: Primers designed to detect the expression of SRK and SCR.

Author Contributions

B.L. and C.G. designed and performed the research, analyzed the data, and wrote the manuscript with contributions from all of the authors. X.Z. and Z.L. participated in bioinformatics analysis. L.W., X.L., S.D. and L.S. took part in the investigation. J.W., B.Y., J.S., J.T., T.F. and C.D. supervised the research. C.M., A.W. and C.G. supervised the research, acquired funding and complemented the manuscript. All authors have read and agreed to the published version of the manuscript.

Funding

This work was funded by the National Science Foundation of China Youth Fund (31801860) and the Key Research and Development project of Hubei Province (2021BBA097 and 2020BBB083).

Institutional Review Board Statement

Not applicable.

Informed Consent Statement

Not applicable.

Data Availability Statement

All raw sequencing data of the genome are available at NCBI under accession number PRJNA782472.

Conflicts of Interest

The authors declare that they have no conflict of interest.

References

  1. Nasrallah, J.B. Self-incompatibility in the Brassicaceae: Regulation and mechanism of self-recognition. Curr. Top. Dev. Biol. 2019, 131, 435–452. [Google Scholar]
  2. Nasrallah, J.B.; Nasrallah, M.E. Pollen-stigma signaling in the sporophytic self-incompatibility response. Plant Cell. 1993, 5, 1325–1335. [Google Scholar] [CrossRef] [PubMed]
  3. Casselman, A.L.; Vrebalov, J.; Conner, J.A.; Singhal, A.; Giovannoni, J.; Nasrallah, M.E.; Nasrallah, J.B. Determining the physical limits of the Brassica S locus by recombinational analysis. Plant Cell. 2000, 12, 23–33. [Google Scholar] [CrossRef] [Green Version]
  4. Takayama, S.; Isogai, A.; Tsukamoto, C.; Ueda, Y.; Hinata, K.; Okazaki, K.; Suzuki, A. Sequences of S-glycoproteins, products of the Brassica campestris self-incompatibility locus. Nature 1987, 326, 102–105. [Google Scholar] [CrossRef]
  5. Nasrallah, J.B. Cell–cell signaling in the self-incompatibility response. Curr. Opin. Plant Biol. 2000, 3, 368–373. [Google Scholar] [CrossRef]
  6. Shiba, H.; Kimura, N.; Takayama, S.; Hinata, K.; Suzuki, A.; Isogai, A. Alteration of the self-incompatibility phenotype in Brassica by transformation of the antisense SLG gene. Biosci. Biotech. Bioch. 2000, 64, 1016–1024. [Google Scholar] [CrossRef] [Green Version]
  7. Takayama, S.; Shiba, H.; Iwano, M.; Asano, K.; Hara, M.; Che, F.S.; Watanabe, M.; Hinata, K.; Isogai, A. Isolation and characterization of pollen coat proteins of Brassica campestris that interact with S locus-related glycoprotein1 involved in pollen-stigma adhesion. Proc. Natl. Acad. Sci. USA 2000, 97, 3765–3770. [Google Scholar] [CrossRef] [PubMed]
  8. Goring, D.R.; Rothstein, S.J. The S-locus receptor kinase gene in a self-incompatible Brassica napus line encodes a functional serine/threonine kinase. Plant Cell. 1992, 4, 1273–1281. [Google Scholar] [PubMed] [Green Version]
  9. Silva, N.F.; Stone, S.L.; Christie, L.N.; Sulaman, W.; Nazarian, K.A.; Burnett, L.A.; Arnoldo, M.A.; Rothstein, S.J.; Goring, D.R. Expression of the S receptor kinase in self-compatible Brassica napus cv. Westar leads to the allele-specific rejection of self-incompatible Brassica napus pollen. Mol. Genet. Genom. 2001, 265, 552–559. [Google Scholar] [CrossRef]
  10. Stein, J.C.; Howlett, B.; Boyes, D.C.; Nasrallah, M.E.; Nasrallah, J.B. Molecular cloning of a putative receptor protein kinase gene encoded at the self-incompatibility locus of Brassica oleracea. Proc. Natl. Acad. Sci. USA 1991, 88, 8816–8820. [Google Scholar] [CrossRef] [Green Version]
  11. Takasaki, T.; Hatakeyama, K.; Suzuki, G.; Watanabe, M.; Isogai, A.; Hinata, K. The S receptor kinase determines self-incompatibility in Brassica stigma. Nature 2000, 403, 913–916. [Google Scholar] [CrossRef]
  12. Suzuki, G.; Kai, N.; Hirose, T.; Fukui, K.; Nishio, T.; Takayama, S.; Isogai, A.; Watanabe, M.; Hinata, K. Genomic Organization of the S locus: Identification and characterization of genes in SLG/SRK region of S9 haplotype of Brassica campestris (syn. rapa). Genetics 1999, 151, 391–400. [Google Scholar] [CrossRef]
  13. Shiba, H.; Takayama, S.; Iwano, M.; Shimosato, H.; Funato, M.; Nakagawa, T.; Che, F.S.; Suzuki, G.; Watanabe, M.; Hinata, K.; et al. A pollen coat protein, SP11/SCR, determines the pollen S-specificity in the self-incompatibility of Brassica species. Plant Physiol. 2001, 125, 2095–2103. [Google Scholar] [CrossRef] [Green Version]
  14. Takayama, S.; Shiba, H.; Iwano, M.; Shimosato, H.; Che, F.S.; Kai, N.; Watanabe, M.; Suzuki, G.; Hinata, K.; Isogai, A. The pollen determinant of self-incompatibility in Brassica campestris. Proc. Natl. Acad. Sci. USA 2000, 97, 1920–1925. [Google Scholar] [CrossRef] [PubMed] [Green Version]
  15. Takayama, S.; Shimosato, H.; Shiba, H.; Funato, M.; Che, F.S.; Watanabe, M.; Iwano, M.; Isogai, A. Direct ligand-receptor complex interaction controls Brassica self-incompatibility. Nature 2001, 413, 534–538. [Google Scholar] [CrossRef] [PubMed]
  16. Kachroo, A.; Schopfer, C.R.; Nasrallah, M.E.; Nasrallah, J.B. Allele-specific receptor-ligand interactions in Brassica self-incompatibility. Science 2001, 293, 1824–1826. [Google Scholar] [CrossRef]
  17. Nasrallah, J.B.; Nishio, T.; Nasrallah, M.E. The self-incompatibility genes of Brassica: Expression and use in genetic ablation of floral tissues. Annu. Rev. Plant Biol. 1991, 42, 393–422. [Google Scholar] [CrossRef]
  18. Shiba, H.; Iwano, M.; Entani, T.; Ishimoto, K.; Shimosato, H.; Che, F.S.; Satta, Y.; Ito, A.; Takada, Y.; Watanabe, M.; et al. The dominance of alleles controlling self-incompatibility in Brassica pollen is regulated at the RNA level. Plant Cell. 2002, 14, 491–504. [Google Scholar] [CrossRef] [Green Version]
  19. Kakizaki, T.; Takada, Y.; Ito, A.; Suzuki, G.; Shiba, H.; Takayama, S.; Isogai, A.; Watanabe, M. Linear dominance relationship among four class-II S haplotypes in pollen is determined by the expression of SP11 in Brassica self-incompatibility. Plant Cell Physiol. 2003, 44, 70–75. [Google Scholar] [CrossRef] [Green Version]
  20. Tarutani, Y.; Shiba, H.; Iwano, M.; Kakizaki, T.; Suzuki, G.; Watanabe, M.; Isogai, A.; Takayama, S. Trans-acting small RNA determines dominance relationships in Brassica self-incompatibility. Nature 2010, 466, 983–986. [Google Scholar] [CrossRef]
  21. Yasuda, S.; Wada, Y.; Kakizaki, T.; Tarutani, Y.; Miura-Uno, E.; Murase, K.; Fujii, S.; Hioki, T.; Shimoda, T.; Takada, Y.; et al. A complex dominance hierarchy is controlled by polymorphism of small RNAs and their targets. Nat. Plants 2016, 3, 16206. [Google Scholar] [CrossRef] [PubMed]
  22. Shiba, H.; Kakizaki, T.; Iwano, M.; Tarutani, Y.; Watanabe, M.; Isogai, A.; Takayama, S. Dominance relationships between self-incompatibility alleles controlled by DNA methylation. Nat. Genet. 2006, 38, 297–299. [Google Scholar] [CrossRef] [PubMed]
  23. Hatakeyama, K.; Watanabe, M.; Takasaki, T.; Ojima, K.; Hinata, K. Dominance relationships between S-alleles in self-incompatible Brassica campestris L. Heredity 1998, 80, 241–247. [Google Scholar] [CrossRef]
  24. Hatakeyama, K.; Takasaki, T.; Suzuki, G.; Nishio, T.; Watanabe, M.; Isogai, A.; Hinata, K. The S receptor kinase gene determines dominance relationships in stigma expression of self-incompatibility in Brassica. Plant J. 2001, 26, 69–76. [Google Scholar] [CrossRef] [Green Version]
  25. Nou, S.; Watanabe, M.; Isogai, A.; Hinata, K. Comparison of S-alleles and S-glycoproteins between two wild populations of Brassica campestris in Turkey and Japan. Sex. Plant Reprod. 1993, 6, 79–86. [Google Scholar] [CrossRef]
  26. Ockendon, D. The S-allele collection of Brassica oleracea. Acta Hortic. 2000, 539, 25–30. [Google Scholar] [CrossRef]
  27. Okamoto, S.; Odashima, M.; Fujimoto, R.; Sato, Y.; Kitashiba, H.; Nishio, T. Self-compatibility in Brassica napus is caused by independent mutations in S-locus genes. Plant J. 2007, 50, 391–400. [Google Scholar] [CrossRef] [PubMed]
  28. Gao, C.; Ma, C.; Zhang, X.; Li, F.; Zhang, J.; Zhai, W.; Wang, Y.; Tu, J.; Shen, J.; Fu, T. The genetic characterization of self-incompatibility in a Brassica napus line with promising breeding potential. Mol. Breed. 2013, 31, 485–493. [Google Scholar] [CrossRef]
  29. Sato, Y.; Sato, K.; Nishio, T. Interspecific pairs of class II S haplotypes having different recognition specificities between Brassica oleracea and Brassica rapa. Plant Cell Physiol. 2006, 47, 340–345. [Google Scholar] [CrossRef] [Green Version]
  30. Fukai, E.; Fujimoto, R.; Nishio, T. Genomic organization of the S core region and the S flanking regions of a class-II S haplotype in Brassica rapa. Mol. Genet. Genom. 2003, 269, 361–369. [Google Scholar] [CrossRef]
  31. Kakizaki, T.; Takada, Y.; Fujioka, T.; Suzuki, G.; Satta, Y.; Shiba, H.; Isogai, A.; Takayama, S.; Watanabe, M. Comparative analysis of the S-intergenic region in class-II S haplotypes of self-incompatible Brassica rapa (syn. campestris). Genes Genet. Syst. 2006, 81, 63–67. [Google Scholar] [CrossRef] [PubMed] [Green Version]
  32. Zhang, L.; Cai, X.; Wu, J.; Liu, M.; Grob, S.; Cheng, F.; Liang, J.; Cai, C.; Liu, Z.; Liu, B.; et al. Improved Brassica rapa reference genome by single-molecule sequencing and chromosome conformation capture technologies. Hortic. Res. 2018, 5, 50. [Google Scholar] [CrossRef] [PubMed] [Green Version]
  33. Belser, C.; Istace, B.; Denis, E.; Dubarry, M.; Baurens, F.-C.; Falentin, C.; Genete, M.; Berrabah, W.; Chèvre, A.-M.; Delourme, R.; et al. Chromosome-scale assemblies of plant genomes using nanopore long reads and optical maps. Nat. Plants 2018, 4, 879–887. [Google Scholar] [CrossRef]
  34. Xiao, Z.; Han, F.; Hu, Y.; Xue, Y.; Fang, Z.; Yang, L.; Zhang, Y.; Liu, Y.; Li, Z.; Wang, Y. Overcoming cabbage crossing incompatibility by the development and application of self-compatibility-QTL-specific markers and genome-wide background analysis. Front. Plant Sci. 2019, 10, 189. [Google Scholar] [CrossRef] [Green Version]
  35. Osaka, M.; Nabemoto, M.; Maeda, S.; Sakazono, S.; Masuko-Suzuki, H.; Ito, K.; Takada, Y.; Kobayashi, I.; Lim, Y.P.; Nakazono, M.; et al. Genetic and tissue-specific RNA-sequencing analysis of self-compatible mutant TSC28 in Brassica rapa L. toward identification of a novel self-incompatibility factor. Genes Genet. Syst. 2019, 94, 167–176. [Google Scholar] [CrossRef] [Green Version]
  36. Murase, K.; Shiba, H.; Iwano, M.; Che, F.S.; Watanabe, M.; Isogai, A.; Takayama, S. A membrane-anchored protein kinase involved in Brassica self-incompatibility signaling. Science 2004, 303, 1516–1519. [Google Scholar] [CrossRef] [PubMed]
  37. Hatakeyama, K.; Horisaki, A.; Niikura, S.; Narusaka, Y.; Abe, H.; Yoshiaki, H.; Ishida, M.; Fukuoka, H.; Matsumoto, S. Mapping of quantitative trait loci for high level of self-incompatibility in Brassica rapa L. Genome 2010, 53, 257–265. [Google Scholar] [CrossRef]
  38. Isokawa, S.; Osaka, M.; Shirasawa, A.; Kikuta, R.; Komatsu, S.; Horisaki, A.; Niikura, S.; Takada, Y.; Shiba, H.; Isogai, A. Novel self-compatible lines of Brassica rapa L. isolated from the Japanese bulk-populations. Genes Genet. Syst. 2010, 85, 87–96. [Google Scholar] [CrossRef] [PubMed] [Green Version]
  39. Tochigi, T.; Udagawa, H.; Li, F.; Kitashiba, H.; Nishio, T. The self-compatibility mechanism in Brassica napus L. is applicable to F1 hybrid breeding. Theor. Appl. Genet. 2011, 123, 475–482. [Google Scholar] [CrossRef]
  40. Gao, C.; Zhou, G.; Ma, C.; Zhai, W.; Zhang, T.; Liu, Z.; Yang, Y.; Wu, M.; Yue, Y.; Duan, Z.; et al. Helitron-like transposons contributed to the mating system transition from out-crossing to self-fertilizing in polyploid Brassica napus L. Sci. Rep. 2016, 6, 33785. [Google Scholar] [CrossRef] [Green Version]
  41. Goring, D.R.; Glavin, T.L.; Schafer, U.; Rothstein, S.J. An S receptor kinase gene in self-compatible Brassica napus has a 1-bp deletion. Plant Cell. 1993, 5, 531–539. [Google Scholar] [PubMed]
  42. Hee-Jeong, J.; Nasar Uddin, A.; Jong-In, P.; Senthil Kumar, T.; Hye-Ran, K.; Yong-Gu, C.; Ill-Sup, N. Analysis of S-locus and expression of S-alleles of self-compatible rapid-cycling Brassica oleracea ‘TO1000DH3’. Mol. Biol. Rep. 2014, 41, 6441–6448. [Google Scholar] [CrossRef] [PubMed]
  43. Chen, F.; Yang, Y.; Li, B.; Liu, Z.; Khan, F.; Zhang, T.; Zhou, G.; Tu, J.; Shen, J.; Yi, B.; et al. Functional analysis of M-locus protein kinase revealed a novel regulatory mechanism of self-incompatibility in Brassica napus L. Int. J. Mol. Sci. 2019, 20, 3303. [Google Scholar] [CrossRef] [PubMed] [Green Version]
  44. Kakita, M.; Murase, K.; Iwano, M.; Matsumoto, T.; Watanabe, M.; Shiba, H.; Isogai, A.; Takayama, S. Two distinct forms of M-locus protein kinase localize to the plasma membrane and interact directly with S-locus receptor kinase to transduce self-incompatibility signaling in Brassica rapa. Plant Cell. 2007, 19, 3961–3973. [Google Scholar] [CrossRef] [PubMed] [Green Version]
  45. Gu, T.; Mazzurco, M.; Sulaman, W.; Matias, D.D.; Goring, D.R. Binding of an arm repeat protein to the kinase domain of the S-locus receptor kinase. Proc. Natl. Acad. Sci. USA 1998, 95, 382–387. [Google Scholar] [CrossRef] [Green Version]
  46. Stone, S.L.; Arnoldo, M.; Goring, D.R. A breakdown of Brassica self-incompatibility in ARC1 antisense transgenic plants. Science 1999, 286, 1729–1731. [Google Scholar] [CrossRef] [PubMed] [Green Version]
  47. Kitashiba, H.; Liu, P.; Nishio, T.; Nasrallah, J.B.; Nasrallah, M.E. Functional test of Brassica self-incompatibility modifiers in Arabidopsis thaliana. Proc. Natl. Acad. Sci. USA 2011, 108, 18173–18178. [Google Scholar] [CrossRef] [PubMed] [Green Version]
  48. Indriolo, E.; Safavian, D.; Goring, D.R. The ARC1 E3 ligase promotes two different self-pollen avoidance traits in Arabidopsis. Plant Cell. 2014, 26, 1525–1543. [Google Scholar] [CrossRef] [PubMed] [Green Version]
  49. Duan, Z.; Dou, S.; Liu, Z.; Li, B.; Yi, B.; Shen, J.; Tu, J.; Fu, T.; Dai, C.; Ma, C. Comparative phosphoproteomic analysis of compatible and incompatible pollination in Brassica napus L. Acta Bioch. Bioph. Sin. 2020, 52, 446–456. [Google Scholar] [CrossRef]
  50. Xu, Q.; Guo, S.R.; Li, L.; An, Y.H.; Shu, S.; Sun, J. Proteomics analysis of compatibility and incompatibility in grafted cucumber seedlings. Plant Physiol. Biochem. 2016, 105, 21–28. [Google Scholar] [CrossRef]
  51. Sankaranarayanan, S.; Jamshed, M.; Samuel, M.A. Proteomics approaches advance our understanding of plant self-incompatibility response. J. Proteome Res. 2013, 12, 4717–4726. [Google Scholar] [CrossRef] [PubMed]
  52. Kenney, P.; Sankaranarayanan, S.; Balogh, M.; Indriolo, E. Expression of Brassica napus GLO1 is sufficient to breakdown artificial self-incompatibility in Arabidopsis thaliana. Plant Reprod. 2020, 33, 159–171. [Google Scholar] [CrossRef]
  53. Samuel, M.A.; Chong, Y.T.; Haasen, K.E.; Aldea-Brydges, M.G.; Stone, S.L.; Goring, D.R. Cellular pathways regulating responses to compatible and self-incompatible pollen in Brassica and Arabidopsis stigmas intersect at Exo70A1, a putative component of the exocyst complex. Plant Cell. 2009, 21, 2655–2671. [Google Scholar] [CrossRef] [PubMed] [Green Version]
  54. Sankaranarayanan, S.; Jamshed, M.; Samuel, M.A. Degradation of glyoxalase I in Brassica napus stigma leads to self-incompatibility response. Nat. Plants 2015, 1, 15185. [Google Scholar] [CrossRef]
  55. Scandola, S.; Samuel, M.A. A flower-specific phospholipase D is a stigmatic compatibility factor targeted by the self-incompatibility response in Brassica napus. Curr. Biol. 2019, 29, 506–512.e4. [Google Scholar] [CrossRef] [PubMed] [Green Version]
  56. Duan, Z.; Zhang, Y.; Tu, J.; Shen, J.; Yi, B.; Fu, T.; Dai, C.; Ma, C. The Brassica napus GATA transcription factor BnA5.ZML1 is a stigma compatibility factor. J. Integr. Plant Biol. 2020, 62, 1112–1131. [Google Scholar] [CrossRef] [PubMed]
  57. Nou, I.S.; Watanabe, M.; Isogai, A.; Shiozawa, H.; Suzuki, A.; Hinata, K. Variation of S-alleles and S-glycoproteins in a naturalized population of self-incompatible Brassica campestris L. Jpn. J. Genet. 1991, 66, 227–239. [Google Scholar] [CrossRef] [Green Version]
  58. Peters, J.L.; Cnudde, F.; Gerats, T. Forward genetics and map-based cloning approaches. Trends Plant Sci. 2003, 8, 484–491. [Google Scholar] [CrossRef] [PubMed]
  59. Keller, B.; Feuillet, C.; Yahiaoui, N. Map-based isolation of disease resistance genes from bread wheat: Cloning in a supersize genome. Genet. Res. 2005, 85, 93–100. [Google Scholar] [CrossRef] [PubMed]
  60. Sui, F.; Zhao, D.; Zhu, H.; Gong, Y.; Tang, Z.; Huang, X.Y.; Zhang, G.; Zhao, F.J. Map-based cloning of a new total loss-of-function allele of OsHMA3 causes high cadmium accumulation in rice grain. J. Exp. Bot. 2019, 70, 2857–2871. [Google Scholar] [CrossRef] [PubMed]
  61. Wang, P.; Yao, F.J.; Lu, L.X.; Fang, M.; Zhang, Y.M.; Khan, A.A.; Kong, X.H.; Yu, J.; Jiang, W.Z.; Kitamoto, Y.; et al. Map-based cloning of genes encoding key enzymes for pigment synthesis in Auricularia cornea. Fungal Biol. 2019, 123, 843–853. [Google Scholar] [CrossRef]
  62. Liu, S.; Yeh, C.T.; Tang, H.M.; Nettleton, D.; Schnable, P.S. Gene mapping via bulked segregant RNA-Seq (BSR-Seq). PLoS ONE 2012, 7, e36406. [Google Scholar] [CrossRef] [PubMed] [Green Version]
  63. Klein, H.; Xiao, Y.; Conklin, P.A.; Govindarajulu, R.; Kelly, J.A.; Scanlon, M.J.; Whipple, C.J.; Bartlett, M. Bulked-segregant analysis coupled to whole genome sequencing (BSA-Seq) for rapid gene cloning in Maize. G3 2018, 8, 3583–3592. [Google Scholar] [CrossRef] [PubMed] [Green Version]
  64. Zeng, W.; Shi, J.; Qiu, C.; Wang, Y.; Rehman, S.; Yu, S.; Huang, S.; He, C.; Wang, W.; Chen, H.; et al. Identification of a genomic region controlling thermotolerance at flowering in maize using a combination of whole genomic re-sequencing and bulked segregant analysis. Theor. Appl. Genet. 2020, 133, 2797–2810. [Google Scholar] [CrossRef] [PubMed]
  65. Gao, J.; Dai, G.; Zhou, W.; Liang, H.; Huang, J.; Qing, D.; Chen, W.; Wu, H.; Yang, X.; Li, D.; et al. Mapping and identifying a candidate gene Plr4, a recessive gene regulating purple leaf in Rice, by using bulked segregant and transcriptome analysis with next-generation sequencing. Int. J. Mol. Sci. 2019, 20, 4335. [Google Scholar] [CrossRef] [Green Version]
  66. Li, P.; Su, T.; Zhao, X.; Wang, W.; Zhang, D.; Yu, Y.; Bayer, P.E.; Edwards, D.; Yu, S.; Zhang, F. Assembly of the non-heading pak choi genome and comparison with the genomes of heading Chinese cabbage and the oilseed yellow sarson. Plant Biotechnol. J. 2021, 19, 966–976. [Google Scholar] [CrossRef]
  67. Jain, M.; Olsen, H.E.; Paten, B.; Akeson, M. The Oxford Nanopore MinION: Delivery of nanopore sequencing to the genomics community. Genome Biol. 2016, 17, 1–11. [Google Scholar]
  68. Azibi, T.; Hadj-Arab, H.; Lode, M.; Ferreira de Carvalho, J.; Trotoux, G.; Negre, S.; Gilet, M.M.; Boutte, J.; Lucas, J.; Vekemans, X.; et al. Impact of whole genome triplication on the evolutionary history and the functional dynamics of regulatory genes involved in Brassica self-incompatibility signalling pathway. Plant Reprod. 2020, 33, 43–58. [Google Scholar] [CrossRef]
  69. Guo, Y.L.; Zhao, X.; Lanz, C.; Weigel, D. Evolution of the S-locus region in Arabidopsis relatives. Plant Physiol. 2011, 157, 937–946. [Google Scholar] [CrossRef] [PubMed] [Green Version]
  70. Dou, S.; Zhang, T.; Tu, J.; Shen, J.; Yi, B.; Wen, J.; Fu, T.; Dai, C.; Ma, C. Generation of novel self-incompatible Brassica napus by CRISPR/Cas9. Plant Biotechnol. J. 2021, 19, 875–877. [Google Scholar] [CrossRef] [PubMed]
  71. Jung, H.J.; Jung, H.J.; Ahmed, N.U.; Park, J.I.; Kang, K.K.; Hur, Y.; Lim, Y.P.; Nou, I.S. Development of self-compatible B. rapa by RNAi-mediated S locus gene silencing. PLoS ONE 2012, 7, e49497. [Google Scholar] [CrossRef] [PubMed] [Green Version]
  72. Trapnell, C.; Williams, B.A.; Pertea, G.; Mortazavi, A.; Kwan, G.; Van Baren, M.J.; Salzberg, S.L.; Wold, B.J.; Pachter, L. Transcript assembly and quantification by RNA-Seq reveals unannotated transcripts and isoform switching during cell differentiation. Nat. Biotechnol. 2010, 28, 511–515. [Google Scholar] [CrossRef] [PubMed] [Green Version]
  73. Sato, Y.; Fujimoto, R.; Toriyama, K.; Nishio, T. Commonality of self-recognition specificity of S haplotypes between Brassica oleracea and Brassica rapa. Plant Mol. Biol. 2003, 52, 617–626. [Google Scholar] [CrossRef]
  74. Ma, R.; Han, Z.; Hu, Z.; Lin, G.; Gong, X.; Zhang, H.; Nasrallah, J.B.; Chai, J. Structural basis for specific self-incompatibility response in Brassica. Cell Res. 2016, 26, 1320–1329. [Google Scholar] [CrossRef] [PubMed] [Green Version]
  75. Murasec, K.; Moriwaki, Y.; Mori, T.; Liu, X.; Masaka, C.; Takada, Y.; Maesaki, R.; Mishima, M.; Fujii, S.; Hirano, Y.; et al. Mechanism of self/nonself-discrimination in Brassica self-incompatibility. Nat. Commun. 2020, 11, 4916. [Google Scholar] [CrossRef] [PubMed]
  76. Nishio, T.; Hinata, K. Stigma proteins in self-incompatible Brassica campestris L. and self-compatible relatives, with special reference to S-allele specificity. Genes Genet. Syst. 1978, 53, 27–33. [Google Scholar] [CrossRef] [Green Version]
  77. Walker, J.C.; Zhang, R. Relationship of a putative receptor protein kinase from maize to the S-locus glycoproteins of Brassica. Nature 1990, 345, 743–746. [Google Scholar] [CrossRef] [PubMed]
  78. Schopfer, C.R.; Nasrallah, M.E.; Nasrallah, J.B. The male determinant of self-incompatibility in Brassica. Science 1999, 286, 1697–1700. [Google Scholar] [CrossRef]
  79. The Brassica rapa Genome Sequencing Project Consortium; Wang, X.; Wang, H.; Wang, J.; Sun, R.; Wu, J.; Liu, S.; Bai, Y.; Mun, J.H.; Bancroft, I.; et al. The genome of the mesopolyploid crop species Brassica rapa. Nat. Genet. 2011, 43, 1035–1039. [Google Scholar] [CrossRef] [PubMed] [Green Version]
  80. Cheng, F.; Sun, R.; Hou, X.; Zheng, H.; Zhang, F.; Zhang, Y.; Liu, B.; Liang, J.; Zhuang, M.; Liu, Y.; et al. Subgenome parallel selection is associated with morphotype diversification and convergent crop domestication in Brassica rapa and Brassica oleracea. Nat. Genet. 2016, 48, 1218–1224. [Google Scholar] [CrossRef] [PubMed]
  81. Murray, M.; Thompson, W.F. Rapid isolation of high molecular weight plant DNA. Nucleic Acids Res. 1980, 8, 4321–4326. [Google Scholar] [CrossRef] [Green Version]
  82. Nishio, T.; Kusaba, M.; Watanabe, M.; Hinata, K. Registration of S alleles in Brassica campestris L. by the restriction fragment sizes of SLGs. Theor. Appl. Genet. 1996, 92, 388–394. [Google Scholar] [CrossRef] [PubMed]
  83. Nishio, T.; Kusaba, M.; Sakamoto, K.; Ockendon, D. Polymorphism of the kinase domain of the S-locus receptor kinase gene (SRK) in Brassica oleracea L. Theor. Appl. Genet. 1997, 95, 335–342. [Google Scholar] [CrossRef]
  84. Goodwin, S.; Gurtowski, J.; Ethe-Sayers, S.; Deshpande, P.; Schatz, M.C.; McCombie, W.R. Oxford Nanopore sequencing, hybrid error correction, and de novo assembly of a eukaryotic genome. Genome Res. 2015, 25, 1750–1756. [Google Scholar] [CrossRef] [Green Version]
  85. Jayakumar, V.; Sakakibara, Y. Comprehensive evaluation of non-hybrid genome assembly tools for third-generation PacBio long-read sequence data. Brief. Bioinform. 2019, 20, 866–876. [Google Scholar] [CrossRef] [PubMed]
  86. Phillippy, A.M. New advances in sequence assembly. Genome Res. 2017, 27, xi–xiii. [Google Scholar] [CrossRef] [PubMed] [Green Version]
  87. Salzberg, S.L.; Phillippy, A.M.; Zimin, A.; Puiu, D.; Magoc, T.; Koren, S.; Treangen, T.J.; Schatz, M.C.; Delcher, A.L.; Roberts, M. GAGE: A critical evaluation of genome assemblies and assembly algorithms. Genome Res. 2012, 22, 557–567. [Google Scholar] [CrossRef] [Green Version]
  88. Li, H. Minimap2: Pairwise alignment for nucleotide sequences. Bioinformatics 2018, 34, 3094–3100. [Google Scholar] [CrossRef] [PubMed]
  89. Vaser, R.; Sović, I.; Nagarajan, N.; Šikić, M. Fast and accurate de novo genome assembly from long uncorrected reads. Genome Res. 2017, 27, 737–746. [Google Scholar] [CrossRef] [PubMed] [Green Version]
  90. Walker, B.J.; Abeel, T.; Shea, T.; Priest, M.; Abouelliel, A.; Sakthikumar, S.; Cuomo, C.A.; Zeng, Q.; Wortman, J.; Young, S. Pilon: An integrated tool for comprehensive microbial variant detection and genome assembly improvement. PLoS ONE 2014, 9, e112963. [Google Scholar] [CrossRef]
  91. Price, A.L.; Jones, N.C.; Pevzner, P.A. De novo identification of repeat families in large genomes. Bioinformatics 2005, 21 (Suppl. S1), i351–i358. [Google Scholar] [CrossRef] [Green Version]
  92. Jurka, J.; Kapitonov, V.V.; Pavlicek, A.; Klonowski, P.; Kohany, O.; Walichiewicz, J. Repbase Update, a database of eukaryotic repetitive elements. Cytogenet. Genome Res. 2005, 110, 462–467. [Google Scholar] [CrossRef]
  93. Chen, N. Using RepeatMasker to identify repetitive elements in genomic sequences. Curr. Protoc. Bioinform. 2004, 5, 4.10.1–4.10.14. [Google Scholar] [CrossRef] [PubMed]
  94. Edgar, R.C.; Myers, E.W. PILER: Identification and classification of genomic repeats. Bioinformatics. 2005, 21 (Suppl. S1), i152–i158. [Google Scholar] [CrossRef] [PubMed]
  95. Xu, Z.; Wang, H. LTR_FINDER: An efficient tool for the prediction of full-length LTR retrotransposons. Nucleic Acids Res. 2007, 35 (Suppl. S2), W265–W268. [Google Scholar] [CrossRef] [PubMed] [Green Version]
  96. Kent, W.J. BLAT-the BLAST-like alignment tool. Genome Res. 2002, 12, 656–664. [Google Scholar]
  97. Stanke, M.; Keller, O.; Gunduz, I.; Hayes, A.; Waack, S.; Morgenstern, B. AUGUSTUS: Ab initio prediction of alternative transcripts. Nucleic Acids Res. 2006, 34 (Suppl. S2), W435–W439. [Google Scholar] [CrossRef] [PubMed] [Green Version]
  98. Holt, C.; Yandell, M. MAKER2: An annotation pipeline and genome-database management tool for second-generation genome projects. BMC Bioinform. 2011, 12, 1–14. [Google Scholar] [CrossRef] [Green Version]
  99. Lowe, T.M.; Eddy, S.R. tRNAscan-SE: A program for improved detection of transfer RNA genes in genomic sequence. Nucleic Acids Res. 1997, 25, 955–964. [Google Scholar] [CrossRef]
  100. Griffiths-Jones, S.; Moxon, S.; Marshall, M.; Khanna, A.; Eddy, S.R.; Bateman, A. Rfam: Annotating non-coding RNAs in complete genomes. Nucleic Acids Res. 2005, 33 (Suppl. S1), D121–D124. [Google Scholar] [CrossRef] [PubMed] [Green Version]
  101. Zhang, T.; Gao, C.; Yue, Y.; Liu, Z.; Ma, C.; Zhou, G.; Yang, Y.; Duan, Z.; Li, B.; Wen, J.; et al. Time-course transcriptome analysis of compatible and incompatible pollen-stigma interactions in Brassica napus L. Front. Plant Sci. 2017, 8, 682. [Google Scholar] [CrossRef] [Green Version]
  102. Kumar, S.; Stecher, G.; Li, M.; Knyaz, C.; Tamura, K. MEGA X: Molecular evolutionary genetics analysis across computing platforms. Mol. Biol. Evol. 2018, 35, 1547. [Google Scholar] [CrossRef] [PubMed]
  103. Marçais, G.; Delcher, A.L.; Phillippy, A.M.; Coston, R.; Salzberg, S.L.; Zimin, A. MUMmer4: A fast and versatile genome alignment system. PLoS Comput. Biol. 2018, 14, e1005944. [Google Scholar] [CrossRef] [PubMed] [Green Version]
  104. Tang, H.; Zhang, X.; Miao, C.; Zhang, J.; Ming, R.; Schnable, J.C.; Schnable, P.S.; Lyons, E.; Lu, J. ALLMAPS: Robust scaffold ordering based on multiple maps. Genome Biol. 2015, 16, 3. [Google Scholar] [CrossRef] [PubMed] [Green Version]
  105. Zhang, X.; Ma, C.; Tang, J.; Tang, W.; Tu, J.; Shen, J.; Fu, T. Distribution of S haplotypes and its relationship with restorer-maintainers of self-incompatibility in cultivated Brassica napus. Theor. Appl. Genet. 2008, 117, 171–179. [Google Scholar] [CrossRef] [PubMed]
  106. Yang, G.; Chen, C.; Zhou, G.; Geng, C.; Ma, C.; Tu, J.; Fu, T. Genetic analysis of four self-incompatible lines in Brassica napus. Plant Breed. 2001, 120, 57–61. [Google Scholar] [CrossRef]
Figure 1. Self-compatibility phenotype identification and S haplotype determination of the inbred line ‘325’. (A) self-pollination of inbred line ‘325’ by observing with aniline blue staining, scale bar = 100 μm; (B) self-pollination of inbred line ‘325’ by observing silique development, scale bar = 2 cm; (C) S haplotype identification with class I and class II universal primer pairs, PS5 and PS15 and PK1 and PK4 were used for class I S haplotypes identification, PS3 and PS21 and SRK IIE4L and E7R were used for class II S haplotypes identification, with Actin7 as the control. (D,E) phylogenetic analysis of class II S locus genes SCR and SRK E1. An unrooted phylogenetic tree was constructed using the neighbor-joining method. Bootstrap values from 1000 replicates are shown.
Plants 10 02815 g001
Figure 2. Self-pollination phenotype analysis and S haplotype identification of the segregation population derived from SC ‘325’ and SI ‘326’. (A) Aniline blue staining observing pollen germination and pollen tube growth of the self-pollinated SC line ‘325’, SI line ‘326’ and hybrid F1 coming from the SC parent ‘325’crossed with the SI parent ‘326’. Scale bar = 100 μm; (B) silique development of self-pollinated the SC line ‘325’, SI line ‘326’ and hybrid F1. Scale bar = 1 cm; (C) quantification of silique length of the SC line ‘325’, the SI line ‘326’ and the hybrid (‘326’ × ’325’) after self-pollination; (D) seeds per silique of the SC line ‘325’, the SI line ‘326’ and the hybrid (‘325’ × ’326’) after self-pollination, n = 10 siliques. Error bars indicate SE. The significance was analyzed by Student’s t-test (** p < 0.01); (E) S genotypes identification and SI phenotypes analysis in partial representative plants of the F2 population with class I (PK1and PK4) and class II (SRKII-E4Land &SRKII-E7R) S haplotype specific primer pairs. SC: self-compatible, SI: self-incompatible. H: class I and class II S haplotypes, I: class I S haplotype, II: class II S haplotype.
Plants 10 02815 g002
Figure 3. Nanopore sequencing and de novo genome assembly of the SC line’325’. Circular representation of anchored contigs of the SC line ‘325’. (A) GC content distribution.; (B) gene distribution; (C) repeat sequences distribution; (D) long terminal repeat retrotransposon (LTR) distribution; (E) long interspersed nuclear elements (LINE); (F) DNA-transposon (DNA-TE).
Plants 10 02815 g003
Figure 4. S locus organization of BrS-325. The 145 kb sequence of ctg00061 covered the whole BrS-325 locus. The red and orange boxes indicate the coding sequence (CDS) and un-translated region (UTR), respectively. The green and blue boxes indicate the long terminal repeat retrotransposon (LTR-TE) and DNA-transposon (DNA-TE) and the black box indicate the other-TE (unclassified elements).
Plants 10 02815 g004
Figure 5. Comparative analysis of the genomic organization of the S locus between two class II S haplotypes, BrS-60 and BrS-325. Red and orange boxes represent CDS and UTR, respectively, and repetitive sequences (LTR-TE, DNA-TE and other-TE) are represented by green, blue, and black boxes. The SI genes SCR, SRK and SLG are shown by gene names, with SMI1 and SMI2 representing the S haplotype-linked small RNAs involved in dominance interactions.
Plants 10 02815 g005
Figure 6. Expression analysis of the SI genes. (A) relative expression level of SCR genes in the anther. BrSCR-325 expression was detected in ‘325’ and the F1 hybrid, while BrSCR-12 expression was detected in ‘326’ and the F1 hybrid; (B) relative expression level of SRK genes in the stigma. BrSRK-325a and BrSRK-325b expressions were detected in ‘325’ and the F1 hybrid, while BrSRK-12 expression was detected in ‘326’ and the F1 hybrid. BrSRK-325 indicated that BrSRK-325a expression and BrSRK-325b expression were simultaneously detected in line ‘325’ and the F1 hybrid. Error bars represent standard errors (SE) of the mean of triplicate samples. The significance was analyzed by Student’s t-test (** p < 0.01; *** p < 0.001). The relative expression was corrected using the reference gene Actin 7.
Plants 10 02815 g006
Figure 7. Multiple amino acid sequence alignment and Evolutionary analysis of the S locus gene SRKs and SCRs. (A) sequence alignment of class II SCRs. Above the alignment, the red line marks the signal peptide (SP). The conservative cysteine acid is shown by a red label C * and a red solid box. The red dotted boxes indicate the contact regions of class II SCRs. Amino acids in contact with eSRK are shown by red square boxes. Variable amino acids ofBrSCR-325 compared with other class II SCRs are shown by yellow dotted boxes. Arrows and cylinders indicate the ß strands and α helixes of class II SCRs, respectively; (BD) the hypervariable regions (HV I, HV II, HV III) sequence alignment of class II SRKs. Above the alignment, amino acids in contact with the cognate SCR are indicated by red circles, based on the same sites in contact with amino acids of BrSRK-8/BrSCR-8 and BrSRK-9/BrSCR-9, and yellow circles, based on the contact amino acids of class II SRK. The blue circles indicate the residues involved in SRK homo-dimerization. The variable amino acids of BrSRK-325 compared with other class II SRK are indicated by purple dotted boxes; (E,F) An unrooted phylogenetic tree of different S haplotypes SCRs and SRKs in B. rapa, B. oleracea, and B. nupus. A phylogenetic tree was constructed using the neighbor-joining method. Bootstrap values from 1000 replicates are shown. The pink circular arc indicated the class I S haplotypes of Brassica. The light blue circular arc indicated the class II S haplotypes, which were relatively the closest to BrS-325 in Brassica. The light green circular arc indicated the class II S haplotypes of Brassica. The orange yellow circular arc indicated the S haplotypes in Arabidopsis.
Plants 10 02815 g007
Figure 8. Specific recognition models of class II SRKs and SCRs. In the left upper panel, cognate SRK and SCR can specifically recognize each other in class II S haplotypes (BrS-44, BrS-60, BrS-40, and BrS-29), and an SI signal cascade is activated to reject self-pollination pollen. In the right upper panel, the specific recognition was destroyed for some amino acid variations, which exist in the HV I and HV II of BrSRK-325 and CR II and CR III of BrSCR-325, and SC is investigated. The red dotted box indicates the contact region of class II SCRs. Amino acids in contact with SCR and eSRK are indicated by red square boxes. Variable amino acids of BrSCR-325 compared with other class II SCR are shown by yellow dotted boxes. Above the hypervariable region sequence alignment, contact amino acids against the cognate SCR were shown red circles, based on the same sites’ contact amino acids of BrSRK-8/BrSCR-8 and BrSRK-9/BrSCR-9, and yellow circles, based on the contact amino acids of class II SRK. The blue circles indicate the residues involved in SRK homo-dimerization. The variable amino acids of BrSRK-325 compared with other class II SRK are shown by purple dotted boxes.
Plants 10 02815 g008
Table 1. Genetic analysis of the SC traits in line ‘325’.
MaterialGenotypeSI/SCExpectedχ2
II/IIIIPhenotypeRatio
32500120/12
326120012/0
325 × 326012012/0
326 × 325012012/0
(325 × 326)F220502270/223:10.094 < 3.84
Table 2. Comparisons between the assembly and annotations of the pak choi ‘325’ and published pak choi ‘ZYCX’, Chinese cabbage ‘Chiifu’ and yellow sarson ‘Z1’ genome assemblies.
325ZYCXChiifuZ1
Assembly feature
Total assembly size (Mb)376.69370.42353.14401.92
Contig number314198514981037
Contig N50 (Mb)4.542.821.452.27
Longest length (Mb)22.3222.379.4222.13
Genome annotation
Gene model42500453634625046721
Percentage of anchored genes (%)0.96910.9850.98580.9814
Table 3. Comparative analysis of the S locus between two class II S haplotype, BrS-60 and BrS-325.
AccessionPhenotypeS haplotypeAlignment Size (kb)S locus Size (kb)Distance 1 a (kb)Distance 2 b (kb)Distance 3 c (kb)SCR Length (bp)SRK Length (bp)SLG Length (bp)TE Type
325SCBrS-325145.99167.77741.17319.70615.3843915618 d6083 e4122DNA-TE
Z1SCBrS-60147.92154.44824.8286.57511.533378-67201966LTR-TE
ChiifuSIBrS-60155.42773.76441.4926.58226.943378-79671459LTR-TE
a. Intergenic distance between SCR and SLG. b. Intergenic distance between SCR and SRK. c. Intergenic distance between SRK and SLG. BrSRK-325b was used as the reference gene in BrS-325 locus to calculate the intergenic distance. d. Gene length of BrSRK-325a. e. Gene length of BrSRK-325b.
Publisher’s Note: MDPI stays neutral with regard to jurisdictional claims in published maps and institutional affiliations.

