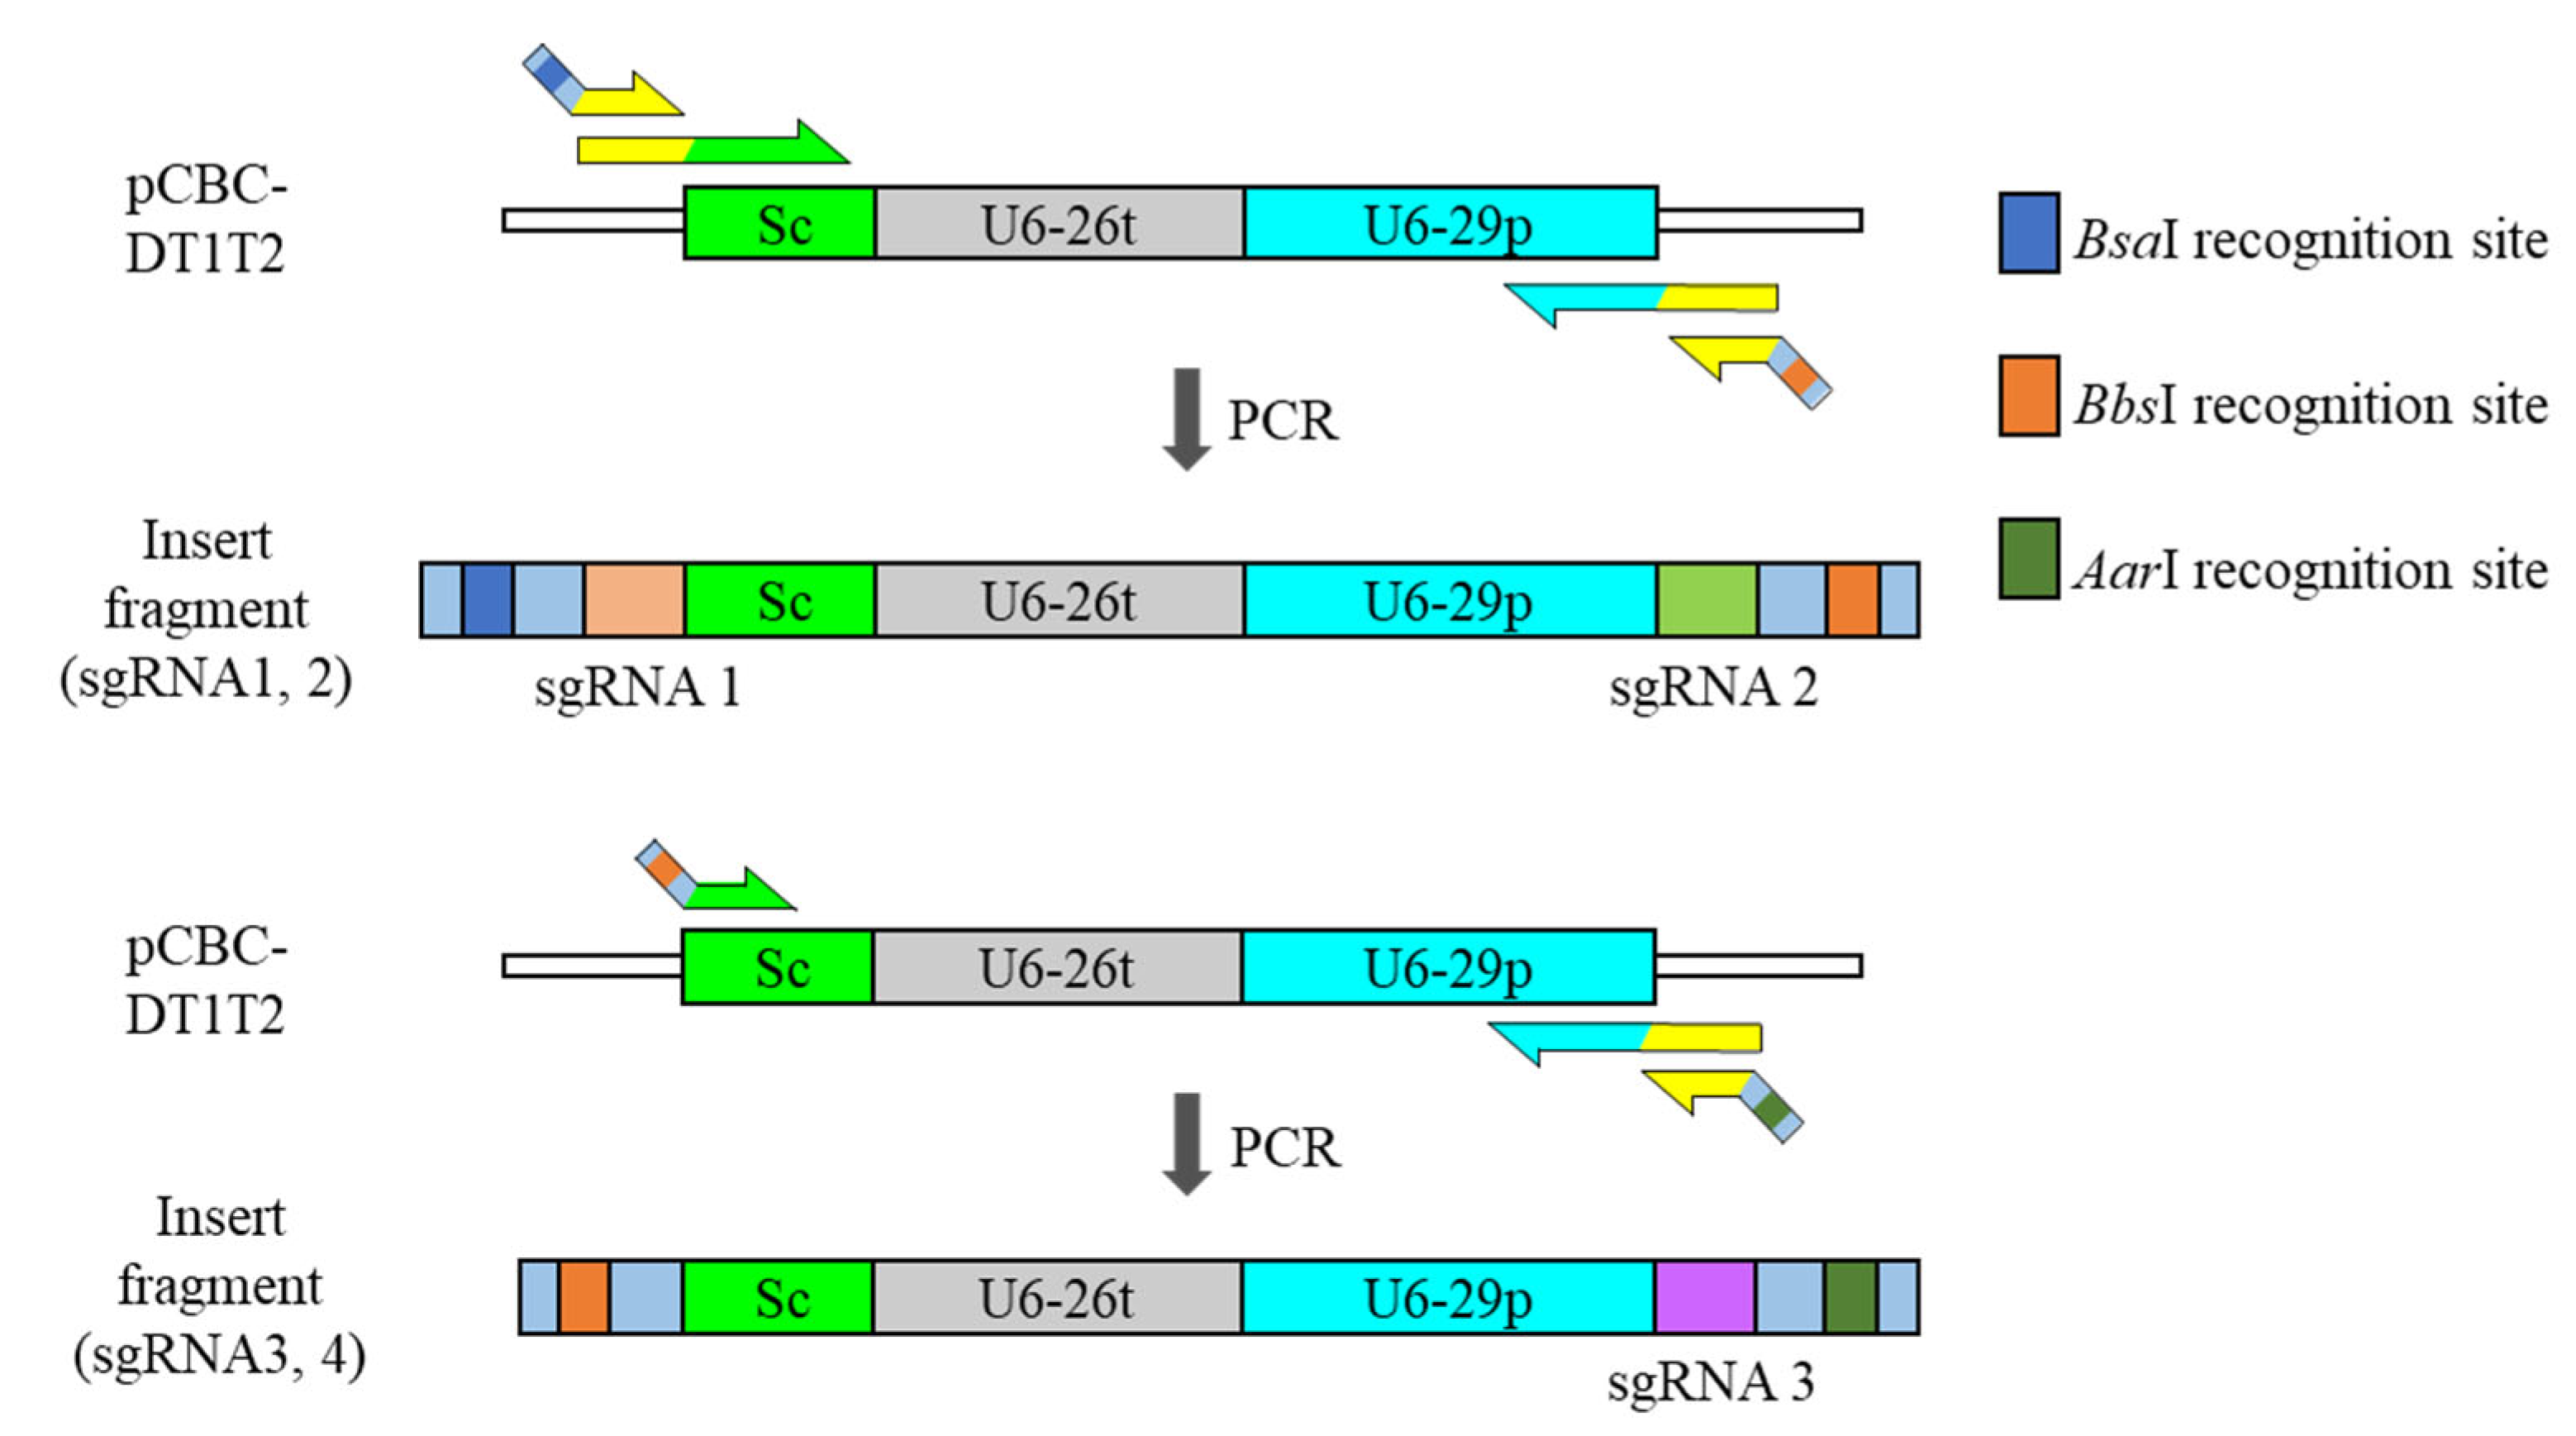
Figure 1.
Schematic structure of each insert for pHEE401E ligation. Addition of fourth sgRNA is made possible by the switch restriction-enzyme-recognition site of BbsI and AarI. Sc; sgRNA scaffold, U6-26t; U6-26 terminator, U6-29p; U6-29 promoter.
Figure 1.
Schematic structure of each insert for pHEE401E ligation. Addition of fourth sgRNA is made possible by the switch restriction-enzyme-recognition site of BbsI and AarI. Sc; sgRNA scaffold, U6-26t; U6-26 terminator, U6-29p; U6-29 promoter.
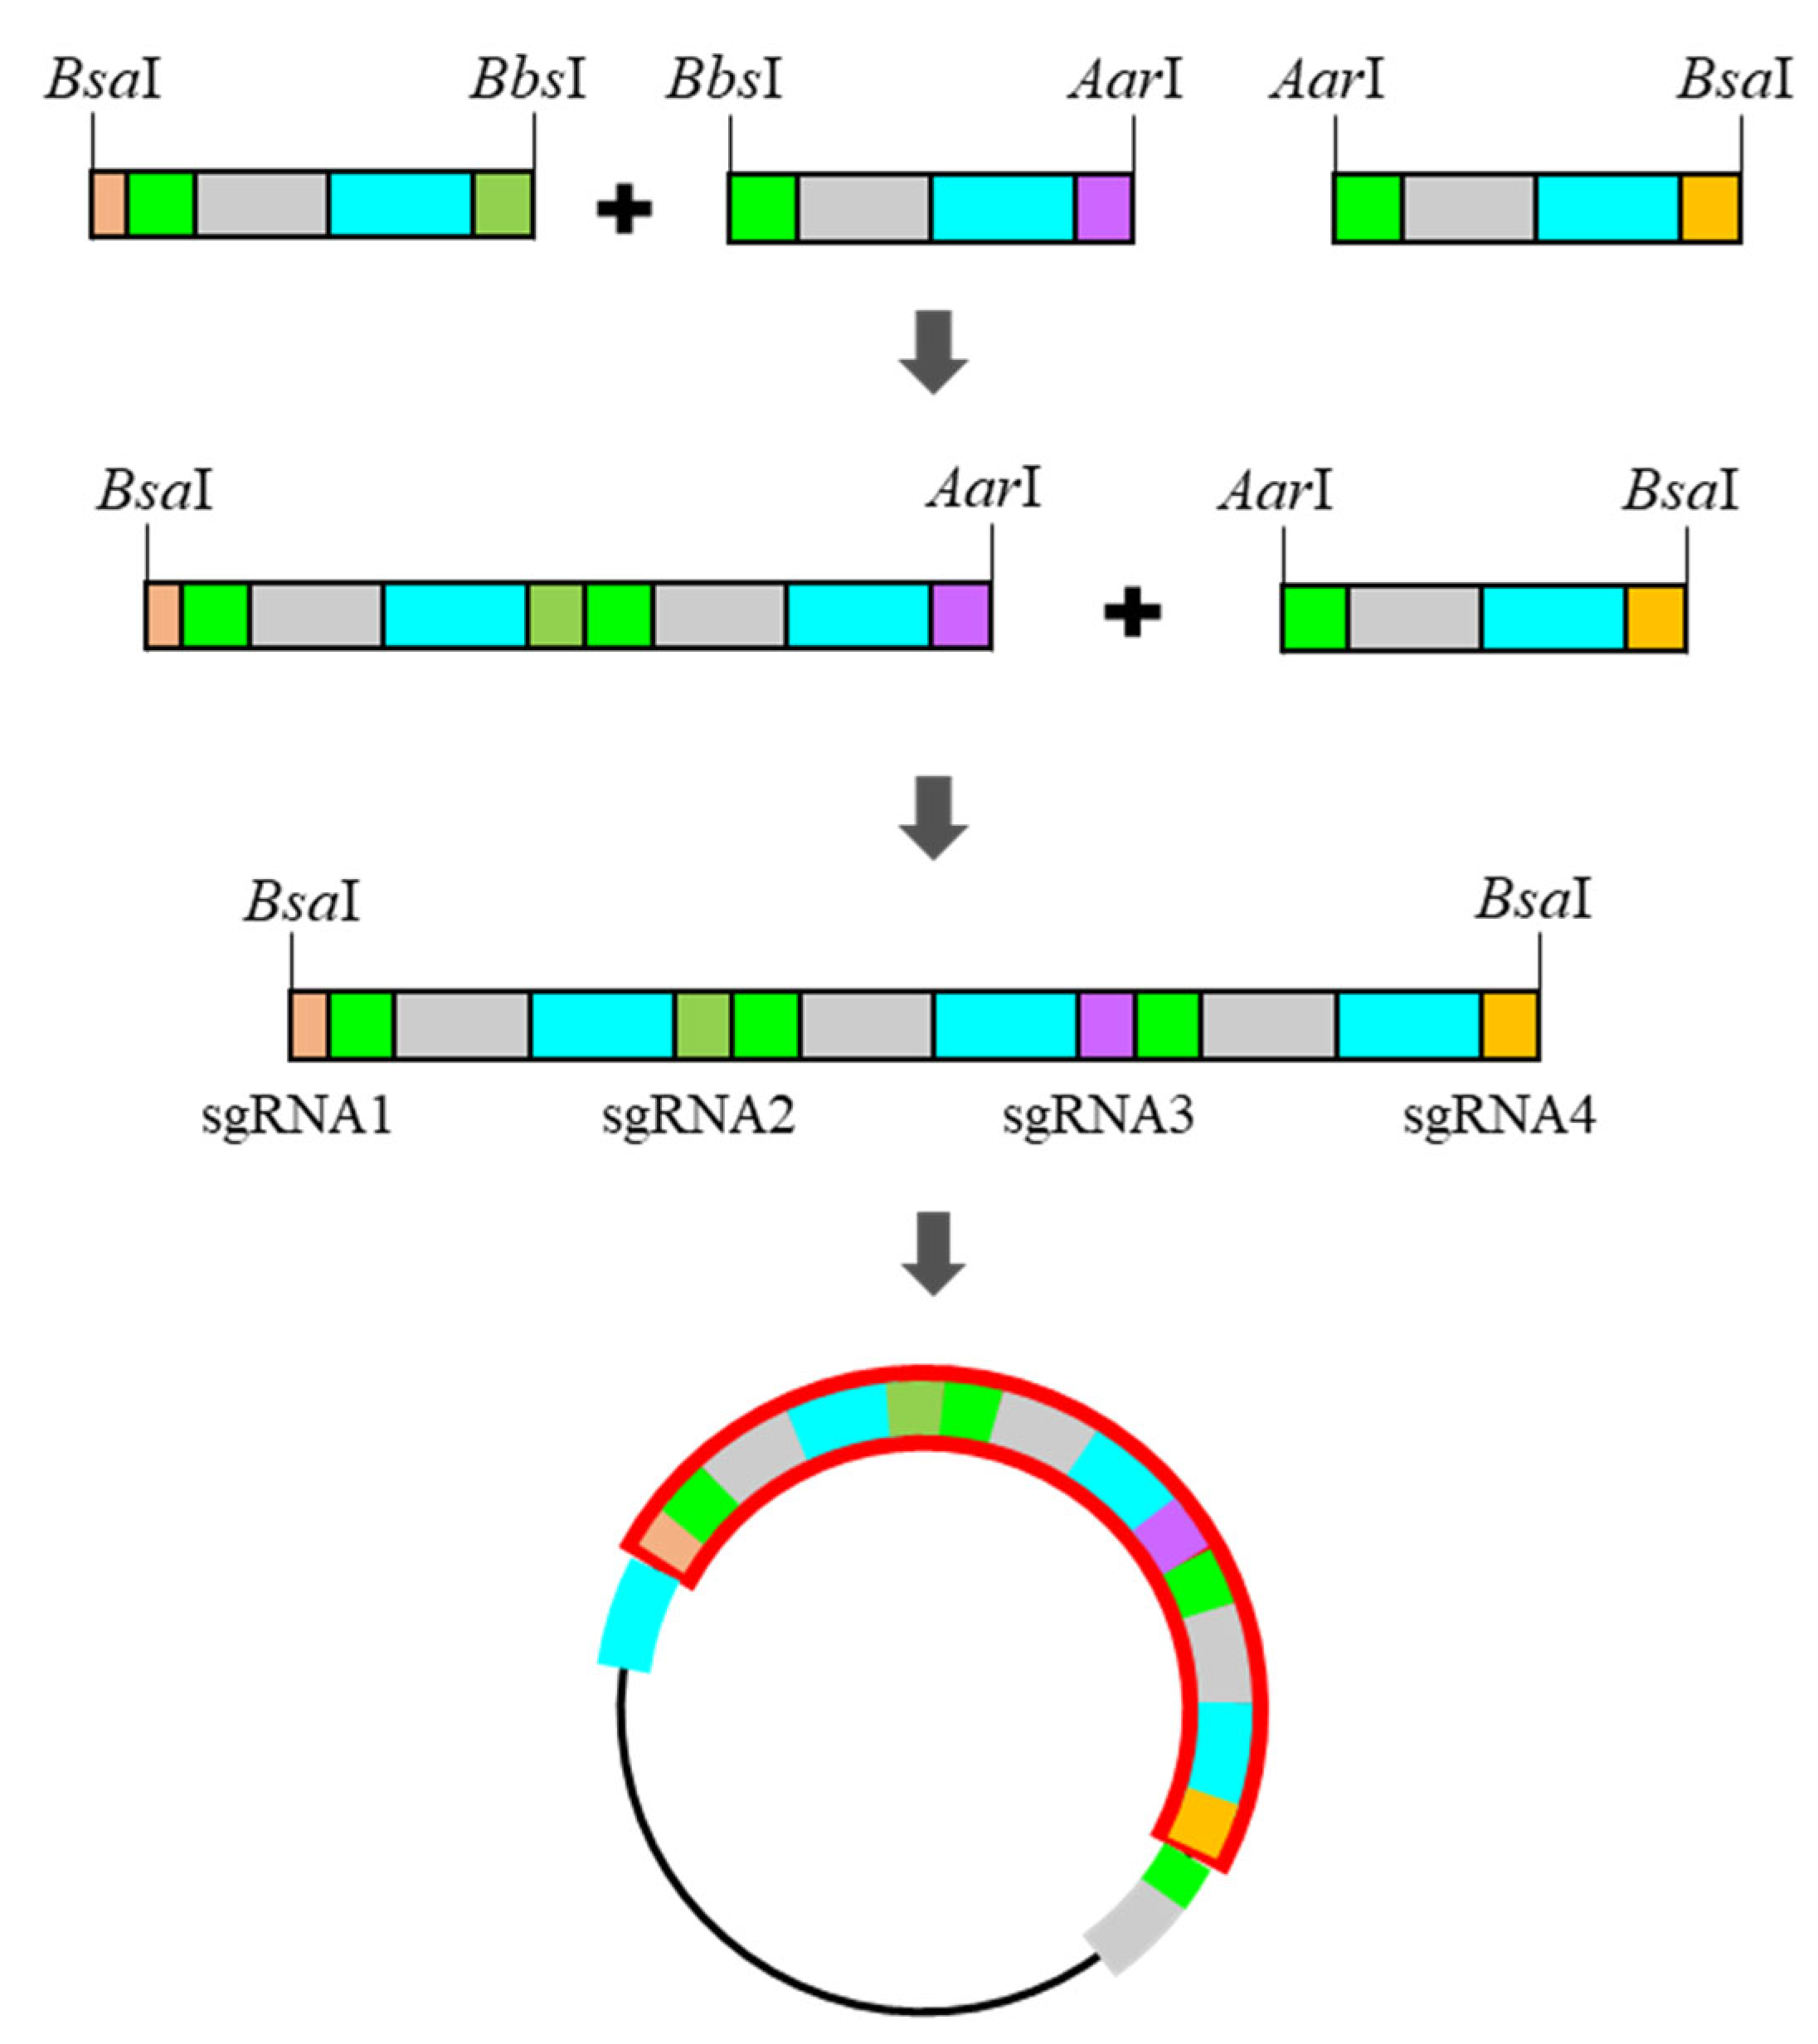
Figure 2.
Stepwise ligation for ordered insert-polymer and final product with the pHEE401E_UBQ_Bar vector.
Figure 2.
Stepwise ligation for ordered insert-polymer and final product with the pHEE401E_UBQ_Bar vector.
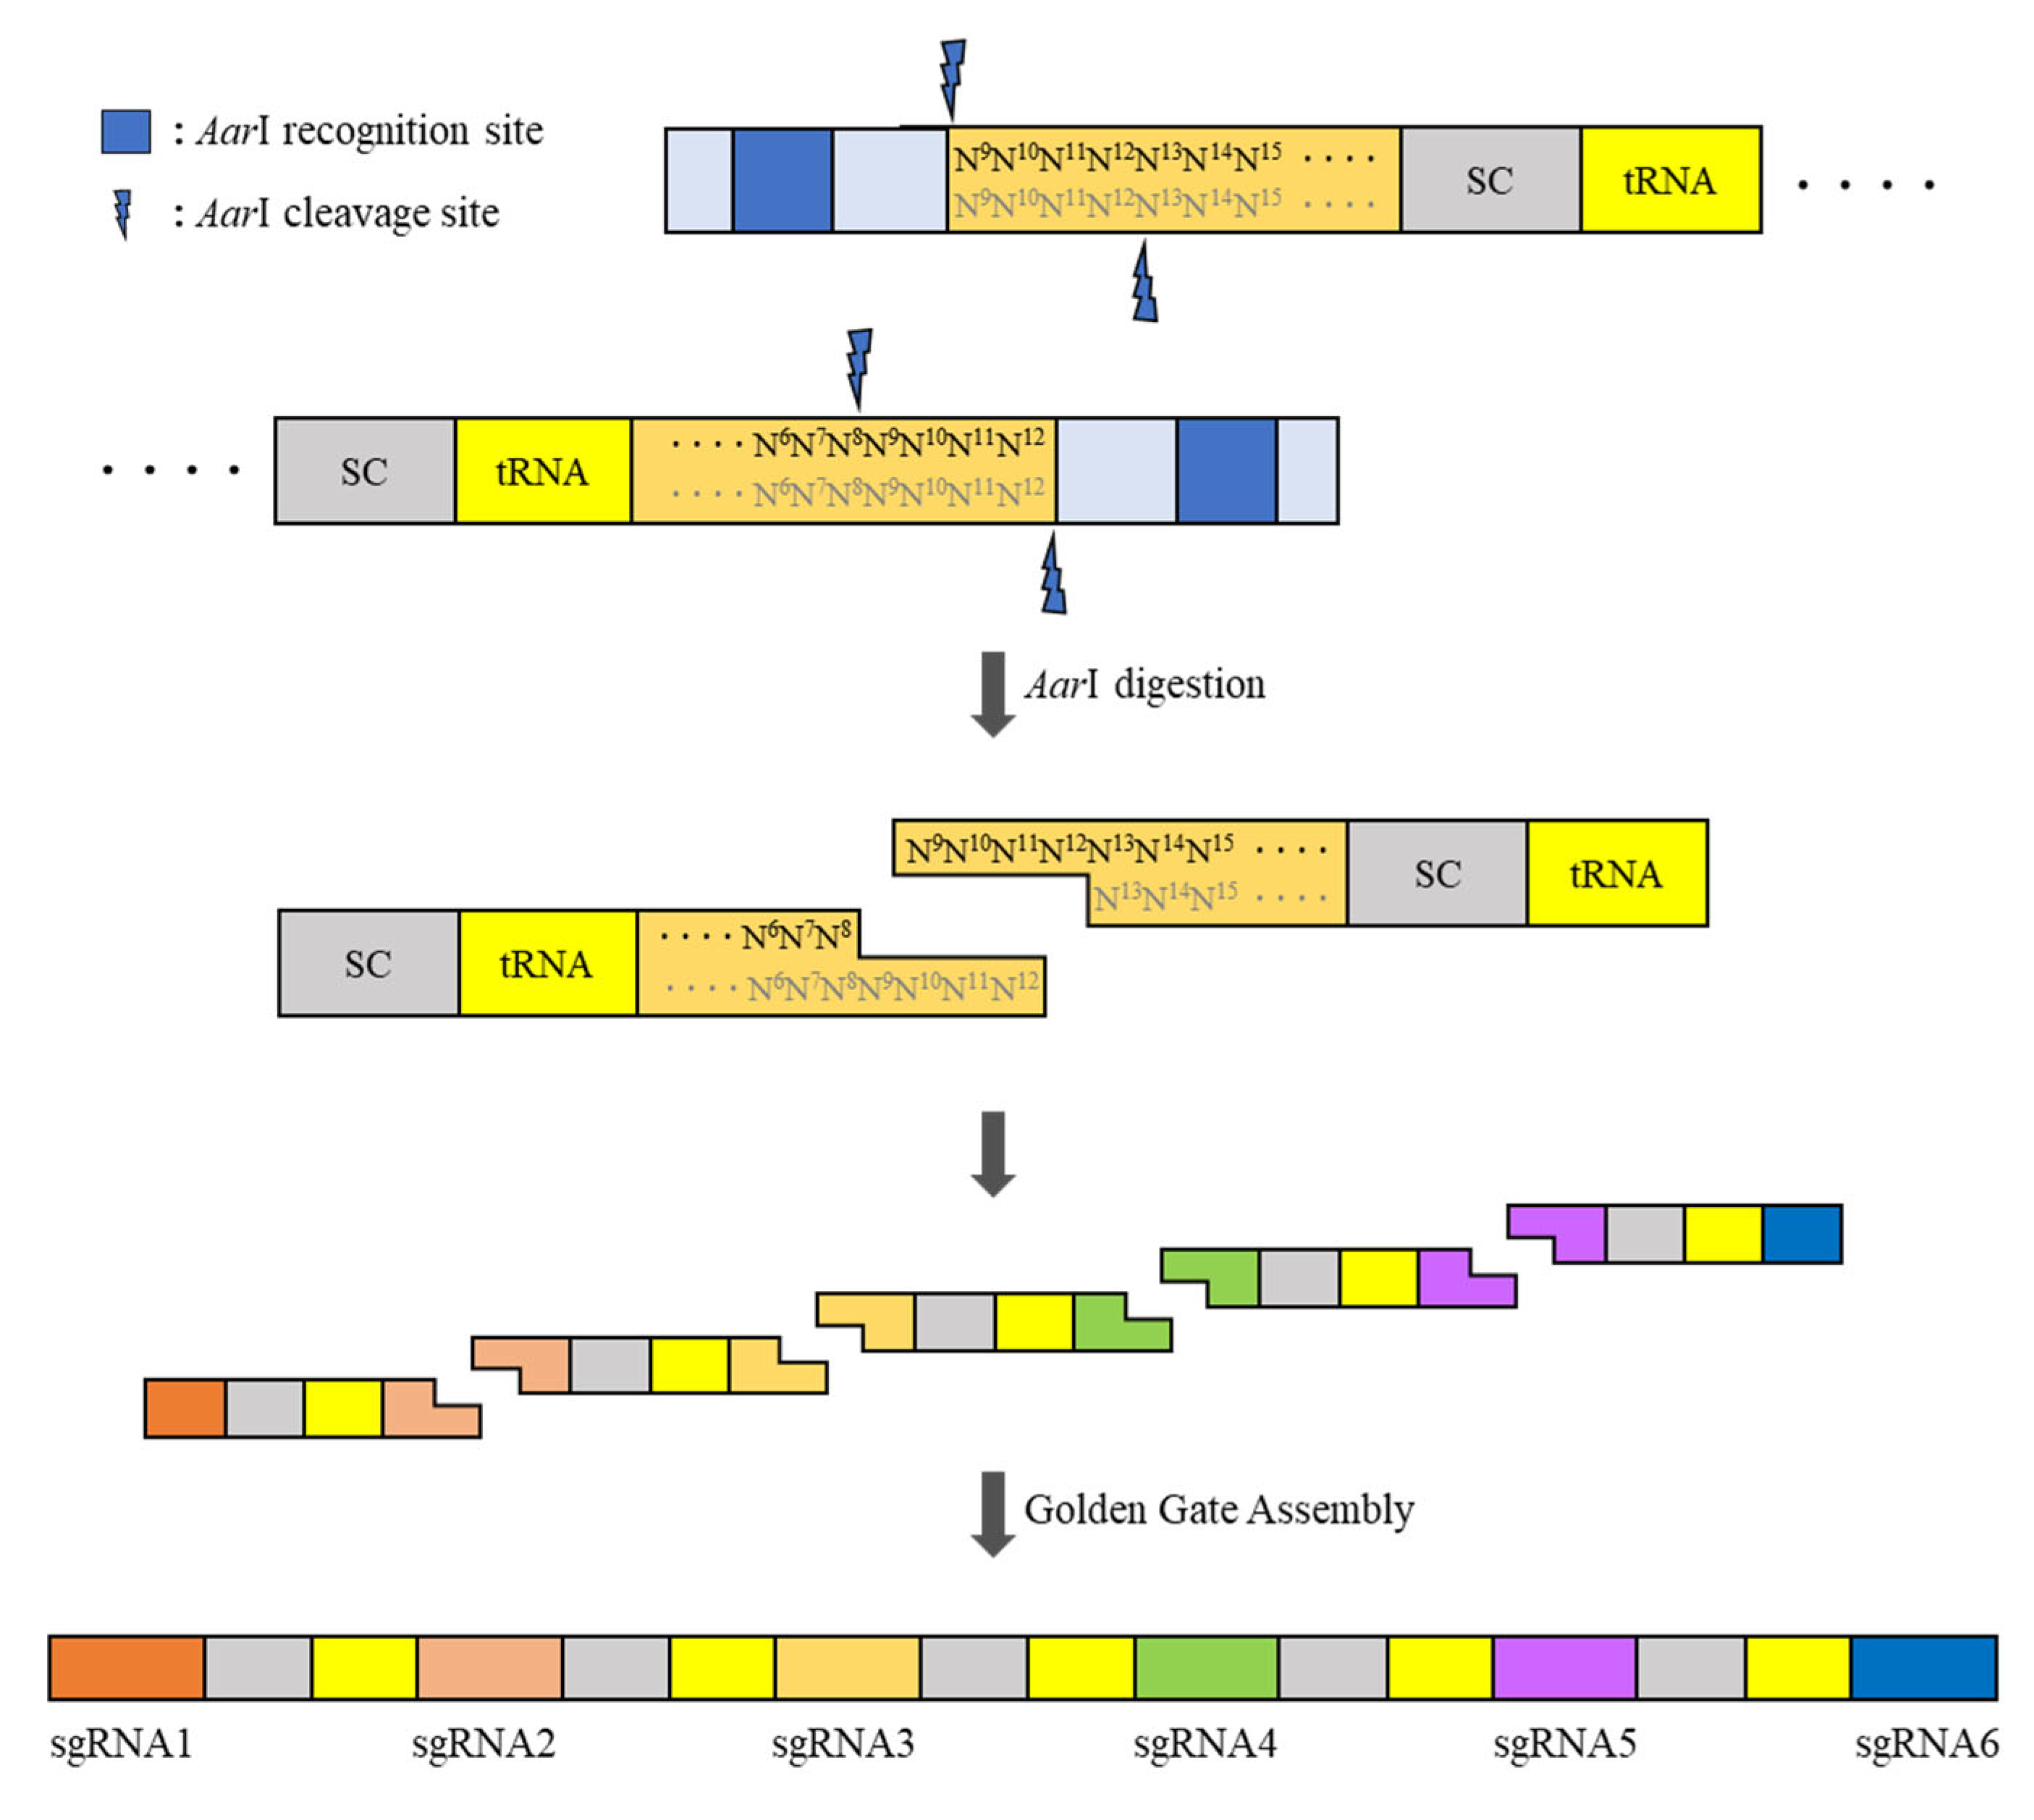
Figure 3.
Schematic strategy of the construction of the pBAtC_tRNA vector-based multi-sgRNA insert.
Figure 3.
Schematic strategy of the construction of the pBAtC_tRNA vector-based multi-sgRNA insert.
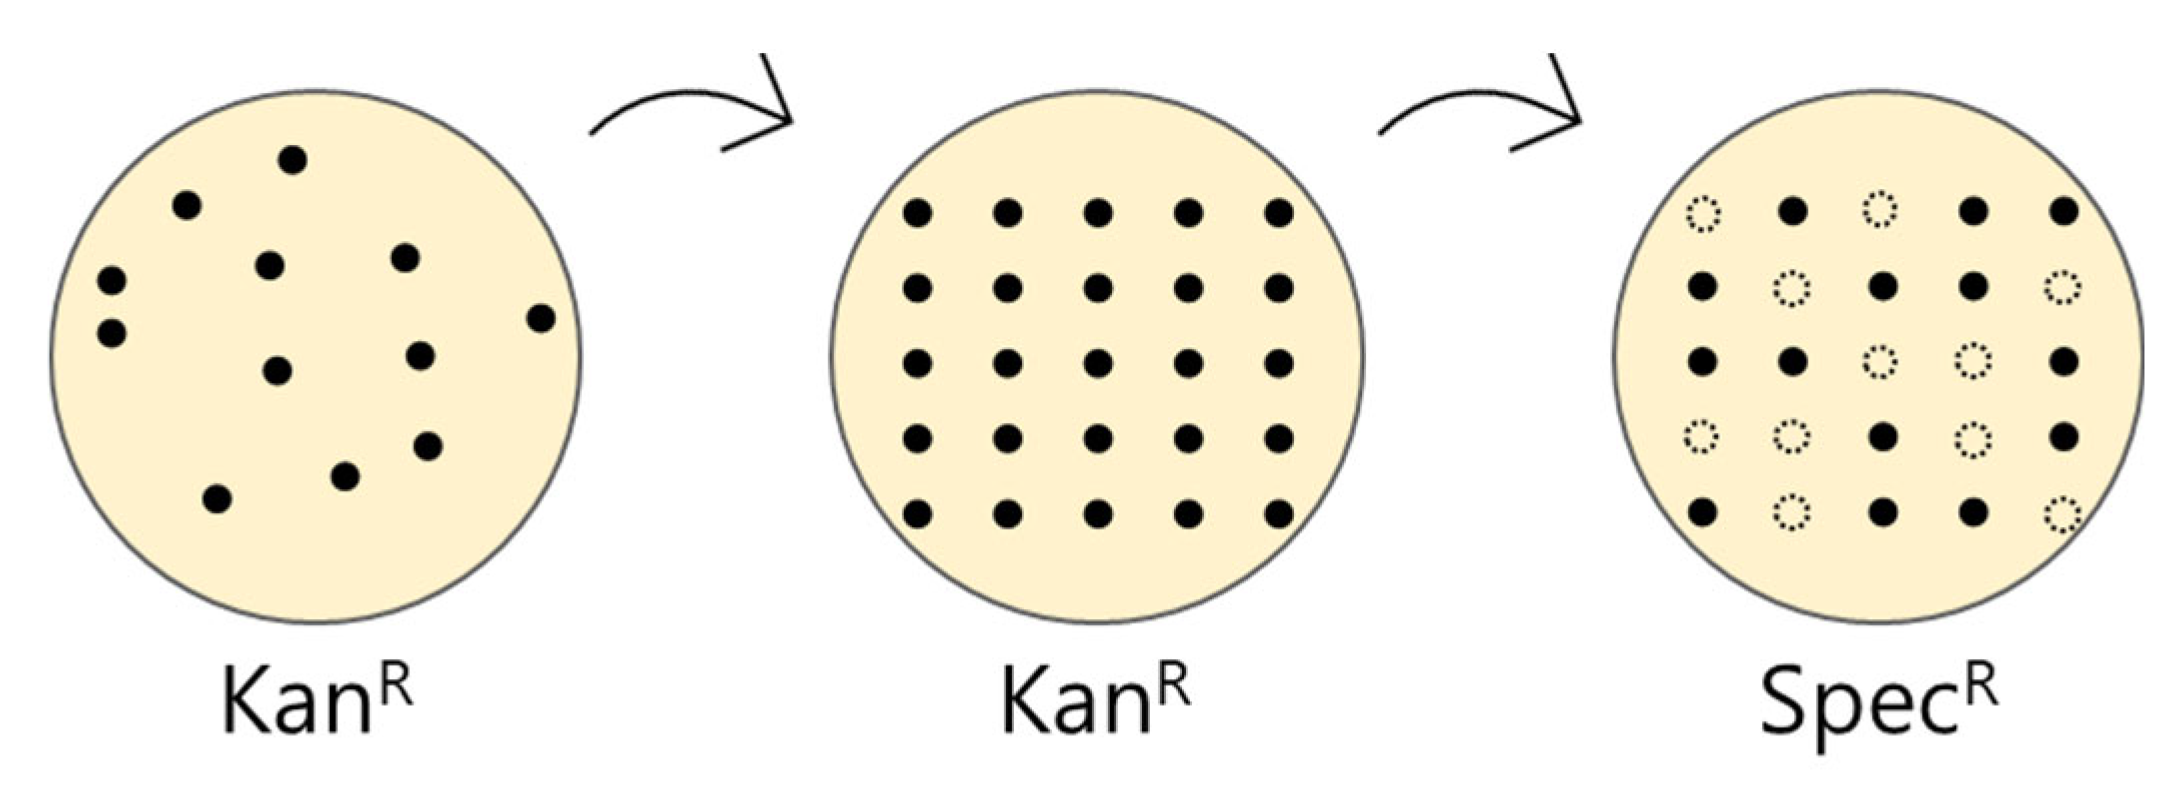
Figure 4.
Schematic of the screening of the self-ligated vector transformant.
Figure 4.
Schematic of the screening of the self-ligated vector transformant.
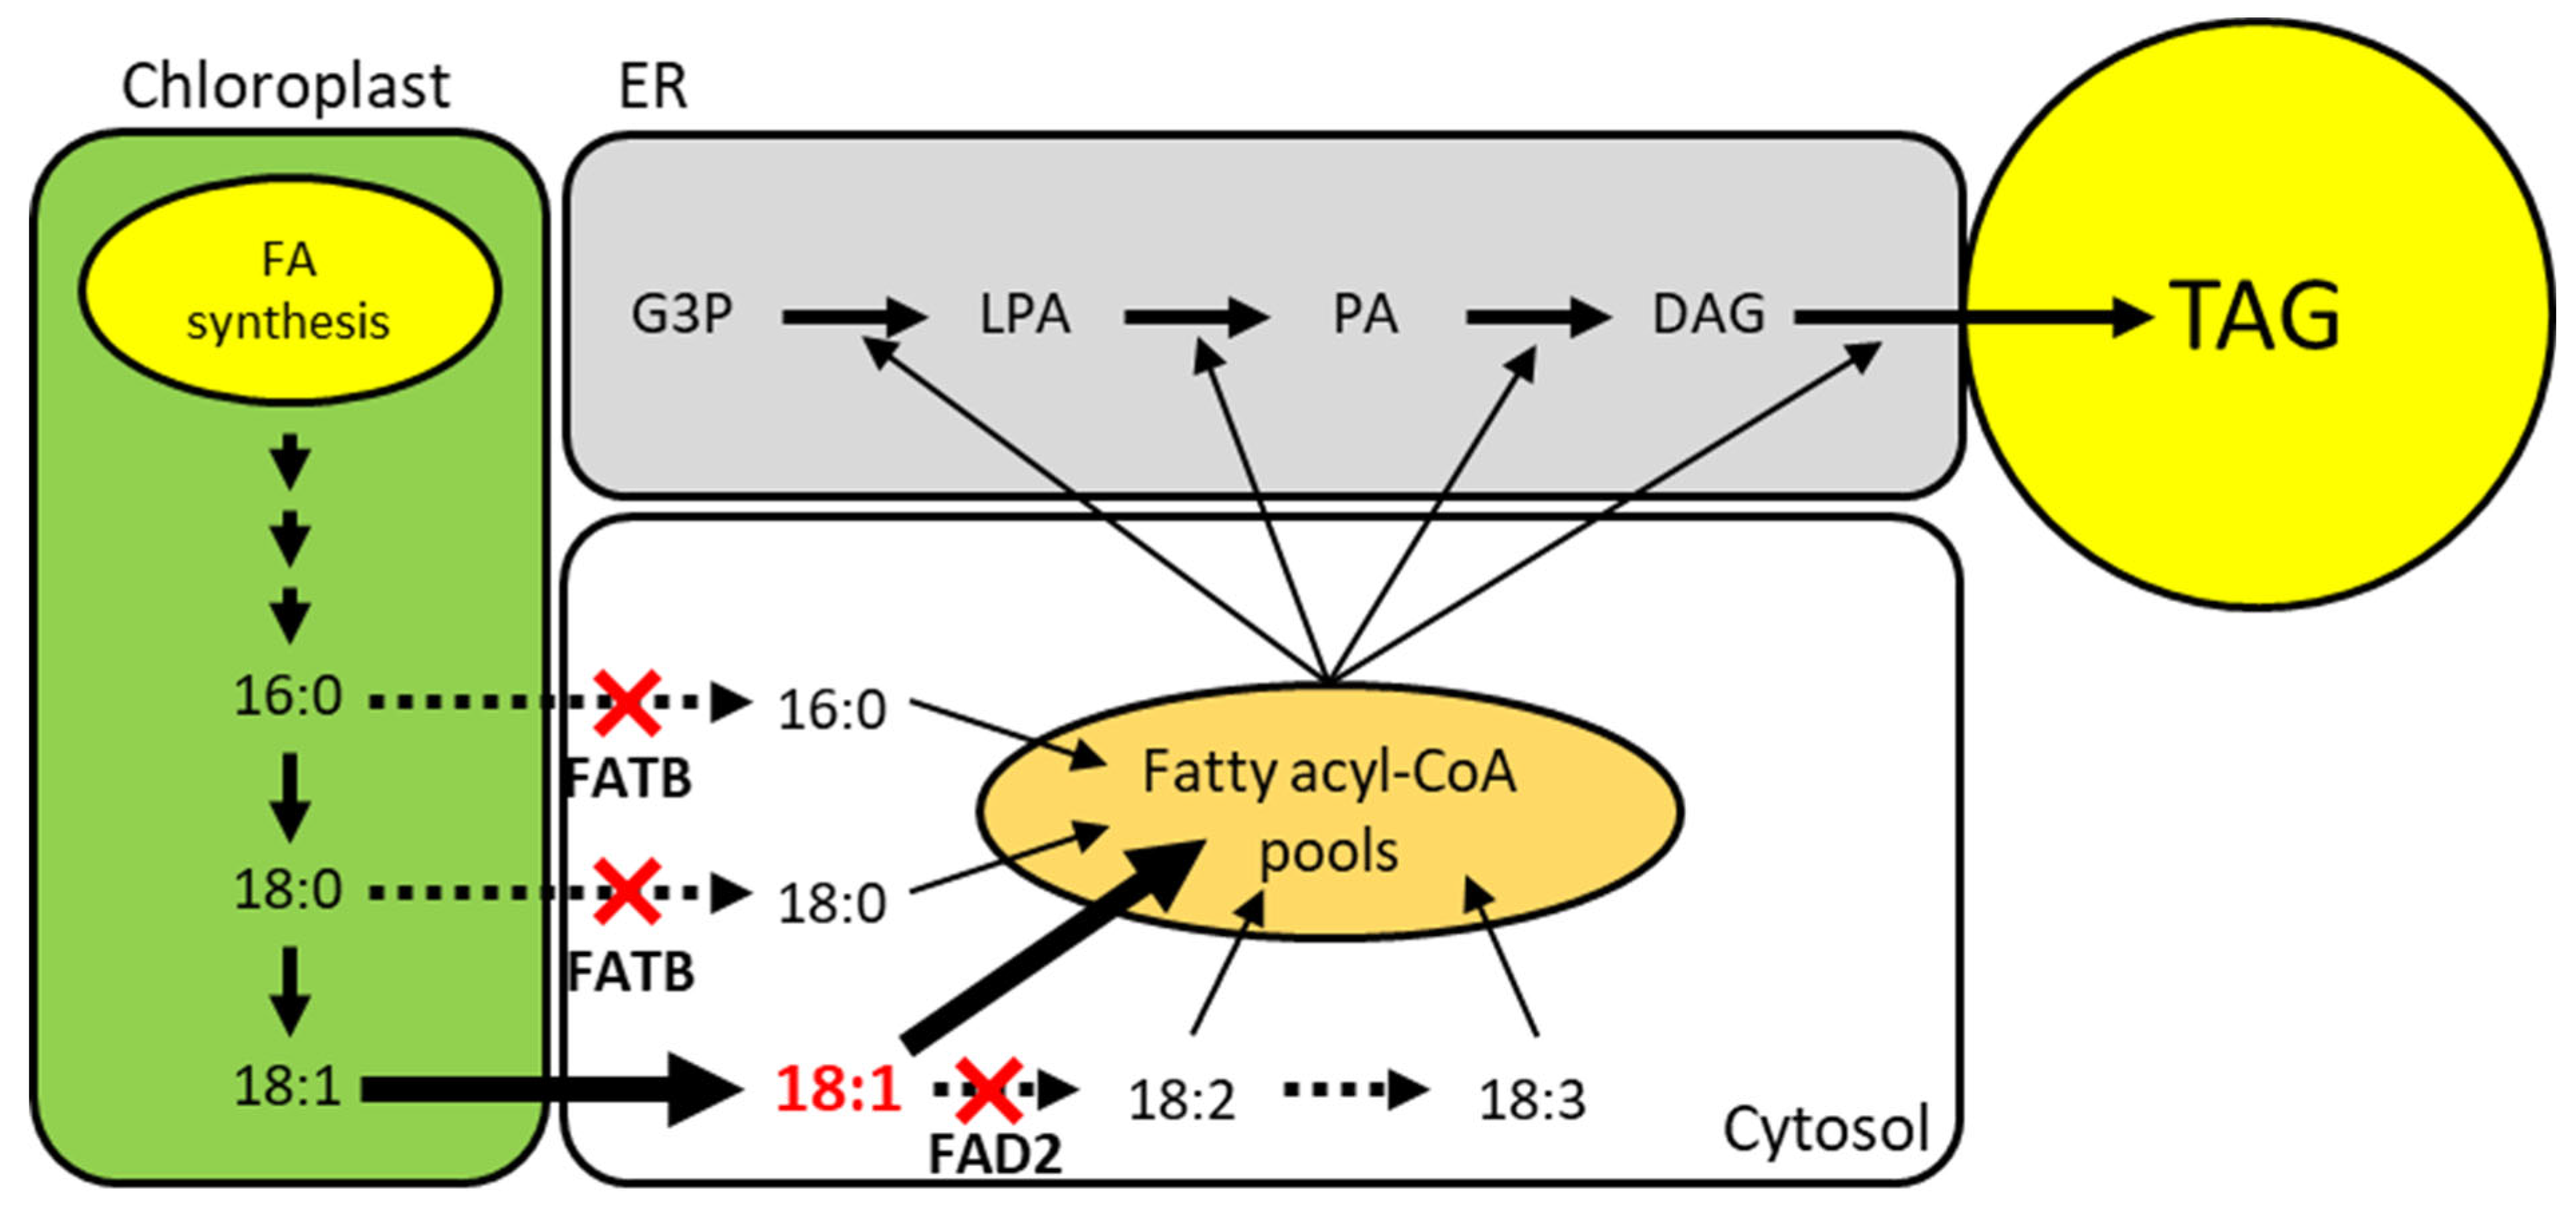
Figure 5.
Schematic pathway of plant TAG biosynthesis and strategy to increase oleic acid and decrease saturated fatty acids. FAD2 and FATB knockout are indicated by red cross. Expected flux of fatty acid is depicted with arrows. The amount of flux is indicated by the thickness or type of the arrow. G3P; Glycerol-3-Phosphate, LPA; Lysophosphatidic Acid, PA; Phosphatidic Acid, DAG; Diacylglycerol, TAG; Triacylglycerol.
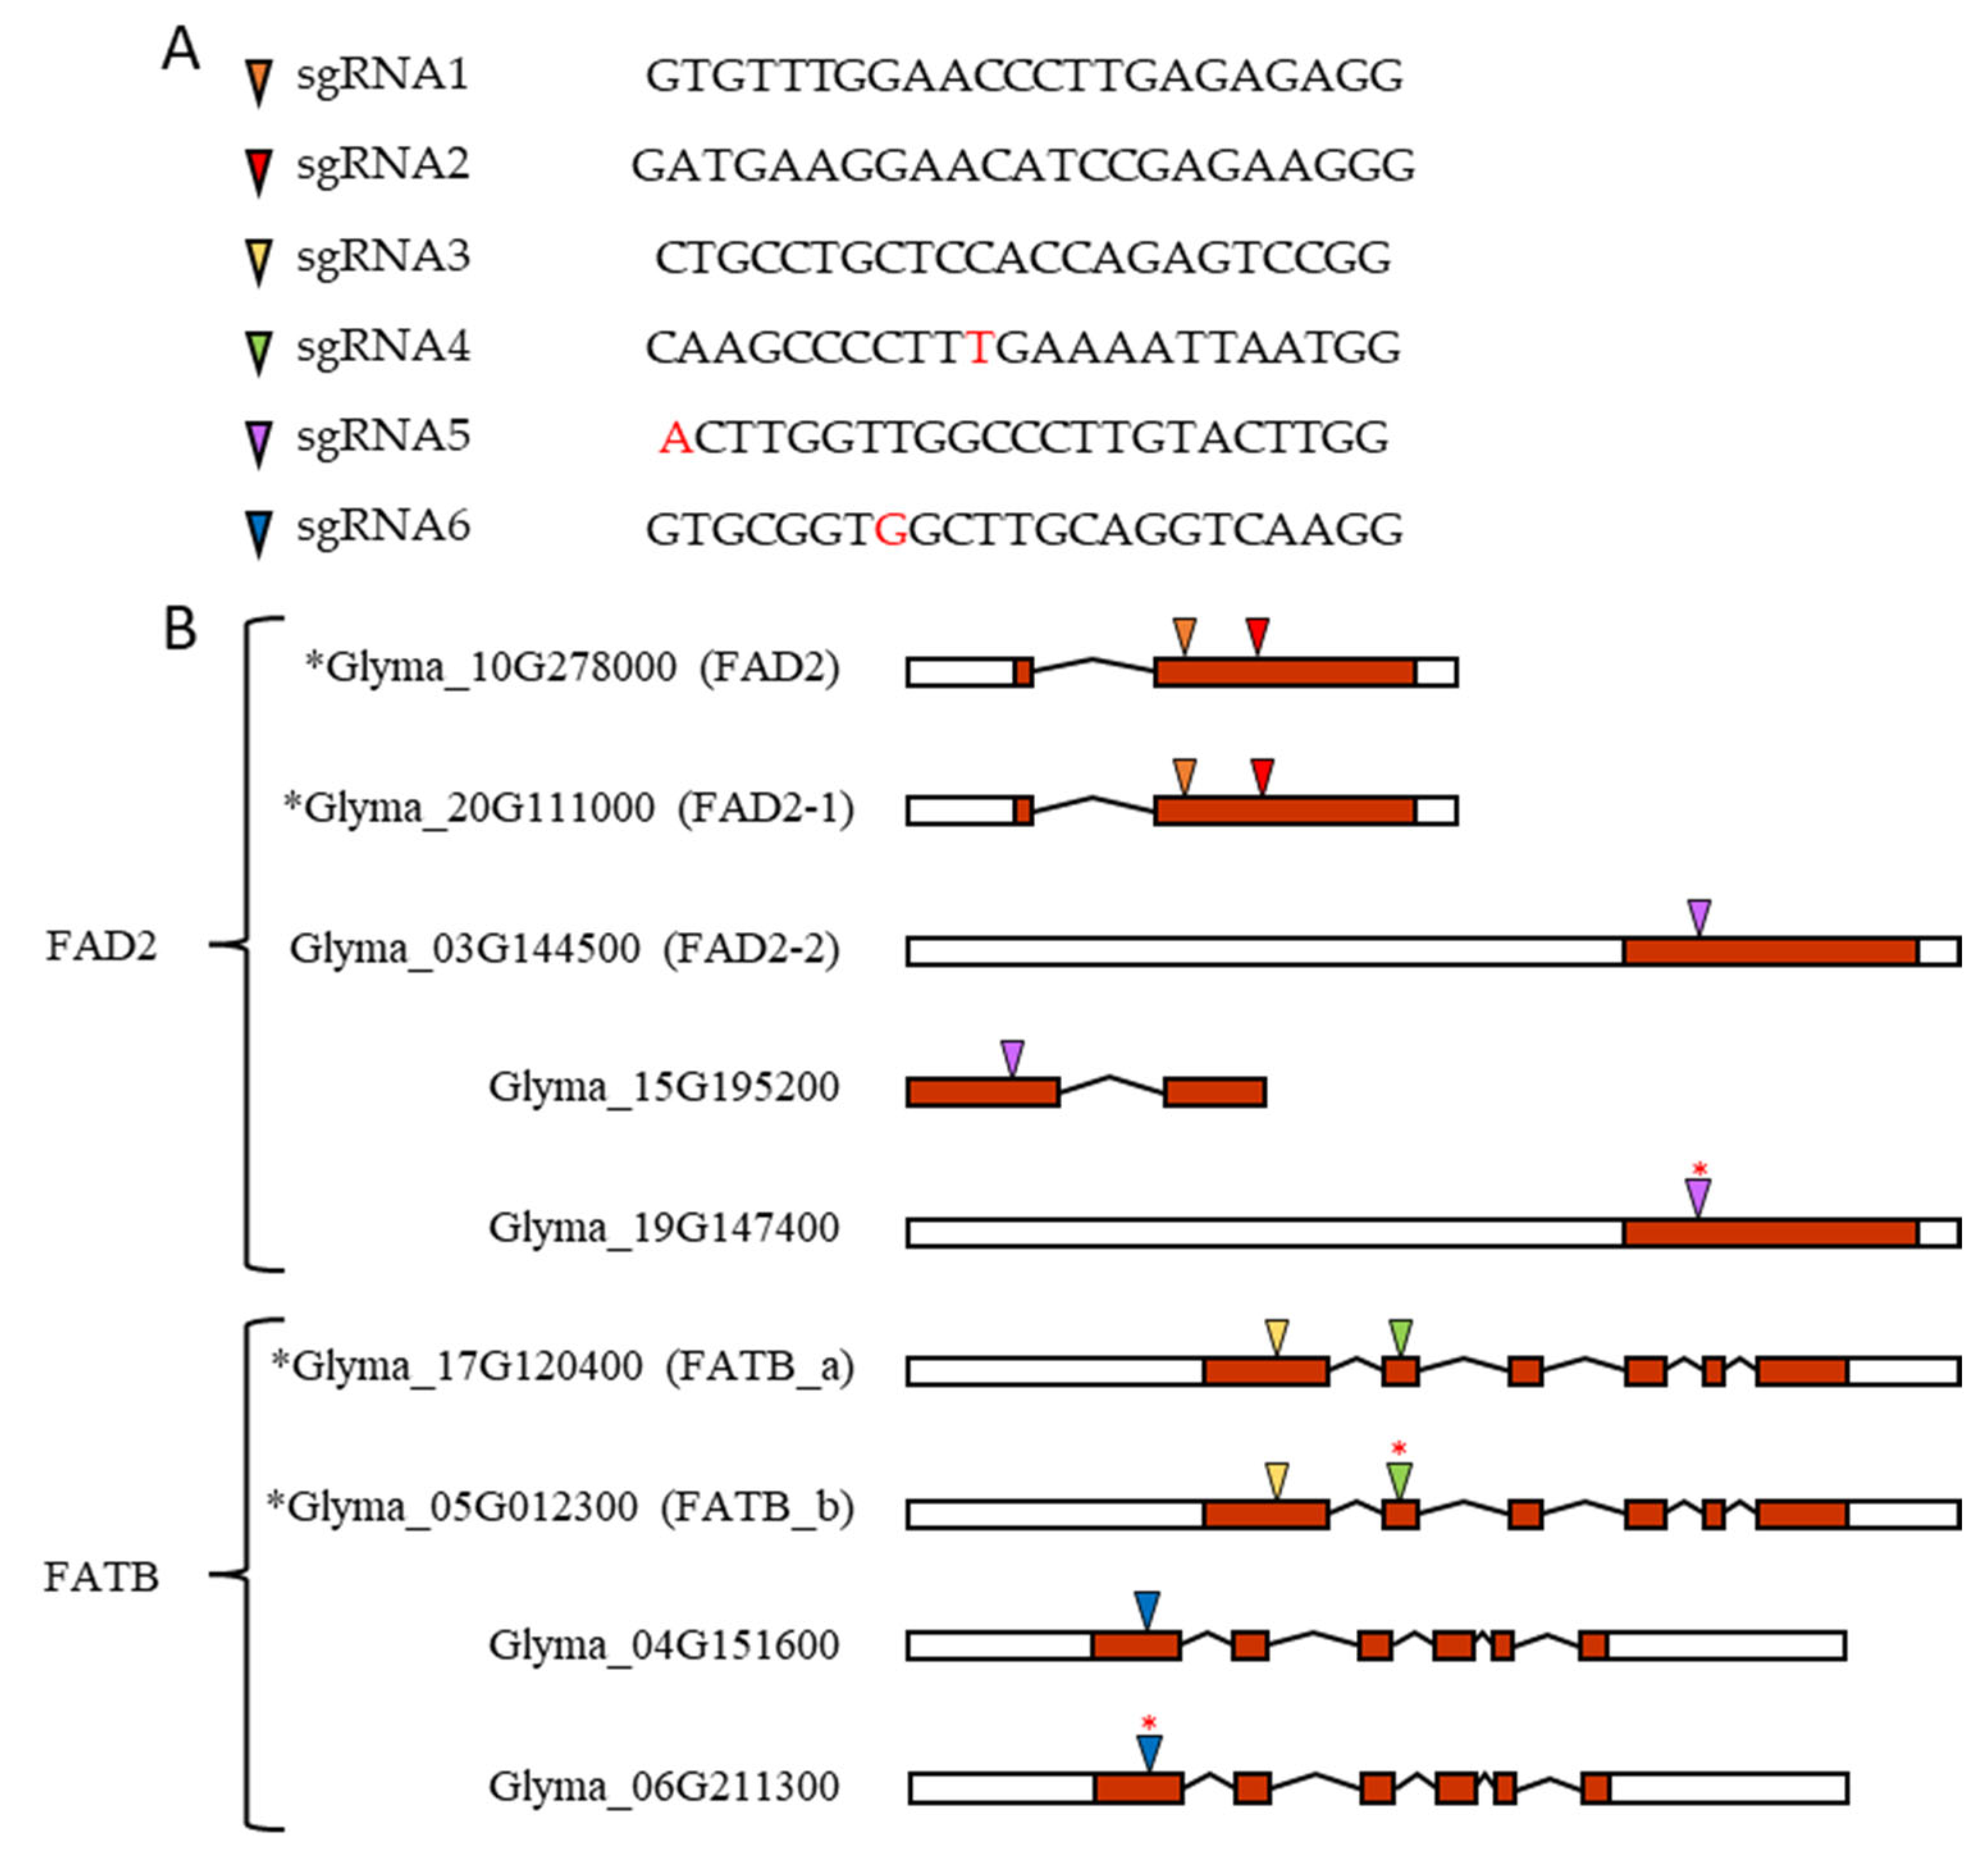
Figure 6.
FAD2 and
FATB candidate genes in soybean and its sgRNA sequence and target location. (
A) sgRNAs and their sequence. (
B) Based on transcript form, left white box for 5′ end UTR, right white box for 3′ end UTR, red box for exon, angled line for intron splicing, and colored triangle for sgRNA target sites. Black asterisk in front of gene accession number indicates major expressing genes. Red asterisk on colored triangle indicates one base pair mismatch between gDNA sequence and sgRNA sequence. This mismatch is also indicated in red letters in the sgRNA4, sgRNA5, and sgRNA6 sequences in
Figure 7A.
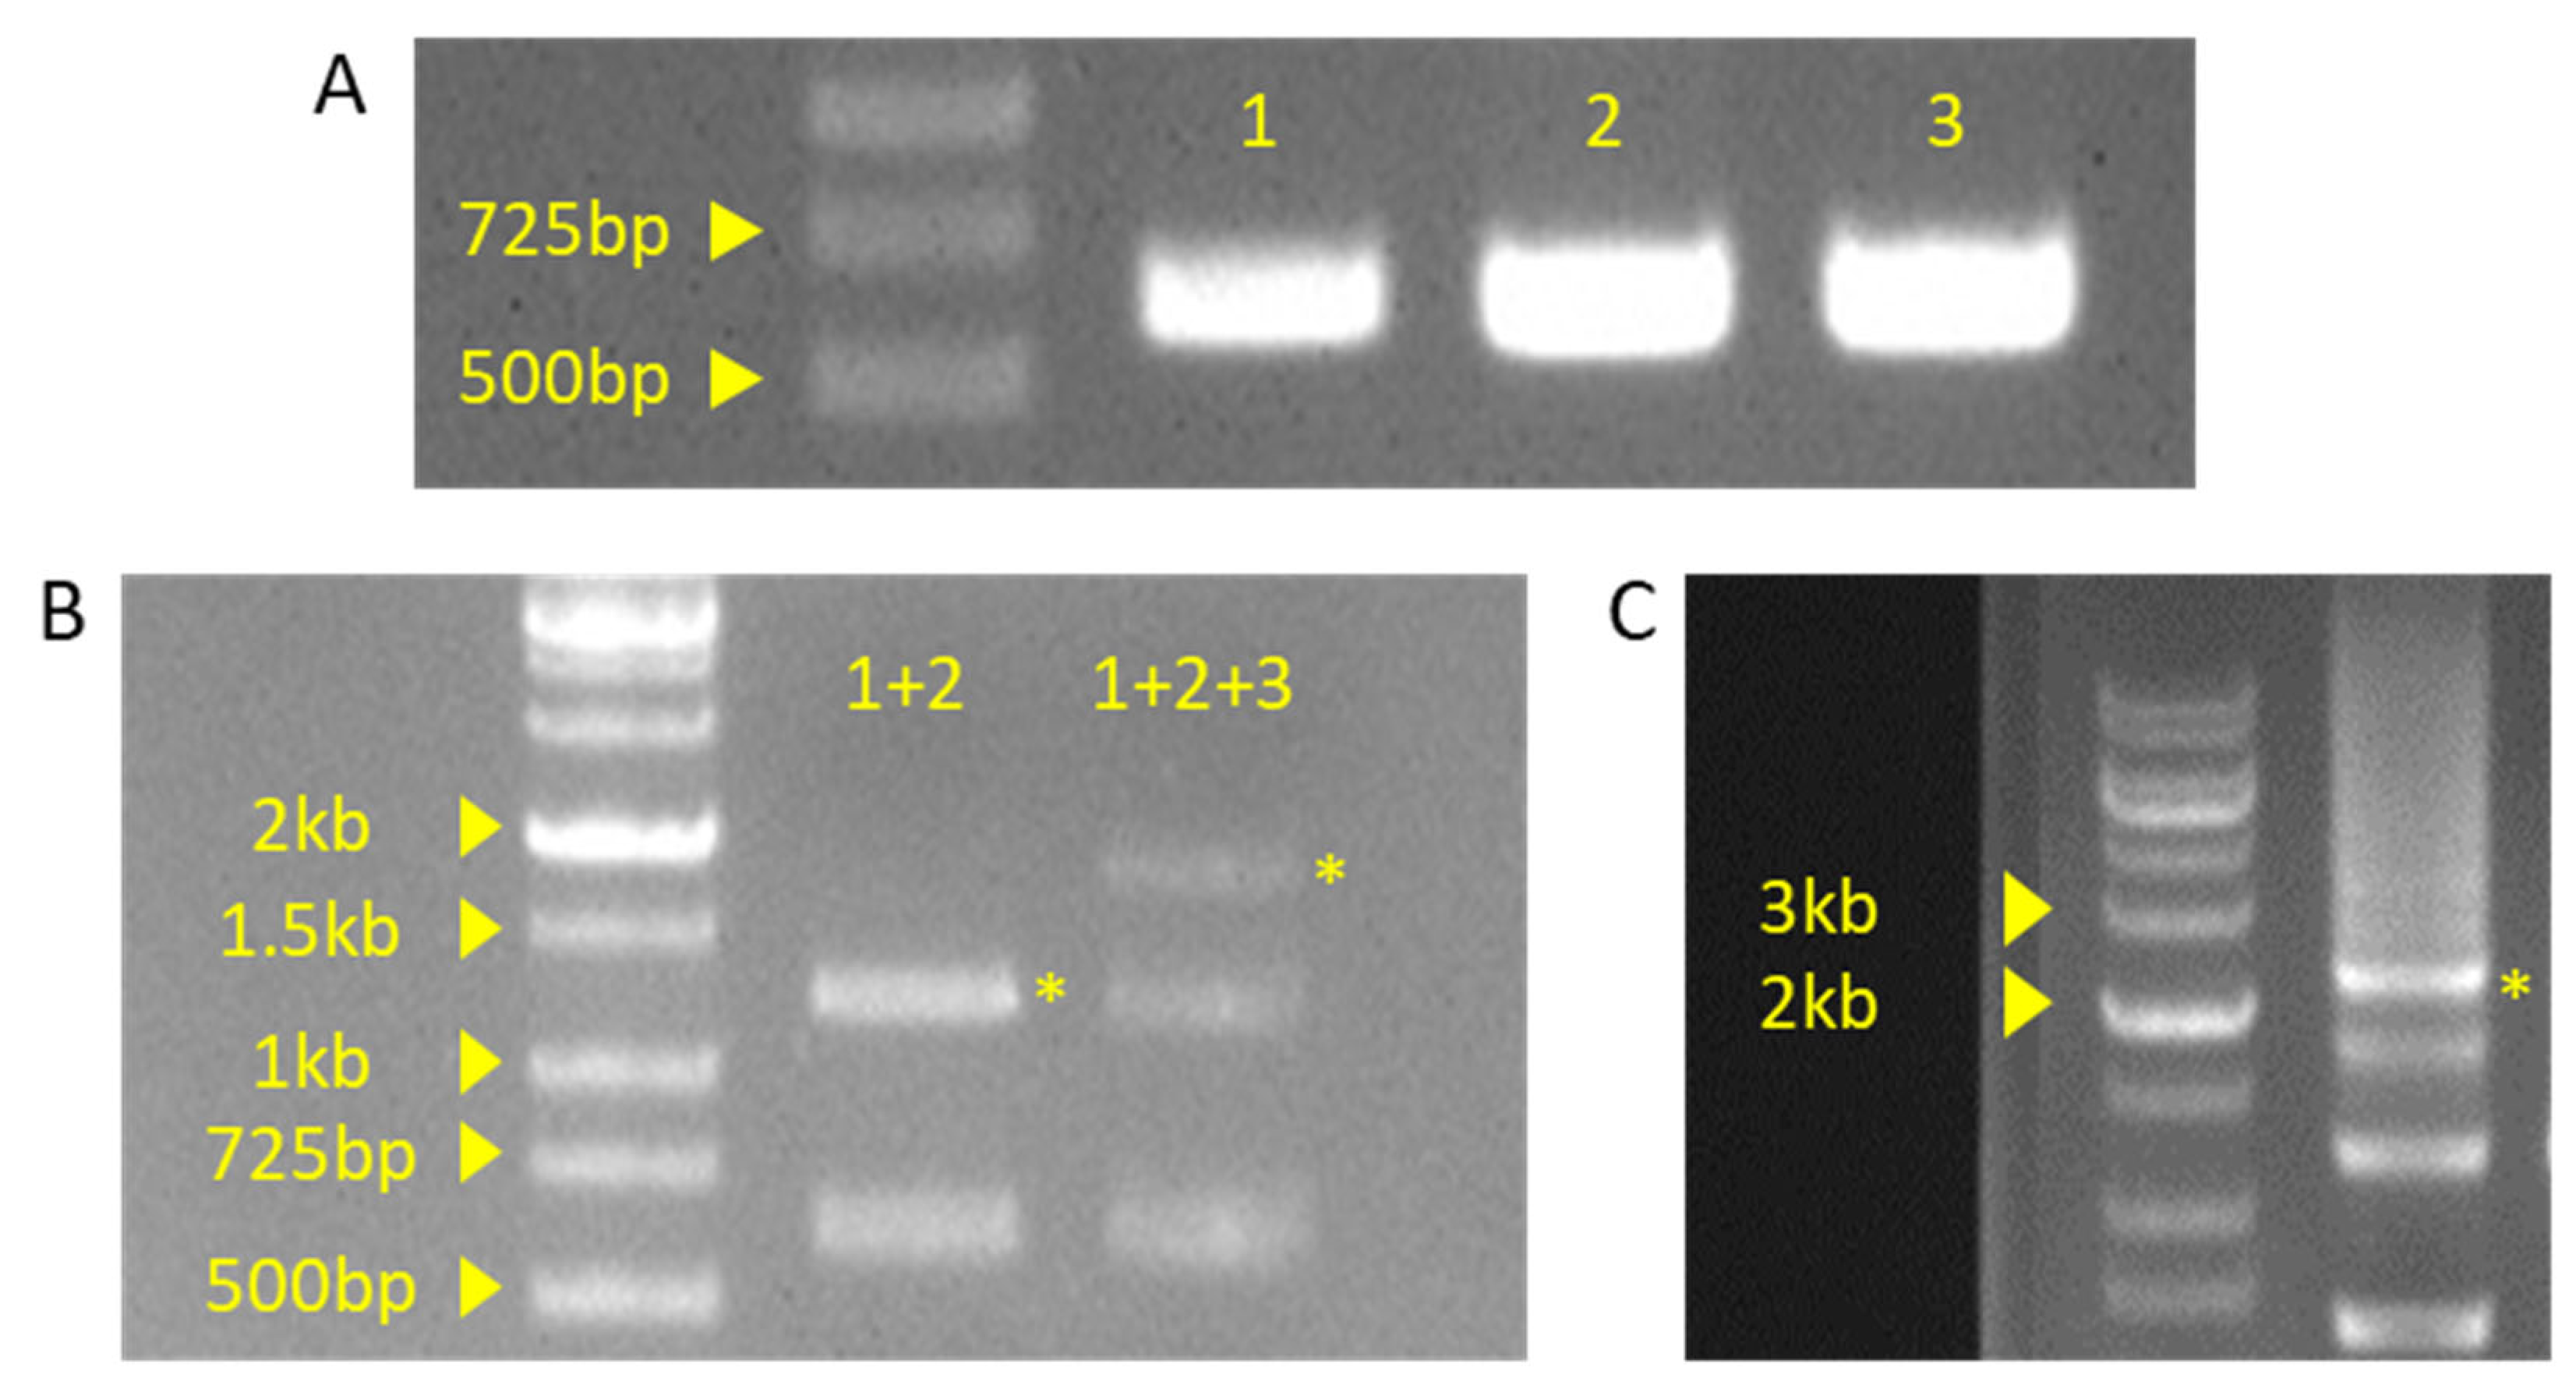
Figure 7.
Gel picture of PCR or ligation products. (A) PCR product of insert fragment. Each fragment numbers indicate sequential order. 1: DT1 and DT2 primer set used fragment, 2: DT3 primer set used fragment, 3: DT4 primer set used fragment. (B) Product of Golden Gate reaction. +indicate ligation of insert fragment. (C) Product of pHEE401E vector colony PCR. Yellow asterisk indicated by the expected band is the expected result.
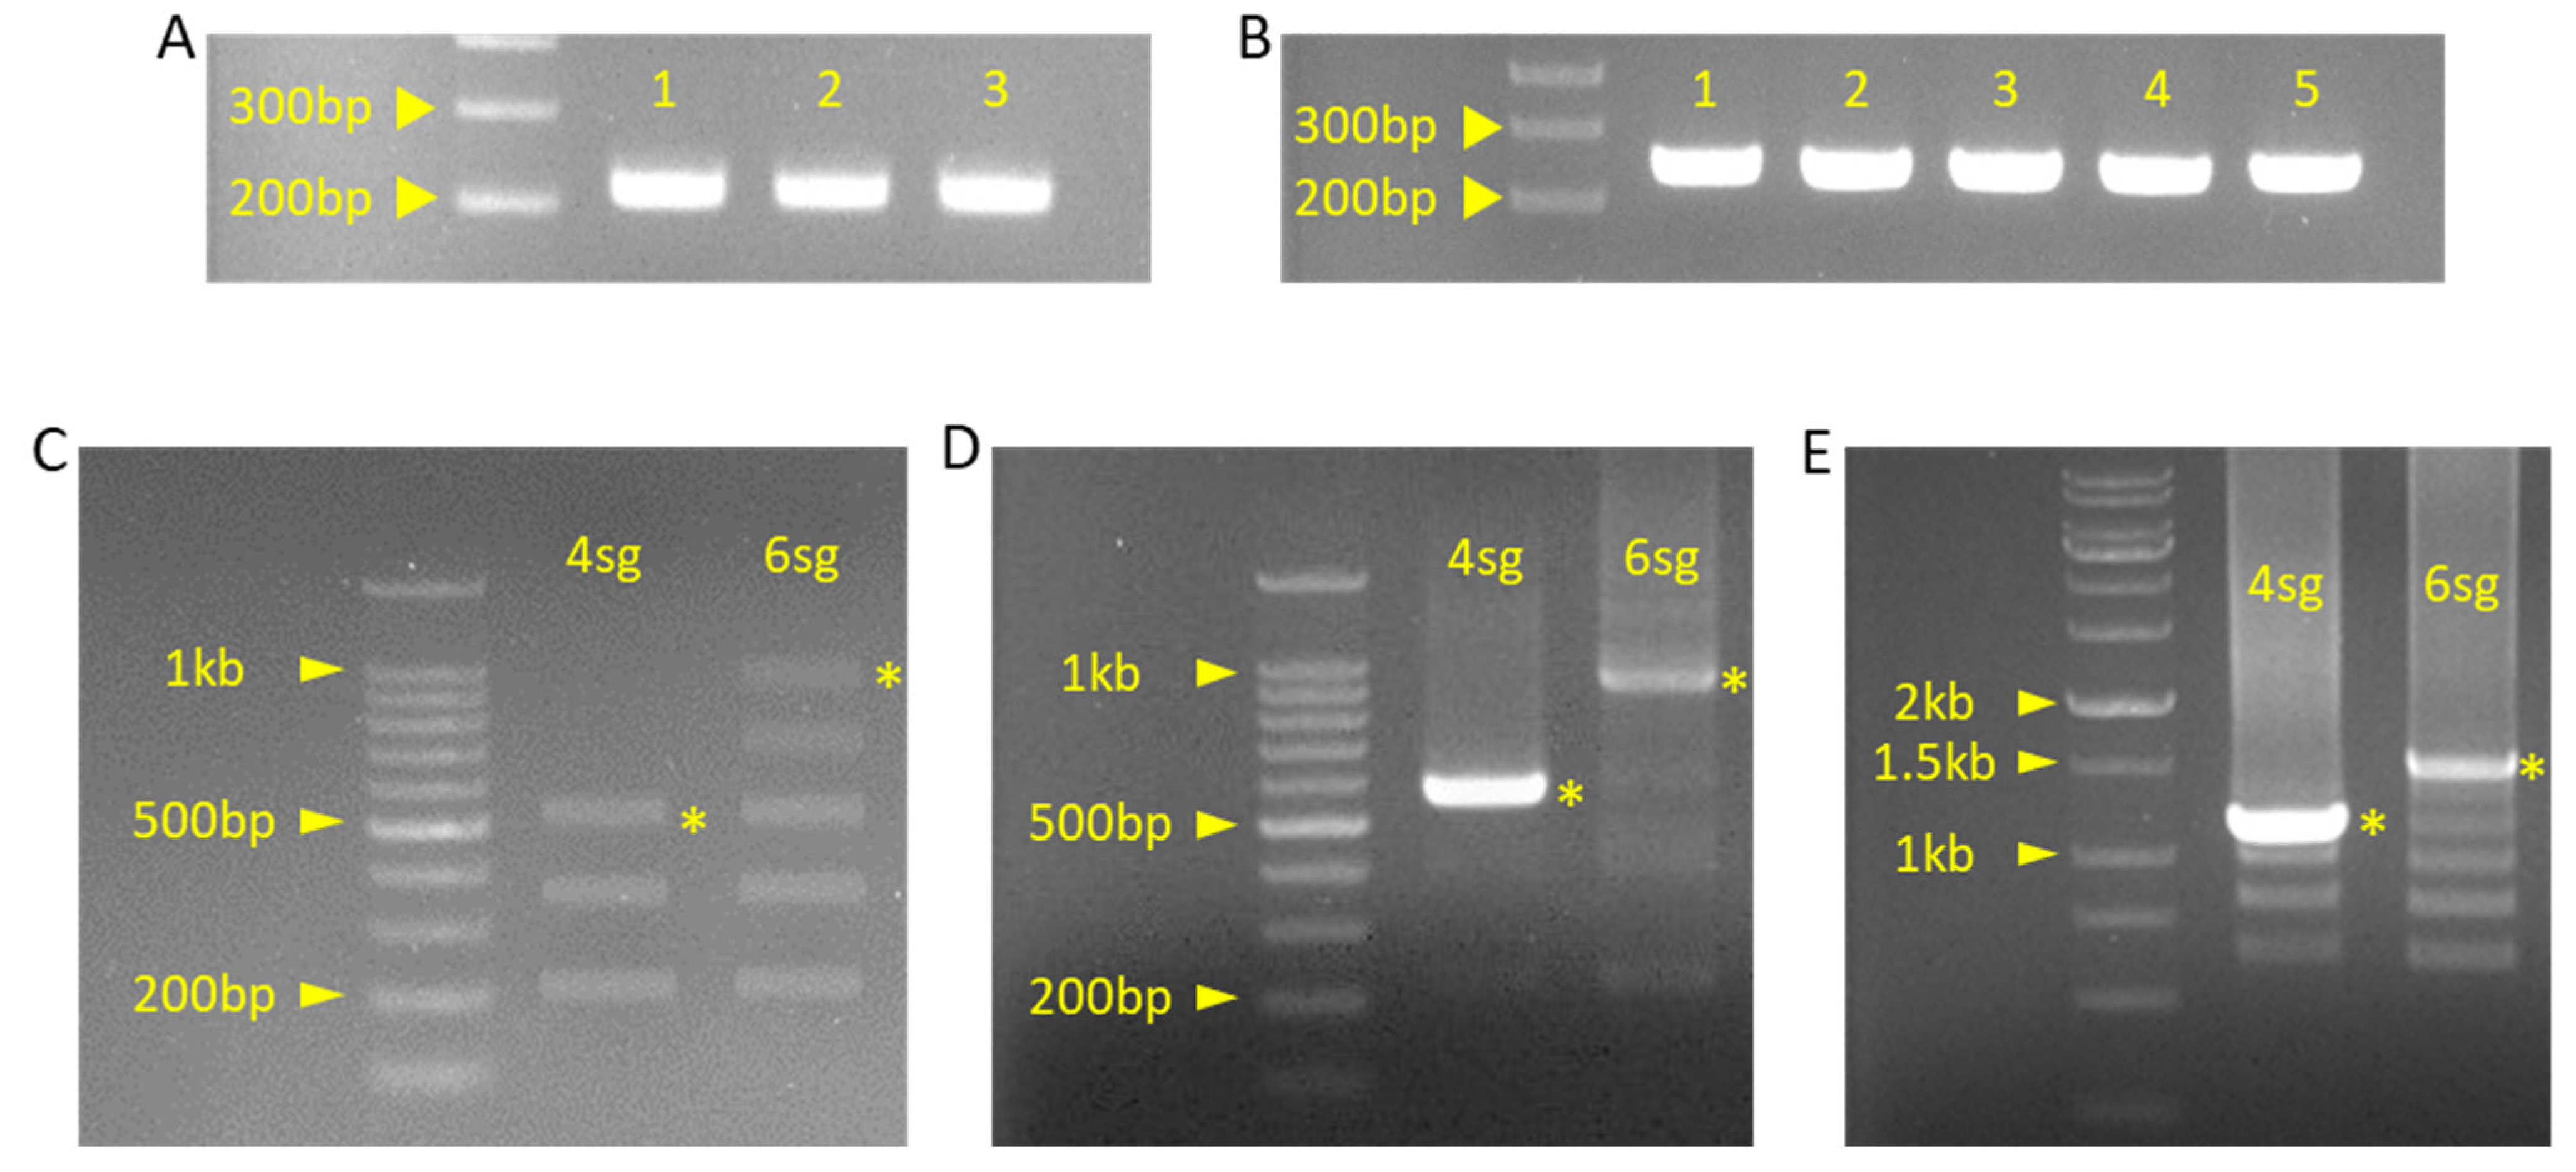
Figure 8.
Gel picture of PCR or ligation products. (A) Product of insert fragment PCR for pBAtC_4sg construction. Each fragment number indicates a sequential order. 1: ‘g1g2’ primer set used fragment, 2: ‘g2g3’ primer set used fragment, 3: ‘g3g4’ primer set used fragment. (B) Product of insert fragment PCR for pBAtC_6sg construction. Each fragment number indicates sequential order. 1: ‘g1g2’ primer set used fragment, 2: ‘g2g3’ primer set used fragment, 3: ‘g3g4’ primer set used fragment, 4: ‘g4g5’ primer set used fragment, 5: ‘g5g6’ primer set used fragment. (C) Product of ligated insert fragment by Golden Gate reaction. (D) Product of ligated insert PCR of pBAtC_4sg and pBAtC_6sg. (E) Product of pBAtC_4sg, 6sg colony PCR. Yellow asterisk indicated by the expected band is the expected result.
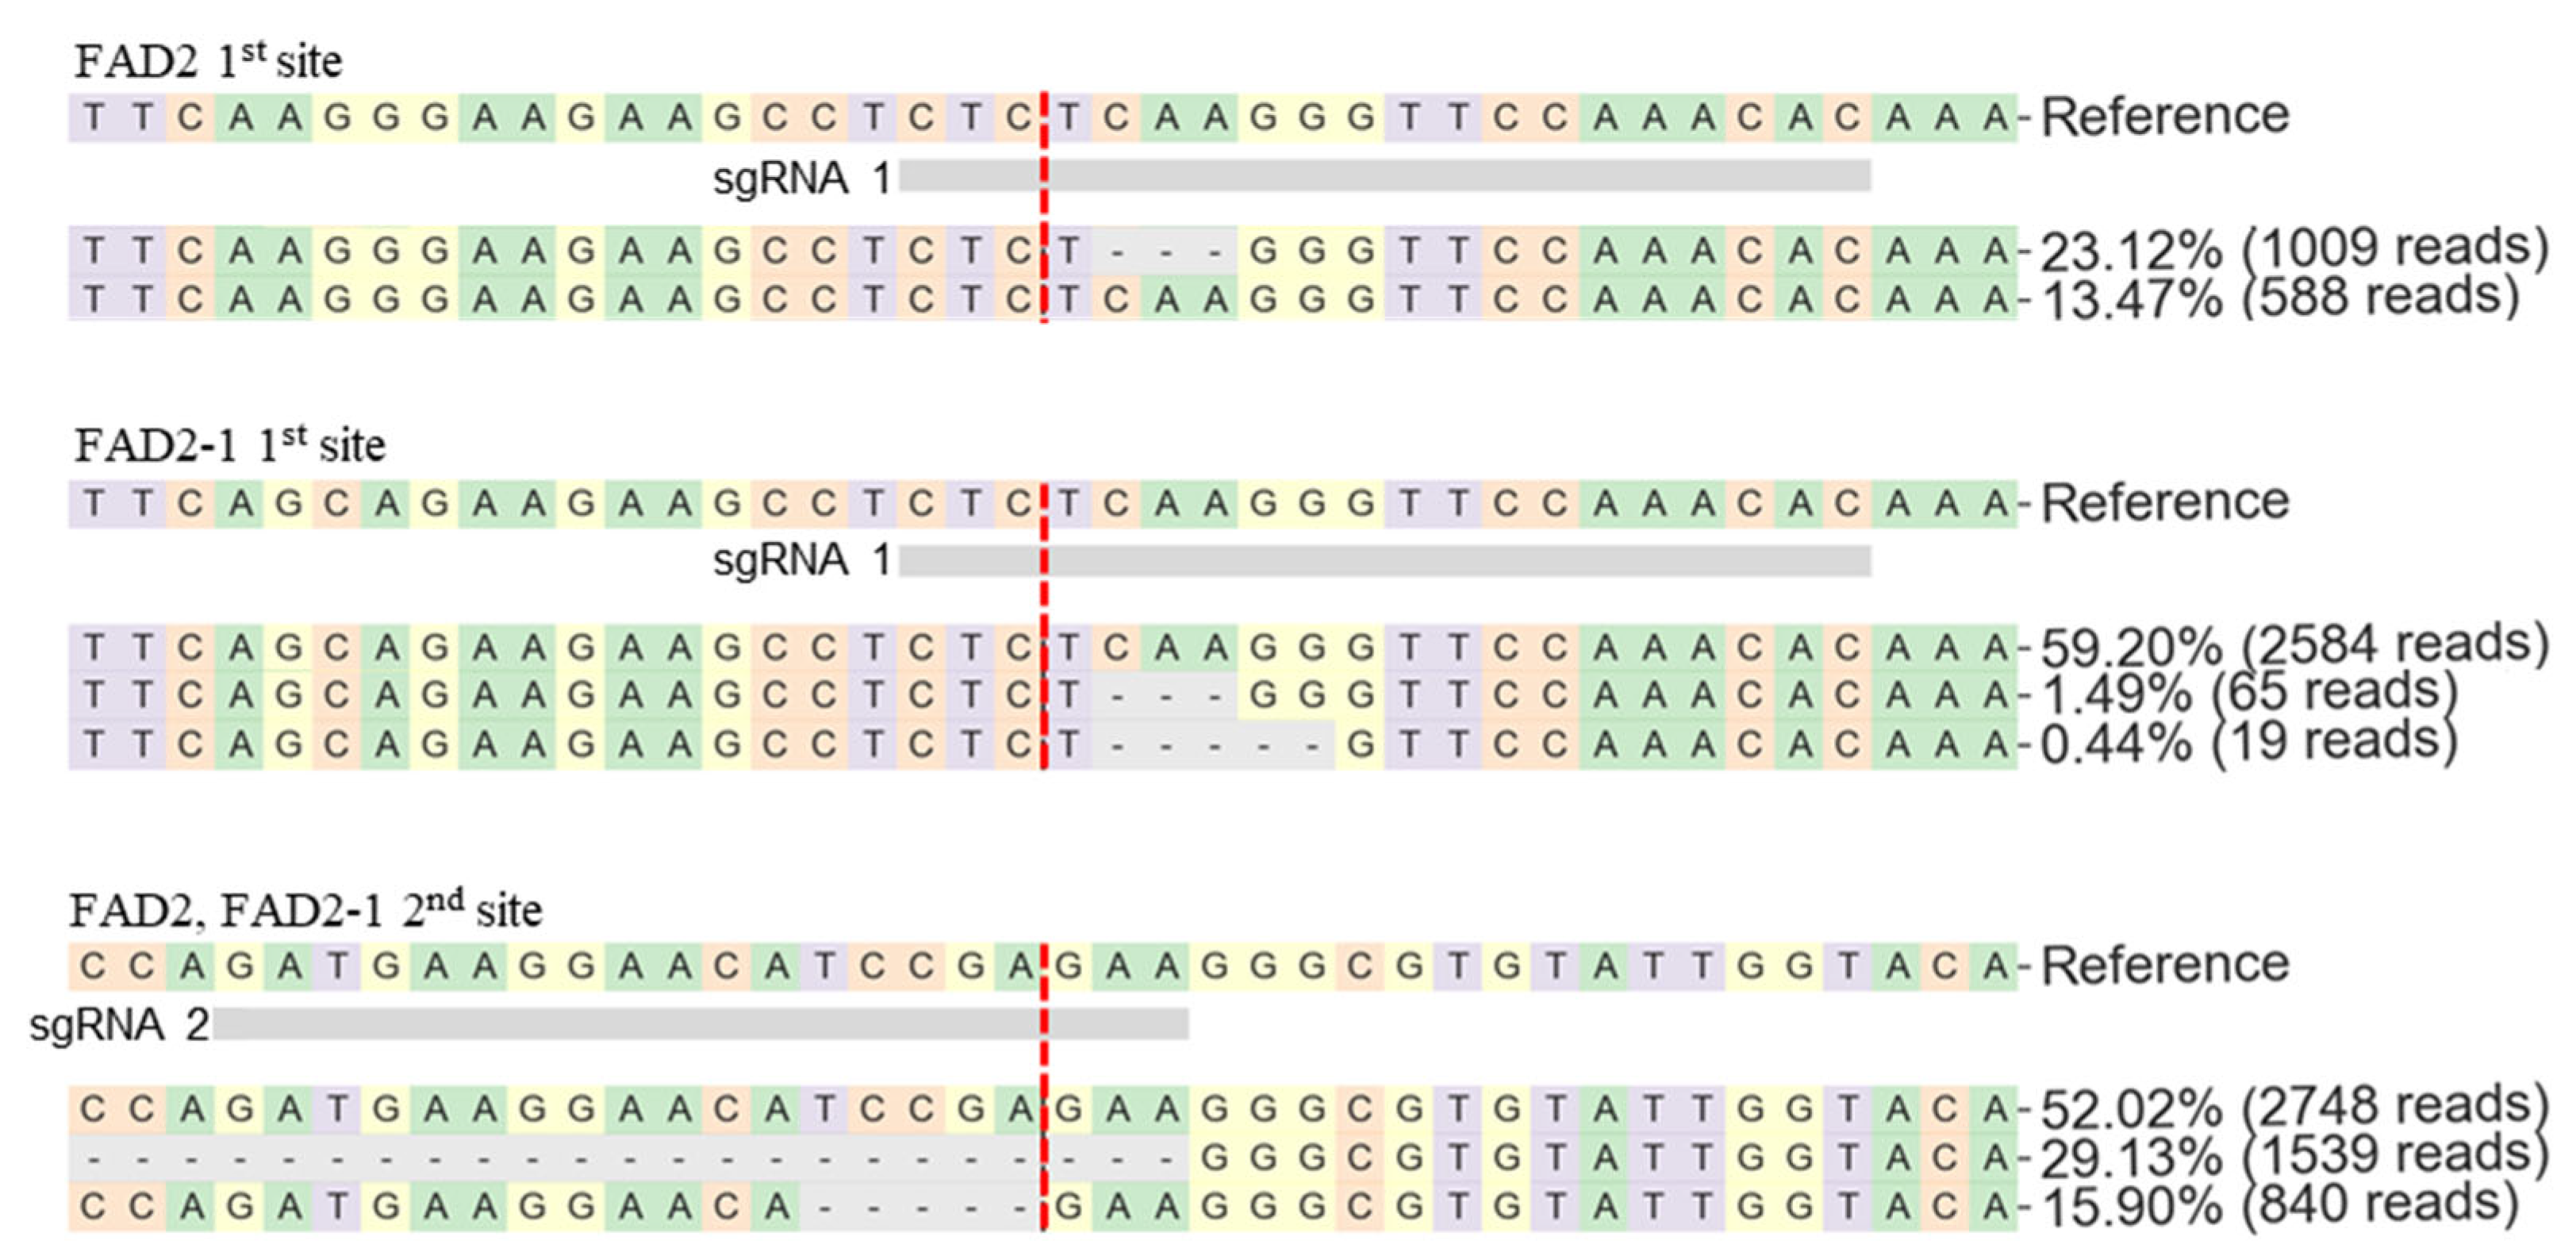
Figure 9.
Target sequence alignment of pHEE401E_4sg-10 FAD2 and FAD2-1. Vertical red dash indicates predicted cleavage site.
Figure 9.
Target sequence alignment of pHEE401E_4sg-10 FAD2 and FAD2-1. Vertical red dash indicates predicted cleavage site.
Table 1.
List of primers and sequences for the pHEE401E_UBQ_Bar vector.
Table 1.
List of primers and sequences for the pHEE401E_UBQ_Bar vector.
| Insert Name | Sequence |
|---|
| DT1-BsF | ATATATGGTCTCGATT(--sg1--)GTT |
| DT1-F | T(--sg1--)GTTTTAGAGCTAGAAATAGC |
| DT2-R | AAC(--sg2--)AATCTCTTAGTCGACTCTAC |
| DT2-BbR | ATTATTGAAGACNNAAAC(--sg2--)AA |
| DTsc_BbF | ATATATGAAGACNNGTTTTAGAGCTAGAAATAGCAAGTTAA |
| DT3-R | AAC(--sg3--)AATCTCTTAGTCGACTCTAC |
| DT3-AaR | ATTATTCACCTGCNNNNAAAC(--sg3--)AA |
| DTsc-AaF | ATATATCACCTGCNNNNGTTTTAGAGCTAGAAATAGCAAGTTAA |
| DT4-R | AAC(--sg4--)AATCTCTTAGTCGACTCTAC |
| DT4-BsR | ATTATTGGTCTCGAAAC(--sg4--)AA |
Table 2.
List of primers and sequences for the pBAtC_4sg insert.
Table 2.
List of primers and sequences for the pBAtC_4sg insert.
| Insert Name | Sequence |
|---|
| Bb_g1g2_F1 | (--sg1--)GTTTTAGAGCTAGAA |
| Bb_g1g2_F2 | ATGAAGACNNTGCA(--sg1--) |
| Aa_g1g2_R | ATCACCTGCNNNN(--half of sg2, 5′ moiety--)TGCACCAGCCGGGAA |
| Aa_g2g3_F | ATCACCTGCNNNN(--half of sg2, 3′ moiety--)GTTTTAGAGCTAGAAATAGC |
| Aa_g2g3_R | ATCACCTGCNNNN(--half of sg3, 5′ moiety--)TGCACCAGCCGGGAATCGAA |
| Aa_g3g4_F | ATCACCTGCNNNN(--half of sg3, 3′ moiety--)GTTTTAGAGCTAGAA |
| Bb_g3g4_R1 | (--sg4--)TGCACCAGCCGGGAATCGAA |
| Bb_g3g4_R2 | ATGAAGACNNAAAC(--sg4--) |
Table 3.
List of primers and sequences for the pBAtC_6sg insert.
Table 3.
List of primers and sequences for the pBAtC_6sg insert.
| Insert Name | Sequence |
|---|
| Aa_g3g4_F | ATCACCTGCNNNN(--half of sg3, 5′ moiety--)GTTTTAGAGCTAGAA |
| Aa_g3g4_R | ATCACCTGCNNNN(--half of sg4, 5′ moiety--)TGCACCAGCCGGGAATCGAA |
| Aa_g4g5_F | ATCACCTGCNNNN(--half of sg4, 5′ moiety--)GTTTTAGAGCTAGAA |
| Aa_g4g5_R | ATCACCTGCNNNN(--half of sg5, 5′ moiety--)TGCACCAGCCGGGAATCGAA |
| Aa_g5g6_F | ATCACCTGCNNNN(--half of sg2, 5′ moiety--)GTTTTAGAGCTAGAA |
| Bb_g5g6_R1 | (--sg6--)TGCACCAGCCGGGAA |
| Bb_g5g6_R2 | ATGAAGACNNAAAC(--sg6--) |
Table 4.
PCR components and thermal conditions for the first insert.
Table 4.
PCR components and thermal conditions for the first insert.
| Item | Concentration | Amount | Temperature | Time | Cycle |
|---|
| pCBC_DT1T2 | | (5 ng) | 94 °C | 2 min | 1 |
| DT1-BsF1 * | 20 μM | 1 μL | 94 °C | 15 s | 30 |
| DT1-F1 * | 1 μM | 1 μL | 60 °C | 20 s |
| DT2-R1 * | 1 μM | 1 μL | 68 °C | 20 s |
| DT2-BbR1 * | 20 μM | 1 μL | 68 °C | 2.5 min | 1 |
| 10X KOD Buffer | | 5 μL | 4 °C | Hold | 1 |
| dNTP | 2 mM | 4 μL | | | |
| MgSO4 | 25 mM | 3 μL | | | |
| KOD-Plus- | 1 U/μL | 1 μL | | | |
| Distilled Water | | to 50 μL | | | |
Table 5.
Golden Gate reaction components and thermal conditions.
Table 5.
Golden Gate reaction components and thermal conditions.
| Item | Concentration | Amount | Temperature | Time |
|---|
| Insert 1 | | (300 ng) | 37 °C | 5 h |
| Insert 2 | | (300 ng) | 50 °C | 5 min |
| 10X T4 ligase Buffer | | 1.5 μL | 80 °C | 10 min |
| BbsI | 10 U/μL | 1 μL | 8 °C | Hold |
| T4 Ligase | 350 U/μL | 1 μL | | |
| Distilled Water | | to 15 μL | | |
Table 6.
Golden Gate reaction components and thermal conditions.
Table 6.
Golden Gate reaction components and thermal conditions.
| Item | Concentration | Amount | Temperature | Time |
|---|
| First golden gate product | | 7 μL | 37 °C | 5 h |
| Insert 3 | | (300 ng) | 50 °C | 5 min |
| 50X oligonucleotide * | 0.5 μM | 0.5 μL | 80 °C | 10 min |
| 10X T4 Ligase Buffer | | 2.5 μL | 8 °C | Hold |
| AarI | 2 U/μL | 1 μL | | |
| T4 Ligase | 350 U/μL | 1 μL | | |
| Distilled Water | | to 25 μL | | |
Table 7.
Golden Gate reaction components and thermal conditions.
Table 7.
Golden Gate reaction components and thermal conditions.
| Item | Concentration | Amount | Temperature | Time |
|---|
| Insert polymer | | (200 ng) | 37 °C | 5 h |
| pHEE401E vector | | (100 ng) | 50 °C | 5 min |
| 10X T4 Ligase Buffer | | 1.5 μL | 80 °C | 10 min |
| BasI | 20 U/μL | 1 μL | 8 °C | Hold |
| T4 Ligase | 350 U/μL | 1 μL | | |
| Distilled Water | | to 15 μL | | |
Table 8.
PCR components and thermal conditions for the first insert.
Table 8.
PCR components and thermal conditions for the first insert.
| Item | Concentration | Amount | Temperature | Time | Cycle |
|---|
| Colony | | (5 ng) | 95 °C | 5 min | 1 |
| U6-26P_F * | 10 μM | 1 μL | 95 °C | 30 s | 30 |
| UBQ10_R ** | 10 μM | 1 μL | 55 °C | 30 s |
| 10X Buffer | | 2 μL | 72 °C | 2.5 kb *** |
| dNTP | 2.5 mM | 1.6 μL | 72 °C | 5 min | 1 |
| DNA polymerase | 5 U/μL | 0.1 μL | 8 °C | Hold | 1 |
| Distilled Water | | to 20 μL | | | |
Table 9.
PCR components and thermal conditions for the first insert.
Table 9.
PCR components and thermal conditions for the first insert.
| Item | Concentration | Amount | Temperature | Time | Cycle |
|---|
| pTV00 | | (5 ng) | 94 °C | 2 min | 1 |
| Bb_g1g2_F1 * | 10 μM | 2 μL | 94 °C | 15 s | 30 |
| Bb_g1g2_F2 * | 1 μM | 1 μL | 60 °C | 20 s |
| Aa_g1g2_R * | 10 μM | 2.5 μL | 68 °C | 20 s |
| 10X KOD Buffer | | 5 μL | 68 °C | 2.5 min | 1 |
| dNTP | 2 mM | 4 μL | 4 °C | Hold | 1 |
| MgSO4 | 25 mM | 3 μL | | | |
| KOD -Plus- | 1 U/μL | 1 μL | | | |
| Distilled Water | | to 50 μL | | | |
Table 10.
Components of Golden Gate reaction and thermal conditions.
Table 10.
Components of Golden Gate reaction and thermal conditions.
| Item | Concentration | Amount | Temperature | Time | Cycle |
|---|
| Inserts * | | (100 ng) | 37 °C | 5 min | 40 |
| 50X oligonucleotide ** | 0.5 μM | 0.3 μL | 20 °C | 10 min |
| 10X T4 Ligase Buffer | | 1.5 μL | 20 °C | 1 h | 1 |
| AarI | 2 U/μL | 0.5 μL | 65 °C | 20 min | 1 |
| T4 Ligase | 350 U/μL | 1 μL | 8 °C | Hold | 1 |
| Distilled Water | | to 15 μL | | | |
Table 11.
Components of PCR and thermal conditions.
Table 11.
Components of PCR and thermal conditions.
| Item | Concentration | Amount | Temperature | Time | Cycle |
|---|
| GG template | 1/10 diluted | 1 μL | 94 °C | 2 min | 1 |
| Aa_g1g2_F2 | 10 μM | 2 μL | 94 °C | 15 s | 40 |
| Reverse primer * | 10 μM | 2 μL | 60 °C | 20 s |
| 10X KOD Buffer | | 5 μL | 68 °C | 1 min/kb ** |
| dNTP | 2 mM | 4 μL | 68 °C | 5 min | 1 |
| MgSO4 | 25 mM | 3 μL | 4 °C | Hold | 1 |
| KOD -Plus- | 1 U/μL | 1 μL | | | |
| Distilled Water | | to 50 μL | | | |
Table 12.
Components of insert polymer digestion and thermal conditions.
Table 12.
Components of insert polymer digestion and thermal conditions.
| Item | Concentration | Amount | Temperature | Time |
|---|
| PCR product | - * | 20–25 μL | 37 °C | 2 h |
| 10X BsbI Buffer | | 5 μL | 65 °C | 20 min |
| BbsI | 10 U/μL | 1 μL | 8 °C | Hold |
| Distilled Water | | to 50 μL | | |
Table 13.
Golden Gate reaction components and thermal conditions.
Table 13.
Golden Gate reaction components and thermal conditions.
| Item | Concentration | Amount | Temperature | Time | Cycle |
|---|
| Insert polymer | | (200 ng) | 37 °C | 5 min | 40 |
| pBAtC_tRNA | | (100 ng) | 20 °C | 10 min |
| 50X oligonucleotide | 0.5 μM | 0.3 μL | 20 °C | 1 h | 1 |
| 10X T4 Ligase Buffer | | 1.5 μL | 65 °C | 10 min | 1 |
| AarI | 1 U/μL | 1 μL | 8 °C | Hold | 1 |
| T4 Ligase | 350 U/μL | 1 μL | | | |
| Distilled Water | | to 15 μL | | | |
Table 14.
PCR components and thermal conditions.
Table 14.
PCR components and thermal conditions.
| Item | Concentration | Amount | Temperature | Time | Cycle |
|---|
| Colony | | (5 ng) | 95 °C | 5 min | 1 |
| U6-26P_F | 10 μM | 1 μL | 95 °C | 30 s | 30 |
| NosP_Rev * | 10 μM | 1 μL | 55 °C | 30 s |
| 10X Buffer | | 2 μL | 72 °C | See footer ** |
| dNTP | 2.5 mM | 1.6 μL | 72 °C | 5 min | 1 |
| DNA polymerase | 5 U/μL | 0.1 μL | 8 °C | Hold | 1 |
| Distilled Water | | to 20 μL | | | |
Table 15.
List of primers and sequences for the pHEE401E_4sg construction.
Table 15.
List of primers and sequences for the pHEE401E_4sg construction.
| Insert Name | Sequence |
|---|
| DT1-BsF | ATATATGGTCTCGATTGTGTTTGGAACCCTTGAGAGGTT |
| DT1-F | TGTGTTTGGAACCCTTGAGAGGTTTTAGAGCTAGAAATAGC |
| DT2-R | AACTTCTCGGATGTTCCTTCATCAATCTCTTAGTCGACTCTAC |
| DT2-BbR | ATTATTGAAGACATAAACTTCTCGGATGTTCCTTCATCAA |
| DTsc_BbF | ATATATGAAGACATGTTTTAGAGCTAGAAATAGCAAGTTAA |
| DT3-R | AACGACTCTGGTGGAGCAGGCACAATCTCTTAGTCGACTCTAC |
| DT3-AaR | ATTATTCACCTGCATATAAACGACTCTGGTGGAGCAGGCACAA |
| DTsc-AaF | ATATATCACCTGCATATGTTTTAGAGCTAGAAATAGCAAGTTAA |
| DT4-R | AACTTAATTTTCAAAGGGGCTTCAATCTCTTAGTCGACTCTAC |
| DT4-BsR | ATTATTGGTCTCGAAACTTAATTTTCAAAGGGGCTTCAA |
Table 16.
List of primers for pBAtC_4sg insert fragments.
Table 16.
List of primers for pBAtC_4sg insert fragments.
| Insert Name | Sequence |
|---|
| Bb_g1g2_F1 | GTGTTTGGAACCCTTGAGAGGTTTTAGAGCTAGAA |
| Bb_g1g2_F2 | ATGAAGACATTGCAGTGTTTGGAACCCTTGAGAG |
| Aa_g1g2_R | ATCACCTGCATATTGTTCCTTCATCTGCACCAGCCGGGAA |
| Aa_g2g3_F | ATCACCTGCATATAACATCCGAGAAGTTTTAGAGCTAGAAATAGC |
| Aa_g2g3_R | ATCACCTGCATATTGGAGCAGGCAGTGCACCAGCCGGGAATCGAA |
| Aa_g3g4_F | ATCACCTGCATATTCCACCAGAGTCGTTTTAGAGCTAGAA |
| Bb_g3g4_R1 | TTAATTTTCAAAGGGGCTTGTGCACCAGCCGGGAATCGAA |
| Bb_g3g4_R2 | ATGAAGACATAAACTTAATTTTCAAAGGGGCTTG |
Table 17.
Additional list of primers for pBAtC_6sg insert fragments.
Table 17.
Additional list of primers for pBAtC_6sg insert fragments.
| Insert Name | Sequence |
|---|
| Aa_g3g4_F ** | ATCACCTGCATATTCCA*CCAGAGTCGTTTTAGAGCTAGAA |
| Aa_g3g4_R ** | ATCACCTGCATATTCAA*AGGGGCTTGTGCACCAGCCGGGAATCGAA |
| Aa_g4g5_F | ATCACCTGCATATTTGA*AAATTAAGTTTTAGAGCTAGAA |
| Aa_g4g5_R | ATCACCTGCATATAGCC*ACCGCACTGCACCAGCCGGGAATCGAA |
| Aa_g5g6_F | ATCACCTGCATATGGCT*TGCAGGTCGTTTTAGAGCTAGAA |
| Bb_g5g6_R1 | AGTACAAGGGCCAACCAAGTTGCACCAGCCGGGAA |
| Bb_g5g6_R2 | ATGAAGACATAAACAGTACAAGGGCCAACCAAGT |
Table 18.
Indel ratio example of each of the three vector T0 transformants.
Table 18.
Indel ratio example of each of the three vector T0 transformants.
| Target Genes | FAD2-2 | 15G195200 | 19G147400 | FAD2 | FAD2-1 | FATB_a | FATB_b | 04G151600 | 06G211300 |
|---|
| | | | 1st Site | 2nd Site | 1st Site | 2nd Site | 1st Site | 2nd Site | 1st Site | 2nd Site | | |
|---|
| pHEE401E_4sg-10 | - | - | - | 66.4 | 91.9 | 5.4 | 0.4 | 74 | 5.6 | 71.4 | 44.6 | - | - |
| pBAtC_4sg-1 | - | - | - | 54 | 76.6 | 67.4 | 77.1 | 55.7 | 0.9 | 53.8 | 76.5 | - | - |
| pBAtC_6sg-5 | 56.5 | 25.7 | 80.1 | 71.8 | 69 | 45.6 | 60 | 23.5 | 0.2 | 20.3 | 3.1 | 41.4 | 59.1 |


