Next Issue
Volume 9, September
Previous Issue
Volume 9, July


ISPRS Int. J. Geo-Inf., Volume 9, Issue 8 (August 2020) – 28 articles

Cover Story (view full-size image): 
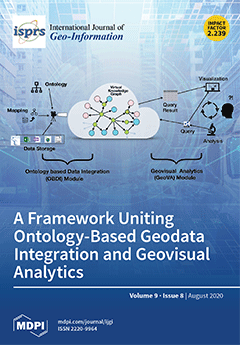
Getting insights into heterogeneous geodata sources is crucial for decision making, but often challenging, as it typically requires combining information from different sources via data integration techniques and then making sense out of the combined data via sophisticated analysis methods. To address this challenge, we propose a framework consisting of two modules centered around a virtual knowledge graph based on an ontology: (1) an ontology-based data integration (OBDI) module, in which mappings specify the relationship between underlying data and a domain ontology; and (2) a geovisual analytics (GeoVA) module, designed for the exploration of integrated data, by explicitly making use of standard ontologies. Initial studies show that our approach is feasible for the exploration and understanding of heterogeneous geospatial data. View this paper
  • Issues are regarded as officially published after their release is announced to the table of contents alert mailing list.
  • You may sign up for e-mail alerts to receive table of contents of newly released issues.
  • PDF is the official format for papers published in both, html and pdf forms. To view the papers in pdf format, click on the "PDF Full-text" link, and use the free Adobe Reader to open them.
Order results
Result details
Select all
Export citation of selected articles as:
18 pages, 4687 KiB  
Article
Development of a Novel Framework to Propose New Strategies for Automated External Defibrillators Deployment Targeting Residential Out-Of-Hospital Cardiac Arrests: Application to the City of Milan
by Gianquintieri Lorenzo, Brovelli Maria Antonia, Brambilla Piero Maria, Pagliosa Andrea, Villa Guido Francesco and Caiani Enrico Gianluca
ISPRS Int. J. Geo-Inf. 2020, 9(8), 491; https://doi.org/10.3390/ijgi9080491 - 17 Aug 2020
Cited by 3 | Viewed by 3045
Abstract
Public Access Defibrillation (PAD) is the leading strategy in reducing time to first defibrillation in cases of Out-Of-Hospital Cardiac Arrest (OHCA), but PAD programs are underperforming considering their potentiality. Our aim was to develop an analysis and optimization framework, exploiting georeferenced information processed [...] Read more.
Public Access Defibrillation (PAD) is the leading strategy in reducing time to first defibrillation in cases of Out-Of-Hospital Cardiac Arrest (OHCA), but PAD programs are underperforming considering their potentiality. Our aim was to develop an analysis and optimization framework, exploiting georeferenced information processed with Geographic Information Systems (GISs), specifically targeting residential OHCAs. The framework, based on an historical database of OHCAs, location of Automated External Defibrillators (AEDs), topographic and demographic information, proposes new strategies for AED deployment focusing on residential OHCAs, where performance assessment was evaluated using AEDs “catchment area” (area that can be reached within 6 min walk along streets). The proposed framework was applied to the city of Milan, Lombardy (Italy), considering the OHCA database of four years (2015–2018), including 8152 OHCA, of which 7179 (88.06%) occurred in residential locations. The proposed strategy for AEDs deployment resulted more effective compared to the existing distribution, with a significant improvement (from 41.77% to 73.33%) in OHCAs’ spatial coverage. Further improvements were simulated with different cost scenarios, resulting in more cost-efficient solutions. Results suggest that PAD programs, either in brand-new territories or in further improvements, could significantly benefit from a comprehensive planning, based on mathematical models for risk mapping and on geographical tools. Full article
(This article belongs to the Special Issue GIS in Healthcare)
Show Figures

Figure 1

23 pages, 14864 KiB  
Article
Graphic Simplification and Intelligent Adjustment Methods of Road Networks for Navigation with Reduced Precision
by Qingsheng Guo, Huihui Wang, Jie He, Chuanqi Zhou, Yang Liu, Bin Xing, Zhijie Jia and Meng Li
ISPRS Int. J. Geo-Inf. 2020, 9(8), 490; https://doi.org/10.3390/ijgi9080490 - 16 Aug 2020
Cited by 4 | Viewed by 2296
Abstract
With the rapid development of high-precision road network maps, low-precision road network maps (basic data unrelated to hardware) will need to be directly produced for traditional navigation software from high-precision maps. To do so, large amounts of vector data representing road networks must [...] Read more.
With the rapid development of high-precision road network maps, low-precision road network maps (basic data unrelated to hardware) will need to be directly produced for traditional navigation software from high-precision maps. To do so, large amounts of vector data representing road networks must be simplified and spatial directional similarity in road networks must be maintained while reducing precision. In this study, an elite strategy genetic algorithm based on the grid model is applied to spatial directional adjustment in road networks for producing road network maps for traditional navigation. Firstly, semantic features and critical vertices are extracted from the road network with high precision. Secondly, some high-precision vertices are eliminated under constraints of the digital navigation map. During this process, the local shape maintenance of the road is considered, and the destruction of the spatial topological relationships is avoided. Thirdly, a genetic algorithm for minimizing the total changes in road azimuths at nodes of road networks is developed to maintain spatial directional relationships while reducing precision. Experimental results and visualization effects on the test data of different cities show that this method is suitable for generating road network maps for traditional navigation software from high-precision ones. Full article
Show Figures

Figure 1

27 pages, 14454 KiB  
Article
Influence of Weights of Geographical Factors on the Results of Multicriteria Analysis in Solving Spatial Analyses
by Šárka Hošková-Mayerová, Václav Talhofer, Pavel Otřísal and Marian Rybanský
ISPRS Int. J. Geo-Inf. 2020, 9(8), 489; https://doi.org/10.3390/ijgi9080489 - 13 Aug 2020
Cited by 17 | Viewed by 2224
Abstract
The main topic of the article is the use of multicriteria analysis in assessing the impact of the geographical environment on rescue and military activities. The evaluation is based on digital geographical data, and the influences of individual geographical factors are determined by [...] Read more.
The main topic of the article is the use of multicriteria analysis in assessing the impact of the geographical environment on rescue and military activities. The evaluation is based on digital geographical data, and the influences of individual geographical factors are determined by spatial analyses. The essence of the article lies in the design of a methodical procedure for determining the weights of individual criteria and in the construction of a suitable resulting user function (utility value function) in a geographic information system environment with regard to the solved problem and in the verification of the proposed procedure. Using sensitivity analysis, the dominance of individual factors is determined, and the influence of the changes in the weights of the criteria on the overall results of the analysis is assessed. Detailed studies of the differences in the results of solving the same analytical problem with changed weights of individual criteria are performed, and these studies are documented on a model example. Based on verification tests performed both in office conditions and directly at selected locations, “optimized procedures” are recommended for assessing the potential of the geographical environment for the operation of rescue or military units in field conditions. Finally, the possibilities of further development of the model solution and its implementation into control systems are presented. Full article
Show Figures

Figure 1

28 pages, 3616 KiB  
Article
Reducing Consumer Uncertainty: Towards an Ontology for Geospatial User-Centric Metadata
by Hasti Ziaimatin, Alireza Nili and Alistair Barros
ISPRS Int. J. Geo-Inf. 2020, 9(8), 488; https://doi.org/10.3390/ijgi9080488 - 12 Aug 2020
Cited by 5 | Viewed by 2634
Abstract
With the increased use of geospatial datasets across heterogeneous user groups and domains, assessing fitness-for-use is emerging as an essential task. Users are presented with an increasing choice of data from various portals, repositories, and clearinghouses. Consequently, comparing the quality and evaluating fitness-for-use [...] Read more.
With the increased use of geospatial datasets across heterogeneous user groups and domains, assessing fitness-for-use is emerging as an essential task. Users are presented with an increasing choice of data from various portals, repositories, and clearinghouses. Consequently, comparing the quality and evaluating fitness-for-use of different datasets presents major challenges for spatial data users. While standardization efforts have significantly improved metadata interoperability, the increasing choice of metadata standards and their focus on data production rather than potential data use and application, renders typical metadata documents insufficient for effectively communicating fitness-for-use. Thus, research has focused on the challenge of communicating fitness-for-use of geospatial data, proposing a more “user-centric” approach to geospatial metadata. We present the Geospatial User-Centric Metadata ontology (GUCM) for communicating fitness-for-use of spatial datasets to users in the spatial and other domains, to enable them to make informed data source selection decisions. GUCM enables metadata description for various components of a dataset in the context of different application domains. It captures producer-supplied and user-described metadata in structured format using concepts from domain-independent ontologies. This facilitates interoperability between spatial and nonspatial metadata on open data platforms and provides the means for searching/discovering spatial data based on user-specified quality and fitness-for-use criteria. Full article
Show Figures

Figure 1

7 pages, 219 KiB  
Editorial
Introduction to Big Data Computing for Geospatial Applications
by Zhenlong Li, Wenwu Tang, Qunying Huang, Eric Shook and Qingfeng Guan
ISPRS Int. J. Geo-Inf. 2020, 9(8), 487; https://doi.org/10.3390/ijgi9080487 - 12 Aug 2020
Cited by 9 | Viewed by 4555
Abstract
The convergence of big data and geospatial computing has brought challenges and opportunities to GIScience with regards to geospatial data management, processing, analysis, modeling, and visualization. This special issue highlights recent advancements in integrating new computing approaches, spatial methods, and data management strategies [...] Read more.
The convergence of big data and geospatial computing has brought challenges and opportunities to GIScience with regards to geospatial data management, processing, analysis, modeling, and visualization. This special issue highlights recent advancements in integrating new computing approaches, spatial methods, and data management strategies to tackle geospatial big data challenges and meanwhile demonstrates the opportunities for using big data for geospatial applications. Crucial to the advancements highlighted here is the integration of computational thinking and spatial thinking and the transformation of abstract ideas and models to concrete data structures and algorithms. This editorial first introduces the background and motivation of this special issue followed by an overview of the ten included articles. Conclusion and future research directions are provided in the last section. Full article
(This article belongs to the Special Issue Big Data Computing for Geospatial Applications)
17 pages, 5957 KiB  
Article
Automated Processing of Remote Sensing Imagery Using Deep Semantic Segmentation: A Building Footprint Extraction Case
by Aleksandar Milosavljević
ISPRS Int. J. Geo-Inf. 2020, 9(8), 486; https://doi.org/10.3390/ijgi9080486 - 11 Aug 2020
Cited by 15 | Viewed by 3881
Abstract
The proliferation of high-resolution remote sensing sensors and platforms imposes the need for effective analyses and automated processing of high volumes of aerial imagery. The recent advance of artificial intelligence (AI) in the form of deep learning (DL) and convolutional neural networks (CNN) [...] Read more.
The proliferation of high-resolution remote sensing sensors and platforms imposes the need for effective analyses and automated processing of high volumes of aerial imagery. The recent advance of artificial intelligence (AI) in the form of deep learning (DL) and convolutional neural networks (CNN) showed remarkable results in several image-related tasks, and naturally, gain the focus of the remote sensing community. In this paper, we focus on specifying the processing pipeline that relies on existing state-of-the-art DL segmentation models to automate building footprint extraction. The proposed pipeline is organized in three stages: image preparation, model implementation and training, and predictions fusion. For the first and third stages, we introduced several techniques that leverage remote sensing imagery specifics, while for the selection of the segmentation model, we relied on empirical examination. In the paper, we presented and discussed several experiments that we conducted on Inria Aerial Image Labeling Dataset. Our findings confirmed that automatic processing of remote sensing imagery using DL semantic segmentation is both possible and can provide applicable results. The proposed pipeline can be potentially transferred to any other remote sensing imagery segmentation task if the corresponding dataset is available. Full article
Show Figures

Graphical abstract

28 pages, 6956 KiB  
Article
A Subject-Sensitive Perceptual Hash Based on MUM-Net for the Integrity Authentication of High Resolution Remote Sensing Images
by Kaimeng Ding, Yueming Liu, Qin Xu and Fuqiang Lu
ISPRS Int. J. Geo-Inf. 2020, 9(8), 485; https://doi.org/10.3390/ijgi9080485 - 11 Aug 2020
Cited by 10 | Viewed by 2409
Abstract
Data security technology is of great significance to the application of high resolution remote sensing image (HRRS) images. As an important data security technology, perceptual hash overcomes the shortcomings of cryptographic hashing that is not robust and can achieve integrity authentication of HRRS [...] Read more.
Data security technology is of great significance to the application of high resolution remote sensing image (HRRS) images. As an important data security technology, perceptual hash overcomes the shortcomings of cryptographic hashing that is not robust and can achieve integrity authentication of HRRS images based on perceptual content. However, the existing perceptual hash does not take into account whether the user focuses on certain types of information of the HRRS image. In this paper, we introduce the concept of subject-sensitive perceptual hash, which can be seen as a special case of conventional perceptual hash, for the integrity authentication of HRRS image. To achieve subject-sensitive perceptual hash, we propose a new deep convolutional neural network architecture, named MUM-Net, for extracting robust features of HRRS images. MUM-Net is the core of perceptual hash algorithm, and it uses focal loss as the loss function to overcome the imbalance between the positive and negative samples in the training samples. The robust features extracted by MUM-Net are further compressed and encoded to obtain the perceptual hash sequence of HRRS image. Experiments show that our algorithm has higher tamper sensitivity to subject-related malicious tampering, and the robustness is improved by about 10% compared to the existing U-net-based algorithm; compared to other deep learning-based algorithms, this algorithm achieves a better balance between robustness and tampering sensitivity, and has better overall performance. Full article
(This article belongs to the Special Issue Spatial Data Infrastructure for Distributed Management and Processing)
Show Figures

Figure 1

23 pages, 4272 KiB  
Article
Spatiotemporal Assessment of Irrigation Performance of the Kou Valley Irrigation Scheme in Burkina Faso Using Satellite Remote Sensing-Derived Indicators
by Alidou Sawadogo, Louis Kouadio, Farid Traoré, Sander J. Zwart, Tim Hessels and Kemal Sulhi Gündoğdu
ISPRS Int. J. Geo-Inf. 2020, 9(8), 484; https://doi.org/10.3390/ijgi9080484 - 11 Aug 2020
Cited by 11 | Viewed by 4552
Abstract
Traditional methods based on field campaigns are generally used to assess the performance of irrigation schemes in Burkina Faso, resulting in labor-intensive, time-consuming, and costly processes. Despite their extensive application for such performance assessment, remote sensing (RS)-based approaches remain very much underutilized in [...] Read more.
Traditional methods based on field campaigns are generally used to assess the performance of irrigation schemes in Burkina Faso, resulting in labor-intensive, time-consuming, and costly processes. Despite their extensive application for such performance assessment, remote sensing (RS)-based approaches remain very much underutilized in Burkina Faso. Using multi-temporal Landsat images within the Python module for the Surface Energy Balance Algorithm for Land model, we investigated the spatiotemporal performance patterns of the Kou Valley irrigation scheme (KVIS) during two consecutive cropping seasons. Four performance indicators (depleted fraction, relative evapotranspiration, uniformity of water consumption, and crop water productivity) for rice, maize, and sweet potato were calculated and compared against standard values. Overall, the performance of the KVIS varied depending on year, crop, and the crop’s geographical position in the irrigation scheme. A gradient of spatially varied relative evapotranspiration was observed across the scheme, with the uniformity of water consumption being fair to good. Although rice was the most cultivated, a shift to more sweet potato farming could be adopted to benefit more from irrigation, given the relatively good performance achieved by this crop. Our findings ascertain the potential of such RS-based cost-effective methodologies to serve as basis for improved irrigation water management in decision support tools. Full article
Show Figures

Figure 1

16 pages, 6387 KiB  
Article
Index for the Consistent Measurement of Spatial Heterogeneity for Large-Scale Land Cover Datasets
by Jing Yu, Shu Peng, Weiwei Zhang and Shun Kang
ISPRS Int. J. Geo-Inf. 2020, 9(8), 483; https://doi.org/10.3390/ijgi9080483 - 11 Aug 2020
Cited by 4 | Viewed by 5058
Abstract
Recognizing land cover heterogeneity is essential for the assessment of spatial patterns to guide conservation planning. One of the top research priorities is the quantification of land cover heterogeneity using effective landscape metrics. However, due to the diversity of land cover types and [...] Read more.
Recognizing land cover heterogeneity is essential for the assessment of spatial patterns to guide conservation planning. One of the top research priorities is the quantification of land cover heterogeneity using effective landscape metrics. However, due to the diversity of land cover types and their varied distribution, a consistent, larger-scale, and standardized framework for heterogeneity information extraction from this complex perspective is still lacking. Consequently, we developed a new Land Cover Complexity Index (LCCI), which is based on information-theory. The LCCI contains two foundational aspects of heterogeneity, composition and configuration, thereby capturing more comprehensive information on land cover patterns than any single metric approach. In this study, we compare the performance of the LCCI with that of other landscape metrics at two different scales, and the results show that our newly developed indicator more accurately characterizes and distinguishes different land cover patterns. LCCI provides an alternative way to measure the spatial variation of land cover distribution. Classification maps of land cover heterogeneity generated using the LCCI provide valuable insights and implications for regional conservation planning. Thus, the LCCI is shown to be a consistent indicator for the quantification of land cover heterogeneity that functions in an adaptive way by simultaneously considering both composition and configuration. Full article
(This article belongs to the Special Issue Geographic Complexity: Concepts, Theories, and Practices)
Show Figures

Figure 1

12 pages, 13864 KiB  
Article
Fourier-Based Automatic Transformation between Mapping Shapes—Cadastral and Land Registry Applications
by Juan Francisco Reinoso-Gordo, Rocío Romero-Zaliz, Carlos León-Robles, Jesús Mataix-SanJuan and Marcelo Antonio Nero
ISPRS Int. J. Geo-Inf. 2020, 9(8), 482; https://doi.org/10.3390/ijgi9080482 - 06 Aug 2020
Cited by 2 | Viewed by 2035
Abstract
Sometimes it is necessary to know the transformation to apply to a mapping shape in order to locate its true place. Such an operation can be computed if a corresponding reference object exists and we can identify corresponding points in both shapes. Nevertheless [...] Read more.
Sometimes it is necessary to know the transformation to apply to a mapping shape in order to locate its true place. Such an operation can be computed if a corresponding reference object exists and we can identify corresponding points in both shapes. Nevertheless our approach does not need to match any corresponding point beforehand. The method proposed defines a polygon in the frequency domain—two periodic functions are derived from a polygonal or polygon. According to the theory of elliptic Fourier descriptors those two periodic functions can be expressed by Fourier expansions. The transformation can be computed using the coefficients of the harmonics from the corresponding shapes without taking into account where each polygon vertex is placed in the spatial domain. The transformation parameters will be derived by a least squares approach. The geomatics and geosciences applications of this method go from photogrammetry, geographic information system, computer vision, to cadaster and real estates. Full article
Show Figures

Figure 1

22 pages, 8940 KiB  
Article
Predicting Land Cover Change in the Mamminasata Area, Indonesia, to Evaluate the Spatial Plan
by Andi Muhammad Yasser Hakim, Masayuki Matsuoka, Sumbangan Baja, Dorothea Agnes Rampisela and Samsu Arif
ISPRS Int. J. Geo-Inf. 2020, 9(8), 481; https://doi.org/10.3390/ijgi9080481 - 04 Aug 2020
Cited by 7 | Viewed by 3658
Abstract
The spatial plan program for Makassar City and the surrounding area called Mamminasata (Makassar, Maros, Sungguminasa, and Takalar) was created by the Indonesian Government. The program regulates the proportion of land cover, but predictions about land cover changes were not considered. Therefore, in [...] Read more.
The spatial plan program for Makassar City and the surrounding area called Mamminasata (Makassar, Maros, Sungguminasa, and Takalar) was created by the Indonesian Government. The program regulates the proportion of land cover, but predictions about land cover changes were not considered. Therefore, in this study, we predict what the land cover may be in 2031 using the multi-layer perceptron neural network and the Markov chain methods. For this purpose, image composite, support vector machine classifier, and change detection were applied to a time series of satellite data. Visual validation showed the hot-spots of land cover changes related to population density, and statistical validation scored 0.99 and 0.78 in no information kappa and grid-cell level location kappa, respectively. The model was performed to predict land cover in 2031, and the predicted result was then compared with the spatial plan using an overlapping method. The results showed that built-up area, dryland agriculture, and wetland agriculture occupied two, twenty, and eight percent of the protected zone, respectively. Meanwhile, fifteen percent of the development zone was covered by forest, mainly in the eastern part of Mamminasata. The result can be used to help the Government decide future plans for the Mamminasata area. Full article
Show Figures

Figure 1

17 pages, 3154 KiB  
Article
Evaluation of Spatial Resilience of Highway Networks in Response to Adverse Weather Conditions
by Fei Han and Su Zhang
ISPRS Int. J. Geo-Inf. 2020, 9(8), 480; https://doi.org/10.3390/ijgi9080480 - 31 Jul 2020
Cited by 4 | Viewed by 2230
Abstract
Adverse weather poses a significant threat to the serviceability of highway infrastructure, as it causes more frequent and severe crash incidents. This study focuses on evaluating the resilience of highway networks by examining the crash-induced safety impact in response to extreme weather events. [...] Read more.
Adverse weather poses a significant threat to the serviceability of highway infrastructure, as it causes more frequent and severe crash incidents. This study focuses on evaluating the resilience of highway networks by examining the crash-induced safety impact in response to extreme weather events. Unlike traditional service drop-based methods for resilience evaluation, this study endeavors to evaluate highway resilience in a spatial context. Three spatial metrics, including K-nearest neighbors, proximity to highways, and Kernel density hot spot, are introduced and employed to compare and analyze the spatial patterns (magnitude and distribution) of crashes in pre- and post-weather conditions. An illustrative example is also provided to showcase the applications of the proposed spatial resilience metrics for two study areas in the State of Illinois, U.S. The contribution of this study is to provide transportation practitioners with a tool to evaluate highway spatial resilience both visually and quantitatively, and ultimately improve highway safety and operation. Full article
Show Figures

Figure 1

19 pages, 3216 KiB  
Article
Daily Water Level Prediction of Zrebar Lake (Iran): A Comparison between M5P, Random Forest, Random Tree and Reduced Error Pruning Trees Algorithms
by Viet-Ha Nhu, Himan Shahabi, Ebrahim Nohani, Ataollah Shirzadi, Nadhir Al-Ansari, Sepideh Bahrami, Shaghayegh Miraki, Marten Geertsema and Hoang Nguyen
ISPRS Int. J. Geo-Inf. 2020, 9(8), 479; https://doi.org/10.3390/ijgi9080479 - 31 Jul 2020
Cited by 43 | Viewed by 3752
Abstract
Zrebar Lake is one of the largest freshwater lakes in Iran and it plays an important role in the ecosystem of the environment, while its desiccation has a negative impact on the surrounded ecosystem. Despite this, this lake provides an interesting recreation setting [...] Read more.
Zrebar Lake is one of the largest freshwater lakes in Iran and it plays an important role in the ecosystem of the environment, while its desiccation has a negative impact on the surrounded ecosystem. Despite this, this lake provides an interesting recreation setting in terms of ecotourism. The prediction and forecasting of the water level of the lake through simple but practical methods can provide a reliable tool for future lake water resource management. In the present study, we predict the daily water level of Zrebar Lake in Iran through well-known decision tree-based algorithms, including the M5 pruned (M5P), random forest (RF), random tree (RT) and reduced error pruning tree (REPT). We used five different water input combinations to find the most effective one. For our modeling, we chose 70% of the dataset for training (from 2011 to 2015) and 30% for model evaluation (from 2015 to 2017). We evaluated the models’ performances using different quantitative (root mean square error (RMSE), mean absolute error (MAE), coefficient of determination (R2), percent bias (PBIAS) and ratio of the root mean square error to the standard deviation of measured data (RSR)) and visual frameworks (Taylor diagram and box plot). Our results showed that water level with a one-day lag time had the highest effect on the result and, by increasing the lag time, its effect on the result was decreased. This result indicated that all the developed models had a good prediction capability, but the M5P model outperformed the others, followed by RF and RT equally and then REPT. Our results showed that these algorithms can predict water level accurately only with a one-day lag time in water level as an input and they are cost-effective tools for future predictions. Full article
(This article belongs to the Special Issue The Use of GIS and Soft Computing Methods in Water Resource Planning)
Show Figures

Figure 1

14 pages, 3165 KiB  
Article
Comparing Fully Deep Convolutional Neural Networks for Land Cover Classification with High-Spatial-Resolution Gaofen-2 Images
by Zemin Han, Yuanyong Dian, Hao Xia, Jingjing Zhou, Yongfeng Jian, Chonghuai Yao, Xiong Wang and Yuan Li
ISPRS Int. J. Geo-Inf. 2020, 9(8), 478; https://doi.org/10.3390/ijgi9080478 - 30 Jul 2020
Cited by 28 | Viewed by 3816
Abstract
Land cover is an important variable of the terrestrial ecosystem that provides information for natural resources management, urban sprawl detection, and environment research. To classify land cover with high-spatial-resolution multispectral remote sensing imagery is a difficult problem due to heterogeneous spectral values of [...] Read more.
Land cover is an important variable of the terrestrial ecosystem that provides information for natural resources management, urban sprawl detection, and environment research. To classify land cover with high-spatial-resolution multispectral remote sensing imagery is a difficult problem due to heterogeneous spectral values of the same object on the ground. Fully convolutional networks (FCNs) are a state-of-the-art method that has been increasingly used in image segmentation and classification. However, a systematic quantitative comparison of FCNs on high-spatial-multispectral remote imagery was not yet performed. In this paper, we adopted the three FCNs (FCN-8s, Segnet, and Unet) for Gaofen-2 (GF2) satellite imagery classification. Two scenes of GF2 with a total of 3329 polygon samples were used in the study area and a systematic quantitative comparison of FCNs was conducted with red, green, blue (RGB) and RGB+near infrared (NIR) inputs for GF2 satellite imagery. The results showed that: (1) The FCN methods perform well in land cover classification with GF2 imagery, and yet, different FCNs architectures exhibited different results in mapping accuracy. The FCN-8s model performed best among the Segnet and Unet architectures due to the multiscale feature channels in the upsampling stage. Averaged across the models, the overall accuracy (OA) and Kappa coefficient (Kappa) were 5% and 0.06 higher, respectively, in FCN-8s when compared with the other two models. (2) High-spatial-resolution remote sensing imagery with RGB+NIR bands performed better than RGB input at mapping land cover, and yet the advantage was limited; the OA and Kappa only increased an average of 0.4% and 0.01 in the RGB+NIR bands. (3) The GF2 imagery provided an encouraging result in estimating land cover based on the FCN-8s method, which can be exploited for large-scale land cover mapping in the future. Full article
(This article belongs to the Special Issue Geospatial Artificial Intelligence)
Show Figures

Figure 1

20 pages, 2301 KiB  
Article
An Empirical Agent-Based Model for Regional Knowledge Creation in Europe
by Martina Neuländtner
ISPRS Int. J. Geo-Inf. 2020, 9(8), 477; https://doi.org/10.3390/ijgi9080477 - 30 Jul 2020
Cited by 3 | Viewed by 2333
Abstract
Modelling the complex nature of regional knowledge creation is high on the research agenda. It deals with the identification of drivers for regional knowledge creation of different kinds, among them inter-regional networks and agglomeration factors, as well as their interplay; i.e., in which [...] Read more.
Modelling the complex nature of regional knowledge creation is high on the research agenda. It deals with the identification of drivers for regional knowledge creation of different kinds, among them inter-regional networks and agglomeration factors, as well as their interplay; i.e., in which way they influence regional knowledge creation and accordingly, innovation capabilities—in the short- and long-term. Complementing a long line of tradition—establishing a link between regional knowledge input indicators and knowledge output in a regression framework—we propose an empirically founded agent-based simulation model that intends to approximate the complex nature of the multi-regional knowledge creation process for European regions. Specifically, we account for region-internal characteristics, and a specific embedding in the system of region-internal and region-external R&D collaboration linkages. With first exemplary applications, we demonstrate the potential of the model in terms of its robustness and empirical closeness. The model enables the replication of phenomena and current scientific issues of interest in the field of geography of innovation and hence, shows its potential to advance the scientific debate in this field in the future. Full article
(This article belongs to the Special Issue Innovations in Agent-Based Modelling of Spatial Systems)
Show Figures

Figure 1

25 pages, 7627 KiB  
Article
Building Virtual 3D City Model for Smart Cities Applications: A Case Study on Campus Area of the University of Novi Sad
by Dušan Jovanović, Stevan Milovanov, Igor Ruskovski, Miro Govedarica, Dubravka Sladić, Aleksandra Radulović and Vladimir Pajić
ISPRS Int. J. Geo-Inf. 2020, 9(8), 476; https://doi.org/10.3390/ijgi9080476 - 30 Jul 2020
Cited by 52 | Viewed by 7332
Abstract
The Smart Cities data and applications need to replicate, as faithfully as possible, the state of the city and to simulate possible alternative futures. In order to do this, the modelling of the city should cover all aspects of the city that are [...] Read more.
The Smart Cities data and applications need to replicate, as faithfully as possible, the state of the city and to simulate possible alternative futures. In order to do this, the modelling of the city should cover all aspects of the city that are relevant to the problems that require smart solutions. In this context, 2D and 3D spatial data play a key role, in particular 3D city models. One of the methods for collecting data that can be used for developing such 3D city models is Light Detection and Ranging (LiDAR), a technology that has provided opportunities to generate large-scale 3D city models at relatively low cost. The collected data is further processed to obtain fully developed photorealistic virtual 3D city models. The goal of this research is to develop virtual 3D city model based on airborne LiDAR surveying and to analyze its applicability toward Smart Cities applications. It this paper, we present workflow that goes from data collection by LiDAR, through extract, transform, load (ETL) transformations and data processing to developing 3D virtual city model and finally discuss its future potential usage scenarios in various fields of application such as modern ICT-based urban planning and 3D cadaster. The results are presented on the case study of campus area of the University of Novi Sad. Full article
(This article belongs to the Special Issue Virtual 3D City Models)
Show Figures

Figure 1

23 pages, 5412 KiB  
Article
Spatiotemporal Varying Effects of Built Environment on Taxi and Ride-Hailing Ridership in New York City
by Xinxin Zhang, Bo Huang and Shunzhi Zhu
ISPRS Int. J. Geo-Inf. 2020, 9(8), 475; https://doi.org/10.3390/ijgi9080475 - 29 Jul 2020
Cited by 22 | Viewed by 3369
Abstract
The rapid growth of transportation network companies (TNCs) has reshaped the traditional taxi market in many modern cities around the world. This study aims to explore the spatiotemporal variations of built environment on traditional taxis (TTs) and TNC. Considering the heterogeneity of ridership [...] Read more.
The rapid growth of transportation network companies (TNCs) has reshaped the traditional taxi market in many modern cities around the world. This study aims to explore the spatiotemporal variations of built environment on traditional taxis (TTs) and TNC. Considering the heterogeneity of ridership distribution in spatial and temporal aspects, we implemented a geographically and temporally weighted regression (GTWR) model, which was improved by parallel computing technology, to efficiently evaluate the effects of local influencing factors on the monthly ridership distribution for both modes at each taxi zone. A case study was implemented in New York City (NYC) using 659 million pick-up points recorded by TT and TNC from 2015 to 2017. Fourteen influencing factors from four groups, including weather, land use, socioeconomic and transportation, are selected as independent variables. The modeling results show that the improved parallel-based GTWR model can achieve better fitting results than the ordinary least squares (OLS) model, and it is more efficient for big datasets. The coefficients of the influencing variables further indicate that TNC has become more convenient for passengers in snowy weather, while TT is more concentrated at the locations close to public transportation. Moreover, the socioeconomic properties are the most important factors that caused the difference of spatiotemporal patterns. For example, passengers with higher education/income are more inclined to select TT in the western of NYC, while vehicle ownership promotes the utility of TNC in the middle of NYC. These findings can provide scientific insights and a basis for transportation departments and companies to make rational and effective use of existing resources. Full article
Show Figures

Figure 1

26 pages, 6256 KiB  
Article
A Framework Uniting Ontology-Based Geodata Integration and Geovisual Analytics
by Linfang Ding, Guohui Xiao, Diego Calvanese and Liqiu Meng
ISPRS Int. J. Geo-Inf. 2020, 9(8), 474; https://doi.org/10.3390/ijgi9080474 - 28 Jul 2020
Cited by 13 | Viewed by 5171
Abstract
In a variety of applications relying on geospatial data, getting insights into heterogeneous geodata sources is crucial for decision making, but often challenging. The reason is that it typically requires combining information coming from different sources via data integration techniques, and then making [...] Read more.
In a variety of applications relying on geospatial data, getting insights into heterogeneous geodata sources is crucial for decision making, but often challenging. The reason is that it typically requires combining information coming from different sources via data integration techniques, and then making sense out of the combined data via sophisticated analysis methods. To address this challenge we rely on two well-established research areas: data integration and geovisual analytics, and propose to adopt an ontology-based approach to decouple the challenges of data access and analytics. Our framework consists of two modules centered around an ontology: (1) an ontology-based data integration (OBDI) module, in which mappings specify the relationship between the underlying data and a domain ontology; (2) a geovisual analytics (GeoVA) module, designed for the exploration of the integrated data, by explicitly making use of standard ontologies. In this framework, ontologies play a central role by providing a coherent view over the heterogeneous data, and by acting as a mediator for visual analysis tasks. We test our framework in a scenario for the investigation of the spatiotemporal patterns of meteorological and traffic data from several open data sources. Initial studies show that our approach is feasible for the exploration and understanding of heterogeneous geospatial data. Full article
Show Figures

Graphical abstract

23 pages, 2075 KiB  
Article
Spatial Intensity in Tourism Accommodation: Modelling Differences in Trends for Several Types through Poisson Models
by Mª Cristina Rodríguez-Rangel, Marcelino Sánchez-Rivero and Julián Ramajo-Hernández
ISPRS Int. J. Geo-Inf. 2020, 9(8), 473; https://doi.org/10.3390/ijgi9080473 - 28 Jul 2020
Cited by 2 | Viewed by 2384
Abstract
The distribution pattern of tourist activity in space represents valuable information to improve the management of a tourist destination. This is why there is a trend in the current literature in proposing modelling that allows for the incorporation of how tourist activity is [...] Read more.
The distribution pattern of tourist activity in space represents valuable information to improve the management of a tourist destination. This is why there is a trend in the current literature in proposing modelling that allows for the incorporation of how tourist activity is distributed in an operational way in order to characterize and measure the patterns identified for tourism management. The present study focuses on carrying out this modelling in an inland territory in an expansion phase which, according to the knowledge available from previous work, presents a strong territorial imbalance in the distribution of its housing pool, the region of Extremadura in Spain. For this reason, tourism intensity is modelled through a Poisson process to determine which model best fits the pattern of accommodation in the region. The results represent a valuable tool for public–private management of the tourism sector in the area under study. Full article
(This article belongs to the Special Issue Smart Tourism: A GIS-Based Approach)
Show Figures

Figure 1

16 pages, 3310 KiB  
Article
A Real-Time Infrared Stereo Matching Algorithm for RGB-D Cameras’ Indoor 3D Perception
by Jiageng Zhong, Ming Li, Xuan Liao and Jiangying Qin
ISPRS Int. J. Geo-Inf. 2020, 9(8), 472; https://doi.org/10.3390/ijgi9080472 - 28 Jul 2020
Cited by 7 | Viewed by 4134
Abstract
Low-cost, commercial RGB-D cameras have become one of the main sensors for indoor scene 3D perception and robot navigation and localization. In these studies, the Intel RealSense R200 sensor (R200) is popular among many researchers, but its integrated commercial stereo matching algorithm has [...] Read more.
Low-cost, commercial RGB-D cameras have become one of the main sensors for indoor scene 3D perception and robot navigation and localization. In these studies, the Intel RealSense R200 sensor (R200) is popular among many researchers, but its integrated commercial stereo matching algorithm has a small detection range, short measurement distance and low depth map resolution, which severely restrict its usage scenarios and service life. For these problems, on the basis of the existing research, a novel infrared stereo matching algorithm that combines the idea of the semi-global method and sliding window is proposed in this paper. First, the R200 is calibrated. Then, through Gaussian filtering, the mutual information and correlation between the left and right stereo infrared images are enhanced. According to mutual information, the dynamic threshold selection in matching is realized, so the adaptability to different scenes is improved. Meanwhile, the robustness of the algorithm is improved by the Sobel operators in the cost calculation of the energy function. In addition, the accuracy and quality of disparity values are improved through a uniqueness test and sub-pixel interpolation. Finally, the BundleFusion algorithm is used to reconstruct indoor 3D surface models in different scenarios, which proved the effectiveness and superiority of the stereo matching algorithm proposed in this paper. Full article
(This article belongs to the Special Issue 3D Indoor Mapping and Modelling)
Show Figures

Figure 1

18 pages, 8152 KiB  
Article
Spatio-Temporal Visualization Method for Urban Waterlogging Warning Based on Dynamic Grading
by Jingyi Zhou, Jie Shen, Kaiyue Zang, Xiao Shi, Yixian Du and Petr Šilhák
ISPRS Int. J. Geo-Inf. 2020, 9(8), 471; https://doi.org/10.3390/ijgi9080471 - 27 Jul 2020
Cited by 4 | Viewed by 2708
Abstract
With the acceleration of the urbanization process, the problems caused by extreme weather such as heavy rainstorm events have become more and more serious. During such events, the road and its auxiliary facilities may be damaged in the process of the rainstorm and [...] Read more.
With the acceleration of the urbanization process, the problems caused by extreme weather such as heavy rainstorm events have become more and more serious. During such events, the road and its auxiliary facilities may be damaged in the process of the rainstorm and waterlogging, resulting in the decline of its traffic capacity. Rainfall is a continuous process in a space–time dimension, and as rainfall data are obtained through discrete monitoring stations, the acquired rainfall data have discrete characteristics of time interval and space. In order to facilitate users in understanding the impact of urban waterlogging on traffic, the visualization of waterlogging information needs to be displayed under different spatial and temporal granularity. Therefore, the appropriateness of the visualization granularity directly affects the user’s cognition of the road waterlogging map. To solve this problem, this paper established a spatial granularity and temporal granularity computing quantitative model for spatio-temporal visualization of road waterlogging and the evaluation method of the model was based on the cognition experiment. The minimum visualization unit of the road section is 50 m and we proposed a 5-level depth grading method and two color schemes for road waterlogging visualization based on the user’s cognition. To verify the feasibility of the method, we developed a prototype system and implemented a dynamic spatio-temporal visualization of the waterlogging process in the main urban area of Nanjing, China. The user cognition experiment showed that most participants thought that the segmentation of road was helpful to the local visual expression of waterlogging, and the color schemes of waterlogging depth were also helpful to display the road waterlogging information more effectively. Full article
Show Figures

Figure 1

23 pages, 3843 KiB  
Article
Spatial Analysis of Asymmetry in the Development of Tourism Infrastructure in the Borderlands: The Case of the Bystrzyckie and Orlickie Mountains
by Michalina Jędruch, Marek Furmankiewicz and Iwona Kaczmarek
ISPRS Int. J. Geo-Inf. 2020, 9(8), 470; https://doi.org/10.3390/ijgi9080470 - 26 Jul 2020
Cited by 4 | Viewed by 2532
Abstract
This paper discusses the issue of analyzing the development of cross-border tourism infrastructure in the borderlands of countries with diversified administrative divisions and spatial databases, which hinders the use of national statistical units for comparative research. As an example, the ability to use [...] Read more.
This paper discusses the issue of analyzing the development of cross-border tourism infrastructure in the borderlands of countries with diversified administrative divisions and spatial databases, which hinders the use of national statistical units for comparative research. As an example, the ability to use the square grid and kernel density estimation methods for the analysis and spatial visualization of the level of tourism infrastructure development is studied for the Orlickie and Bystrzyckie Mountains, located in the Polish–Czech border area. To synthetically assess and compare the level of diversity, the methodology used in the Human Development Index was adapted using selected component indicators calculated for a square grid clipped to the boundaries of the area under study. This analysis enabled us to quantify the asymmetry in the development of tourism infrastructure in the borderlands via the calculation of the synthetic infrastructure development index. This index is 1.29 times higher in the Czech than in the Polish border area. However, the spatial concentration analysis of infrastructure shows that the diversity in the study area can be assessed as higher than the results using the average density indicators. This paper also discusses the benefits and problems associated with using the square grid method for the representation and analysis of heterogeneous data on tourism infrastructure in two neighboring national states. Full article
(This article belongs to the Special Issue Smart Tourism: A GIS-Based Approach)
Show Figures

Graphical abstract

22 pages, 2838 KiB  
Article
Measuring Community Disaster Resilience in the Conterminous Coastal United States
by Shaikh Abdullah Al Rifat and Weibo Liu
ISPRS Int. J. Geo-Inf. 2020, 9(8), 469; https://doi.org/10.3390/ijgi9080469 - 23 Jul 2020
Cited by 42 | Viewed by 6841
Abstract
In recent years, building resilient communities to disasters has become one of the core objectives in the field of disaster management globally. Despite being frequently targeted and severely impacted by disasters, the geographical extent in studying disaster resilience of the coastal communities of [...] Read more.
In recent years, building resilient communities to disasters has become one of the core objectives in the field of disaster management globally. Despite being frequently targeted and severely impacted by disasters, the geographical extent in studying disaster resilience of the coastal communities of the United States (US) has been limited. In this study, we developed a composite community disaster resilience index (CCDRI) for the coastal communities of the conterminous US that considers different dimensions of disaster resilience. The resilience variables used to construct the CCDRI were justified by examining their influence on disaster losses using ordinary least squares (OLS) and geographically weighted regression (GWR) models. Results suggest that the CCDRI score ranges from −12.73 (least resilient) to 8.69 (most resilient), and northeastern communities are comparatively more resilient than southeastern communities in the study area. Additionally, resilience components used in this study have statistically significant impact on minimizing disaster losses. The GWR model performs much better in explaining the variances while regressing the disaster property damage against the resilience components (explains 72% variance) than the OLS (explains 32% variance) suggesting that spatial variations of resilience components should be accounted for an effective disaster management program. Moreover, findings from this study could provide local emergency managers and decision-makers with unique insights for enhancing overall community resilience to disasters and minimizing disaster impacts in the study area. Full article
Show Figures

Figure 1

4 pages, 174 KiB  
Editorial
Map Generalization for the Future: Editorial Comments on the Special Issue
by Barry J Kronenfeld, Barbara P. Buttenfield and Lawrence V. Stanislawski
ISPRS Int. J. Geo-Inf. 2020, 9(8), 468; https://doi.org/10.3390/ijgi9080468 - 23 Jul 2020
Cited by 7 | Viewed by 2403
Abstract
Generalization of geospatial data is a cornerstone of cartography, a sequence of often unnoticed operations that lays the foundation of visual communication [...] Full article
(This article belongs to the Special Issue Map Generalization)
19 pages, 8220 KiB  
Article
An Open-Source Framework of Generating Network-Based Transit Catchment Areas by Walking
by Diao Lin, Ruoxin Zhu, Jian Yang and Liqiu Meng
ISPRS Int. J. Geo-Inf. 2020, 9(8), 467; https://doi.org/10.3390/ijgi9080467 - 22 Jul 2020
Cited by 5 | Viewed by 2630
Abstract
The transit catchment area is an important concept for public transport planning. This study proposes a methodological framework to generate network-based transit catchment areas by walking. Three components of the framework, namely subgraph construction, extended shortest path tree construction and contour generation are [...] Read more.
The transit catchment area is an important concept for public transport planning. This study proposes a methodological framework to generate network-based transit catchment areas by walking. Three components of the framework, namely subgraph construction, extended shortest path tree construction and contour generation are presented step by step. Methods on how to generalize the framework to the cases of the directed road network and non-point facilities are developed. The implementation of the framework is provided as an open-source project. Using metro stations in Shanghai as a case study, we illustrate the feasibility of the proposed framework. Experiments show that the proposed method generates catchment areas of high geospatial accuracy and significantly increases computational efficiency. The open-source program can be applied to support research related to transit catchment areas and has the potential to be extended to include more routing-related factors. Full article
Show Figures

Figure 1

20 pages, 4061 KiB  
Article
Spatial Mismatch between the Supply and Demand of Urban Leisure Services with Multisource Open Data
by Yue Deng, Jiping Liu, An Luo, Yong Wang, Shenghua Xu, Fu Ren and Fenzhen Su
ISPRS Int. J. Geo-Inf. 2020, 9(8), 466; https://doi.org/10.3390/ijgi9080466 - 22 Jul 2020
Cited by 9 | Viewed by 3809
Abstract
Understanding the balance between the supply and demand of leisure services (LSs) in urban areas can benefit urban spatial planning and improve the quality of life of residents. In cities in developing countries, the pursuit of rapid economic growth has ignored residents’ demand [...] Read more.
Understanding the balance between the supply and demand of leisure services (LSs) in urban areas can benefit urban spatial planning and improve the quality of life of residents. In cities in developing countries, the pursuit of rapid economic growth has ignored residents’ demand for LSs, thereby leading to a high demand for and short supply of these services. However, due to the lack of relevant research data, few studies have focused on the spatial mismatch in the supply and demand of LSs in urban areas. As typical representatives of multisource geographic data, social sensing data are readily available at various temporal and spatial scales, thus making social sensing data ideal for quantitative urban research. The objectives of this study are to use openly accessible datasets to explore the spatial pattern of the supply and demand of LSs in urban areas and then to depict the relationship between the supply and demand by using correlation analysis. Therefore, taking Beijing, China, as an example, the LS supply index (SI) and societal needs index (SNI) are proposed based on open data to reflect the supply and demand of LSs. The results show that the spatial distribution of the LS supply and demand in Beijing varies with a concentric pattern from the urban center to suburban areas. There is a strong correlation between the supply and demand of commercial and multifunctional services in Chaoyang, Fengtai, Haidian and Shijingshan, but there is no obvious correlation between the supply and demand of ecological and cultural services in Beijing. Especially in Dongcheng and Xicheng, there is no obvious correlation between the supply and demand of all services. The proposed approach provides an effective urban LS supply and demand evaluation method. In addition, the research results can provide a reference for the construction of “happy cities” in China. Full article
(This article belongs to the Special Issue Geo-Information Science in Planning and Development of Smart Cities)
Show Figures

Graphical abstract

23 pages, 9787 KiB  
Article
Exploring the Spatial Distribution Characteristics of Emotions of Weibo Users in Wuhan Waterfront Based on Gender Differences Using Social Media Texts
by Yue Ma, Changlong Ling and Jing Wu
ISPRS Int. J. Geo-Inf. 2020, 9(8), 465; https://doi.org/10.3390/ijgi9080465 - 22 Jul 2020
Cited by 14 | Viewed by 4033
Abstract
The benefits of the natural environment in urban space have been explored in numerous studies. However, only a few statistics and studies have been conducted on the correlation between emotion and urban waterfront space, especially considering gender differences. Taking Wuhan city as an [...] Read more.
The benefits of the natural environment in urban space have been explored in numerous studies. However, only a few statistics and studies have been conducted on the correlation between emotion and urban waterfront space, especially considering gender differences. Taking Wuhan city as an example, this study puts forward a new approach and perspective. Text emotion analysis is combined with the spatial analysis technique based on big data of social media. Based on the emotions of the public of different genders in urban space, suggestions are provided for urban planning and development from the perspective of POI (Point of Interest). The main steps are: (1) Analyzing the emotional score of Weibo texts published by citizens in the waterfront area of 21 lakes in Wuhan City; (2) exploring the public emotion characteristics of different genders in the urban waterfront; (3) classifying the waterfront according to the emotional response (score) of the public of different genders; (4) exploring the relationship between different POI types and waterfront types and proposing planning suggestions. The results of this study provide evidence for gender differences and spatial distribution of public emotions in the Wuhan waterfront area. It can help decision-makers to judge the prior protection and development direction of waterfront space, thus demonstrating the feasibility of this approach. Full article
Show Figures

Figure 1

16 pages, 3191 KiB  
Article
A Convolutional Neural Network and Matrix Factorization-Based Travel Location Recommendation Method Using Community-Contributed Geotagged Photos
by Thaair Ameen, Ling Chen, Zhenxing Xu, Dandan Lyu and Hongyu Shi
ISPRS Int. J. Geo-Inf. 2020, 9(8), 464; https://doi.org/10.3390/ijgi9080464 - 22 Jul 2020
Cited by 11 | Viewed by 2850
Abstract
Travel location recommendation methods using community-contributed geotagged photos are based on past check-ins. Therefore, these methods cannot effectively work for new travel locations, i.e., they suffer from the travel location cold start problem. In this study, we propose a convolutional neural network and [...] Read more.
Travel location recommendation methods using community-contributed geotagged photos are based on past check-ins. Therefore, these methods cannot effectively work for new travel locations, i.e., they suffer from the travel location cold start problem. In this study, we propose a convolutional neural network and matrix factorization-based travel location recommendation method to address the problem. Specifically, a weighted matrix factorization method is used to obtain the latent factor representations of travel locations. The latent factor representation for a new travel location is estimated from its photos by using a convolutional neural network. Experimental results on a Flickr dataset demonstrate that the proposed method can provide better recommendations than existing methods. Full article
Show Figures

Graphical abstract

Previous Issue
Next Issue
Back to TopTop