Article

Spatial Patterns and the Evolution of Logistics Service Node Facilities in Large Cities—A Case from Wuhan

1
College of Urban and Environmental Sciences, Central China Normal University, No. 152 Luoyu Road, Wuhan 430079, China
2
Hubei Institute of Economic and Social Development, Central China Normal University, No. 152 Luoyu Road, Wuhan 430079, China
3
Institute for Advanced Studies in Finance and Economics, Hubei University of Economics, No. 8 Yangqiaohu Road, Wuhan 430205, China
*
Author to whom correspondence should be addressed.
These authors contributed equally to this work.
ISPRS Int. J. Geo-Inf. 2024, 13(3), 82; https://doi.org/10.3390/ijgi13030082
Submission received: 13 November 2023 / Revised: 22 February 2024 / Accepted: 29 February 2024 / Published: 5 March 2024

Abstract

:
Logistics services are integral to urban economic activity, and delving into the spatial distribution traits and evolutionary pathways of various kinds of logistics service node facilities (LSNF) is markedly valuable for understanding a city’s functional spatial makeup and refining the spatial layout of logistics services. This study quantitatively and qualitatively analyzes the spatial congregation and spreading characteristics of diverse LSNFs in Wuhan in 2011, 2014, 2017, and 2020, employing kernel density analysis, average nearest neighbor index, mean center, and distance distribution frequency, seeking to characterize the spatial evolution characteristics of LSNF, alongside examining the trends in distances to city cores, principal adjoining roads, and production and consumption sites. The following conclusions were made: (1) Between 2011 and 2020, various types of LSNFs in Wuhan experienced a pattern characterized by the noticeable coexistence of spatial expansion and agglomeration, particularly visible after 2014. The degree of agglomeration is classified in a descending order as follows: CWC, STN, PSN, and PDN. (2) An “absolute diffusion” phenomenon characterizes the distribution of distances between various kinds of LSNFs and city cores or neighboring roads, with the lion’s share of high-frequency distribution zones spreading beyond city cores by 5–10 km, and a majority of the LSNFs being situated within 1 km from adjacent roads. (3) While the LSNF collective exhibits a stronger tendency towards the consumption facet, it reflects a surrounding of industrial production sites on the production facet and locations of manufactured goods consumption on the consumption facet, followed by locations of agricultural product consumption and comprehensive consumption sites.

1. Introduction

The impact of rigorous measures, such as quarantine mandates during the COVID-19 pandemic, exerted a profound influence on global and regional logistics and transportation sectors, a ripple effect that perseveres to the present day. Within urban areas, both individual travel behavior and freight transportation have been significantly impacted, resulting in a decrease in overall societal mobility [1]. Although the government has implemented various measures like mask mandates, vaccination [2] campaigns, and mobility restrictions to mitigate the impact of the pandemic on society, when the flow of both people and goods are hindered, production suffers significant losses and may even come to a complete halt [3,4]. Some transportation blockades have led to a significant reduction in the scale of logistics and freight transportation operations, rendering workers unable to commute to their workplaces. Consequently, this has resulted in hardship for laborers who are reliant on physical work [5,6]. In summary, this jolt emphatically underscored the significance of logistics operations, the revitalization of which emerges as an urgent task to restore the resilience and vigor of both global and regional economies.
The logistics sector has unmistakably emerged as a significant indicator of a city’s level of modernization and comprehensive strength. In China, a swiftly burgeoning economy is accompanied by an expanding logistics market. The 2022 China Modern Logistics Development Report exhibits that “from 2012 to 2021, China’s total social logistics grew from around 28.1 trillion USD to nearly 52 trillion USD, with an average annual growth rate of up to 7.3%, and has become the world’s largest logistics market” [7]. In 2022, the General Office of the State Council promulgated the “Modern Logistics Development Plan”, advocating the ambition that by 2025, urban distribution hubs, cold chain storage, and other pivotal facilities attain a coverage expanse of over 80% [8], a trend poised to foster economic rejuvenation and societal advancement. A resilient logistics industry can facilitate the transformation and upgrading of urban industrial structures [9]; at the same time, it also ensures the efficiency of the industrial division of labor and cooperation, enabling urban industrial structures to have greater resilience to market shocks [10].
Although in recent years, logistics geography has shown potential for development, in reality, research in this extremely important field has only scratched the surface [11]. Further exploration is needed into the urban structure and spatial functional characteristics from a logistics perspective, particularly with regard to reexamining the attributes, classifications, and efficiency of logistics spaces, and interpreting the characteristics of logistics space patterns from the perspectives of functional positioning, attribute delineation, and industry management [12]. In particular, research on logistics in China tends to focus on national or large regional scales [13,14]; some studies on urban logistics are also relatively limited, often focusing on a single type of logistics facility within the city [15]. Therefore, this study delves into the spatial pattern characteristics and evolution of each LSNF within Wuhan, comprehensively exploring them. This approach enables a finer understanding of urban logistics service development from macro to micro perspectives, providing urban policymakers with a comprehensive view for logistics facility planning and layout.
Based on the background provided, the research objectives of this paper are as follows: based on the POI data, firstly, this study aims to calculate the degree of agglomeration and diffusion of various types of logistics service node facilities in Wuhan City through the “kernel density” and “average nearest neighbor index”; then, utilizing point-based “mean center” methods, this study seeks to characterize the spatial evolution characteristics of LSNFs; lastly, the study will employ distance distribution frequency to characterize the changing relationship between logistics service nodes and urban centers, production sites, and consumption points. The structure of this article is as follows: Section 2 presents a review of the research advancements pertinent to urban logistics. Section 3 describes the fundamental socio-economic background and the underpinnings of logistics development in the targeted area, along with explicating the data and methodology employed in this study. Section 4 analyzes the relevant computations and visualizations of the results. The article concludes by summarizing and discussing the entirety of the study.

2. Literature Review

2.1. Logistics Sector and Regional Economic Development

The reconfiguration of spatial logistics and regional economy has occurred in the framework of a post-industrial development model, enhancing economic performance efficiency through specialization and agglomeration [16]. The principle of agglomeration economies explains the spatial concentration of industrial activities [17], with a significant portion of this being attributable to the synergies fostered among these enterprises; the clustering of local logistics providers precipitates reduced costs and greater flexibility. Total factor logistics productivity (TFLP) is indispensable for regional efficiency and competitiveness, as the circulation of goods, services, and labor becomes increasingly pivotal in local production systems [18]. In China, the agglomeration of logistics directly fuels regional economic growth through localization and urbanization effects [19]. Concerning the mechanism of action, it is predominantly logistics that galvanizes urbanization by bolstering employment, land utilization, and spillover effects through integration with other industries [20]. Steering the planning and construction of logistics facilities to meld with urban development and realize intensive land use emerges as an efficacious strategy to propel the high-quality evolution of China’s logistics sector and elevate the degree of new urbanization [21]. Nonetheless, in practical terms, there remain some issues that need further confirmation; for instance, the spatial spillover impact of constructing new logistics infrastructure on the trade circulation industry possesses a stabilizing boundary of 700 km. With the enlargement of geographical distance, transitions occur from the positive spatial spillover effect to the “siphon effect” [22].

2.2. Logistics Spread and Clustering

The phenomenon of logistics activities progressively distancing themselves from the central urban areas is commonly denoted as “logistics sprawl”, “logistics suburbanization”, and “logistics decentralization” [23]. However, it is important to recognize that the terms “sprawl”, “suburbanization”, and “decentralization” encompass nuanced differences in their conceptual and connotational implications within the field of urban geography. The concept of logistics sprawl draws, to some extent, from the notion of urban sprawl [24,25], and numerous socioeconomic factors contribute to this sprawl, making it challenging to ascertain which factors have the greatest impact [26]. Sprawl predominantly denotes spatial expansion activities which are characterized as inefficient or disorganized [27], while suburbanization is associated with the spatial evolution and extension of urban expansion. In the context of logistics, suburbanization refers to the tendency of logistics activities to shift to peripheral areas with lower population densities. This intrusion/integration into low-density areas reshapes the suburbs, making them pivotal locations, bases, or intermediate points for the circulation [28]. Regarding logistics decentralization, this entails the dispersion of activities across multiple locations, where the functions of major trade nodes and primary consumer markets coexist [29].
Numerous studies have determined that several large metropolitan areas in Europe and North America have encountered logistical sprawl to diverse extents [30]. Examples include cities like Chicago and Phoenix [31], as well as Montreal, Toronto, Winnipeg, Halifax [32,33], and the Greater Paris metropolitan area [34].The diffusion of logistics involves a complex process beyond simple suburbanization [35], while warehouse establishments are most densely distributed in the logistics sector, succeeded by the goods transportation sector and population, albeit to fluctuating degrees which are contingent on the city’s and warehouse’s size [36]. Concerning influential factors, the extent of logistics decentralization is vested in the differences in the spatial distribution of commodity flows and land valuations, warehousing decentralization is influenced by freight activities and land valuations, and the bearing of freight demand and land prices on decentralization is indeed significant and non-linear [37]. This impact mechanism has been evidenced in cities such as São Paulo, Brazil [38], Brandenburg, Germany [39], and Madrid, Spain [40]. In China, the swift advancement of the Internet and e-commerce has fueled the significant enhancement of logistics facilities and enterprises. Multi-faceted studies have revealed that approximately 67.48% of the nation’s urban logistics is in a gradually spreading state, crystallizing into three major high-value nuclear density regions as follows: the Yangtze River Delta, the Shandong Peninsula, and the Beijing–Tianjin–Hebei region [41]. In myriad instances, a correlation appears between the suburbanization of cities and the decentralization of logistics facilities, as warehousing and distribution hubs have spread to peri-urban regions where land is more economical and accessible. This location changing pattern has been driven by the necessity to construct more modern and expansive facilities to accommodate the ever-increasing influx of freight.
In the process of “logistics sprawl”, logistics operations seek to leverage the closeness to akin operations for infrastructure sharing, thus often forming “spatial clusters”. The changes in logistics exhibit the following two notable traits: the transition of facilities from the urban core to the peripheral zones (sprawl), and the co-location of logistics functions (concentration) [42]. Various vantage points further corroborate the burgeoning of logistics in the Paris metropolitan expanse and the emergence of logistics clusters in its vicinity. For instance, evolving supply demand dynamics and profit associations have led to the urban parcel industry’s concentration in urban hubs, a scenario which, contrary to the broad-scope logistics sprawl, denotes a “return to urban centers” for logistics activities [34,43]. In the context of the city, Chongqing’s distribution of logistics and warehousing land exhibits a clustered pattern with multiple centers. The aggregation of logistics land extends outward from the inner ring road [44,45], and in Hangzhou, the logistics nodes demonstrate a distinct “core-periphery” structure, indicating a strong coupling relationship between logistics nodes and the urban spatial structure. Other urban case studies also confirm this trend. For example, in Guangzhou, the kernel density of “intelligent express lockers” decreases from the city center towards the suburbs [46]. Similarly, in Shanghai, the spatial aggregation of service points for express delivery companies exhibits a pattern of “one pole, multiple cores [47]”. While it remains a significant challenge for large cities to accommodate the sprawl of logistics facilities while maintaining sustainable land use patterns, fostering the growth of logistics facilities in dense, mixed-use urban territories continues to be the prevailing trend [48].

2.3. Logistics Networks and Supply Chain Integration

The spatial configuration of logistics embodies the form and structure of logistics facilities, which form the crux of the physical network, alongside the logistics organization network, representing the core of ground-based logistics enterprises [49]. The arrangement of logistics facilities and enterprises significantly correlates with industrial demands and transportation locational attributes, progressively reflecting consumer demands and population locational traits [50].
With the ascendancy of logistics intelligence, the “fourth source of profit” rooted in supply chain management is emerging with potential [51]. Logistics networks are swiftly evolving, propelled by the globalization of the supply chain, the automation of production, and transportation networking, making the construction of efficient logistics networks increasingly pivotal [52]. These networks foster vertical and horizontal collaboration in the supply chain, enabling companies operating on a parallel level in the supply chain to share information and resources, thereby enhancing efficiency and profitability, albeit with a blend of opportunity and risk [53]. For example, since the pandemic, global supply chain logistics networks and sales logistics networks have experienced significant declines in connectivity, leading to a contraction of logistics networks to local scopes [54]. Supply chain management (SCM) integrates previously dispersed activities associated with material management and logistics, delivering specialized services and enhancing the overarching supply chain [55]. The advent of the Internet of Things melds standardized, modular, and intelligent containers with novel logistics protocols and business models, forming a collaborative, extensively distributed, and leveraged logistics and distribution system [56]. Indeed, under the impetus of globalization, automation in production, and the networked nature of transportation, the construction of efficient logistics networks has become increasingly important [52].

2.4. Urban Logistics Planning and Management

Logistics services stand as one of the most localized and ingrained industries, presenting a real challenge in metropolitan planning through the lens of logistics diversity. Taking Paris as an example, logistics and freight transportation are morphing into significant public issues for local governments in the metropolis, particularly as sustainability ascends as a new paradigm in urban and regional policy [57]. The unfolding impacts of the negative externalities due to urban freight transport are evident. Therefore, both managers and the general public are growing more observant and responsive to these negative externalities, leading to a rising number of city authorities instituting specific access regulations [58]. In light of the symbiotic role between the public and private sectors, the framework for urban logistics planning should encapsulate three dimensions: large-scale logistics facilities, road networks, and regional planning, further branching into four categories, namely logistics infrastructure, logistics management and control platforms, logistics transportation road types and networks, along with technical and institutional safeguards [59]. Assessments are also requisite, including cost–benefit analysis, multi-criteria analysis, or cost-effectiveness analysis [60]. The deployment of urban freight logistics measures in the European Union’s CIVITAS program underlines the pivotal role of fostering partnerships among the stakeholders in urban freight logistics [61]. Contrarily, in China, a holistic and comprehensive approach towards logistics-related planning remains absent, misaligning with the “one map” planning ethos of territorial spatial development [62]. The enterprise-centric model of logistics management notably diverges from urban planning concerning objects, goals, means, and so forth [63]. The theoretical framework and methodology underpinning public logistics facilities planning are yet to reach maturation. Hence, there appears a necessity for research delving into the location and layout of public logistics facilities, alongside their functional positioning and development objectives [64].

3. Materials and Methods

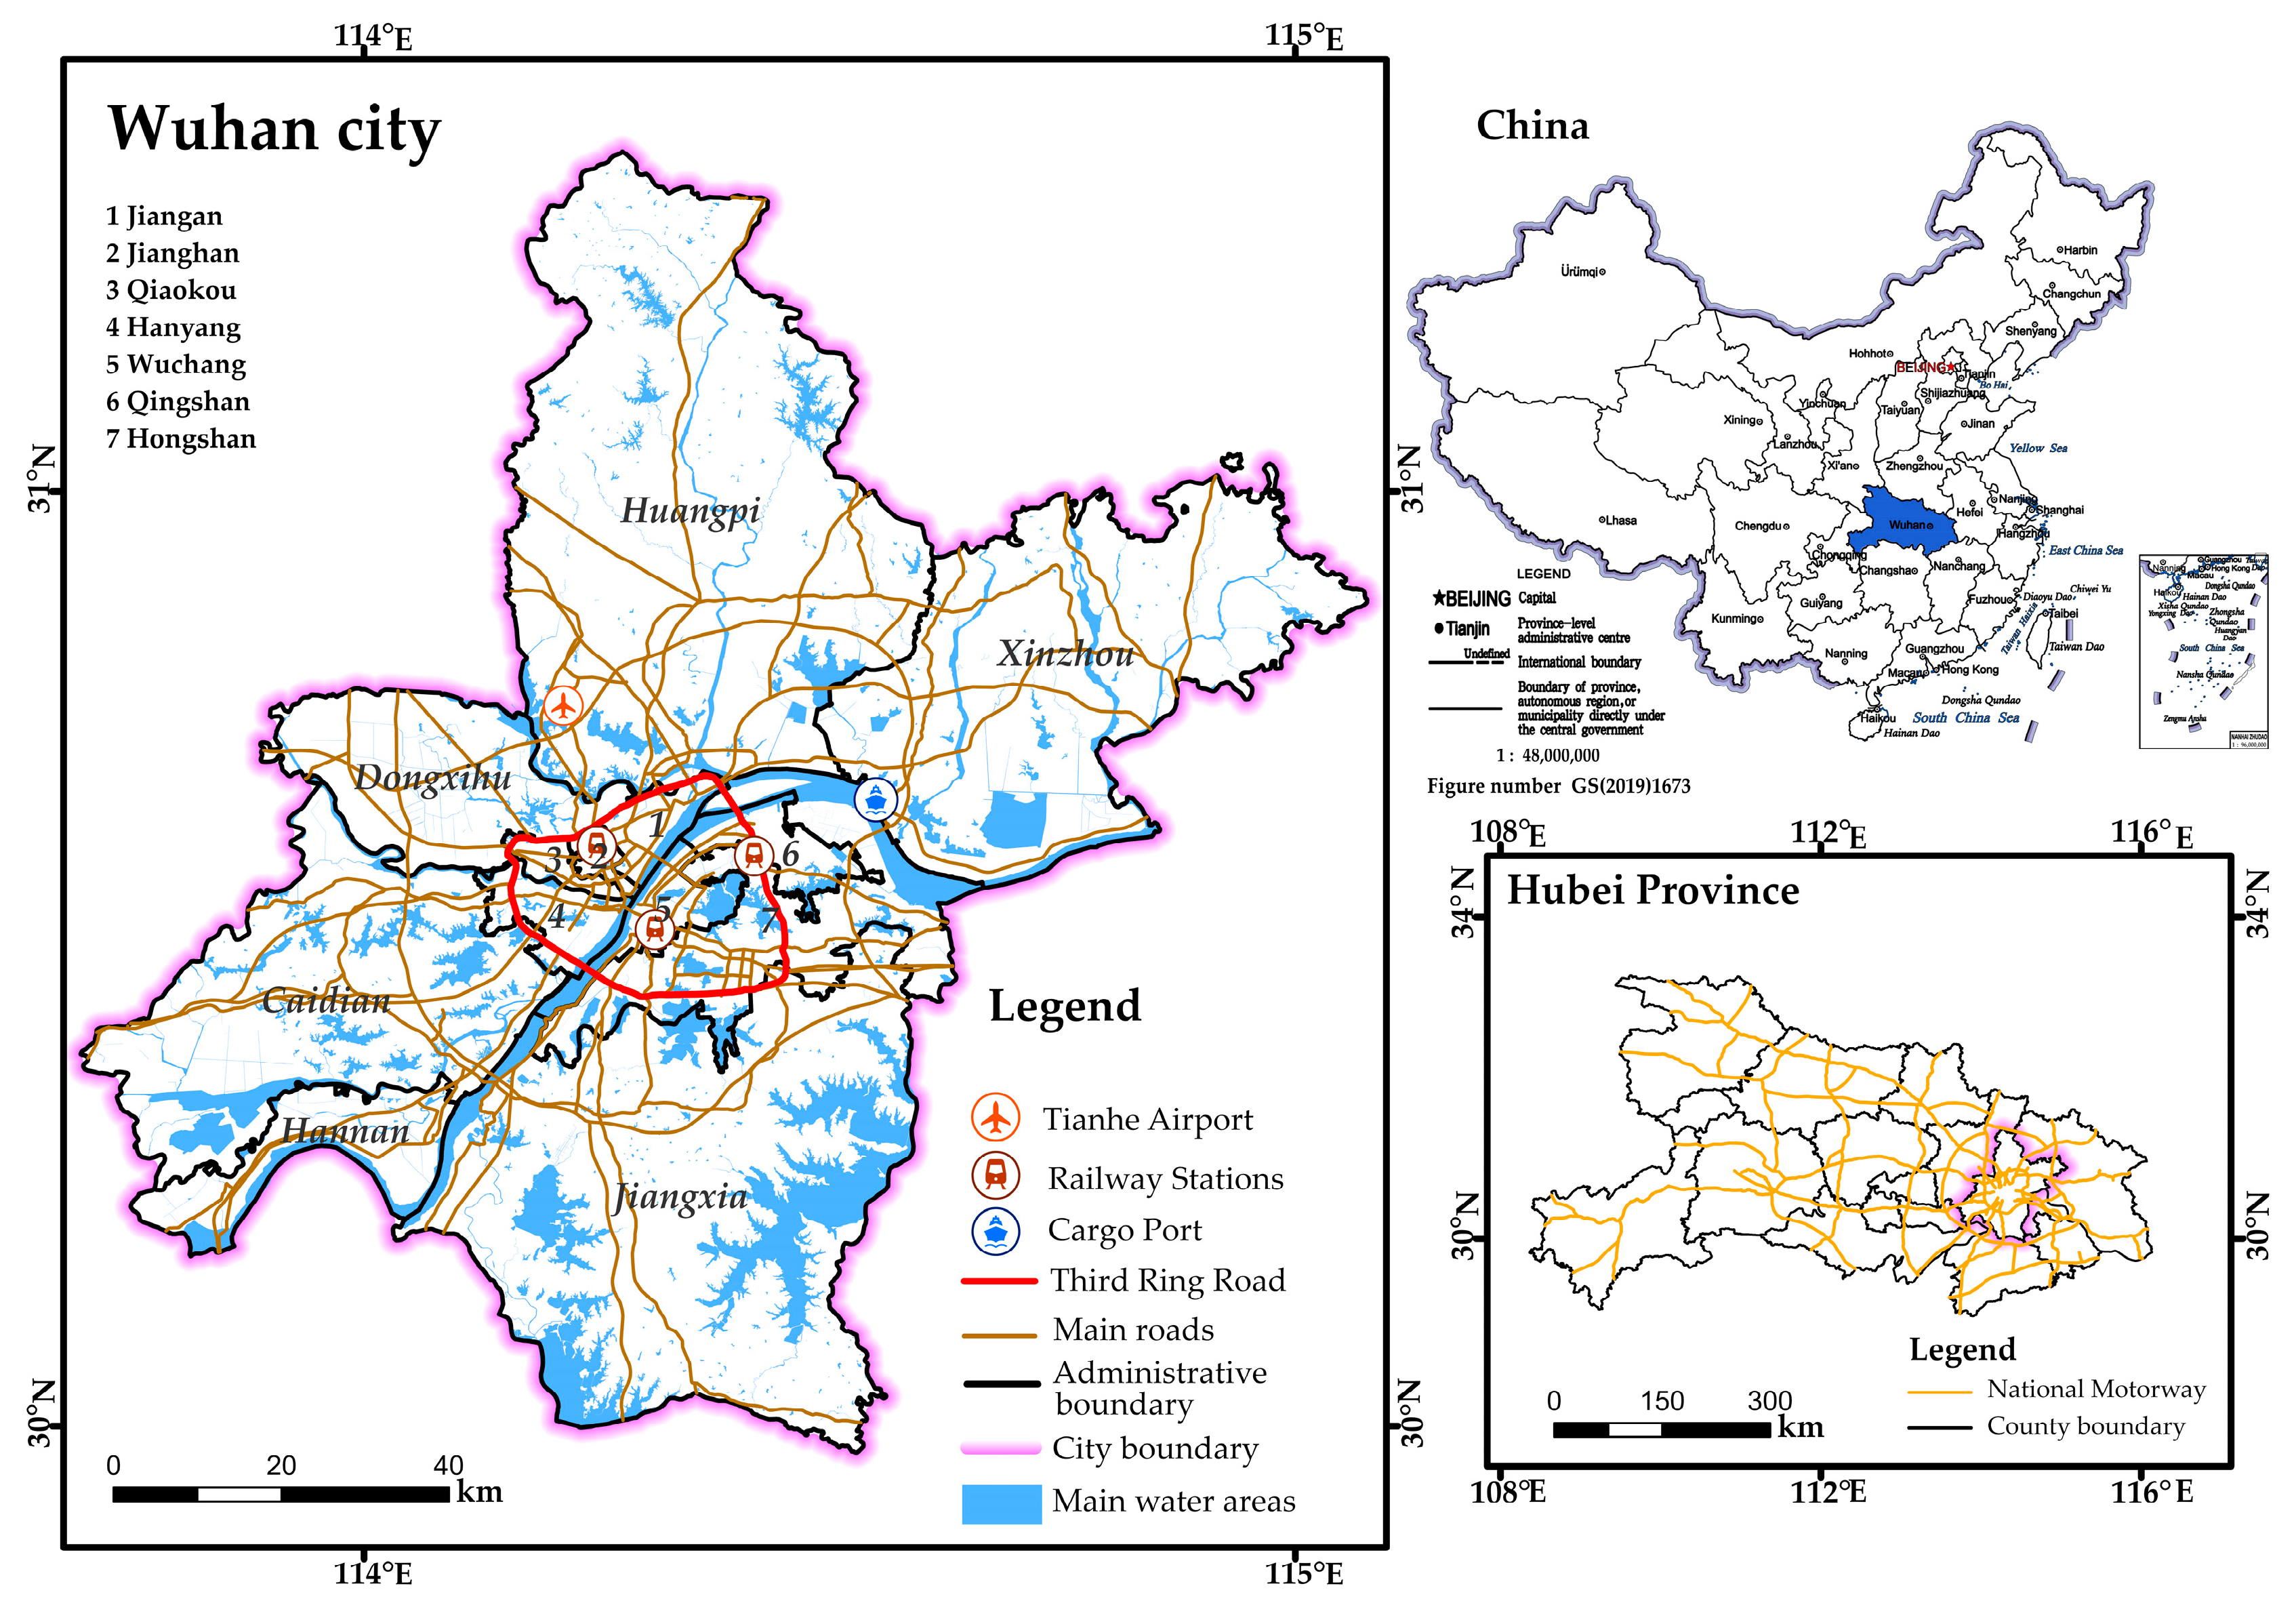
3.1. Research Area and Data Source

Wuhan, a significant provincial capital situated in central China (Figure 1), exhibits a resident population of 13,739,900 as of 2022, sprawling over an area of 8569.15 square kilometers, with approximately 84.66% of the population residing in urban areas. Since 2015, the added value of the logistics industry in Wuhan has surpassed USD 16.055 billion for the first time, accounting for approximately 9% of the city’s GDP. The logistics industry has gradually become one of the pillar industries supporting the overall economic development of the city. Wuhan boasts significant transportation advantages, including various modes of transport such as aviation, railways, waterways, and highways [65]. Situated in the heart of China, Wuhan serves as a national linchpin for both transportation and commodity circulation. According to the China City Logistics Competitiveness Report (2021), Wuhan is heralded as the 7th city in logistic competitiveness in China [66], thereby commanding a crucial stance as a logistics hub in the national tapestry, which possesses four functional categories, including land port, airport, production service, and trade service. Regarding logistics park construction, several modern logistics parks have been established, such as Hankou North, Donghu, Dongxihu, and Jiangxia, providing convenient operational environments and supporting facilities for logistics enterprises. In terms of logistics informatization, Wuhan has implemented initiatives including constructing a logistics information platform, employing Internet of Things (IoT) technology, and utilizing big data analytics to enhance logistics efficiency and service quality, thereby establishing itself as a pilot city for national modern logistics innovation and development.
The underpinning of modern logistics services lies in business entities, where diverse logistics enterprises bolster the main links and functions pertaining to societal logistics activities. Thus, the logistics industry transcends a mere industry or business domain, evolving into a facility entity designed for distribution and storage objectives. This study focuses on the traits of the spatial patterns of logistics facilities in sprawling urban centers, thereby designating the focus of the study as “Logistics Service Node Facilities” (hereinafter abbreviated as LSNF). Predominantly, the analysis employs Amap POI data in the four following years: 2011, 2014, 2017, and 2020. Additionally, the study incorporates road vector data from OpenStreetMap [67].

3.2. Research Methods

3.2.1. LSNF Classification

“Logistics nodes” refer to the different hierarchical levels of cities at the macro level and to logistics node facilities at the micro level, such as logistics parks, logistics centers, distribution centers, and transportation node facilities like railway stations, airports, ports, and docks [68]. These facilities are essential organizational elements of logistics activities [69]. In this study, focusing on the urban scale and based on POI data, logistics service node facilities mainly refer to various levels of “logistics service nodes” within the logistics network, such as logistics parks, logistics centers, distribution centers, self-pickup lockers, etc. Within the city, these nodes constitute crucial points of the social logistics service network. This study employs structured query language (SQL) to sieve keywords for functional category classification, drawing upon the procured logistics POI data. Although this methodology does not yield the utmost precise categorization, it provides a relatively objective categorization under the existing data conditions. Logistics service node facilities, denoted as LSNFs, along with the keywords and the resultant classification are presented in Table 1.

3.2.2. Measurement of the Characteristics of Spatial Distribution Patterns

The study utilizes the ArcGIS Pro software (version 2.8.3) platform to perform kernel density analysis, the mean nearest neighbor index, and mean center calculations, initially delving into the spatial distribution attributes and evolving trends of logistics facilities. These computations are executed automatically in ArcGIS Pro. Equations (1)–(3) are the formulas for the kernel density, average nearest neighbor index, and mean center.
D e n s i t y = 1 r a d i u s 2 i = 1 n n π · p o p i 1 d i s t i r a d i u s 2 2
Density represents the kernel density value, i = 1, …, n are the input points, and only points within a radius distance from the (x, y) location are included in the sum. popi is the population field value of point I, which is an optional parameter in ArcGIS Pro tools. disti is the distance between point i and the (x, y) location.
A N N = i = 1 n d i n / 0.5 n / A
in which di is the distance between the nearest features, A is the area of the minimum bounding rectangle of all features or the specified study area, and n is the total number of features. ANN is the average nearest neighbor index. If the index is less than 1, the pattern indicates clustering, while if the index is greater than 1, the pattern tends towards dispersion.
X ¯ = i n x i n Y ¯ = i = 1 n y i n
The mean center is a point constructed from the average X and Y values for the input feature centroids, where xi and yi are the coordinates for feature I, and n is the total number of features. As each point within the same category has the same function, there is no need to calculate the weighted mean center.
Logistics expansion involves both quantitative growth and spatial change. Building upon the groundwork laid in previous research, we will analyze how various types of LSNF are changing their distances from city centers, adjacent roads, and production or consumption sites to uncover specific nuanced patterns. Distance calculations from the city center are based on the location of the municipal government, with each LSNF Euclidean distance being computed from this reference point. Similarly, we determine proximity to the nearest main road by calculating the Euclidean distance from each LSNF point to the nearest road. The methodology for assessing distances to production or consumption points mirrors that of the nearest road. We aggregate calculation results at 5 km intervals to determine distribution frequencies, utilizing the neighborhood analysis tool in ArcGIS Pro. Further methodological details are not provided here for brevity.
Based on the aforementioned data foundation, primary research objectives, methods, and the research process and framework of this study are shown in Figure 2.

4. Results

4.1. Trends in Expansion and Clustering

Drawing upon the aforementioned theories and methodologies, a diverse range of LSNFs in Wuhan were assessed concerning their overall agglomeration and spreading, along with their relative frequency distributions regarding various distance intervals from the city center, major roadways, and sites of production and consumption, for a more nuanced understanding of the evolving trends and patterns.

4.1.1. Kernel Density Analysis and Average Nearest Neighbor Index (ANNI)

Kernel density can lucidly unveil the inherent spatial concentration. The kernel density segmentation of different types of LSNFs markedly diverges, displaying a pronounced proclivity for the enhancement of both the regional diffusion and concentration after 2017. The spatial distribution is depicted in Figure 3. ① CWCs progressively establish a convergence zone at the junction of the Qiaokou District and the East–West Lake District, spanning 2011 to 2020, with four distinct and stable convergence zones materializing following 2017. ② The high-density areas in STNs predominantly reside in the constructed area, forming two high-value zones post-2017 at the periphery of the Qiaokou District and the East–West Lake, alongside the Yangtze River. ③ PDNs are extensively distributed, evincing a gradual agglomeration towards the primary urban zones in terms of density changes, whilst solely principal streets and towns are distributed in the suburban expanse. There appears to be a significant growth from 2014 to 2017, and by 2020, the agglomeration in the central urban department zone further retracts to the vicinity along the Yangtze River. ④ The high-value zones of PSNs are chiefly situated in constructed areas, witnessing a dramatic surge from 2014 to 2017, with the central urban zones being thoroughly encompassed. By 2020, the central urban zones produce multiple hotspots, whilst the coverage industry requires further expansion.
The result of calculating the nearest neighbor index when utilizing ArcGIS Pro is illustrated in Figure 4. According to the mean of the average nearest neighbor index, the smaller the index, the higher the clustering degree. Therefore, the degree of agglomeration is classified in a descending order as follows: CWC, STN, PSN, and PDN. Regarding inter-annual variation, the results across different years for CWCs exhibit a pattern of a high level of clustering, where a slight decrease with each subsequent year is evident, indicating a slight decline in the degree of clustering. The inter-annual variation in the ANN index for STNs is relatively small; however, overall, there is a slight decrease in the index from 2011 to 2020, indicating a trend towards increased clustering. STNs reflect lesser inter-annual variability, albeit 2020 demonstrates a pronounced exponential decline and a subsequent increase in agglomeration when compared to 2011. As for PDNs, the ANN index significantly decreased after 2014, indicating a notable trend towards increased clustering. And PSNs experienced a fluctuating year-on-year variation, initially increasing and then decreasing; overall, this still demonstrates a trend towards strengthened clustering. The results above indicate that from 2011 to 2020, various types of LSNFs in Wuhan showed a clustering trend. The clustering changes in the upper-end logistics service nodes were relatively minor, with the main changes concentrated in the middle and end nodes. This consistency aligns with the spatial characteristics observed in the kernel density analysis mentioned earlier.

4.1.2. Changes in the Mean Center

To delve deeper into the temporal and spatial shifts of LSNFs in Wuhan, the “Mean Center” spatial statistical tool in ArcGIS Pro is employed to identify the trends of various LSNFs. The findings (Figure 5) indicate that CWCs incline towards the administrative district boundary, departing from the city center, with an average displacement of over 1.5 km; STNs increasingly gravitate towards the city center along the Yangtze River region, with an average displacement of around 1.2 km; PDNs exhibit a gradual tendency towards cross-river movement, with a larger moving distance of about 2 km from the center; and PSNs primarily shifts towards the Wuchang district, with an average displacement of around 1.2 km. These changes imply some noteworthy phenomena. The mean centers of CWCs tend to move closer to the Third Ring Road, indicating an outward expansion trend. However, the mean centers of other LSNFs exhibit a tendency to regress towards the main urban area, aligning with the notion of “logistics activities returning to the city center” mentioned in previous literature. Some of these changes are related to the natural factors in Wuhan. For example, the city is divided into three regions by two rivers, and the presence of numerous lakes restricts urban land use. The movement of the center of gravity of these LSNFs also partially reveals the direction of the regional development center and population changes in the city.

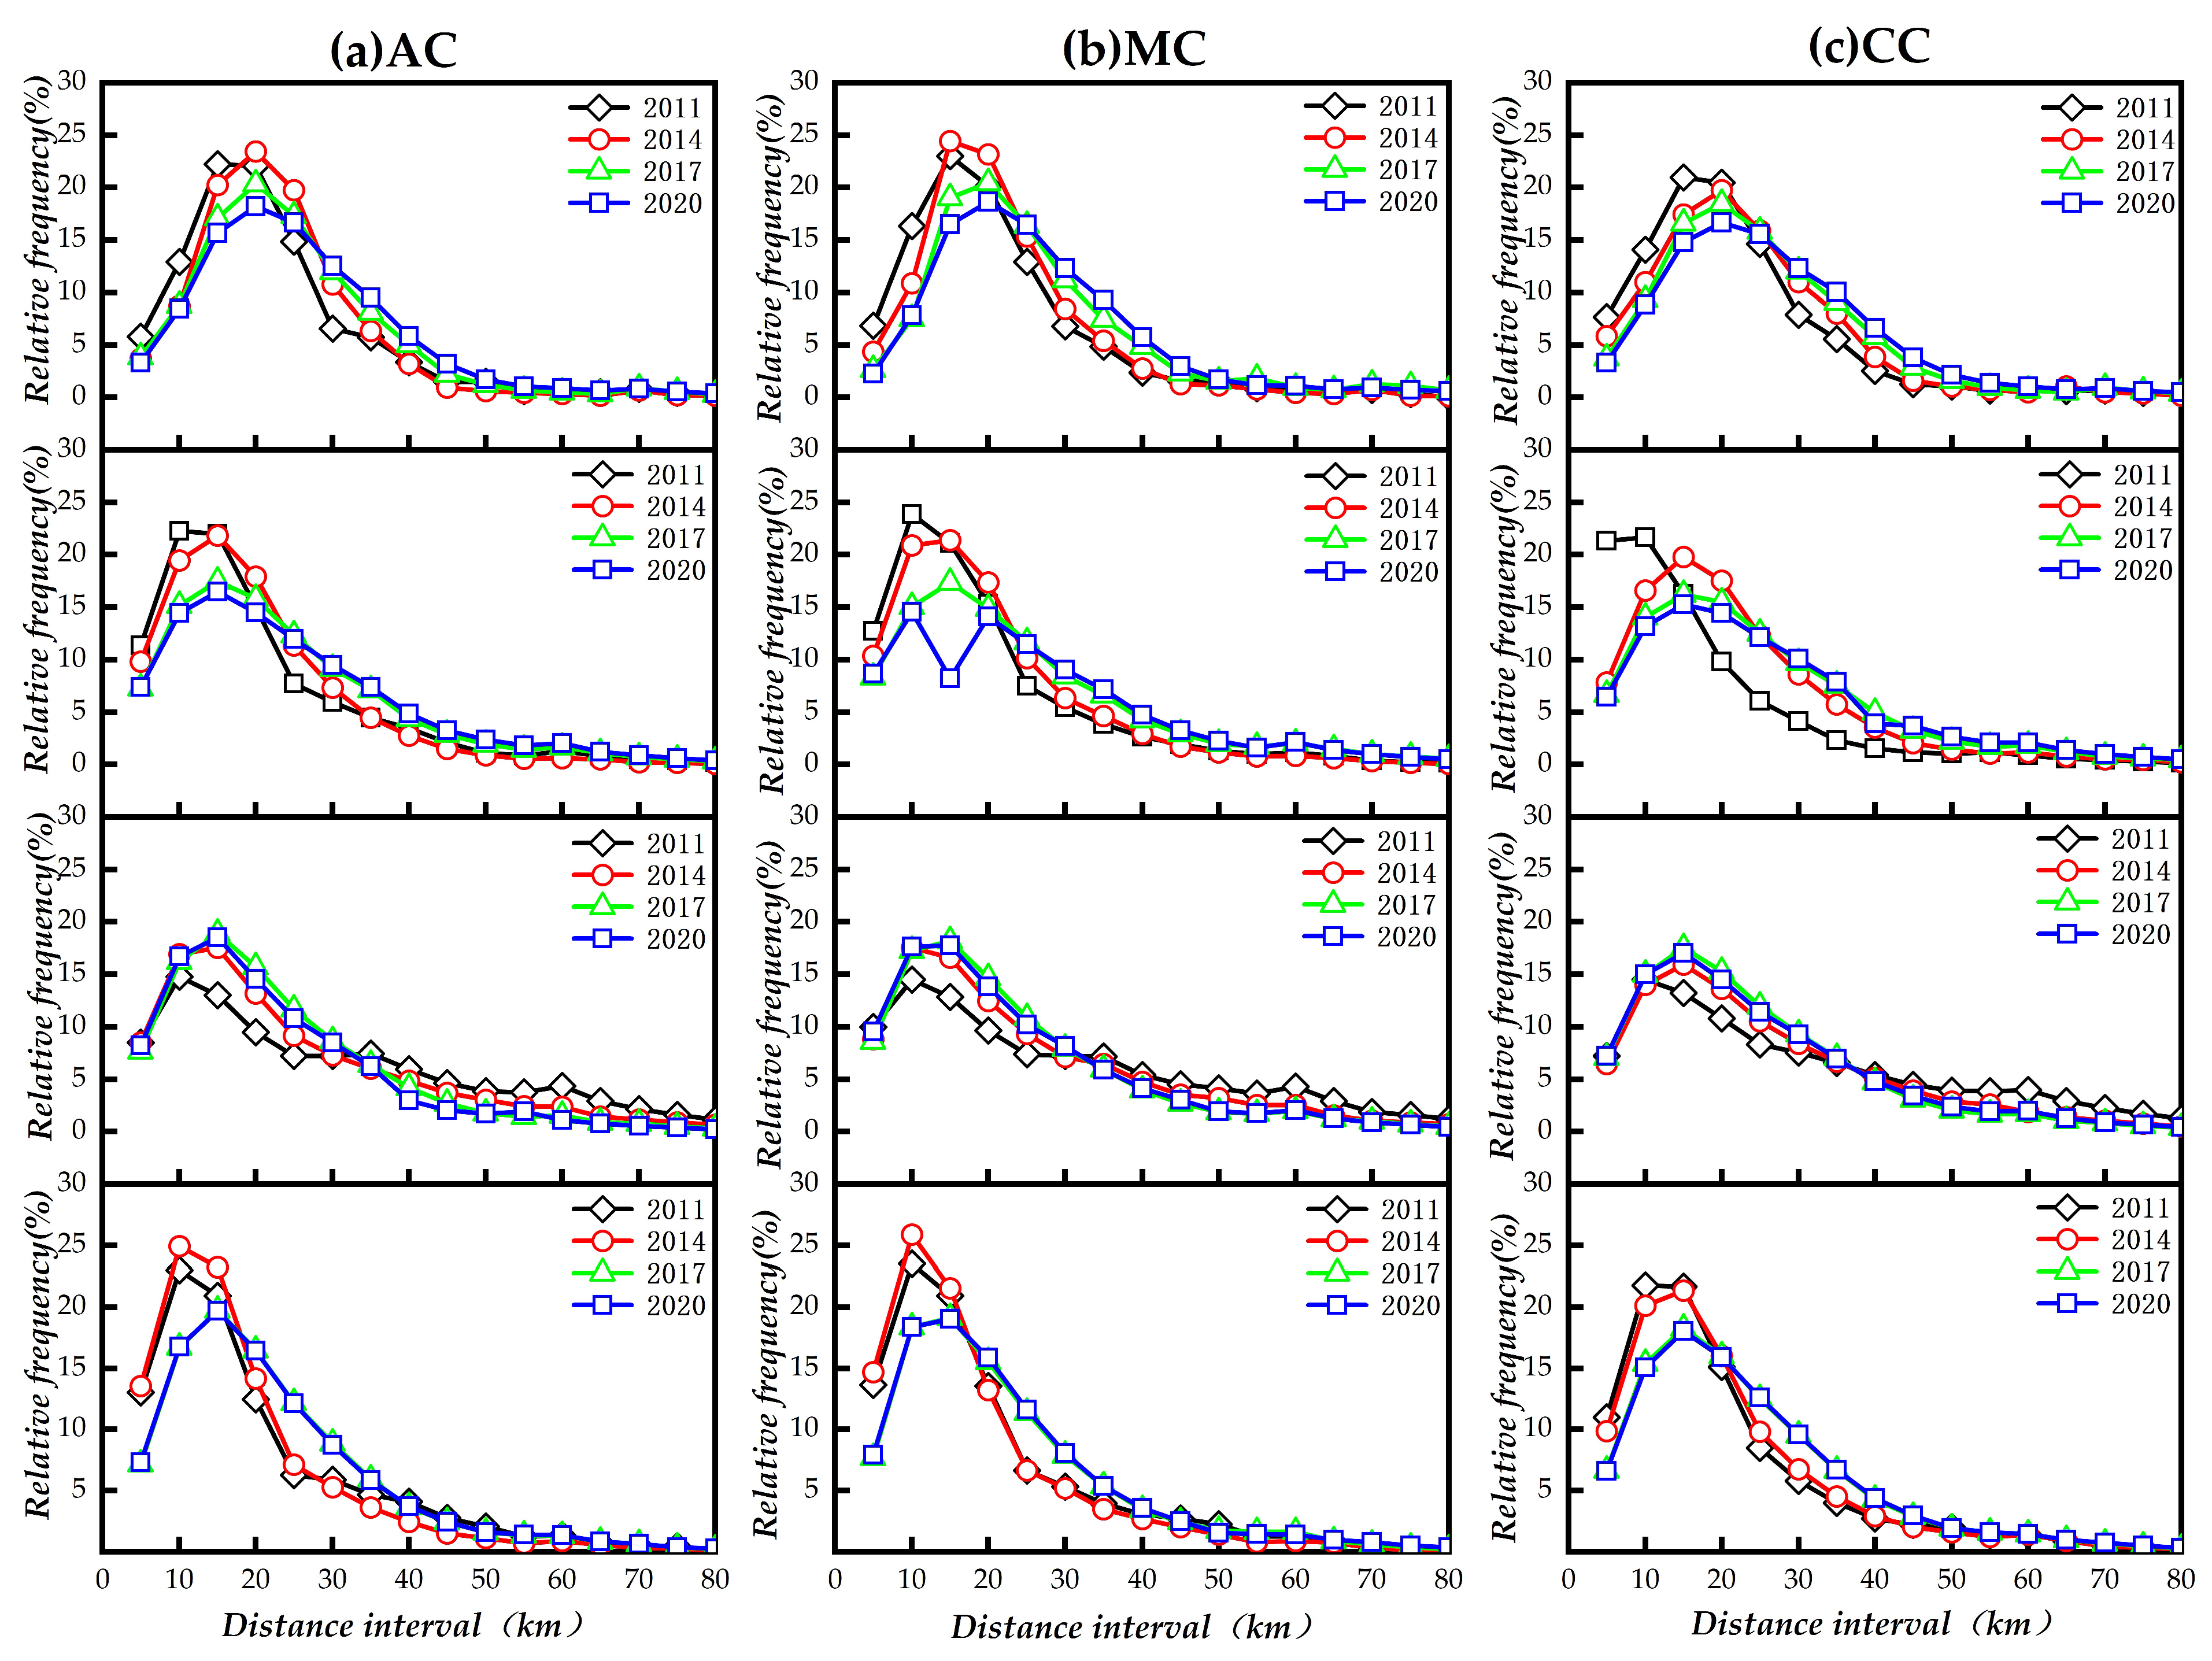
4.2. Characterization of Distance Variations

4.2.1. Change in Distance from City Center

The aforementioned analysis of clustering and spreading illustrates that the clustering and spreading of LSNFs in Wuhan coexist, each exhibiting varying degrees of spatial differences and imbalances. To further observe the trend of LSNFs’ deviation from the city center, the locus of the Wuhan municipal government is designated as the city center, and the Euclidean distance from LSNFs to the city center is measured, with the distribution probability counted in 5 km intervals.
The proximity table is utilized to calculate the Euclidean distance and angle between each type of logistics service facility and the city center. The results (Figure 6) demonstrate the following: ① Over 90% of CWCs are situated within a distance zone ranging from 10 to 20 km from the city center, with the facilities extending to about 60 km from the city center, and the high-frequency zone being narrowed from 15–20 km to 10–15 km from the city center. ② Overall, 90% of STNs are situated within 40 km of the city center, and the distance range of high-frequency distribution expands from 5–10 km to 15–20 km from the city center. ③ More than 90% of PDNs are distributed within 55 km of the city center, with the high-frequency distribution region transitioning from within 5 km of the city center to between 5 and 10 km. ④ Overall, 90% of PSNs are distributed within 25 km of the city center, and the high-frequency distribution interval broadens from 5–10 km to 10–15 km.
The above characteristics indicate that LSNFs in Wuhan predominantly occupy the urban zone proximal to, and encompassed by, the Third Ring Road (within a 20 km radius from the city nucleus). Analyses unveil a spatial correlation between the spread of LSNFs and the direction and distance of urban expansion. Concurrently, the frequency attributes of the distribution exhibited across distances are related to the morphological features of the administrative demarcation boundaries, with the distribution likelihoods of LSNFs markedly characterized by distance decay. The territories of high frequency distribution across inter-annual variability invariably extend outward, albeit by a maximum of 5 km; hence, the rural coverage remains insufficient.

4.2.2. Change in Distance from Major Roads

The development of contemporary logistics is inherently connected to the advancement of transportation infrastructure and freight conveyance technology; convenient transport conditions can improve logistics efficacy and reduce logistics expenditures. To delve into the spatial variation of logistics service facilities in association with the distance from principal urban thoroughfares (incorporating motorways, trunk, primary, and secondary roads within Wuhan from OSM data), the Euclidean distance from LSNFs to the nearest road was computed, followed by a conduct of distance interval frequency analytics to identify any propensity of relative spreading between logistics service facilities and roads. The findings (Figure 7) reveal that approximately 90% of LSNFs are situated within a 1 km range, with the most pronounced interannual fluctuation in facility distribution frequency in this distance scope, exhibiting more sensitivity to distance. Specifically, CWCs and PSNs demonstrate a decline in relative frequency within the 0.5 km and a surge between the 0.5 and 1 km range. Conversely, STNs and PDNs depict an antithetical trend, evidencing a significant increase in the relative frequency of facilities within 0.5 km and a decreasing tendency between 0.5 and 1 km.

4.2.3. Change in Distance from Place of Production or Consumption

The modern urban landscape functions as a central hub for material production, distribution, and consumption processes, with logistics service facilities playing a crucial role in facilitating the flow of materials within urban areas. To delve deeper into the potential correlation between the spread of logistics service facilities and the principal economic activities in the city, places representing production and consumption functions were selected from the Amap POI. The structured query language (SQL) was employed to refine the categories and keywords, wherein the production POI primarily emerged from “small category factories, industrial parks, companies” which were filtered from “large category companies”. In this process, the production POI primarily extracts the “small class of factories, industrial parks, and companies” from the “large class of companies and enterprises”, subsequently isolating data including the keywords “manufacturing”, “processing”, and “supply” in the title to represent “industrial production” (IP); the data pertaining to “agriculture, forestry, animal husbandry and fishery bases in the middle category”, along with those incorporating the keywords “agriculture”, “ecology”, “farming”, and “cooperative” in their titles are refined to signify “agricultural production” (AP). Consumption-centric POI denote “consumption of agricultural products” (AC) by sifting data from “shopping services in the major category” to “flower, bird, insect, and fish markets, agricultural and sideline product markets, and general markets in the minor category”, filtering data for “shopping centers and malls in the subcategory” to represent the “Consumption of manufactured goods” (MC), and the data of “convenience stores and supermarkets in the subcategory” are refined to symbolize “comprehensive consumption” (CC).
The findings (Figure 8) exhibit significant variability in the distribution of LSNFs in association with diverse types of production sites (PS) over time and across distance intervals. Collectively, all categories of logistics service facilities are predominantly situated around industrial production zones, with the distribution distances of CWCs and STNs being somewhat nearer in comparison to IP, while the arrangement of logistics service facilities and AP appears relatively balanced. With respect to distance intervals, LSNFs are chiefly distributed in a range of approximately 5–20 km relative to IP and 15–30 km to AP. Nonetheless, as time progresses, all LSNFs in 2020 demonstrate a notable spreading trend when compared to 2011; that is, the relative distances from both IP and AP have extended by roughly 5–10 km. This illustrates a corresponding spreading trend of LSNFs in Wuhan, utilizing the production site as a reference point.
By calculating the Euclidean distance and interval frequency distribution between each type of logistics service facility and each type of consumption site (CS), a clearer understanding of the results emerges (Figure 9). Overall, all LSNFs in Wuhan are primarily situated around MC premises, followed by AC and CC premises. Among these, STNs and PSNs are slightly closer to various types of consumption points compared to other logistics service facilities. Pertaining to distance intervals, STNs and PSNs are relatively closely affiliated with MCs and ACs within a distance of 0–15 km, while CWCs exhibit a closer association with ACs and CCs within a relative range of about 15–25 km. However, with the passage of time, specifically in 2020 as compared to 2011, all LSNFs display a relative spreading trend, and the distances from all types of consumption points have increased by about 5–10 km. This indicates a relative dispersal trend of LSNFs in Wuhan concerning consumption sites.
In this study, the focal point is the spatial interrelation between local LSNFs and the activities of production or consumption, as assessed through a comparative flow analysis. The results (Figure 10) emphasize that LSNFs are more closely linked with consumption activities in urban economies. Notably, two nodal types, PDNs and PSNs, hold significant relevance to consumption activities, particularly ACs and MCs. Conversely, CWCs and STNs are more proximately aligned with IP in production activities. With regard to spatial intervals in the 0 to 10 km range, PDNs and PSNs exhibit a tendency to be organized around ACs and MCs, whereas CWCs and STNs hold a somewhat stronger connection to CCs; in the contrasting range of 10 to 25 km, the proximity of CWCs and STNs to various hubs of production or consumption exhibits a balanced and consistent demeanor; beyond this range, as the distance increases, the distribution of LSNFs gradually attenuates, bringing the prominence of PDNs and PSNs into sharper relief once more. An additional observation involves that CWCs and STNs, positioned in the middle and upstream segments, progressively reduce in closeness to production and consumption activities when compared with PDNs, PSNs, and other terminal segments. This underlines the indelible correlation between the metamorphosis of logistic structures and the unfolding urban industrial labor division, wholesale, retail, and e-commerce dynamics.

5. Discussion

This study carefully delves into the evolution of the spatial and temporal patterns of various sorts of LSNFs across 2011, 2014, 2017, and 2020. The results indicate that, compared to other global metropolises, Wuhan has undergone a moderate-to-high level of logistics expansions. This aligns with another study’s findings, revealing a shift in the spatial distribution of warehouse facilities from the city center to the outskirts, with a greater concentration of warehouse land use. This demonstrates a characteristic coexistence of “expansion and agglomeration [45]”. Similarly, shifts in their distribution concerning their distances from the city center, main adjacent roads, and production or consumption sites, further corroborate the aforementioned results. It provides a more nuanced description of these characteristics, highlighting three noteworthy points for discussion.
Between 2011 and 2020, various types of LSNFs in Wuhan experienced a pattern characterized by the noticeable coexistence of spatial expansion and agglomeration. In spatial location terms, CWCs predominantly cluster at the outskirts of the main urban area, where urban and rural areas intersect. The agglomeration zone of STNs extend on either side of the juncture between the main and more distant urban areas, with new agglomerations emerging in the riverfront sector of the principal city. Conversely, the agglomeration domain of PDNs chiefly span in the scope of the main urban area, and, with the enhancement in the count of streets and townships in the distant urban areas post-2017, a minor-scale change in agglomeration was noted. The agglomeration shifts in PSNs share semblances with PDNs, yet predominantly cluster at the central region of the main city. These findings indicate that, in terms of CWCs and STNs, Wuhan, like other major cities, underwent a process of logistics expansion, with these areas often serving as crucial logistics land-use zones in urban planning. Evidence from the Paris metropolitan area also supports similar conclusions, suggesting that warehouses and freight stations are increasingly moving away from the city center due to urban planning policies and economies of scale [70]. When the government plans the logistics-related land use, it typically aims to create employment opportunities and fiscal revenue for the local area [71]. While expanding into the outskirts can drive development opportunities in rural areas, the industrial-focused logistics sector will remain the primary driver of expansion [72]. In the case of PSNs and PDNs, the results also echo another study focusing on Wuhan, indicating that express pickup points tend to cluster in the central urban area, forming “central hotspots”. Their distribution correlates highly with residential land use and the area and population size of each district [73].
The selection, accessibility, and urban layout play a crucial role in determining the locations of logistics facilities. They tend to concentrate nearer to key transportation infrastructure like highways, airports, and seaports. The significant expansion of logistics largely stems from transportation enhancements and suburbanization. Evidence from Spain suggests that almost half of logistics companies operate within a kilometer of a highway, with over 95% being within 10 km. Furthermore, 89% of these companies are situated in urban areas, contrasting the much lower 11% in rural regions [74]. In Wuhan, regarding to distance from the city center, the majority of LSNFs are situated proximate to the Third Ring Road (within an approximate 20 km radius from the city center) or in developed zones, with a preponderance of distribution areas stretching between 5–10 km, while CWCs extend to nearly 60 km from the city core. LSNFs exhibit a greater sensitivity to the closeness of adjacent roads, with the majority being distributed within 1 km of these roadways. Notably, an explicit sprawl phenomenon between the CWCs and PSNs vis-a-vis the roads is characterized by a decrease in distribution frequency within 0.5 km from the roads, and an increase between 0.5 and 1 km. Conversely, STNs and PSNs exhibit a contrary trend, i.e., a significant increase in relative frequency up to 0.5 km and a reducing trend between 0.5 and 1 km, suggesting a proclivity for LSNFs in this category to cluster nearer to the roadways. Although logistics is closely tied to transportation factors, the spatial distribution of freight between intra- and inter-regional transport facility groups also needs to consider the share of freight within and between regions, as well as the types of goods [75].
In large cities, efficient commodity supply chains increasingly benefit from logistics facilities which are located close to the places where goods are used and consumed [76]. Although LSNFs generally tend to be situated closer to the consumption end, there are still some interesting phenomena observed in specific relationships. With respect to their proximity to production sites, the relative distance of LSNFs to both IP and AP extends by approximately 5–10 km, yet they are typically situated closer to industrial production areas, among which, CWCs and STNs are somewhat nearer to IP areas, spanning about 5 to 20 km. In relation to consumption sites, all LSNFs have enhanced their relative distances to consumption points by around 5–10 km, but are primarily arranged around MC, trailed by AC and CC; in this arrangement, STNs and PSNs are located somewhat more closely when compared to the distribution distances of the various types of consumption points, which are distributed within a relative distance of about 0 to 15 km. The above indicates that facilities situated at the upstream end of the logistics service, such as CWCs and STNs, remain closely linked to industrial production or the consumption of finished goods, while facilities at the downstream end of the logistics service, such as PDNs and PSNs, are increasingly connected to broader consumer areas. These new findings are corroborated by the existing research; for instance, the decline in employment numbers in logistics and wholesale trade in city centers is due to the growth of logistics activities predominantly in the peripheries of urban areas [77]. Moreover, in some of the world’s major cities such as New York, Paris, Seoul, Shanghai, and Tokyo, there is a necessary overcoming of the high costs of establishing and operating logistics facilities in dense urban environments. Therefore, in practice, logistics activities are often integrated with housing, retail, or other purposes, giving rise to emerging mixed-use facilities, thereby leading to the spatial reorganization of these LSNFs and generating new spatial functionalities.

6. Conclusions

Due to the growing urban population’s demand for more and convenient goods, the expansion of urban freight is inevitable. Numerous studies have indicated that the changes in logistics geography represent not only the spatial reorganization of urban areas. but also the increasing connectivity among metropolitan, regional, and national economic entities over long distances [78]. In terms of the hierarchical structure and spatial patterns of logistics networks, there are significant geographic and hierarchical differences in the spatial distribution of different nodes, and there is a high degree of diversity among nodes and levels [79].
The structural changes in various types of LSNFs regarding distance and configuration trends illuminates the spatial evolution of urban characteristics in the domain of material circulation. Extant data suggest that service node facilities with a warehousing focus are often related to a city’s industrial framework and land-use planning. Considering their substantial land occupancy, these facilities are typically envisioned to be situated at the urban periphery transitioning into rural areas, thereby acting as a “bridgehead” for the expansion of the city’s built-up zone. However, logistics connections in the downstream and terminal phases tend to be market driven, predominantly clustering in central urban areas with significant populations and industrial activities to cater to the diverse logistics demands of clientele, while extensive rural regions remain comparatively underserved. Such developments seemingly indicate that variances in transportation costs, rental rates, and commercial objectives contribute to a differentiation in the nature and function of logistics nodes, thus leading to different forms of agglomeration. While the classification of logistics in this study might undergo adjustments and refinements in practical scenarios per varying industrial sectors and logistics requisites, the attenuation of intermediate links remains a constant. LSNFs are progressively embodying flexibility and personalization in the organizational frameworks and business models of these diverse enterprises.
The intra-city logistics system has transcended serving merely the conventional manufacturing sector’s production logistics, evolving to accommodate the burgeoning sectors of e-commerce courier services, urban delivery, and other service industry-oriented logistics. In tandem, the logistical spatial structure of entities such as e-commerce firms and express delivery companies has undergone notable transformations, presenting new quandaries and challenges for urban logistics, freight transportation, and allied industry planning. As many cities experience population growth in their central areas while freight facilities expand outward, it leads to increased freight travel distances and exacerbates spatial mismatches [80]. Consequently, this situation results in negative impacts, such as traffic congestion, exhaust emissions pollution, air pollution, greenhouse gas emissions, noise disturbance, and safety hazards [81].To overcome these challenges, it is necessary to not only coordinate the contradictions between logistics costs, environmental impacts, traffic safety, and energy consumption [82], but also to harmonize the interests of stakeholders involved in urban logistics at the microlevel [83]. Optimizing urban logistics layouts from the perspective of the spatial supply–demand balance, ensuring fair distribution of logistics facilities is essential to promote the sustainable development of urban logistics sector [84]. In addition to this, aiming for economic, social, and environmental sustainability, promoting the integration of Internet of Things (IoT) and smart logistics systems is essential. For instance, planning and constructing intelligent and automated logistics facilities related to new energy trucks seems promising.
While this study delved into the spatial distribution and evolutionary traits of various LSNFs in Wuhan from diverse perspectives, there are still avenues for further exploration. Factors influencing the distribution and development of different LSNF types, along with their mechanisms and socio-economic impacts, warrant deeper investigation. Furthermore, comparative analyses with similarly sized cities in China are imperative to delineate the universality or specificity of these logistics traits. Moving forward, we will focus on selecting suitable influencing factors and econometric models to conduct more refined research and exploration into the spatial and network patterns of each category of LSNF. This will enable us to provide more specific and quantifiable recommendations for urban logistics planning.

Author Contributions

This paper was written with the contribution of all authors as follows: conceptualization, data curation, Jie Lu; funding acquisition, Jing Luo, Lingling Tian and Ye Tian; investigation, Jie Lu and Jing Luo; methodology, Jie Lu and Ye Tian; project administration, Jing Luo; supervision, Jing Luo; visualization, Jie Lu and Ye Tian; writing—original draft, Jie Lu; writing—review and editing, Jing Luo and Lingling Tian. All authors have read and agreed to the published version of the manuscript.

Funding

This research was supported by the National Natural Science Foundation of China (No. 42271228, No. 42001185), the Humanities and Social Science Foundation of the Ministry of Education of China (No. 20YJCZH147), Natural Science Foundation of Hubei provincial (No. 2023AFB897).

Data Availability Statement

The data used to support the findings of this study are available from the authors upon request.

Conflicts of Interest

The authors declare no conflicts of interest.

References

  1. Lee, K.; Eom, J.K. Systematic literature review on impacts of COVID-19 pandemic and corresponding measures on mobility. Transportation 2023, 1–55. [Google Scholar] [CrossRef]
  2. Maleki, M.; Bahrami, M.; Menendez, M.; Balsa-Barreiro, J. Social Behavior and COVID-19: Analysis of the Social Factors behind Compliance with Interventions across the United States. Int. J. Environ. Res. Public Health 2022, 19, 15716. [Google Scholar] [CrossRef]
  3. Zhou, Y.; Feng, L.; Zhang, X.; Wang, Y.; Wang, S.; Wu, T. Spatiotemporal patterns of the COVID-19 control measures impact on industrial production in Wuhan using time-series earth observation data. Sustain. Cities Soc. 2021, 75, 103388. [Google Scholar] [CrossRef]
  4. Vasiev, M.; Bi, K.; Denisov, A.; Bocharnikov, V. How COVID-19 Pandemics Influences Chinese Economic Sustainability. Foresight STI Gov. 2020, 14, 7–22. [Google Scholar] [CrossRef]
  5. Mitręga, M.; Choi, T.-M. How small-and-medium transportation companies handle asymmetric customer relationships under COVID-19 pandemic: A multi-method study. Transp. Res. Part E 2021, 148, 102249. [Google Scholar] [CrossRef]
  6. Paul, T.; Chakraborty, R.; Anwari, N. Impact of COVID-19 on daily travel behaviour: A literature review. Transp. Saf. Environ. 2022, 4, c13. [Google Scholar] [CrossRef]
  7. CFLP. Report of China Logistics Development (2021–2022); China Fortune Press: Beijing, China, 2021. [Google Scholar]
  8. PRCSC. Modern Logistics Development Plan of the 14th Five-Year Plan; PRCSC: Beijing, China, 2022. [Google Scholar]
  9. Wen, L.; Hong, S. A Study of China’s New Urbanization, Logistics and Industrial Structure Based on the PVAR Model—The Yangtze River Economic Belt as an Example. J. Xinjiang Univ. (Philos. Humanit. Soc. Sci.) 2019, 47, 9–19. [Google Scholar] [CrossRef]
  10. Ting, W.; Fan, Z.; Xue, Z.X. The impact of logistics industry agglomeration in the Yangtze River Economic Belt on new urbanization. Stat. Decis. 2021, 37, 62–66. [Google Scholar] [CrossRef]
  11. Coe, N.M. Logistical geographies. Geogr. Compass 2020, 14, e12506. [Google Scholar] [CrossRef]
  12. Jun, Z.; Mei, S.Y.; Xiong, S.X. Urban Logistics Space Classification in the New Era. Urban Transp. China 2021, 19, 14–22. [Google Scholar] [CrossRef]
  13. Qi, L.L.; Guang, M.X. Pattern, Structure and Function of China’s Express Logistics Network Based on Waybill Data:A Case Study of ZJS Express. Sci. Geogr. Sin. 2019, 39, 89–97. [Google Scholar] [CrossRef]
  14. Ma, H.; Liu, J.; Zhao, X.; Zhang, B. A study of highway logistics transportation network structure in China: From the perspective of complex network. J. Data Inf. Manag. 2022, 4, 89–105. [Google Scholar] [CrossRef]
  15. Li, G.; Yang, L.; He, J.; Liu, Q.; Chen, X.; Xue, S. The Spatial Pattern and Organization Relation of the Pickup Points Based on POI Data in Xi’an: Focus on Cainiao Stations. Sci. Geogr. Sin. 2018, 38, 2024–2030. [Google Scholar] [CrossRef]
  16. Yaremovich, P.; Mykhailenko, D.; Smerichevska, S.; Andrushkevych, Z.; Tytykalo, V. Formation of the scientific paradigm of the transformation of potential-forming space and logistics platforms of the regional economy. Int. J. Comput. Sci. Net. 2021, 21, 288–294. [Google Scholar] [CrossRef]
  17. Fujita, M.; Krugman, P. The new economic geography: Past, present and the future. Pap. Reg. Sci. 2003, 83, 139–164. [Google Scholar] [CrossRef]
  18. Barilla, D.; Carlucci, F.; Cirà, A.; Ioppolo, G.; Siviero, L. Total factor logistics productivity: A spatial approach to the Italian regions. Transp. Res. Part A Policy Pract. 2020, 136, 205–222. [Google Scholar] [CrossRef]
  19. Yin, G. Research on Logistics Agglomeration and Regional Urbanization. Ph.D. Thesis, Hunan University, Changsha, China, 2020. [Google Scholar]
  20. Wang, R.; Ji, X.F.; Chen, F. Spatial spillover effect of logistics industry development on population urbanization and land urbanization. Urban Probl. 2019, 23–30. [Google Scholar]
  21. Wang, R. Study on the Influence of the Change of Urban Logistics Land on Urbanization and Its Spatial Differentiation. Master’s Thesis, Kunming University of Science and Technology, Kunming, China, 2020. [Google Scholar]
  22. Xue, J.Q.; Xie, Y.J.; Li, Z.H. Study on the Impact of New Logistics Infrastructure Construction on Innovation in the Commerce and Distribution Industry. Commer. Econ. Res. 2023, 5–8. [Google Scholar]
  23. Dablanc, L.; Rakotonarivo, D. The impacts of logistics sprawl: How does the location of parcel transport terminals affect the energy efficiency of goods’ movements in Paris and what can we do about it? Procedia—Soc. Behav. Sci. 2010, 2, 6087–6096. [Google Scholar] [CrossRef]
  24. Chettry, V.; Surawar, M. Assessment of urban sprawl characteristics in Indian cities using remote sensing: Case studies of Patna, Ranchi, and Srinagar. Environ. Dev. Sustain. 2021, 23, 11913–11935. [Google Scholar] [CrossRef]
  25. Sinha, S.K. Causes of urban sprawl: A comparative study of developed and developing world cities. Res. Rev. J. 2018, 3, 5–9. [Google Scholar]
  26. Seevarethnam, M.; Rusli, N.; Ling, G.H.T. Prediction of Urban Sprawl by Integrating Socioeconomic Factors in the Batticaloa Municipal Council, Sri Lanka. ISPRS Int. J. Geo-Inf. 2022, 11, 442. [Google Scholar] [CrossRef]
  27. Tao, Y.; Ye, R. Analysis of the Spatio-Temporal Characteristics of Nanjing’s Urban Expansion and Its Driving Mechanisms. ISPRS Int. J. Geo-Inf. 2022, 11, 406. [Google Scholar] [CrossRef]
  28. Heitz, A.; Dablanc, L.; Tavasszy, L.A. Logistics Sprawl In Monocentric And Polycentric Metropolitan Areas The Cases Of Paris, France And The Randstad. Region 2017, 4, 93–107. [Google Scholar] [CrossRef]
  29. Dablanc, L.; Ogilvie, S.; Goodchild, A. Logistics sprawl: Differential warehousing development patterns in Los Angeles, California, and Seattle, Washington. Transp. Res. Rec. 2014, 2410, 105–112. [Google Scholar] [CrossRef]
  30. Aljohani, K.; Thompson, R.G. Impacts of logistics sprawl on the urban environment and logistics: Taxonomy and review of literature. J. Transp. Geogr. 2016, 57, 255–263. [Google Scholar] [CrossRef]
  31. Dubie, M.; Kuo, K.C.; Giron-Valderrama, G.; Goodchild, A. An evaluation of logistics sprawl in Chicago and Phoenix. J. Transp. Geogr. 2020, 88, 102298. [Google Scholar] [CrossRef]
  32. Woudsma, C.; Jakubicek, P. Logistics land use patterns in metropolitan Canada. J. Transp. Geogr. 2020, 88, 102381. [Google Scholar] [CrossRef]
  33. Woudsma, C.; Jakubicek, P.; Dablanc, L. Logistics sprawl in North America: Methodological issues and a case study in Toronto. Transp. Res. Procedia 2016, 12, 474–488. [Google Scholar] [CrossRef]
  34. Heitz, A.; Dablanc, L. Logistics spatial patterns in Paris: Rise of Paris Basin as Logistics Megaregion. Transp. Res. Rec. 2015, 2477, 76–84. [Google Scholar] [CrossRef]
  35. Cidell, J. Concentration and decentralization: The new geography of freight distribution in US metropolitan areas. J. Transp. Geogr. 2010, 18, 363–371. [Google Scholar] [CrossRef]
  36. Kang, S. Relative logistics sprawl: Measuring changes in the relative distribution from warehouses to logistics businesses and the general population. J. Transp. Geogr. 2020, 83, 102636. [Google Scholar] [CrossRef]
  37. Kang, S. Why do warehouses decentralize more in certain metropolitan areas? J. Transp. Geogr. 2020, 88, 102330. [Google Scholar] [CrossRef]
  38. Guerin, L.; Vieira, J.G.V.; de Oliveira, R.L.M.; de Oliveira, L.K.; de Miranda Vieira, H.E.; Dablanc, L. The geography of warehouses in the São Paulo Metropolitan Region and contributing factors to this spatial distribution. J. Transp. Geogr. 2021, 91, 102976. [Google Scholar] [CrossRef]
  39. Klauenberg, J.; Elsner, L.; Knischewski, C. Dynamics of the spatial distribution of hubs in groupage networks—The case of Berlin. J. Transp. Geogr. 2020, 88, 102280. [Google Scholar] [CrossRef]
  40. Solís-Trapero, E.; Plaza-Tabasco, J.; Sánchez-Mateo, H.S.M. Recent Evolution of Logistic Spatial Patterns in Metropolitan Contexts: The Case of Madrilenian Urban Region. Rev. Estud. Andal. 2019, 37, 94–124. [Google Scholar] [CrossRef]
  41. Ji, X.F.; Wang, R.; Chen, F. Spatial-temporal evolution characteristics of urban logistics spread based on the logistics land panel data of 329 cities in China. Sci. Geogr. 2021, 41, 215–222. [Google Scholar]
  42. Giuliano, G.; Kang, S. Spatial dynamics of the logistics industry: Evidence from California. J. Transp. Geogr. 2018, 66, 248–258. [Google Scholar] [CrossRef]
  43. Heitz, A.; Beziat, A. The Parcel Industry in the Spatial Organization of Logistics Activities in the Paris Region: Inherited Spatial Patterns and Innovations in Urban Logistics Systems. Transp. Res. Procedia 2016, 12, 812–824. [Google Scholar] [CrossRef]
  44. Guo, S.W. Research on Spatial-temporal Evolution and Driving Mechanism of Logistics Land in Chongqing City. Master’s Thesis, Southwest University, Chongqing, China, 2017. [Google Scholar]
  45. Yuan, Q.; Zhu, J. Logistics sprawl in Chinese metropolises: Evidence from Wuhan. J. Transp. Geogr. 2019, 74, 242–252. [Google Scholar] [CrossRef]
  46. Liu, S.; Liu, Y.; Zhang, R.; Cao, Y.; Li, M.; Zikirya, B.; Zhou, C. Heterogeneity of Spatial Distribution and Factors Influencing Unattended Locker Points in Guangzhou, China: The Case of Hive Box. ISPRS Int. J. Geo-Inf. 2021, 10, 409. [Google Scholar] [CrossRef]
  47. Tao, L.; Cheng, X.X. Elements, Structure of Express Delivery Network and Their Spatial Pattern in Shanghai. Transp. Res. 2017, 3, 39–49. [Google Scholar] [CrossRef]
  48. Xiao, Z.; Yuan, Q.; Sun, Y.; Sun, X. New paradigm of logistics space reorganization: E-commerce, land use, and supply chain management. Transp. Res. Interdiscip. Perspect. 2021, 9, 100300. [Google Scholar] [CrossRef]
  49. Duan, L. Research on the Temporal and Spatial Differences of High Quality Development of China’s Logistics Industry: Based on the Panel Data of 30 Provinces in China from 2005 to 2017. Master’s Thesis, Zhongnan University of Economics and Law, Wuhan, China, 2021. [Google Scholar]
  50. Li, G.Q.; Jin, F.J.; Chen, Y.; Liu, S. Spatial patterns of logistics industry based on a geographic analysis of hotness degree. Prog. Geogr. 2015, 34, 629–637. [Google Scholar]
  51. Wu, H.M.; Wang, J.J. A Survey of the Theory and Practice about the Fourth Profit Source. Ind. Econ. Rev. 2013, 4, 92–100. [Google Scholar]
  52. Pal, A.; Kant, K. Internet of Perishable Logistics: Building Smart Fresh Food Supply Chain Networks. IEEE Access 2019, 7, 17675–17695. [Google Scholar] [CrossRef]
  53. Ferrell, W.; Ellis, K.; Kaminsky, P.; Rainwater, C. Horizontal collaboration: Opportunities for improved logistics planning. Int. J. Prod. Res. 2020, 58, 4267–4284. [Google Scholar] [CrossRef]
  54. Yan, Y.; Wang, X. Global Contraction and Local Strengthening of Firms’ Supply and Sales Logistics Networks in the Context of COVID-19: Evidence from the Development Zones in Weifang, China. ISPRS Int. J. Geo-Inf. 2021, 10, 477. [Google Scholar] [CrossRef]
  55. Yang, Y. The Study of Symbiosis Evolution between Logistics and Manufacturing Industries Evidence from Qinghai province. Ph.D. Thesis, Northwestern Polytechnical University, Xi’an, China, 2018. [Google Scholar]
  56. Montreuil, B.; Meller, R.D.; Ballot, E. In Towards a Physical Internet: The Impact on Logistics Facilities and Material Handling Systems Design and Innovation. In Proceedings of the 11th IMHRC Proceedings, Milwaukee, WI, USA, 21–24 June 2010. [Google Scholar]
  57. Raimbault, N.; Andriankaja, D.; Paffoni, E. Understanding the Diversity of Logistics Facilities in the Paris Region. Procedia—Soc. Behav. Sci. 2012, 39, 543–555. [Google Scholar] [CrossRef]
  58. Verlinde, S. Promising but Challenging Urban Freight Transport Solutions: Freight Flow Consolidation and Off-Hour Deliveries. Ph.D. Thesis, Vrije Universiteit Brussel, Brussel, Belgium, 2015. [Google Scholar]
  59. Kuse, H.; Endo, A.; Iwao, E. Logistics facility, road network and district planning: Establishing comprehensive planning for city logistics. Procedia—Soc. Behav. Sci. 2010, 2, 6251–6263. [Google Scholar] [CrossRef]
  60. Nuzzolo, A.; Comi, A. City Logistics Planning: Demand Modelling Requirements for Direct Effect Forecasting. Procedia—Soc. Behav. Sci. 2014, 125, 239–250. [Google Scholar] [CrossRef]
  61. van Rooijen, T.; Quak, H. City Logistics in the European CIVITAS Initiative. Procedia—Soc. Behav. Sci. 2014, 125, 312–325. [Google Scholar] [CrossRef]
  62. Dong, J.D. Research on the Integrated Planning and Layout of Urban Logistics Facilities and Freight Channels. Transp. Enterp. Manag. 2022, 37, 68–70. [Google Scholar]
  63. Wang, J.X. Urban Logistics Facility Planning and Policy Transition. Urban Plan. Int. 2022, 37, 1–3. [Google Scholar]
  64. Li, G.Q.; Shi, J.; Du, G.P.; Yang, J.X.; Liu, S.J. Public Logistics Facilities Planning in China’s Large Cities: Progress, Principles and Strategies. Urban Plan. Int. 2022, 37, 44–50. [Google Scholar]
  65. Liu, Y.; Wang, Y.; Ding, L. Research on Construction Path of National Logistics Hub Economic Demonstration Area for Wuhan. Logist. Technol. 2022, 41, 39–41. [Google Scholar]
  66. Tongji China Transportation Institute. Competitiveness of City Logistics in China(CCLC-2021); China Communications Press: Beijing, China, 2021. [Google Scholar]
  67. Available online: https://www.openstreetmap.org/ (accessed on 22 February 2024).
  68. Yang, H. Comprehensive Layout of Logistics Node Cities. China Investig. 2009, 64–65. [Google Scholar]
  69. Xu, S. The Material Flow. China Bus. Mark. 2007, 21, 7–10. [Google Scholar]
  70. Robichet, A.; Nierat, P. Consequences of logistics sprawl: Order or chaos?—The case of a parcel service company in Paris metropolitan area. J. Transp. Geogr. 2021, 90, 102900. [Google Scholar] [CrossRef]
  71. Wagner, T. Regional traffic impacts of logistics-related land use. Transp. Policy 2010, 17, 224–229. [Google Scholar] [CrossRef]
  72. Rocha, A.; Perobelli, F. Spatial distribution of logistics services in Brazil: A potential market analysis. Reg. Sci. Policy Pract. 2019, 12, 185–217. [Google Scholar] [CrossRef]
  73. Gang, L.; Weiyu, C.; Lan, Y. Spatial pattern and agglomeration mode of parcel collection and delivery points in Wuhan City. Prog. Geogr. 2019, 38, 407–416. [Google Scholar] [CrossRef]
  74. Holl, A.; Mariotti, I. The Geography of Logistics Firm Location: The Role of Accessibility. Netw. Spat. Econ. 2018, 18, 337–361. [Google Scholar] [CrossRef]
  75. Sakai, T.; Kawamura, K.; Hyodo, T. Logistics facilities for intra and inter-regional shipping: Spatial distributions, location choice factors, and externality. J. Transp. Geogr. 2020, 86, 102783. [Google Scholar] [CrossRef]
  76. Villa, R.; Monzón, A. Mobility restrictions and E-commerce:holistic balance in Madrid centre during COVID-19 lockdown. Economies 2021, 9, 57. [Google Scholar] [CrossRef]
  77. Strale, M. Logistics sprawl in the Brussels metropolitan area: Toward a socio-geographic typology. J. Transp. Geogr. 2020, 88, 102372. [Google Scholar] [CrossRef]
  78. Bowen, J.T. Moving places: The geography of warehousing in the US. J. Transp. Geogr. 2008, 16, 379–387. [Google Scholar] [CrossRef]
  79. Beckers, J.; Vanhoof, M.; Verhetsel, A. Returning the particular: Understanding hierarchies in the Belgian logistics system. J. Transp. Geogr. 2019, 76, 315–324. [Google Scholar] [CrossRef]
  80. Sakai, T.; Kawamura, K.; Hyodo, T. Locational dynamics of logistics facilities: Evidence from Tokyo. J. Transp. Geogr. 2015, 46, 10–19. [Google Scholar] [CrossRef]
  81. Browne, M.; Allen, J.; Nemoto, T.; Patier, D.; Visser, J. Reducing Social and Environmental Impacts of Urban Freight Transport: A Review of Some Major Cities. Procedia—Soc. Behav. Sci. 2012, 39, 19–33. [Google Scholar] [CrossRef]
  82. Taniguchi, E. Concepts of City Logistics for Sustainable and Liveable Cities. Procedia-Soc. Behav. Sci. 2014, 151, 310–317. [Google Scholar] [CrossRef]
  83. de Oliveira, L.K.; Oliveira, B.R.P.E.; de Assis Correia, V. Simulation of an Urban Logistic Space for the Distribution of Goods in Belo Horizonte, Brazil. Procedia—Soc. Behav. Sci. 2014, 125, 496–505. [Google Scholar] [CrossRef]
  84. Jiao, H.; Yang, F.; Xu, S.; Huang, S. Using Large-Scale Truck Trajectory Data to Explore the Location of Sustainable Urban Logistics Centres—The Case of Wuhan. Isprs Int. J. Geo-Inf. 2023, 12, 88. [Google Scholar] [CrossRef]
Figure 1. Geographic location of Wuhan city (Area 1–7 are the rural areas of Wuhan, the others are suburban areas. The map of China is from the Ministry of Natural Resources, while others are drawn by the author).
Ijgi 13 00082 g001
Figure 2. The research process and framework of this study.
Ijgi 13 00082 g002
Figure 3. Spatial distribution of LSNFs’ kernel density in Wuhan for 2011, 2014, 2017, and 2020.
Ijgi 13 00082 g003
Figure 4. ANNI of Various LSNFs in Wuhan for 2011, 2014, 2017, and 2020.
Ijgi 13 00082 g004
Figure 5. Average center changes of LSNFs in Wuhan for 2011, 2014, 2017, and 2020.
Ijgi 13 00082 g005
Figure 6. Distribution frequency of LSNFs from the city center in Wuhan for 2011, 2014, 2017, and 2020.
Ijgi 13 00082 g006
Figure 7. Distance Changes of LSNFs from major roads in Wuhan for 2011, 2014, 2017, and 2020.
Ijgi 13 00082 g007
Figure 8. The distance distribution of relative frequencies between LSNFs and PS in Wuhan for 2011, 2014, 2017, and 2020.
Ijgi 13 00082 g008
Figure 9. Distance distribution of relative frequencies between LSNFs and CSs in Wuhan for 2011, 2014, 2017, and 2020.
Ijgi 13 00082 g009
Figure 10. Comparison of distance-varying flows between LSNFs and PS or CS in Wuhan.
Ijgi 13 00082 g010
Table 1. LSNFs Classification.
KeywordsLogistics FunctionService AreaCategorized and Short Form
Base,
Park,
Center,
Warehousing,
Headquarters.
This category represents logistics bases, logistics parks, and other large-scale warehousing facilities and their headquarters of the agglomeration area, often close to transportation hubs, to undertake inter-regional or intra-city logistics transit, exchange, and connectivity.International, national, or regionalCWC:
Comprehensive Warehouse Center
Branch,
Transshipment,
Warehouse,
Dedicated Line.
This category represents the distribution centers such as the branches and transshipment centers of logistics enterprises, which have the important function of connecting the upper and lower logistics nodes to ensure the circulation of goods in transit.National or regionalSTN:
Storage and
Transit
Node
Collection and Delivery,
Sales Department,
Post Office,
Distribution
Station.
This category represents service nodes that serve local businesses, residents, etc. for the purpose of sorting, loading, unloading, and distributing goods.Intra-city or localPDN:
Patch Distribution Node
Storage Cabinet,
Post Station,
Express Pickup Point, Service Station.
This category represents the “last mile of logistics service” node, which is the final link to complete the logistics service.Intra-city or localPSN:
Pickup
Service
Node
Disclaimer/Publisher’s Note: The statements, opinions and data contained in all publications are solely those of the individual author(s) and contributor(s) and not of MDPI and/or the editor(s). MDPI and/or the editor(s) disclaim responsibility for any injury to people or property resulting from any ideas, methods, instructions or products referred to in the content.

