1. Introduction
Currently, there is a growing societal and national focus on the upbringing and development of the future workforce. As children are expected to constitute the primary labor force for decades to come, this social evolution has imposed heightened demands on the creation of spaces tailored to meet children’s needs [
1]. Consequently, numerous scholars have initiated research on children’s spaces, presenting various experiences and strategies for constructing child-friendly cities [
2,
3,
4,
5].
The significance of constructing children’s facilities within the basic spatial units of communities in urban areas is emphasized in United Nations reports. These reports indicate that urban planning has started to adjust its strategies, with a focus on social equity, people-centered decision making, and the impact of the built environment on children [
6,
7]. Hangzhou, located in the southeast of China, has emerged as a pioneer in child-friendly construction, being one of the initial pilot cities, in this respect, in China. Currently, there are 60 demonstration “children’s homes” located in various townships or streets within Hangzhou. Additionally, the city has developed a series of plans regarding children’s spaces.
Accessibility [
8,
9] can be defined as the relative ease with which the locations of facilities can be reached from a given point, taking into account factors such as distance, time, and associated costs. Spatial equity [
10,
11] reflects the fair distribution of resources within a region. The accessibility metric can serve as an inspiring indicator for measuring the effectiveness and equity of urban facilities. Examining the accessibility and equity of children’s spaces at the community scale can provide a scientific foundation for the government and relevant departments to execute child-friendly city construction with greater precision.
Currently, there is a significant amount of research available on the accessibility of children’s spaces, with a primary focus on several key aspects [
12]. Firstly, regarding transportation, the accessibility of children’s spaces is greatly influenced by various modes of travel, particularly, walking or cycling, as well as traffic safety. Schools serve as the main destinations for children’s daily travel. Notably, comprehensive research and practical implementations related to children’s travel routes, including walking to school or utilizing school buses, have been conducted in countries such as the United States and New Zealand [
13,
14]. These initiatives provide valuable insights for enhancing the accessibility of children’s educational spaces.
Public green spaces play a crucial role as venues for children’s outdoor activities, promoting their physical and mental health development [
15,
16]. Current research on the relationship between green spaces and children primarily focuses on the correlation between the accessibility of green spaces and children’s behavioral patterns and cognitive abilities, as demonstrated by studies conducted by Reyes et al. [
17] and Fernandes et al. [
18].
Furthermore, in alignment with the United Nations’ Urban Development Goal [
7], it is essential for children to reside in healthy, safe, inclusive, green, and thriving communities. The community represents a vital spatial unit for establishing a child-friendly city and serves as an ideal setting for children’s daily activities. As a result, the community serves as a primary entry point for research in this field. Chen et al. [
19] examined various types of communities, while Wang et al. [
20] conducted research specifically on the accessibility and usability of children’s spaces within the distinct area of hutongs. Consistent with other studies, these findings indicate the existence of diverse types of children’s spaces within the reachable range of a community, highlighting the need for sensible planning to mitigate the limitations on children’s activities to some extent [
21].
With the advancement of technology and the availability of data, researchers have utilized methods such as GIS and travel surveys to analyze the accessibility of children’s spaces. Scholars typically focus on specific children’s service facilities. Currently, isochrone methods and two-step floating catchment area (2SFCA) analysis are widely employed in specialized studies on children’s spaces, including children’s hospitals and preschool education facilities. Accessibility analysis is conducted to examine spatial equity and propose corresponding improvement measures [
22,
23,
24].
In general, a substantial amount of research has been devoted to exploring the accessibility of children’s spaces, covering aspects such as children’s mobility and community resources [
17,
19,
24,
25]. Currently, research on children’s space accessibility primarily concentrates on investigating the effects of factors such as transportation modes, geographical location, community facilities, and household composition on the proximity of children’s spaces. While some scholars have studied specific types of children’s space planning, such as green spaces in children’s environments, there is a lack of research that incorporates GIS technology to explore spatial equity and employs indicators such as spatial accessibility to evaluate and design spatial layout characteristics. The utilization of analysis based on mobile internet big data to explore the accessibility attributes of various types of children’s spaces at the community level, illuminating the spatial layout of children’s spaces, remains scarce.
In order to address these research gaps, this study employs GIS spatial analysis techniques and considers accessibility and supply–demand matching to calculate the spatial accessibility of different types of children’s facilities and communities in the urban area of Hangzhou city under various travel modes. Simultaneously, the convenience level of community residents is examined, with the urban area of Hangzhou city as the research area. Our study aims to address the following two questions: (1) How is the spatial equity of children’s spaces at the community scale? (2) What are the characteristics of the children’s space pattern in the urban area of Hangzhou city? By addressing these research questions, this paper ultimately reveals the spatial equity of children’s space resources in Hangzhou city’s communities. Furthermore, this study also seeks to optimize and allocate children’s facilities in the urban area, providing scientific recommendations for building child-friendly cities.
3. Results
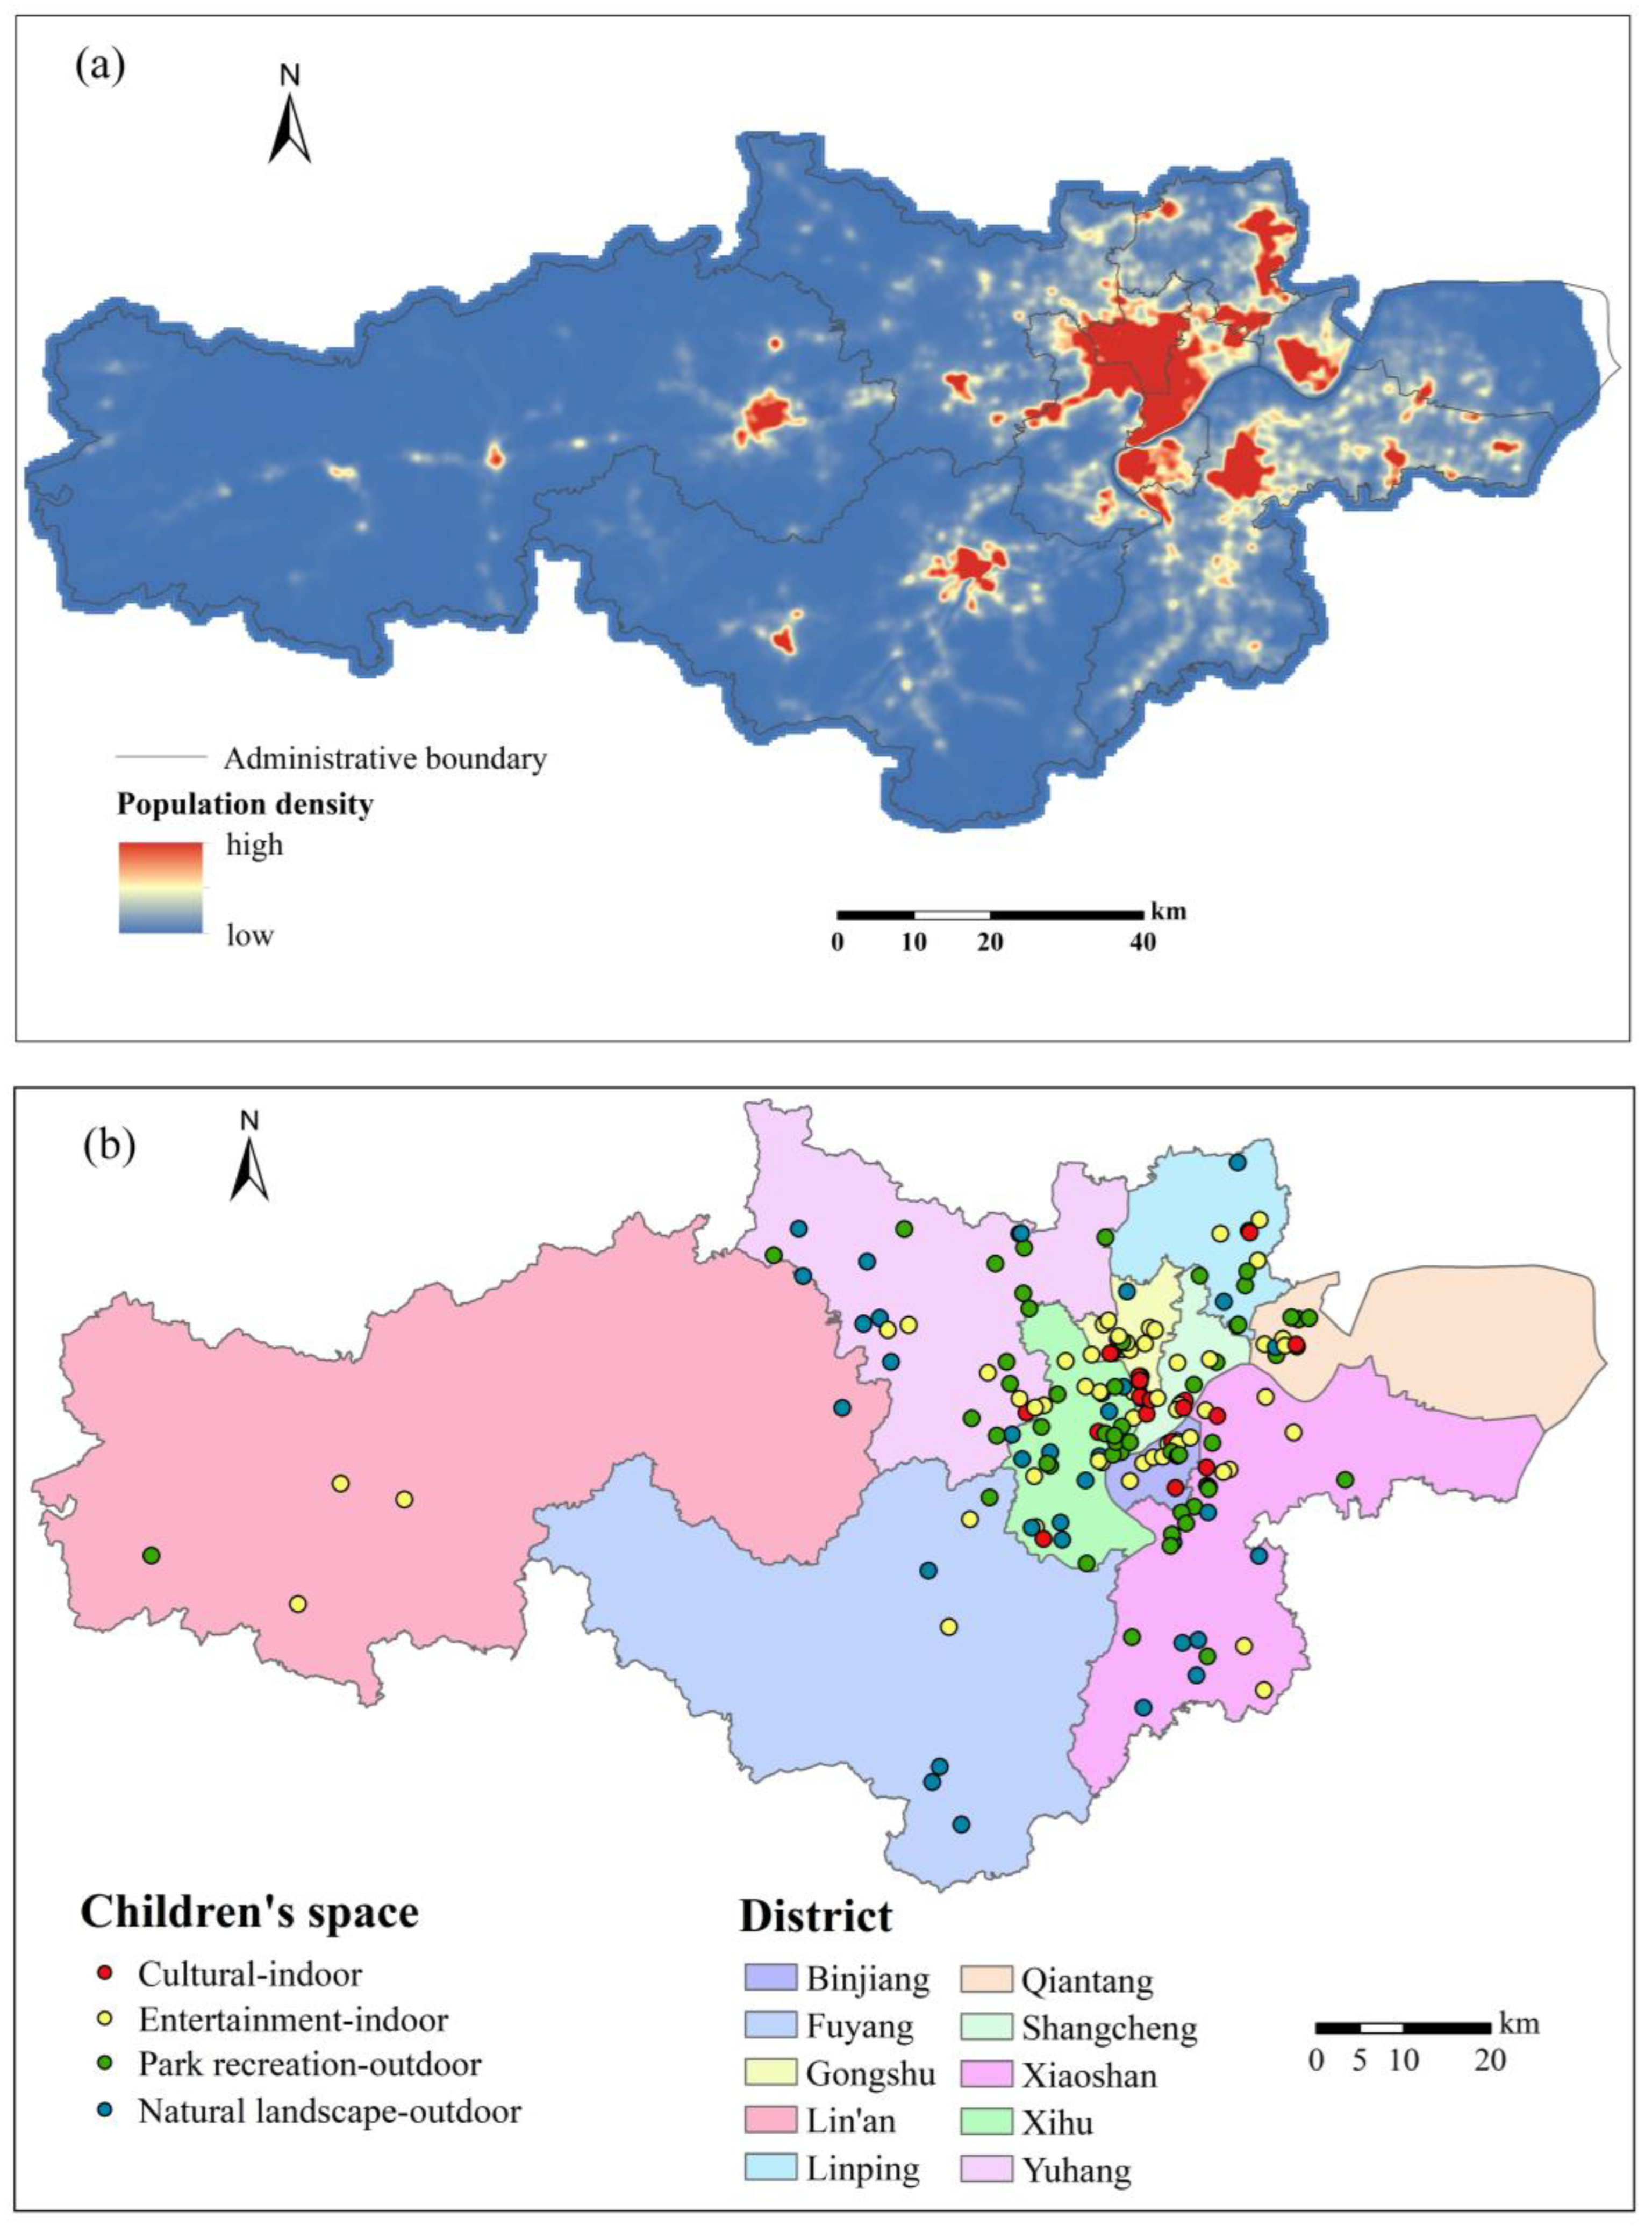
3.1. Spatial Distribution Characteristics of Children’s Spaces in Hangzhou
The spatial distribution characteristics of children’s spaces in urban areas can serve as an indicator of the equity of community child space resources.
Figure 1a illustrates the overall population density pattern, which exhibited high density in the city center (core area), low density at the periphery, and a decreasing population density radiating outward from multiple points. In Hangzhou’s urban area, the northeastern region demonstrated significantly higher population density compared to the western part. This variation can be attributed to factors such as physical geography and human elements. The core area, located in the northeastern region, benefits from more favorable natural geographic conditions compared to the suburbs. Additionally, differences in historical urban planning policies, distribution of social resources, and transportation development have contributed to spatial disparities in population density within Hangzhou [
29]. The core area comprises small communities with dense populations, while the southwestern and central parts of Xihu District predominantly consist of communities with populations below 3500 people. Gongshu District, on the other hand, is the most densely populated administrative district, with all communities having populations exceeding 9000 people.
Figure 1b demonstrates the distribution of children’s spatial facility points, displaying a high density in the city center, which gradually decreases radially from the center outward. The core area exhibited a greater number of children’s spatial facility points, aligning with the spatial distribution trend of the population in Hangzhou’s urban area. The distribution of indoor and outdoor children’s spatial facilities appeared relatively balanced, indicating equitable resource allocation (
Table 2). As the city center typically serves as the core commercial district with a stronger economic foundation, the development of children’s spaces is comparatively more advanced there, reflecting the planned layout of a child-friendly city in Hangzhou. However, outdoor park facilities and natural spaces are relatively scarce in the city center compared to other urban areas.
Conversely, indoor entertainment and cultural facilities demonstrated a higher quantity in the city center, particularly indoor cultural facilities. The distribution pattern of indoor and outdoor facilities differed due to the rapid urbanization and the dense concentration of buildings, which have somewhat limited the development of outdoor children’s spaces in the city center. Indoor entertainment facilities (e.g., parent–child restaurants, parent–child hotels, indoor amusement parks) and indoor cultural facilities (e.g., children’s exhibition halls, parent–child libraries) are often located in busy areas with high population mobility as they are commercial in nature. This corresponds to the population distribution pattern within Hangzhou’s urban area. In Xihu District’s Xihu Scenic Area, Xiaoshan District, and Yuhang District, the development of outdoor children’s spaces has progressed more rapidly and matured compared to other urban areas, owing to the presence of natural landscapes.
3.2. Evaluation of Children’s Spatial Accessibility
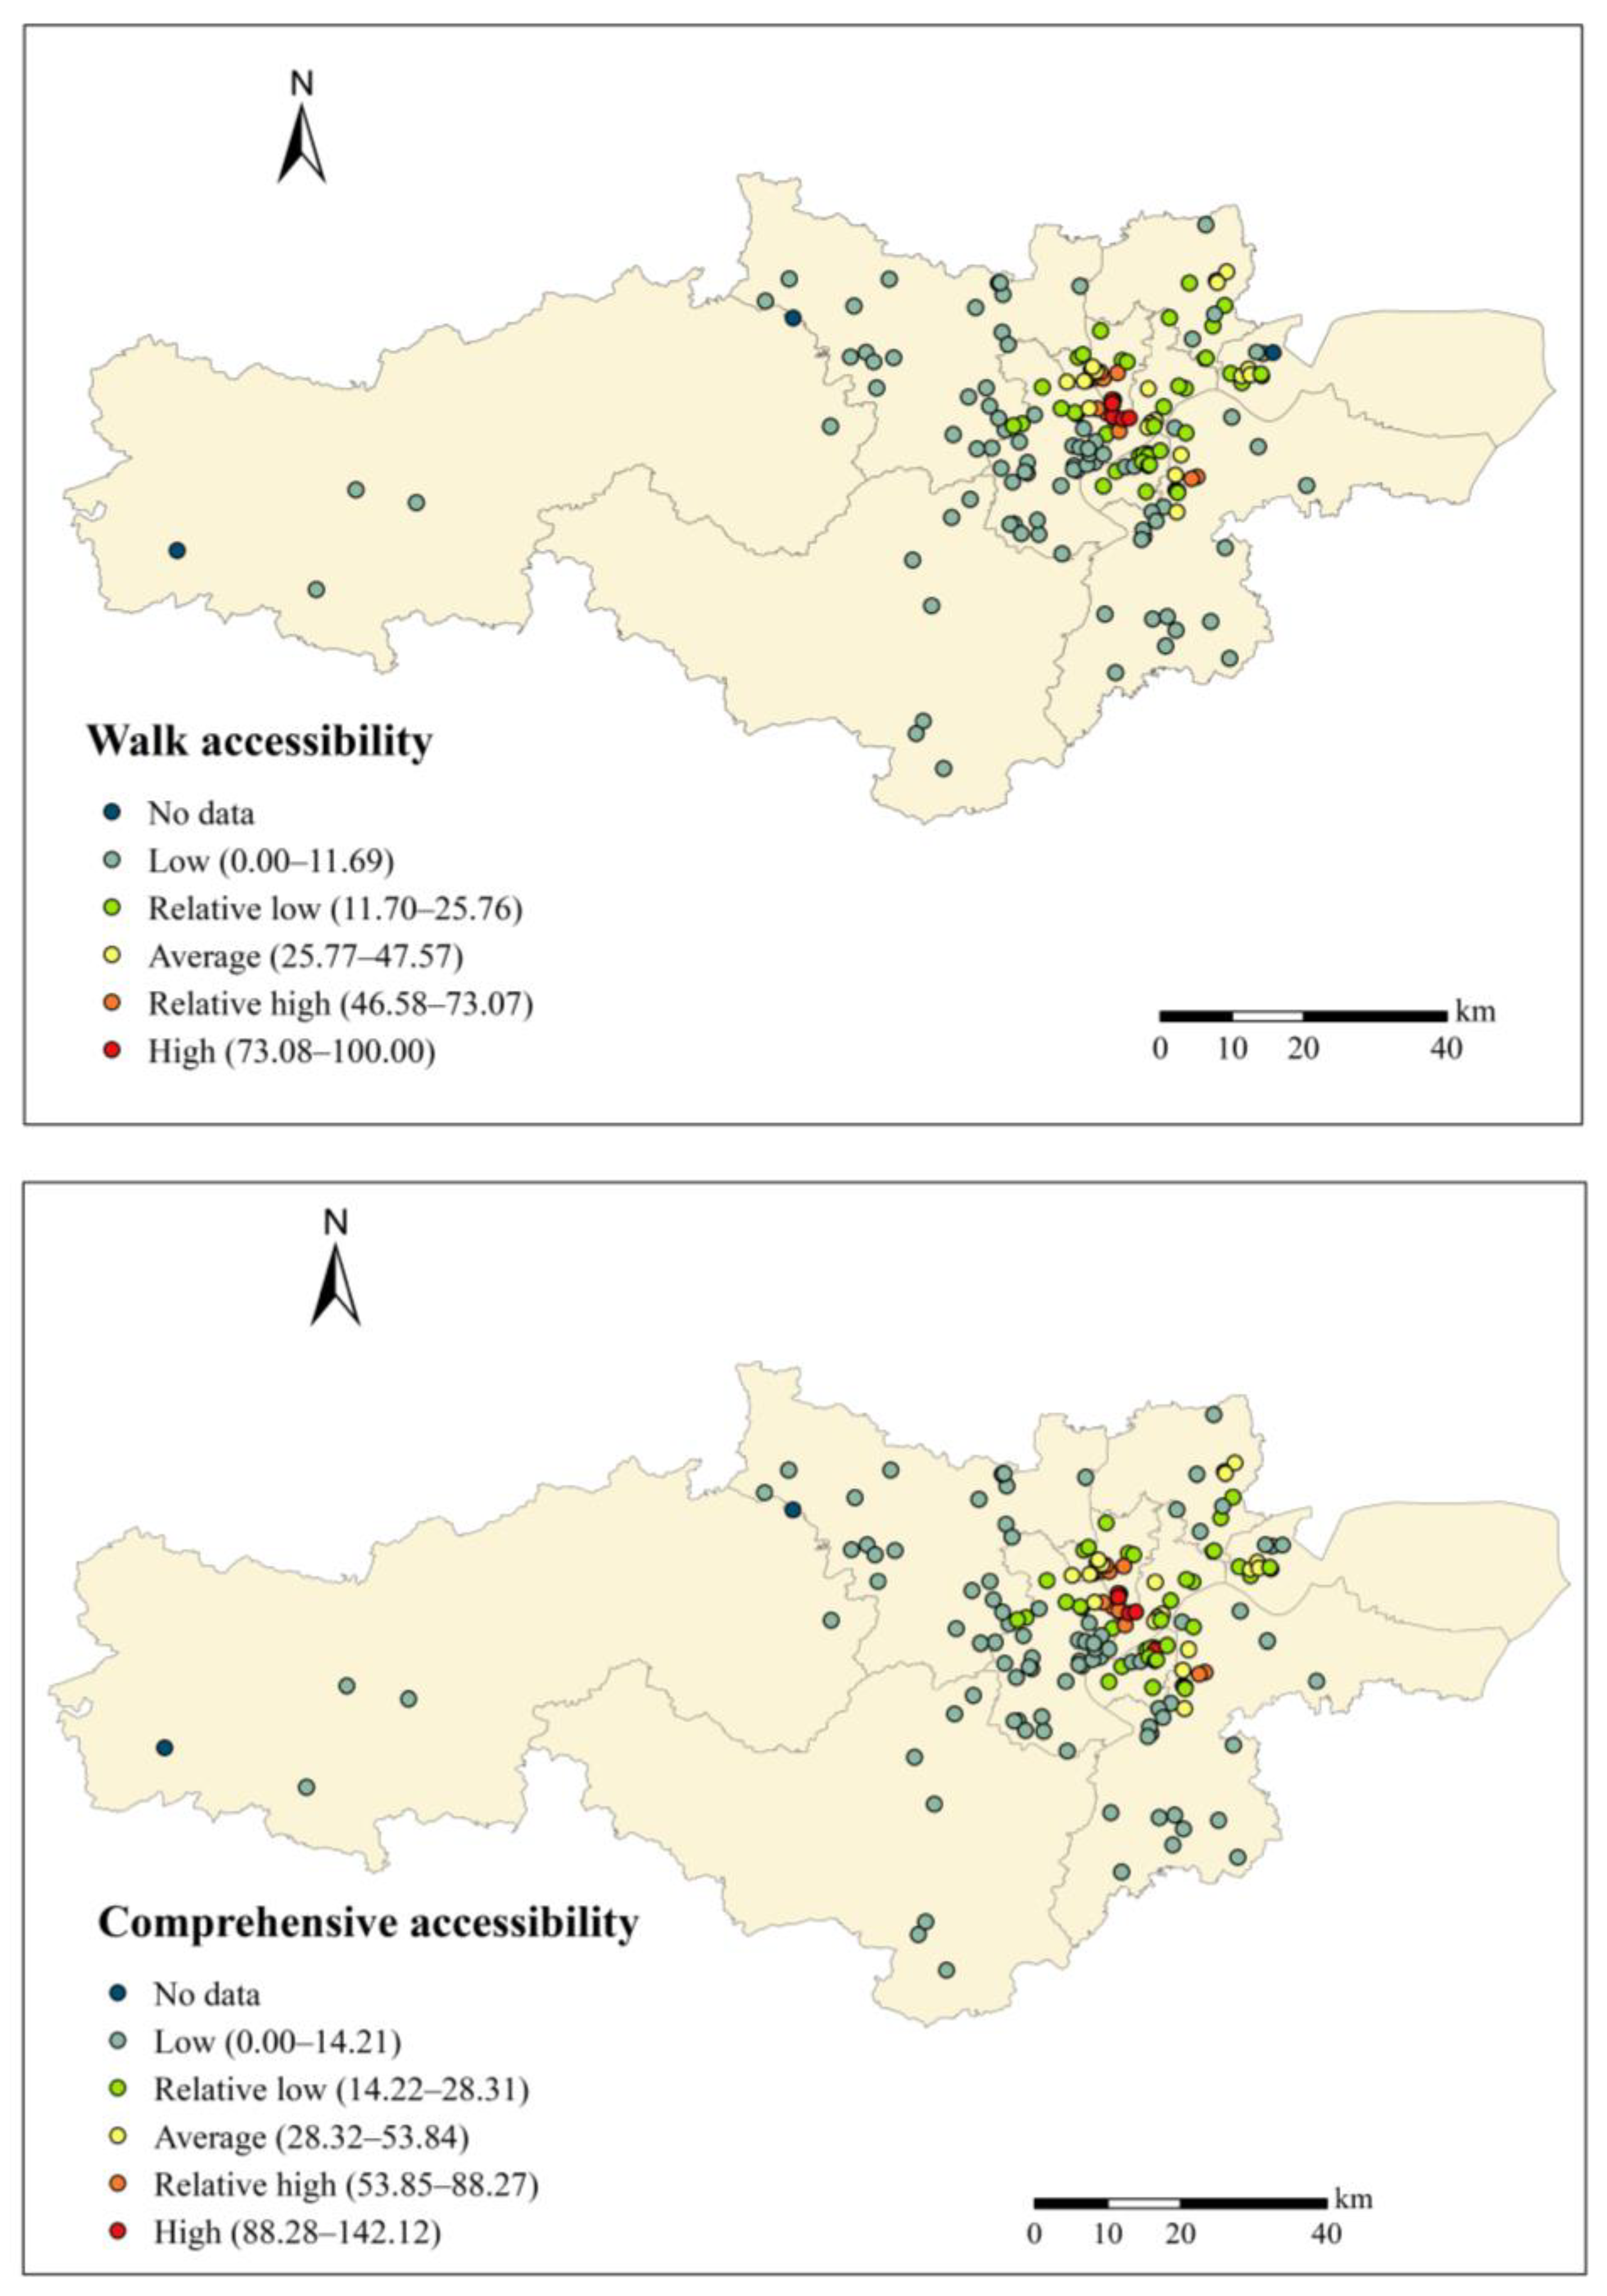
Children’s space plays a crucial role in the development of child-friendly cities and served as the primary focus of this research. By considering children’s space facility points as demand centers and community points as supply centers, accessibility results were calculated.
Figure 2 illustrates the spatial equity in the accessibility results based on different travel modes. Within a threshold range of 3200 m and among 176 children’s space facility points, at least one community was found to have access to 174 facilities. The average walking accessibility level was 21.01, with a standard deviation of 24.14, indicating significant disparities in the equity of children’s space facilities. The walking accessibility of children’s space facility points in Hangzhou’s urban area demonstrated higher accessibility in the northeast and lower accessibility in the southwest, gradually decreasing from the city center towards the periphery. The indoor entertainment facilities located in Gongshu District exhibited the highest walking accessibility. In the core area, particularly in Gongshu District, the accessibility level was generally higher compared to other districts, indicating a greater equity of children’s spaces in the core area than in other regions.
To obtain a comprehensive accessibility level for children’s spaces, the walking and driving accessibility results corresponding to walking and driving travel modes were combined, normalized, and classified (
Table 3). The distribution of the comprehensive accessibility level for children’s space facility points revealed a decreasing trend from the city center towards the periphery. Overall, the accessibility of children’s space facility points was relatively low. Indoor cultural and indoor entertainment facilities had significantly better accessibility compared to the two outdoor categories. Among them, cultural facilities for children’s spaces demonstrated the highest average accessibility. This suggests that exhibition halls and children’s bookstores in Hangzhou have extensive service coverage and better spatial equity.
3.3. Comprehensive Evaluation of Children’s Spaces at the Community Scale
As a basic unit of the city, community spaces play a crucial role in assessing the accessibility and convenience of children’s spaces at the community scale. This evaluation helps measure the spatial equity and rational layout of children’s spaces.
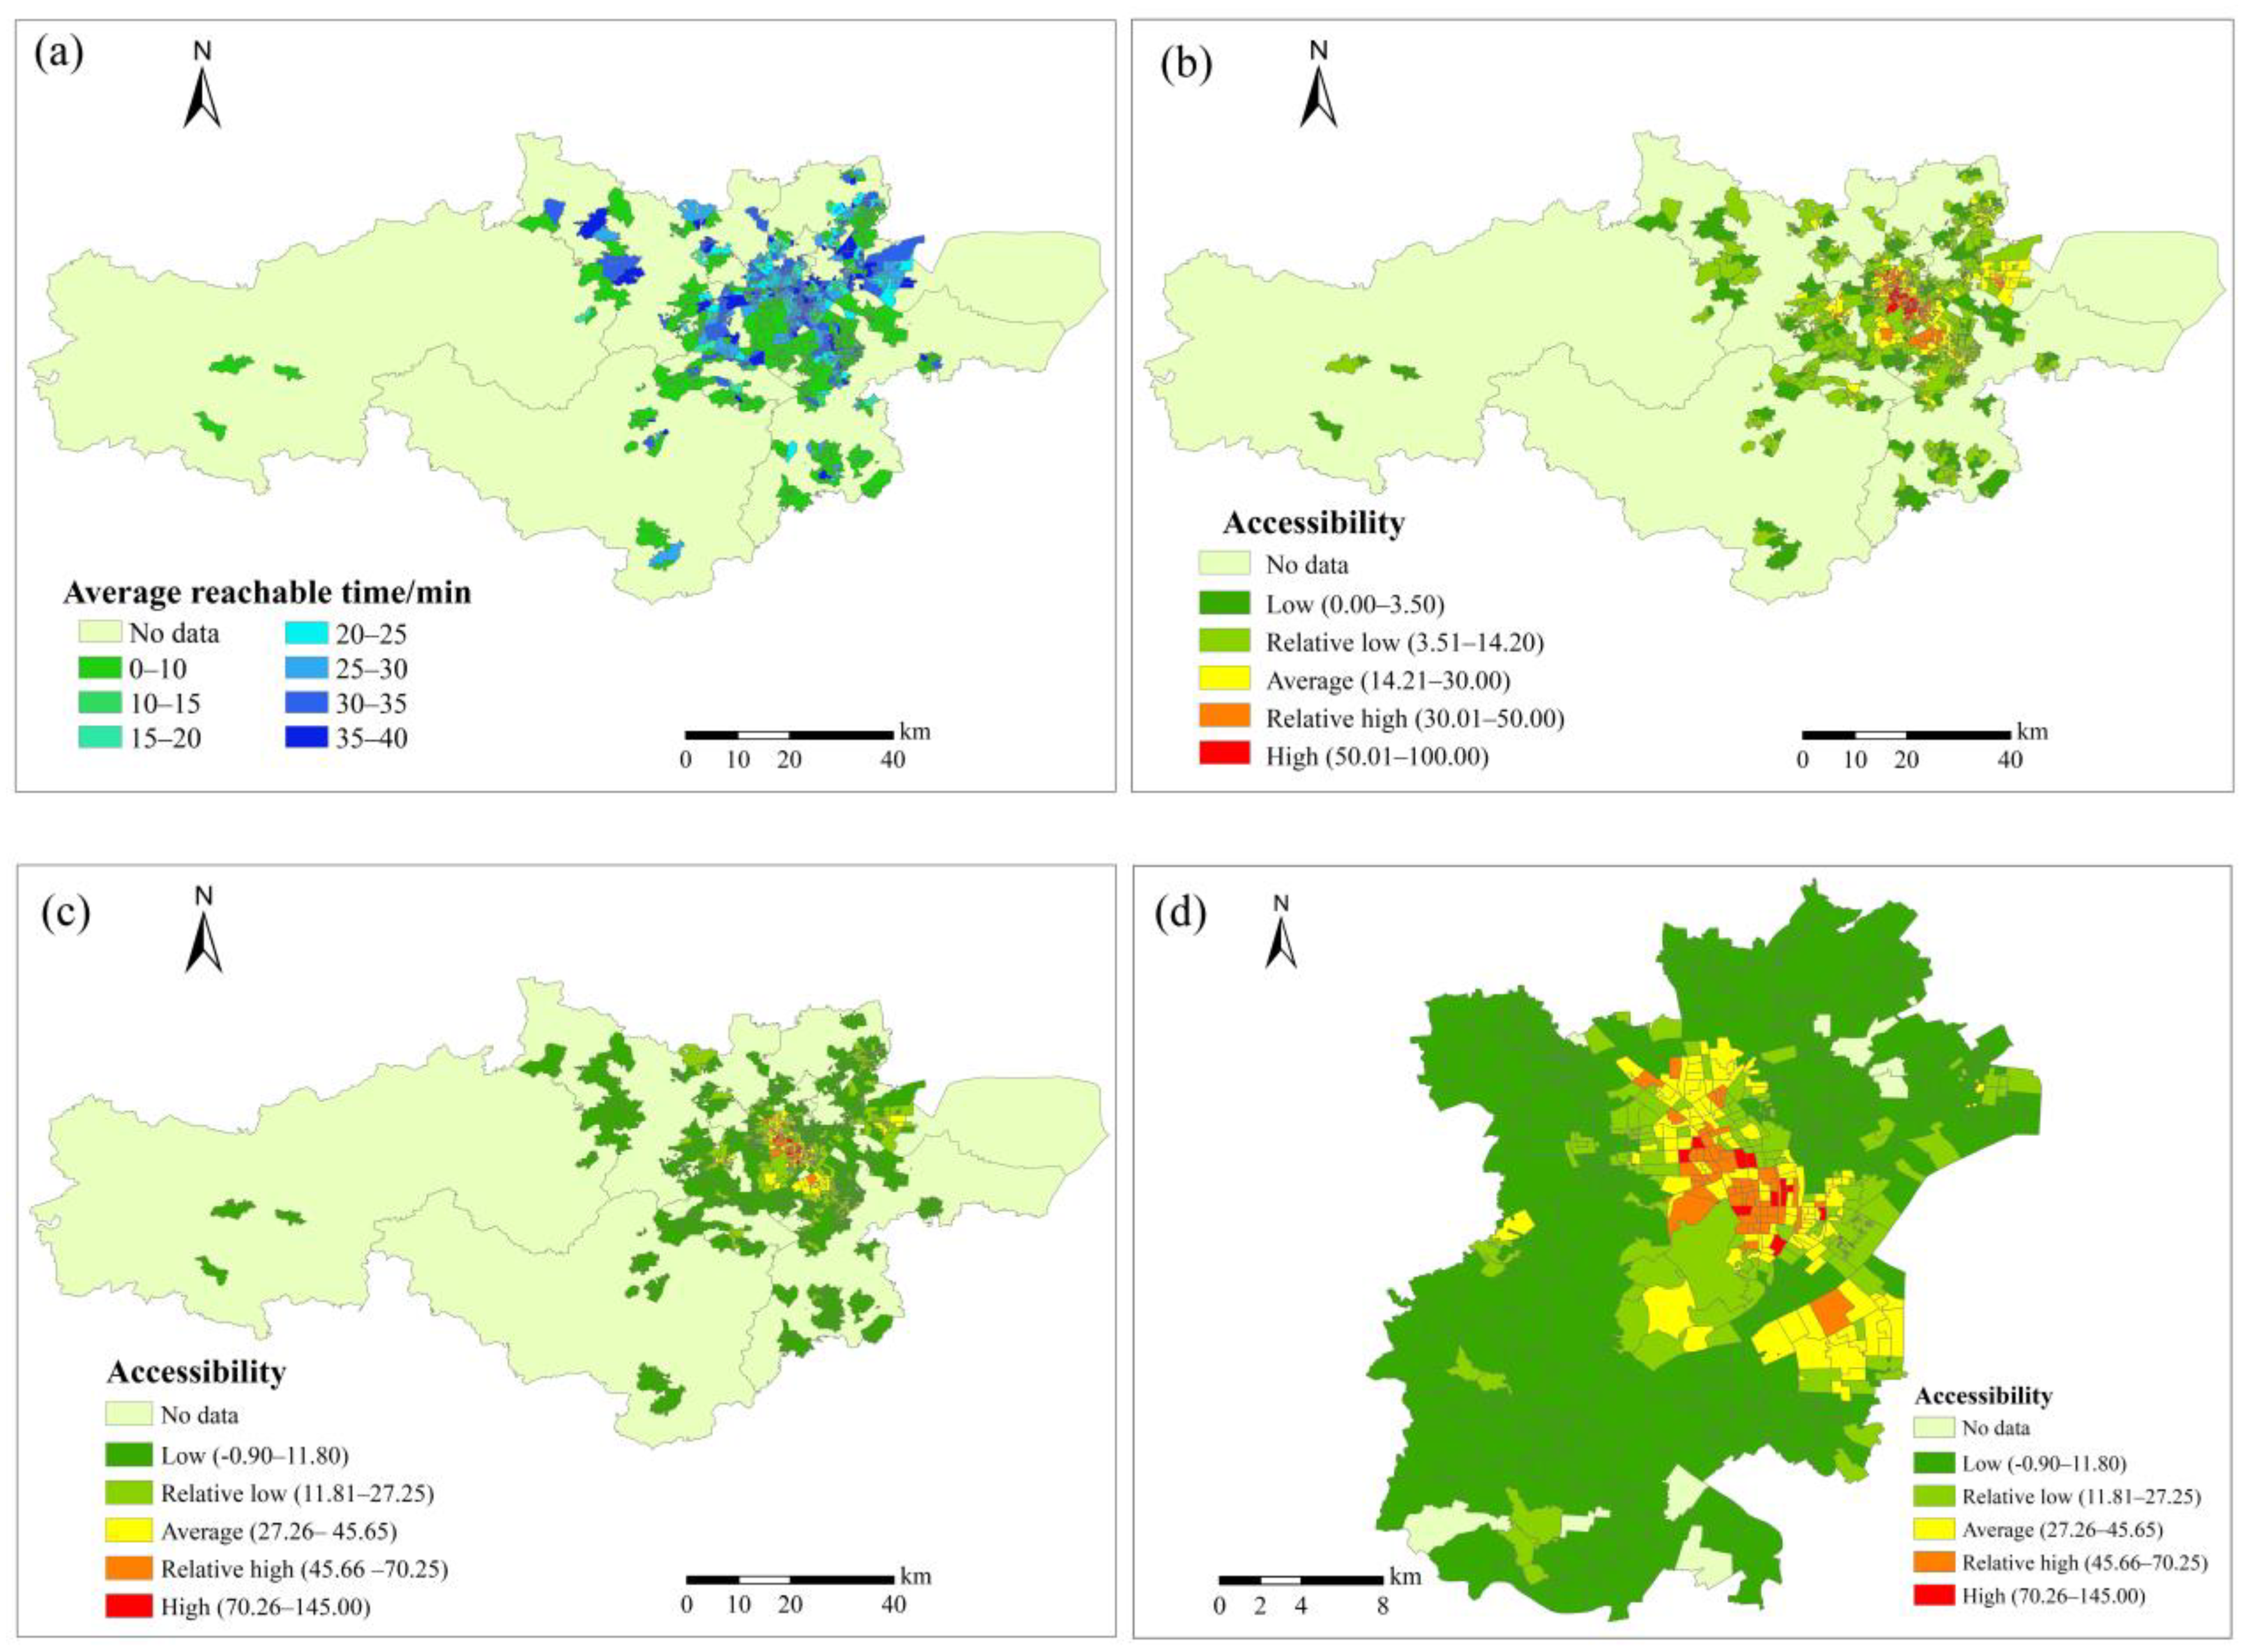
To begin with, the average travel time required for pedestrians from each community center to all reachable children’s spaces was calculated based on the travel time, with a 5 min interval and an upper limit of 40 min. Meanwhile, the accessibility level of pedestrian access and the overall accessibility level of the community were determined using the same method as that for children’s space accessibility (
Figure 3). The average pedestrian travel time in communities showed a radial increase towards the city center. In Hangzhou’s urban area, over 70% of the communities appeared to have poor accessibility to children’s spaces. Communities with measurable average pedestrian travel time were found to be mainly concentrated in the city center and the western part of Qiantang District. In areas outside the city center, communities with children’s spaces either inside or nearby were primarily within a 10 min walking distance. It can be observed that the average pedestrian travel time in communities in the city center was significantly higher than in other administrative districts, indicating a higher fairness of community resources in this area. This may be attributed to the smaller size of the communities in the city center, denser road networks, and a larger number of children’s spaces within a 40 min walking distance, resulting in a longer average travel time on foot.
Regarding pedestrian accessibility, we found a total of 912 communities within walking reach in Hangzhou’s urban area, with 46 communities having a high level of accessibility, accounting for 5.04%, and 408 communities having a low level of accessibility, accounting for 44.74%. Communities with high or relatively high pedestrian accessibility levels appeared mainly located in the core area and the western part of Qiantang District. Particularly, the northern part of Xihu District and the southern part of Gongshu District exhibited the highest accessibility levels. In contrast, the overall pedestrian accessibility levels in other administrative districts were significantly lower than those in the core area.
After considering multiple transportation modes, the number of communities with effective accessibility levels within the study area significantly increased, and the distribution trend aligned with that in communities with high pedestrian accessibility. This indicated that the newly added accessible and effective communities were more prone to reach children’s spaces by car. However, fewer communities had high accessibility levels compared to those with children’s spaces accessible by walking. The three communities with the highest accessibility level were Yaoyuan Sixiang Community in Xiaoying Street in Shangcheng District, Hongling Community in Caihe Street, and Chaoming Street in Gongshu District. Except for the city center, the accessibility levels in other areas were generally low or relatively low, with low-accessibility communities scattered widely. This indicated significant disparities in the fairness of distribution of children’s space facilities at the community scale, particularly between core and non-core areas. These differences arose because non-core areas accounted for a larger proportion of the total area, and there, children’s spaces were found to be sparsely distributed and thus challenging to reach by walking or at a distance exceeding the driving threshold range. Conversely, the core urban area appeared smaller in size and with a high concentration of children’s spaces, which resulted in significantly higher accessibility levels for the communities compared to those in non-core areas, consistent with the characteristics of children’s space accessibility.
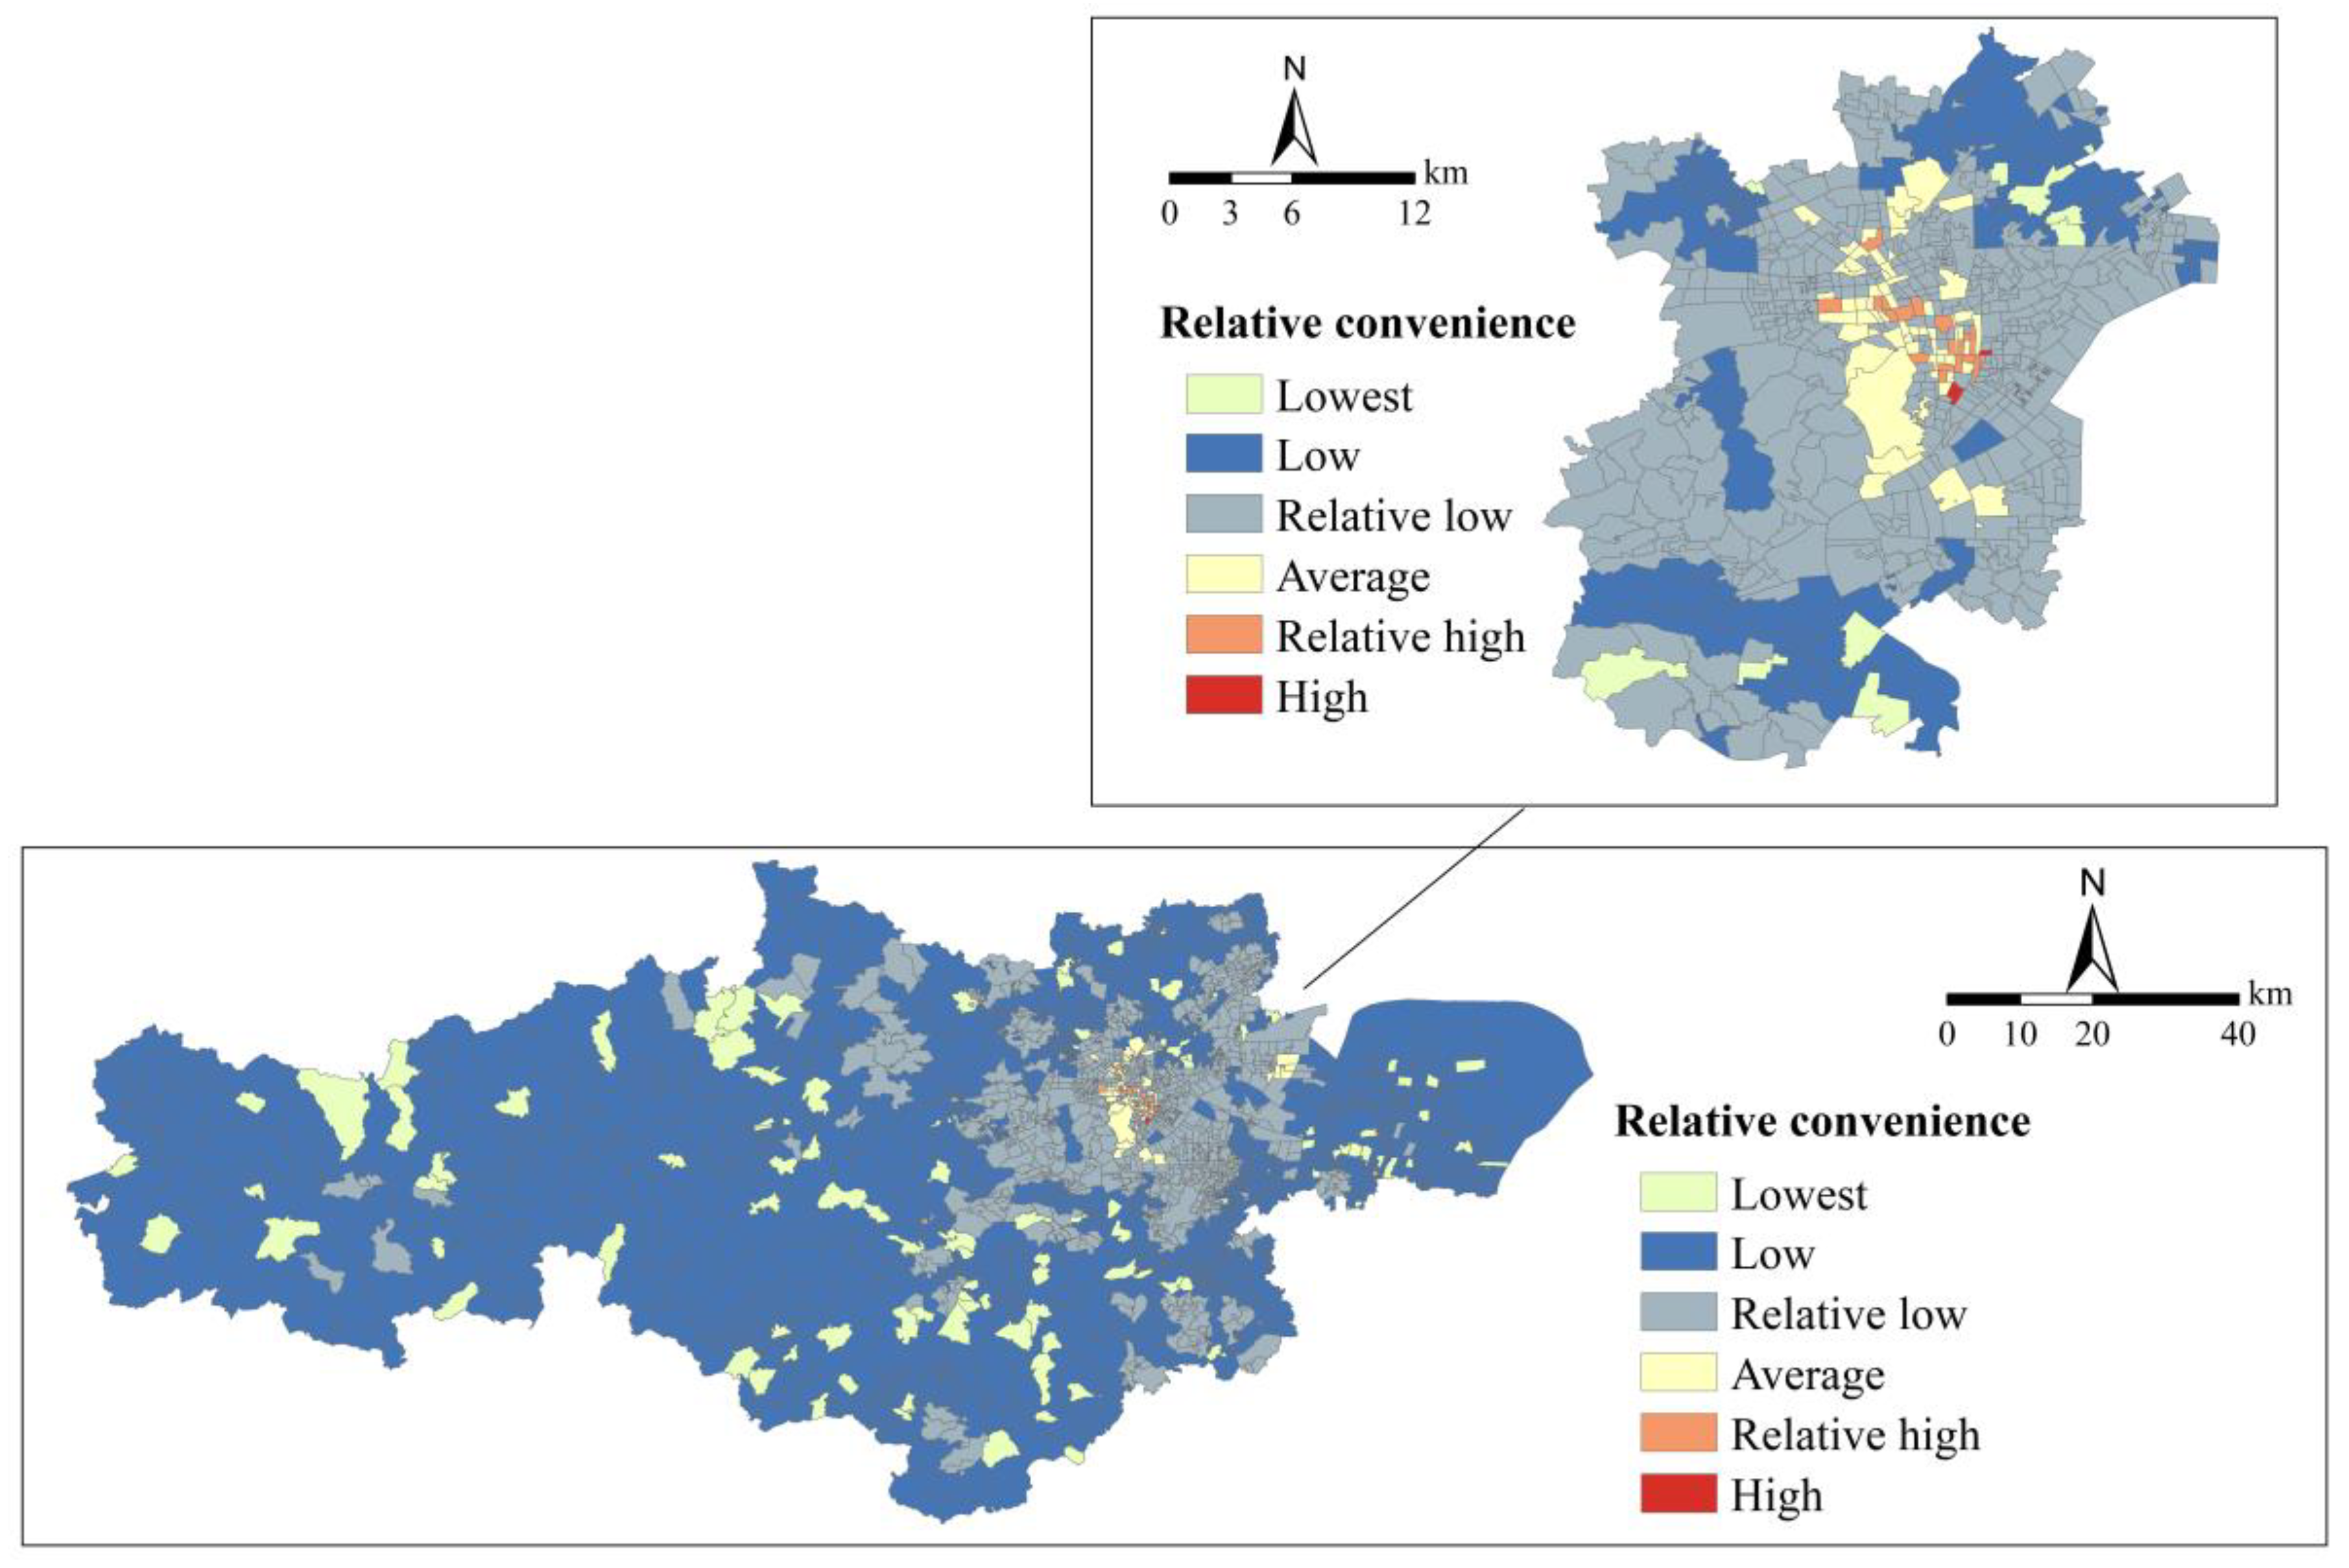
To provide a comprehensive evaluation of community accessibility, this study introduced the concept of relative convenience. The relative convenience index, as shown in
Figure 4, was used to assess the match between the community’s accessibility level and the population demand. A low value of relative convenience indicates a great mismatch between accessibility and population demand. The results indicated that the relative convenience of the communities was primarily low, with only a few communities exhibiting high relative convenience. There was a decreasing trend moving out from the city center. Extremely low relative convenience indicates a significant mismatch between accessibility levels and population demand, leading to poor service quality and equity issues. The statistical analysis revealed that 58.70% of the communities had a low-level relative convenience, indicating a substantial mismatch between accessibility levels and population demand in over half of the communities. The communities with moderate or high relative convenience accounted for only 0.93% of all communities and appeared to be concentrated in the core urban area. Furthermore, the communities with qualified relative convenience demonstrated a southwest-to-northeast distribution pattern. This suggests that when considering population factors using precise and data-oriented methods, the accessibility level of community children’s spaces in Hangzhou was further reduced. Therefore, there is an urgent need to increase the construction of children’s spaces in these areas.
4. Discussion
Equity in the accessibility of children’s spaces holds significant importance in the development of child-friendly cities. The proposed accessibility metric can serve as an inspiring indicator for measuring the effectiveness and equity of urban facilities. While current efforts have focused on enhancing the accessibility of children’s spaces and examining related influencing factors, there remains a scarcity of studies utilizing mature GIS technology methods to investigate the equity of multi-category children’s spaces at the community scale. This paper integrates and advances prior research. Unlike previous studies that relied on online POI data, we selected data from the Xiaohongshu APP platform, which better reflect the genuine and effective use of children’s space. Additionally, this study enhances traditional research methodologies by considering street intersection density alongside service radius and population factors in the prevailing two-step mobile search method [
24]. In line with the community-building goals of the United Nations’ SDG Report, we not only utilized kernel density analysis but also incorporated indicators such as the walking index to analyze spatial equity from the perspective of children’s spatial and community accessibility [
30].
In this study, children’s spaces were categorized into four groups based on children’s activities. The results illustrate that the trends of spatial inequity in different types of children’s spaces were significantly different, with indoor children’s spaces demonstrating greater equity than outdoor spaces. Overall, outdoor nature facilities exhibited the lowest average accessibility to children, potentially limiting children access to nature and impacting their physical and mental well-being. From a community standpoint, the uneven and varied distribution of children’s space resources across different streets and communities is evident. Greater community equity was observed in the core urban area, while most urban periphery communities were found to offer limited space for children. Although the diversification of transportation modes has broadened the range of activities available to children and enhanced equity in the distribution of children’s space resources, families in marginal urban areas may incur higher costs to access these resources. The scarcity of children’s space within communities may reduce the frequency of children’s travel and daily independent activities.
Numerous other factors influence children’s spatial equity within communities, including transportation, social safety, gender, and ethnicity, all of which can impact the distribution of children’s spaces [
31]. Spatial inequality may exist among children from different economic backgrounds. Strong community relationships, diverse memberships, and a blend of living and learning patterns contribute to increasing the frequency of children’s activities and the accessibility of children’s spaces. Meanwhile, the increase in disparities in public services within streets or communities can also lead to disparities in the equity of children’s spaces. Future additions of children’s spaces should focus on activity areas within streets or communities, plan different types of children’s spaces based on distinct community conditions, and expand flexible children’s spaces such as “play streets” to their full potential.
5. Conclusions
Based on geographic information data on the distribution of children’s spaces, community population data, and road network data in Hangzhou, we conducted a study on the accessibility level of children’s spaces at the community scale using the GIS network analysis method. The main findings are as follows:
The spatial distribution of children’s spatial facility points in the study area was correlated with the spatial distribution of the population, exhibiting a “low level in the periphery, high level in the center” trend. Locally, it displayed a point radiation distribution pattern. The number of indoor and outdoor children’s spaces in Hangzhou’s urban areas appeared roughly equal, indicating balanced resource allocation.
In terms of children’s space accessibility analysis, the core urban areas of the study area exhibited the highest accessibility, with Gongshu District having the highest accessibility level. Non-core urban areas had relatively poor accessibility, and the accessibility levels of various aspects of children’s spaces decreased from the city center towards the periphery.
Regarding community accessibility analysis, the accessibility level of community children’s spaces was the highest in the city center and gradually decreased moving outward. In core urban areas, community children’s space accessibility was higher in the northwest–southeast direction and gradually decreased outward in the northeast–southwest direction. There was a clear distinction in population accessibility between communities, reflecting differences in service effectiveness. Overall, the communities appeared to have a relatively low convenience level, indicating a mismatch between children’s space and population needs.
Based on the above conclusions, the overall accessibility of children’s spaces in Hangzhou’s urban areas is average. Therefore, the following recommendations are proposed to optimize the siting of children’s spaces: (1) The government should prioritize adding children’s spaces in community areas without data to ensure comprehensive coverage of children’s space accessibility in urban areas. (2) In the construction of core urban areas, children’s spaces should be added moderately based on community needs and relative convenience indicators, with a focus on the east–west direction of the core urban areas. (3) In non-core urban areas, children’s spaces should be gradually added starting from communities with higher accessibility levels, improving the spatial pattern of children’s spaces in urban areas.
This study has certain limitations that should be addressed in future research. Firstly, if the relevant data at the community level are available, it is recommended to further investigate the influence of various factors mentioned in the discussion on the accessibility and fairness of community children’s space resources. Secondly, although this study utilized population data from all age groups throughout the year, future research should strive to obtain more detailed data on household composition in each community to generate more targeted analysis results.


 ,
, 


