Article

Research on the Evolution and Driving Factors of the Economic Spatial Pattern of the Guangdong–Hong Kong–Macao Greater Bay Area in the Context of the COVID-19 Epidemic

1
Research Institute for Smart Cities, School of Architecture and Urban Planning, Shenzhen University, Shenzhen 518060, China
2
State Key Laboratory of Subtropical Building and Urban Science, Shenzhen 518060, China
3
Guangdong–Hong Kong–Macao Joint Laboratory for Smart Cities, Shenzhen 518060, China
4
School of Artificial Intelligence, Shenzhen Polytechnic, Shenzhen 518055, China
*
Author to whom correspondence should be addressed.
ISPRS Int. J. Geo-Inf. 2024, 13(1), 9; https://doi.org/10.3390/ijgi13010009
Submission received: 9 August 2023 / Revised: 12 December 2023 / Accepted: 18 December 2023 / Published: 26 December 2023
(This article belongs to the Collection Spatial Components of COVID-19 Pandemic)

Abstract

:
Understanding the economic impact of COVID-19 is the foundation for formulating targeted policies promoting economic recovery. This study uses panel data of the county economy in the Guangdong–Hong Kong–Macao Greater Bay Area (GBA) from 2017 to 2022. Firstly, the evolution characteristics of the economic structure in the GBA were analyzed using the standard deviation ellipse, geographical concentration, and spatial autocorrelation methods. Then, we revealed the changes in various economic indicators. Finally, a spatial Durbin model was constructed to study the factors affecting economic growth and spatial spillover effects in different periods. The results reveal that the economic distribution in the GBA presents a “core–edge” structure. The FDI, consumption, and exports of the Greater Bay Area fluctuate greatly, while investment growth is relatively stable. There is a significant spatial spillover effect in the county economy of the GBA. Investment, consumption, exports, labor, and innovation all have significant positive effects on economic growth, with investment having the greatest impact, while FDI has a significant negative impact. The impact of COVID-19 on the economy of the GBA is mainly reflected in the weakening of spatial spillovers, the strengthening of economic agglomeration, the decline in factor growth, and the change in the driving effect of factors on the economy. These findings can provide a reference for formulating targeted economic development policies.

1. Introduction

Novel coronavirus, commonly known as COVID-19, caused a global pandemic in 2020. The intensifying pandemic had a huge impact on investment, consumption, supply, and production chains around the world. Countries imposed restrictive measures, including national lockdowns, in order to slow the spread of the virus and reduce mortality. Although these measures were effective in restraining the spread of the epidemic, they also disrupted global supply chains and reduced global economic activities in a way that had never been seen before [1,2,3]. The consumption of goods and services fell markedly due to a sharp decline in individual income and weak consumer confidence. The COVID-19 pandemic also exposed some underdeveloped economies to foreign divestment, resulting in losses in production [4]. With the gradual improvement in the global epidemic situation, coupled with the stimulus measures taken by governments and central banks to increase fiscal spending, reduce taxes and fees, cut interest rates, and reduce the reserve requirement, the global economy has shown signs of gradual recovery, and people have begun to pay attention to the speed and trend of economic recovery as well as the long-term impact of the epidemic on the economy. Haimeng Liu et al. (2020) constructed a health index of cities (HIC) using human mobility big data from Baidu. They found that the HIC in China decreased by 28.6% from the 20th of January to the 21st of April 2020 [5]. The pandemic has cast a shadow over sustainable socio-economic development [6]. In this context, the main goals of this study are to explain whether the COVID-19 epidemic has had an impact on economic patterns and describe the new changes that have occurred in various economic facets.
The study of the relationship between consumption, investment, foreign direct investment (FDI), exports, and economic growth has always been highly valued by economists [7,8,9]. Baldwin et al. (2001) consider consumer demand to be not only the purpose of production but also the driving force behind production [10]. Consumption, as a terminal demand, fundamentally supports the realization of economic cycles. Consumer demand was the most important factor promoting economic growth in European countries in the late stage of industrialization [11]. However, Wang believes that, in order to achieve faster economic growth in the early stages of economic development, it is necessary to continuously increase investment accumulation and expand production [12]. Transportation investment has served as one of the most promising economic instruments to lower transportation costs and promote economic growth [13]. Scholars have argued about the relationship between FDI and economic growth. Ullah et al. (2022) believe that FDI brings cross-countries motion of production factors that promote developing host counties’ economic growth greatly [14]. The withdrawal of FDI has had an obvious negative impact on employment in China [15], while exports expansion has had a positive effect on China’s economic development [16]. Li (2019) put forward the theory that consumption, investment, and exports present volatility and complement each other [17]. The theory of endogenous growth emphasizes the importance of endogenous factors, such as human capital accumulation and knowledge spillover, in urban economic growth. Lucas (1988) presented a model showing that the spillover effect of human capital produces economic externality. The average level of human capital in a whole society determines the size of the economic externality produced [18]. Since then, the role of the “spatial spillover effect” in economic growth has been increasingly emphasized through regional differential growth theory, new economic geography, or new growth theory [19,20,21]. Empirical research on the spatial correlation and spillover effect of economic growth has yielded rich results. The spillover effect of economic growth is significantly positively correlated with spatial distance [22,23], which is not only a non-negligible force in economic growth but also profoundly influences regional development patterns and their evolution [24]. The focus of research into the factors influencing economic growth shifted from traditional qualitative analysis to econometric methods, such as multiple linear regression analysis, and then to quantitative analysis methods that consider spatial factors, such as geographic detectors [24], spatial econometric models [25], spatial Markov models, and geographically weighted regression models [26]. The research scale of these works involves countries, urban agglomerations, provinces, and municipal units. Sun et al. (2020) used 108 small cities in the Yangtze River Delta as an example for constructing an economic growth model using factors such as geographical distance from large cities and administrative boundaries. Their research found that proximity to large cities helps the promotion of economic growth in small cities, while the existence of administrative boundaries hinders the realization of spatial spillover effects [27]. There are also significant spillover effects on production factors. The area within 800 km of the studied region is a dense overflow zone for technical and other elements [22,24,25]. The diffusion and spread of factors such as innovation and capital investment among different regions produces spatial correlation and dependence in their economic growth [21,23,24,25,28].
Most previous studies have been conducted on the provincial or municipal scale [29,30,31,32,33,34,35]. In recent years, the driving factors and spatial spillover effects of county-level economic growth in urban agglomerations have received increasing attention [23]. The regional division is often based on habitual experiences, such as for the central, eastern, western, coastal, and inland regions. The barriers between regions are gradually decreasing, and features flow more freely between adjacent counties [35], leading to a gradual reduction in the scale of inter-regional spatial spillover effects. Chen and Zhu (2012) analyzed China’s regional economic differences on four scales: regional, provincial, prefecture-level cities, and counties. The results of their research revealed that the smaller the scale, the greater the contribution to regional economic differences [36]. Wang et al. (2015) believe that the county-level scale is the core scale for studying spatial spillover effects in Guangdong [26]. Therefore, the county-level scale is more suitable for explaining economic spillover effects. In view of the above shortcomings, this paper takes the Guangdong–Hong Kong–Macao Greater Bay Area (GBA) as the research object and counties (county-level cities and districts) as the research unit and selects the panel data on the county scale for the GBA from 2017 to 2022. We first analyze the evolution characteristics of the economic spatial pattern of the GBA and then make use of the spatial Durbin model to measure the growth drivers and spatial spillover effects of the GBA economy. Finally, we conduct a comparison of the core and edge areas before and after the epidemic. This research features the following three innovations: ① Incorporating Macao and Hong Kong into a unified analytical framework has elevated the research perspective from the traditional Pearl River Delta (PRD) to the GBA. Comparing and correlating economic indicators in different regions can provide a reference for subsequent research. ② This study not only analyzes the economic spatial pattern but also reveals the changes in major economic indicators such as investment, consumption, FDI, and exports before and after the epidemic. This is a more comprehensive disclosure of the economic impact brought about by COVID-19. ③ This study constructs spatial econometric models to study the driving factors of economic growth and spatial spillover effects in different periods. This provides a theoretical basis for scientifically formulating differentiated economic development policies.

2. Methods

2.1. Standard Deviational Ellipse Method (SDE)

The standard deviational ellipse method, based on the spatial location and structure of the research object, can quantitatively describe the centrality, directionality, distribution, and spatial form of the spatial distribution of geographical elements [37]. Among the basic parameters, the ellipse center of gravity denotes the economic center; the azimuth reflects the main trend direction of economic distribution, and the ratio of the long axis y to the short axis x represents the statistical dispersion of the economic pattern in the primary and secondary directions [38].
The economic center is determined as follows:
( X ω ¯ , Y ω ¯ ) = ( i = 1 n ω i x i / i = 1 n ω i , i = 1 n ω i y i / i = 1 n ω i ) .
The azimuth is calculated as follows:
tan α = ( i = 1 n ω i 2 x ˜ i 2 i = 1 n ω i 2 y ˜ i 2 ) + ( i = 1 n ω i 2 x ˜ i 2 i = 1 n ω i 2 y ˜ i 2 ) 2 + 4 i = 1 n ω i 2 x ˜ 2 y ˜ i 2 2 i = 1 n ω i 2 x ˜ i y ˜ i
The standard deviation σ x and σ y can be expressed, respectively, as follows:
σ x = i = 1 n ( ω i x ˜ i cos α ω i y ˜ i sin α ) 2 / i = 1 n ω i 2 ,   and
σ x = i = 1 n ( ω i x ˜ i cos α ω i y ˜ i sin α ) 2 / i = 1 n ω i 2 ,
where ( x i , y i ) denote the spatial location of the research object; ω i denotes its corresponding weight; and ( x ˜ i , y ˜ i ) denote the coordinate deviation from the location of each study object to the center of gravity of the ellipse [37].

2.2. Economic Concentration

The economic concentration index is often used to reflect the degree of imbalance in the spatial distribution of regional economic factors [38]. The formula is expressed as follows:
R it = X i t Y i t ,
where Rit denotes the geographical concentration of economic factors in unit i at time t; Xit represents the proportion of GDP in the unit i at time t; and Yit represents the proportion of the total area of the region in the unit i at time t.

2.3. Spatial Autocorrelation

The existence of significant spatial agglomeration is a prerequisite for empirical research using spatial econometric models. The spatial autocorrelation index is a common tool for measuring the spatial correlation of values, commonly used as the global Moran’s I [39] and the local Moran’s I [40].
The global Moran’s I index is calculated as follows:
I = i = 1 n j = 1 n W i j ( X i X ¯ ) ( X j X ¯ ) S 2 i = 1 n j = 1 n W i j ,   and S 2 = 1 n i = 1 n ( X i X ¯ ) 2
The local Moran’s I index is determined as follows:
I i = ( X i X ¯ ) S 2 j = 1 n W i j ( X j X ¯ ) ,   and S 2 = 1 n i = 1 n ( X i X ¯ ) 2
where the range of Ii is [−1, 1]; X i and X j are the attribute values of regions i and j; X ¯ is the average of the attribute values; n is the number of units studied; W i j is the spatial weight; and S 2 is the variance of the attribute values.

2.4. Economic Growth Model

The Cobb–Douglas production function is one of the most widely applied production functions in economics and is often utilized in empirical studies of regional economic growth. If an econometric model based on the production function ignores the “spatial effect”, this may lead to biased results [21]. Therefore, drawing on previous studies, the production function is introduced into the spatial elements, and the spatial interaction of explanatory variables and the transmission of error terms are considered, at the same time, to build the SDM economic growth model [23,24,25]. The model is as follows:
ln Y i t = α + ρ W ln Y i t + β i ln X i t + β i ln Z i t + δ i W ln X i t + δ i W ln Z i t + ε i t ,
where i, t, α , ε , Y, and W denote the ith region, the tth year, the intercept, the residual term, the GDP, and the spatial weight matrix, respectively. β denotes the regression coefficient. X and Z denote the core variables and the control variables (Table 1). Many studies have shown that investment, consumption, FDI, and exports are important influencing factors for regional economic growth [7,8,13,14,15,16,17,41,42]. In the context of the COVID-19 pandemic, changes in investment, consumption, FDI, and exports in various regions are highly likely to have had an impact on economic development. Therefore, this article sets these four elements as the core variables (Table 1). Fiscal spending, as the foundation and key pillar of national governance, plays a positive role in improving economic efficiency and balancing regional development [41]. Labor means productivity, which plays a huge and irreplaceable role in creating social wealth. Innovation can significantly promote the upgrading of the industrial structure and is also an important driving force for economic growth [21]. Therefore, this article sets fiscal spending, labor, and innovation as the control variables (Table 1). To avoid heteroscedasticity, logarithms are taken for both the dependent and independent variables.

2.5. Spatial Weight Matrix

In this paper, the geographic distance weight matrix and spatial adjacency weight matrix are constructed to characterize the spatial dependence of the spatial econometric model. The expression for the geographic distance weight matrix is expressed as follows:
W 1 i j = 0 ( i = j ) 1 / d i j ( i j ) ,
where W 1 i j is the inverse distance space weight matrix, and d i j is the distance between regions i and j.
The construction of spatial adjacency weight matrix is related to the positional relationship between cities, which is expressed as follows:
W i j 2 = 0 , ( Cities   i   and   j   are   not   adjacent ) 1 , ( Cities   i   and   j   are   adjacent ) ,

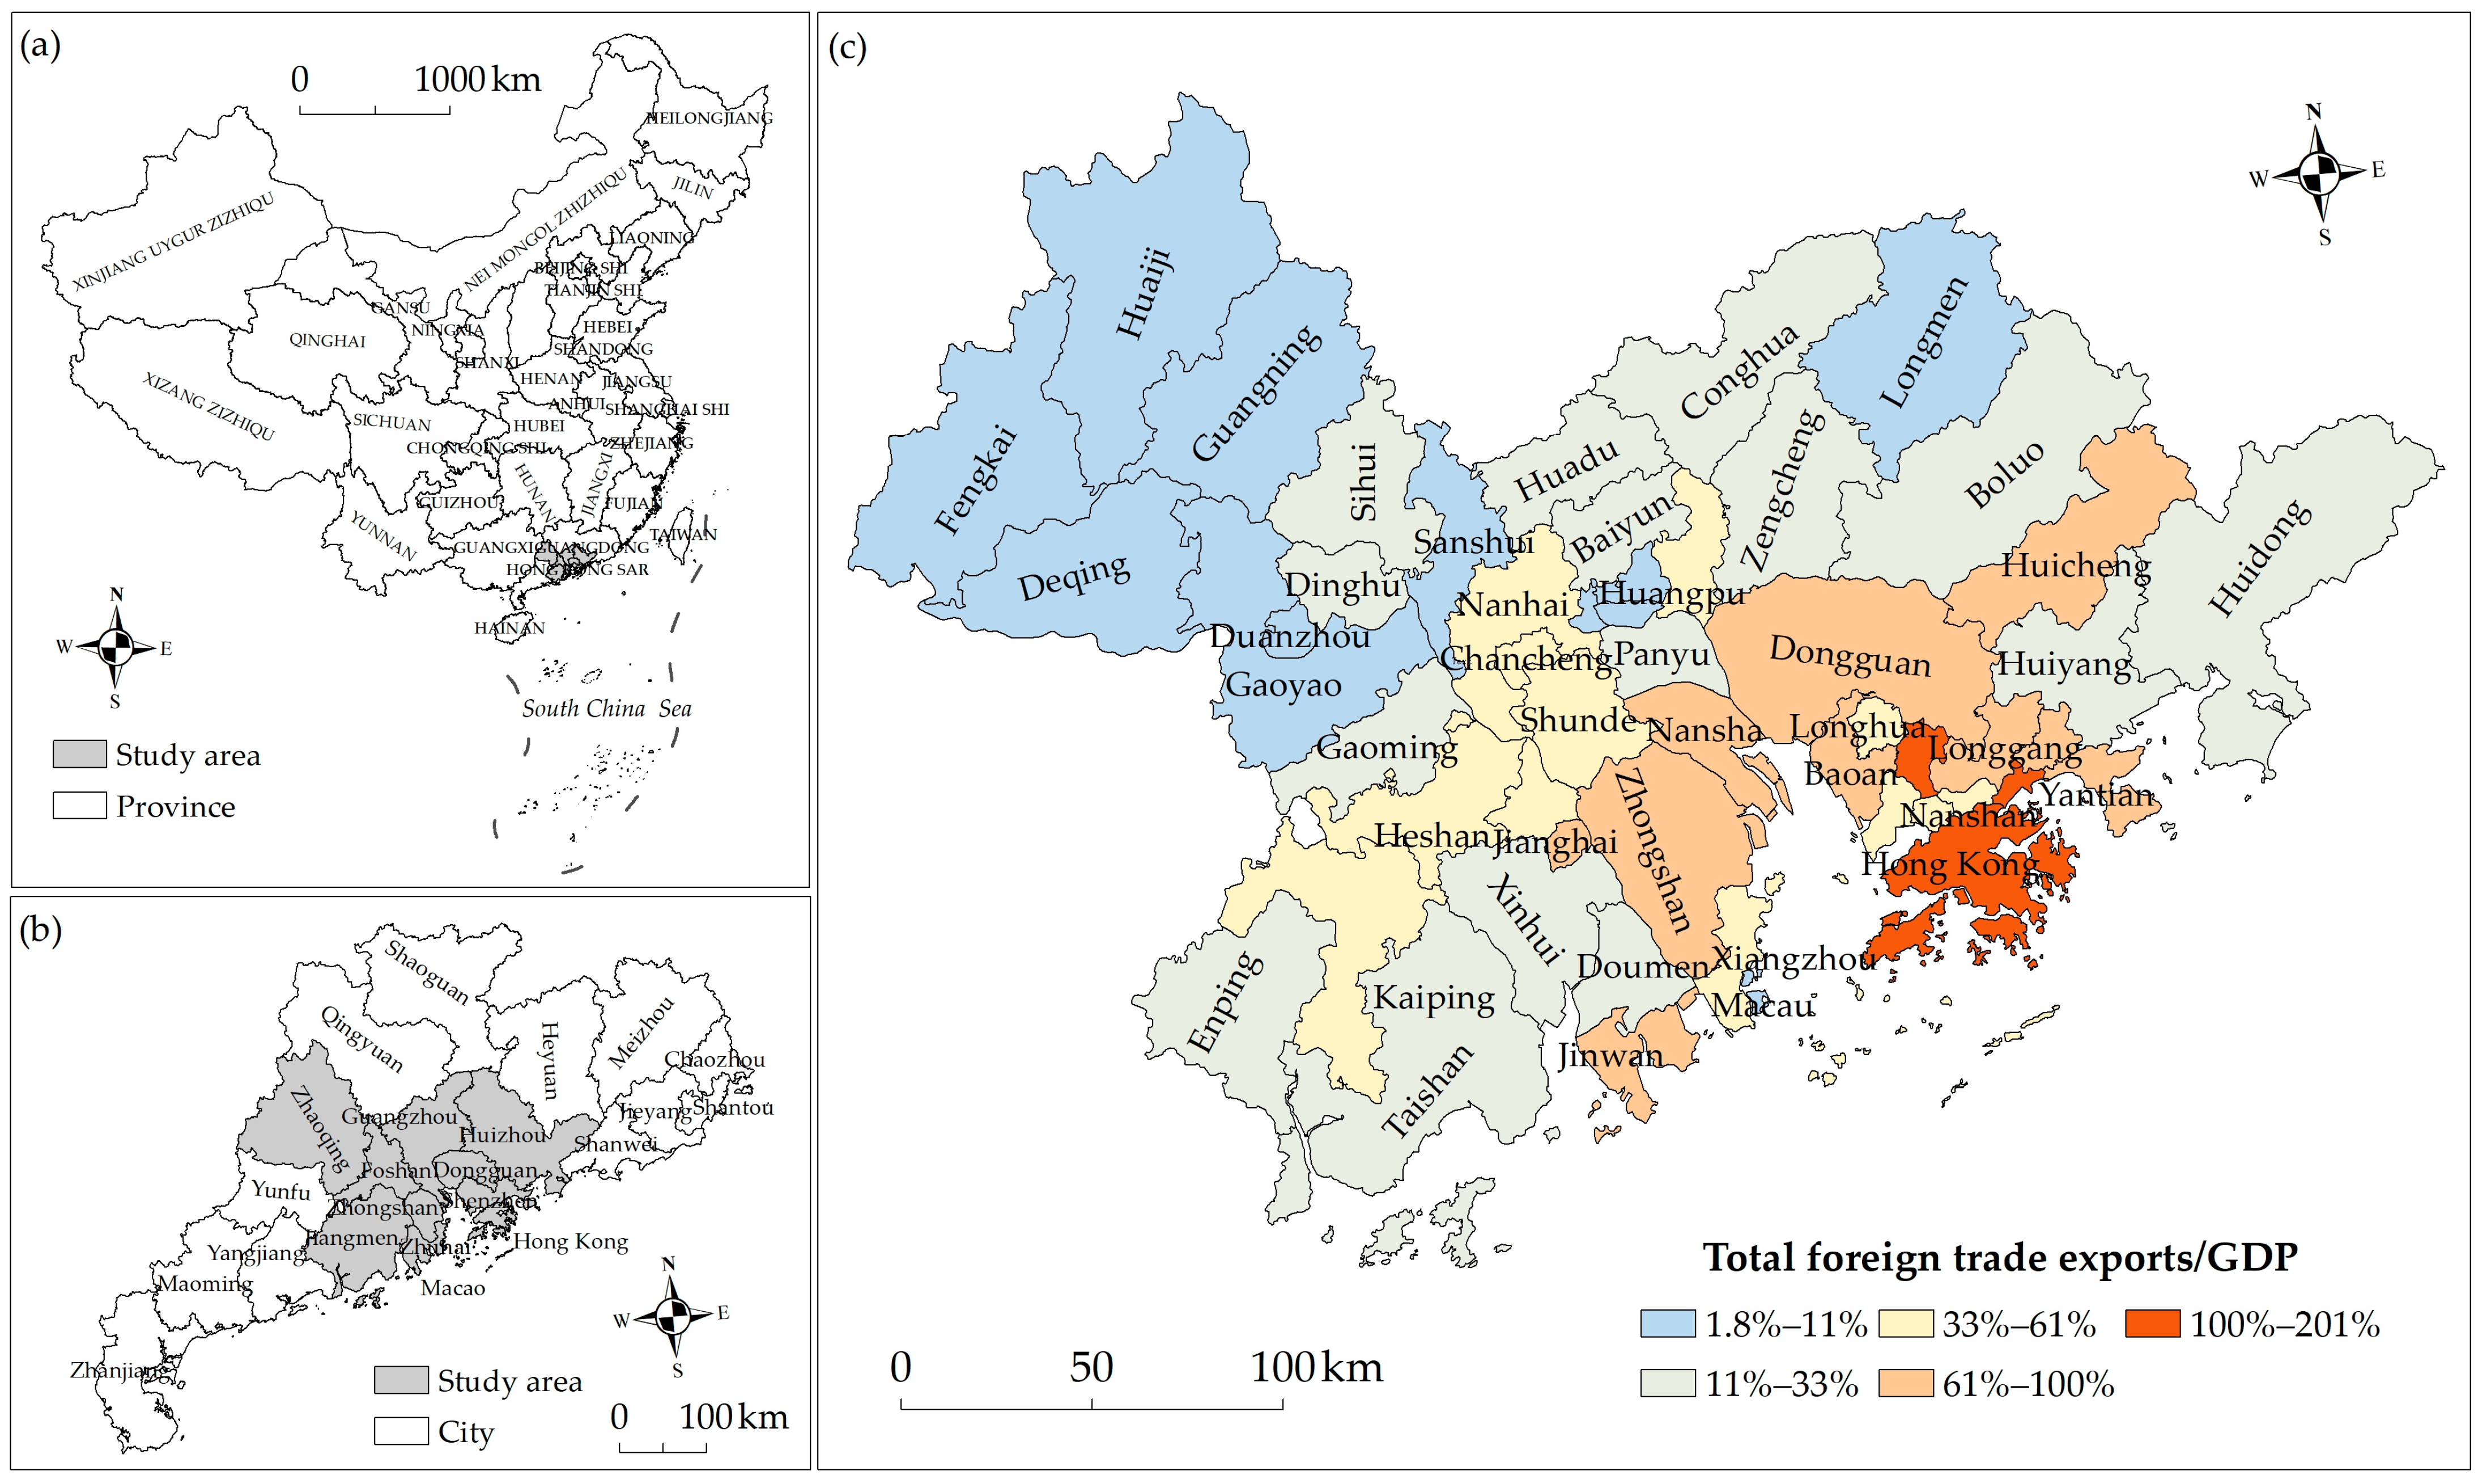
3. Overview of the Research Area and Database

The Guangdong–Hong Kong–Macao Greater Bay Area (GBA) is located in South China (Figure 1a). It comprises nine cities in the Guangdong Province—namely, Guangzhou, Shenzhen, Dongguan, Foshan, Huizhou, Zhuhai, Zhongshan, Jiangmen, and Zhaoqing—and two special administrative regions, Hong Kong and Macao (Figure 1b). Of the various regions in China, the GBA has one of the most active economies and the highest degrees of openness. Foreign trade plays an important role in economic development in the GBA. Statistics indicate that the GBA’s dependence on foreign trade exports in 2022 was as high as 69%. Most of the counties on both sides of the Pearl River depend on foreign trade for more than 61%. The data in the Yantian District, Shenzhen, show a dependency as high as 201% (Figure 1c). The outbreak of the COVID-19 epidemic severely tested the GBA’s development model as a foreign-trade-orientated economy. According to statistics from Guangdong cities, Hong Kong, and Macao governments, the economic growth rate of the GBA in 2020 was −0.50%; this was the first time that the GBA economy had experienced negative growth during the 21st century. The GBA requires efficient policies or policy combinations in order to effectively respond to this situation. Analyzing the new characteristics of various economic factors in the GBA and scientifically comprehending the new changes in the economic pattern and development model of the GBA are of great practical significance for formulating targeted policies to promote economic recovery in the GBA.
Compared with the early stage, there are significant differences in the statistical caliber and methods of Guangdong counties (county-level cities and districts) from 2017 to 2022. Therefore, this article uses GBA county panel data from 2017 to 2022 to study economic patterns and the growth mechanism. The panel data include nine indicators (Table 2). The data for the GDP, year-end permanent population, year-end employees of the whole society, fixed-asset investment, local general public budget expenditure, actual use of foreign direct investment, total retail sales of social consumer goods, and total foreign trade exports are taken from the statistical yearbooks of Hong Kong, Macao, the Guangdong Province, and their respective cities and counties from 2017 to 2022. The number of authorized domestic invention patents comes from the China National Intellectual Property Administration of China, the Economic and Technological Development Bureau of Macao Special Administrative Region Government Portal, and the Intellectual Property Department of Hong Kong Special Administrative Region Government Portal.
The following should be noted with regard to the data: ① Due to the fact that Dongguan and Zhongshan do not have districts or counties and there is a significant lack of relevant data for their townships, this study directly used urban data from Dongguan and Zhongshan. In addition, Hong Kong and Macao have not released county-level data, so they are also regarded as basic research units. Finally, the study area consists of 52 units. ② Hong Kong, Macao, and the mainland have slightly different statistical terms, concepts, and statistical calibers. The comparison of the main statistical indicators is shown in Table 2. ③ The currency exchange of US dollars (USD), Hong Kong dollars (HKD), Australian dollars (AUD), and CNY was based on the annual average exchange rate published by the National Bureau of Statistics.

4. Results

4.1. The Evolution of the Economic Spatial Pattern of the GBA

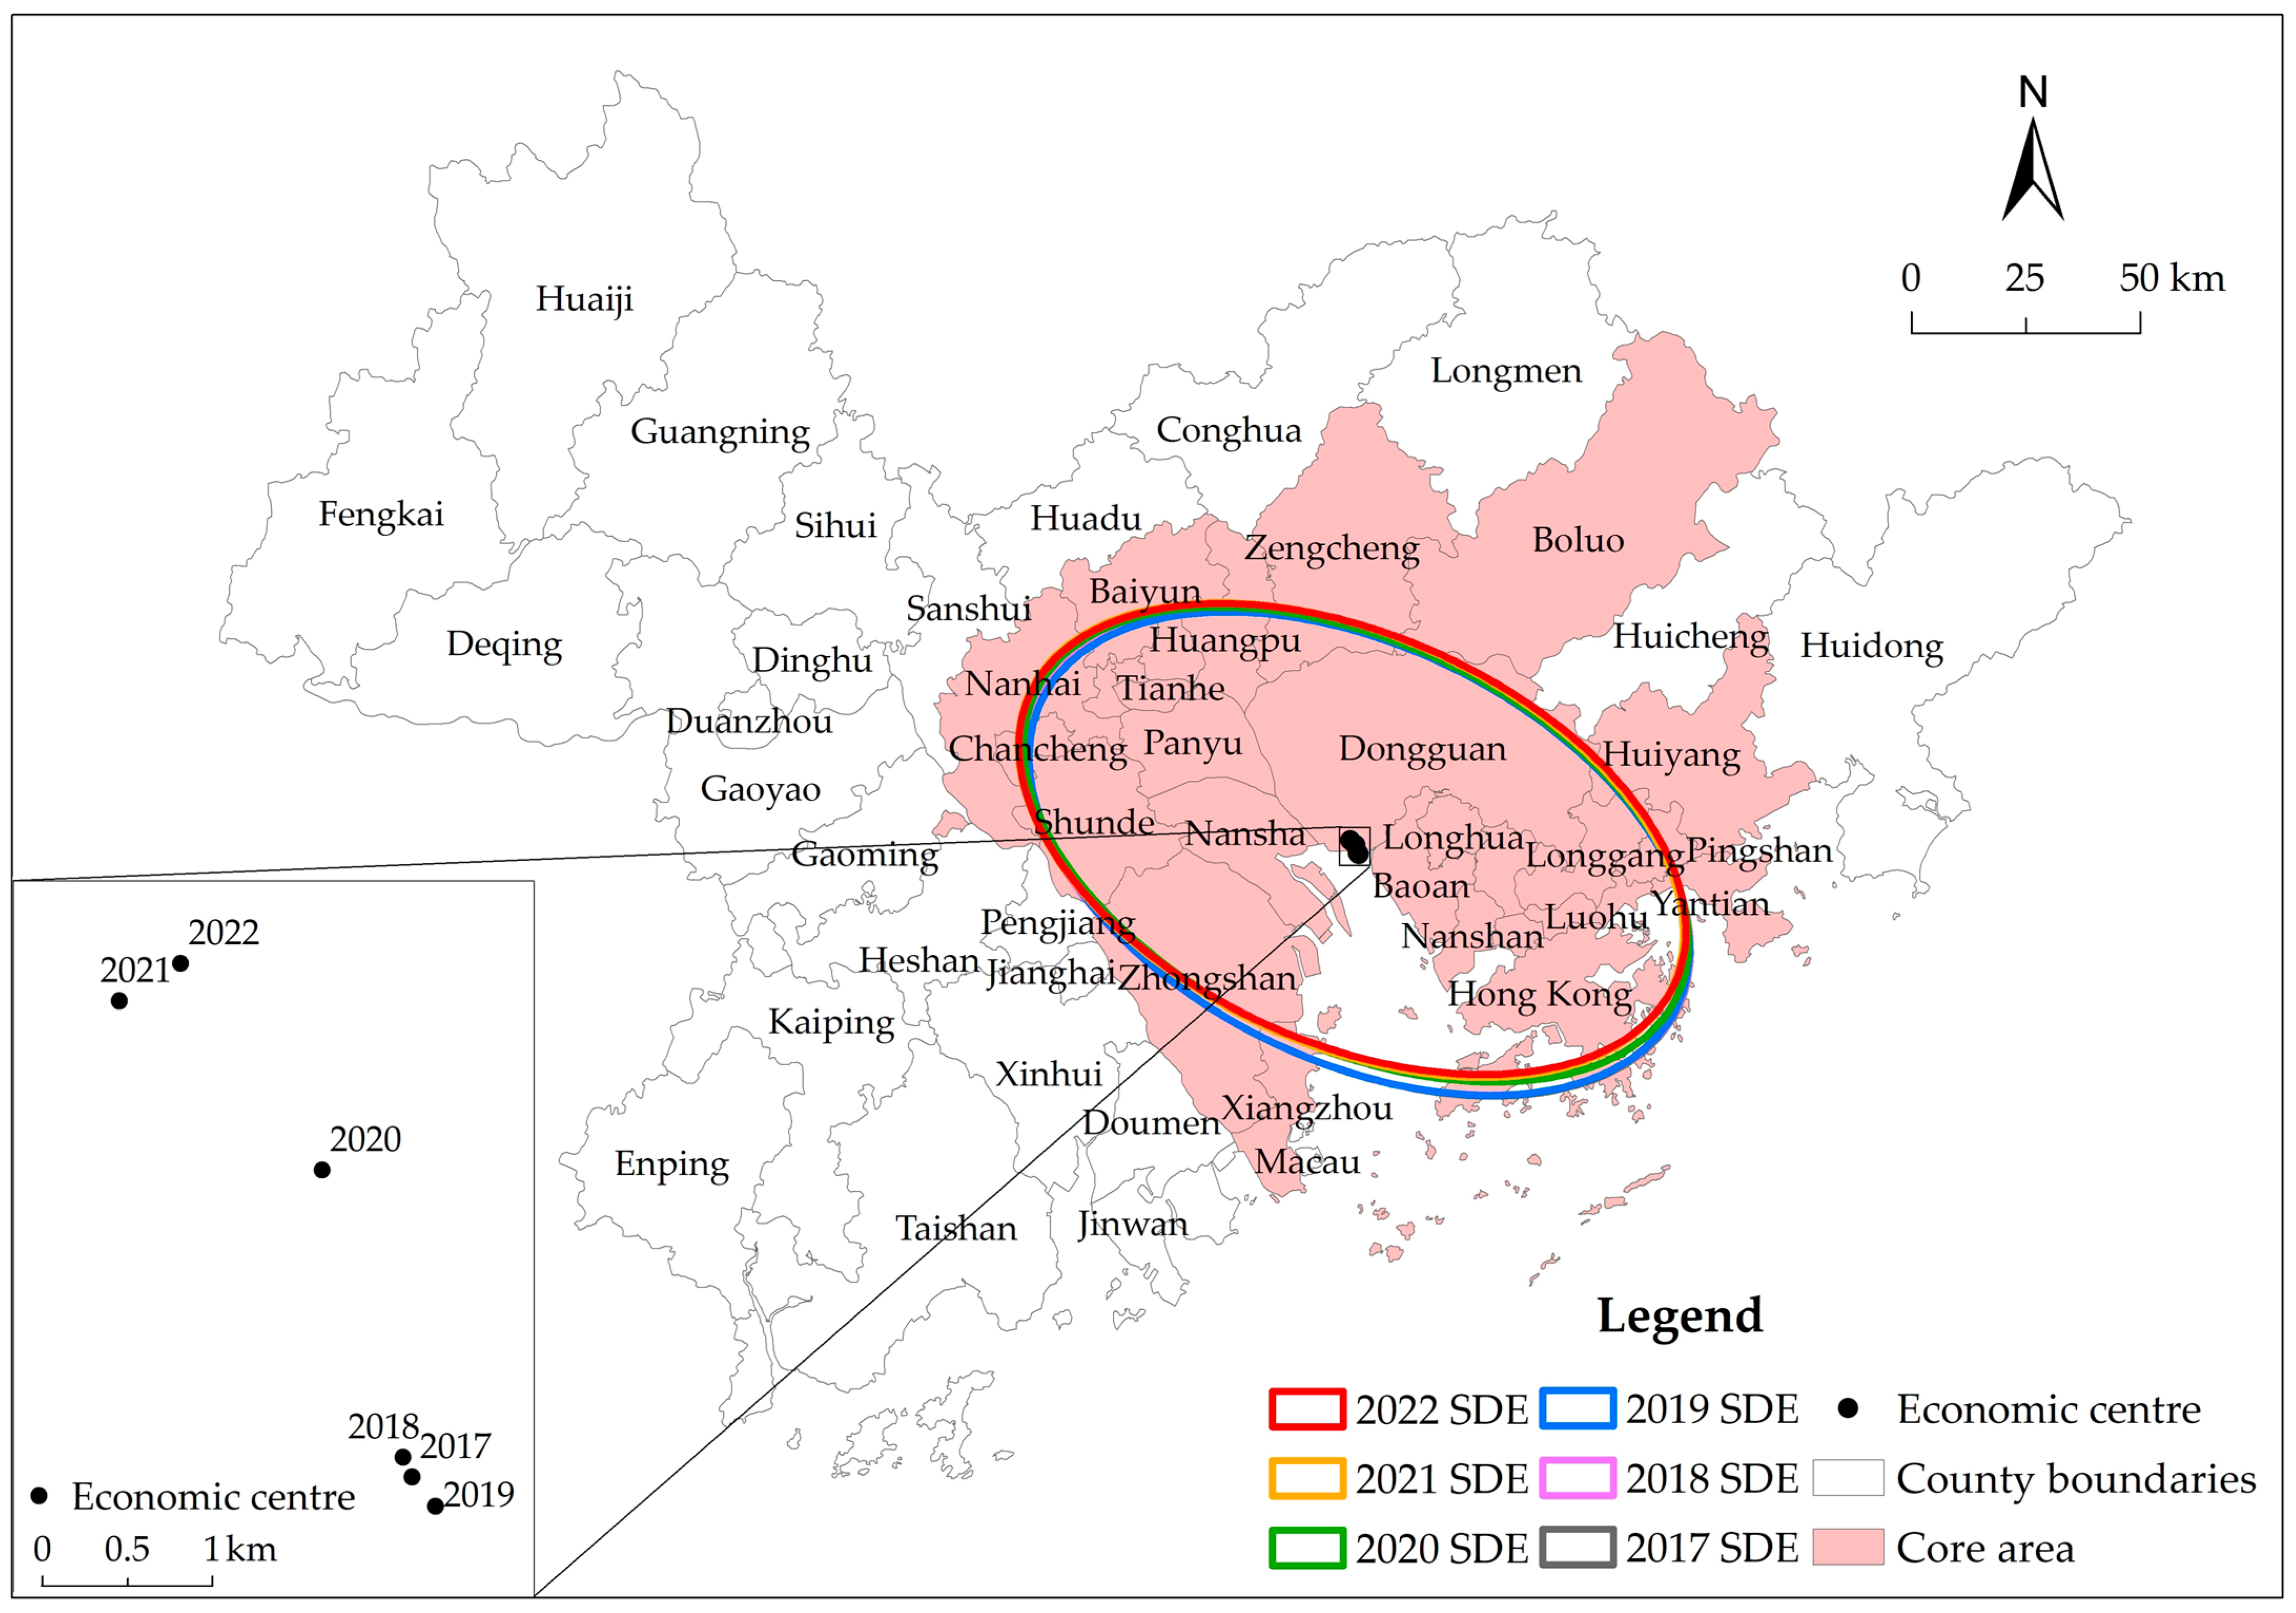
4.1.1. Identification of the Directionality and Core Area of Economic Spatial Distribution

We first make use of QGIS3.6 to calculate the standard deviational ellipse of the county GDP in the GBA from 2017 to 2022. Then, we analyze the economic spatial distribution and migration direction. From the shape of the SDE, the economic spatial distribution of the GBA tends to be southeast–northwest (Figure 2). The long axis, short axis, and center point of the six SDEs are roughly consistent, indicating that the economic pattern of the counties in the GBA has undergone relatively little change. During the epidemic, the northeast–southwest direction showed a contraction trend, while the northwest direction slightly expanded. From the perspective of the movement trajectory, before 2019, the county economic center of the GBA moved slightly to the southeast. After 2019, it turned to the northwest, and the distance was large (Figure 2). The intersection of the standard deviational ellipse in 2017–2022 is regarded as the economic core area of the GBA, which includes 27 counties (county-level cities and districts) in Hong Kong, Shenzhen, Huizhou, Dongguan, Guangzhou, Foshan, Zhongshan, and Zhuhai. Most of these counties are located along both sides of the Pearl River, and the non-core areas form a “C”-shaped semicircle around the core area (Figure 2).

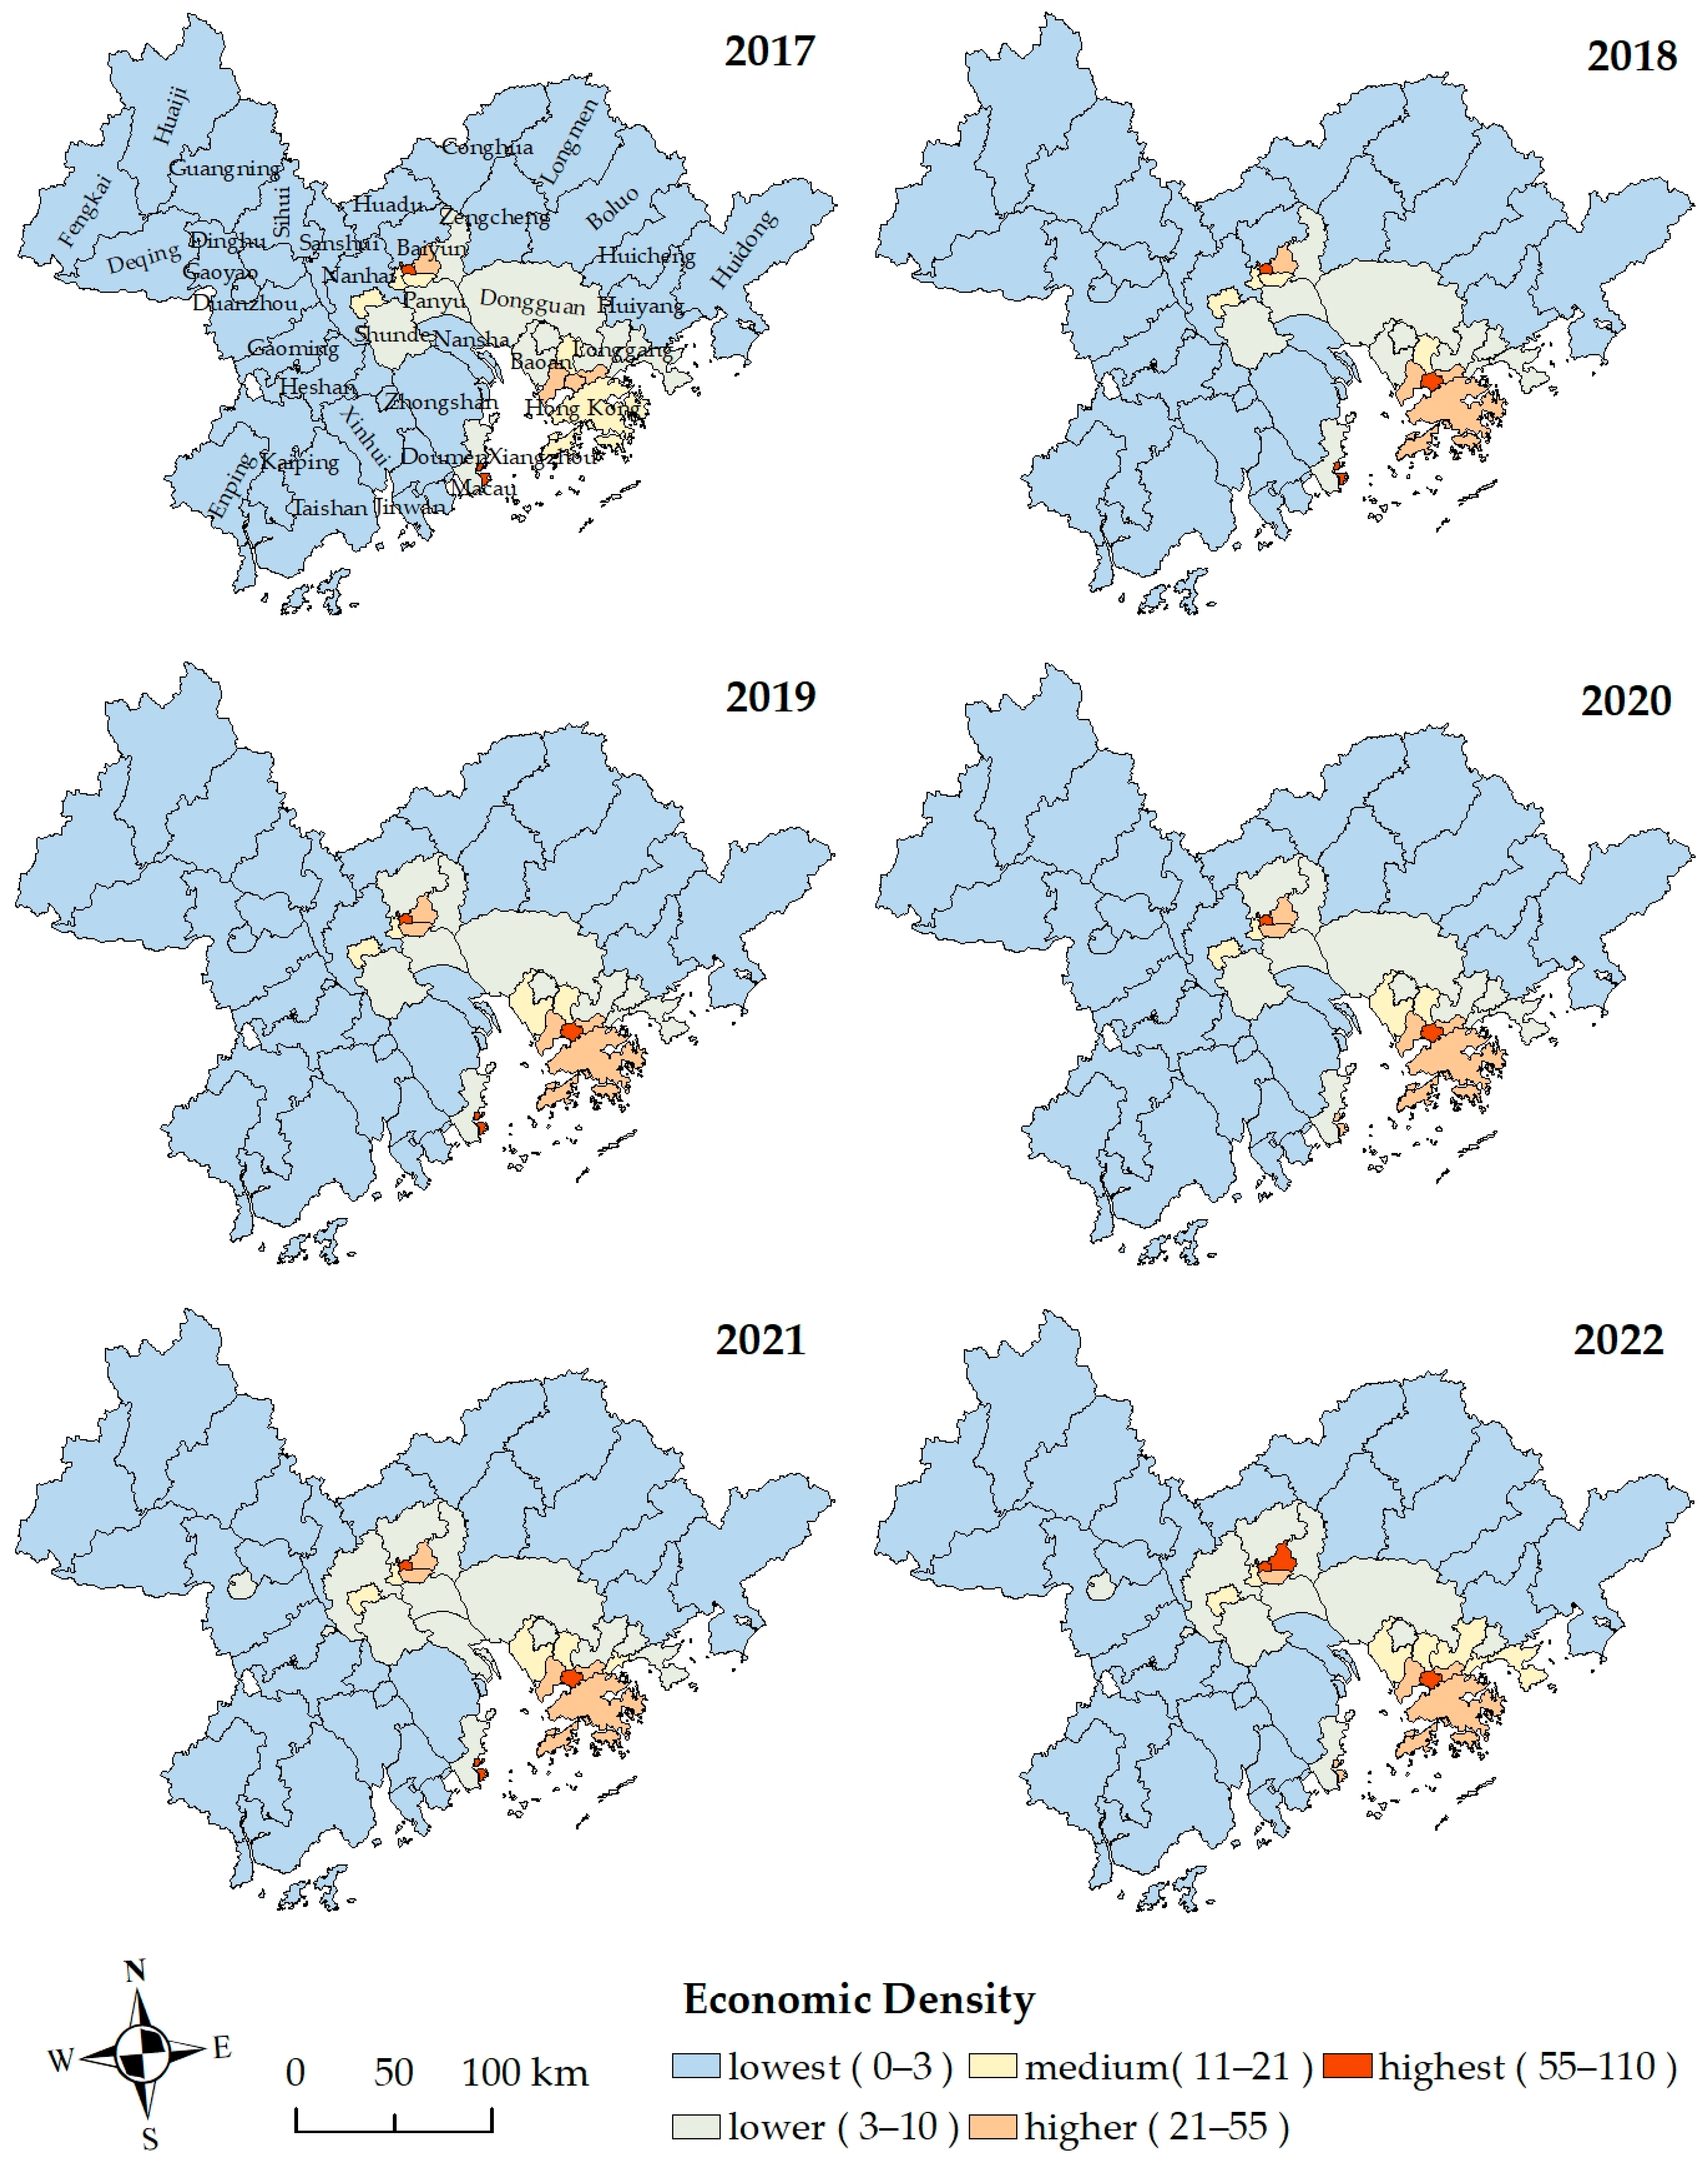
4.1.2. Evolution of Economic Distribution

We calculated and visualized the county economic density (GDP/area) of the GBA from 2007 to 2022 using QGIS 3.6. Referring to previous research [43], the 2017 natural breaks method classification standard was uniformly used for the visualization of each year’s classification. The county economic density of the GBA was divided into five groups: “lowest”, “lower”, “medium”, “high”, and “highest” (Figure 3). Its spatial distribution pattern showed the “core–edge” characteristic, and the counties with a “low” economic density were distributed in the eastern, northern, and western parts of the PRD, surrounded on three sides (Figure 3). From 2017 to 2022, the number of counties with an economic density in the “higher” or “highest” groups increased from six to eight, while the number in the “lowest” group decreased from thirty-one to twenty-eight. This means that, against the background of the Sino–US trade war and the COVID-19 epidemic, the economic spatial pattern of the GBA underwent barely any fundamental changes, and the overall economic level is still steadily improving. Specifically, in 2017, only Macao and the Yuexiu District in Guangzhou presented economic densities in the “highest” group. In 2018, the number of counties in the “highest” group increased to three, with the addition of the Futian District, Shenzhen. Hong Kong rose from “medium” to “high”. In 2019, the Baoan District of Shenzhen, the Baiyun District and Haizhu District of Guangzhou all rose by one level. In 2020, Macao dropped from the “highest” to the “higher” group; its economic growth rate has actually decreased by 56.3%, year on year. In 2021, Macao, the Duanzhou District of Zhaoqing, the Nanhai District of Foshan, the Nansha District of Guangzhou, and the Yantian District of Shenzhen all rose by one level. In 2022, the Tianhe District of Guangzhou and the Longgang District of Shenzhen both rose by one level, while Macao fell from the “highest” to the “higher” group. The regions with significant growth are mostly located in core area. The fluctuations in Macao’s economy during the epidemic period reflect the instability of its economy.
We analyzed the spatiotemporal evolution of economic agglomeration in the GBA using economic concentration (Table 3). In 2017–2022, the economic concentration index of the core area in the GBA was significantly higher than that of the edge area, indicating a significant gap in economic development between the two. From 2020 to 2022, the growth rate of economic concentration in the core areas was significantly faster than before, while sharply declining in the edge areas. The outbreak of COVID-19 led to an intensification in economic agglomeration in the core areas and a further expansion of the regional development disparities.

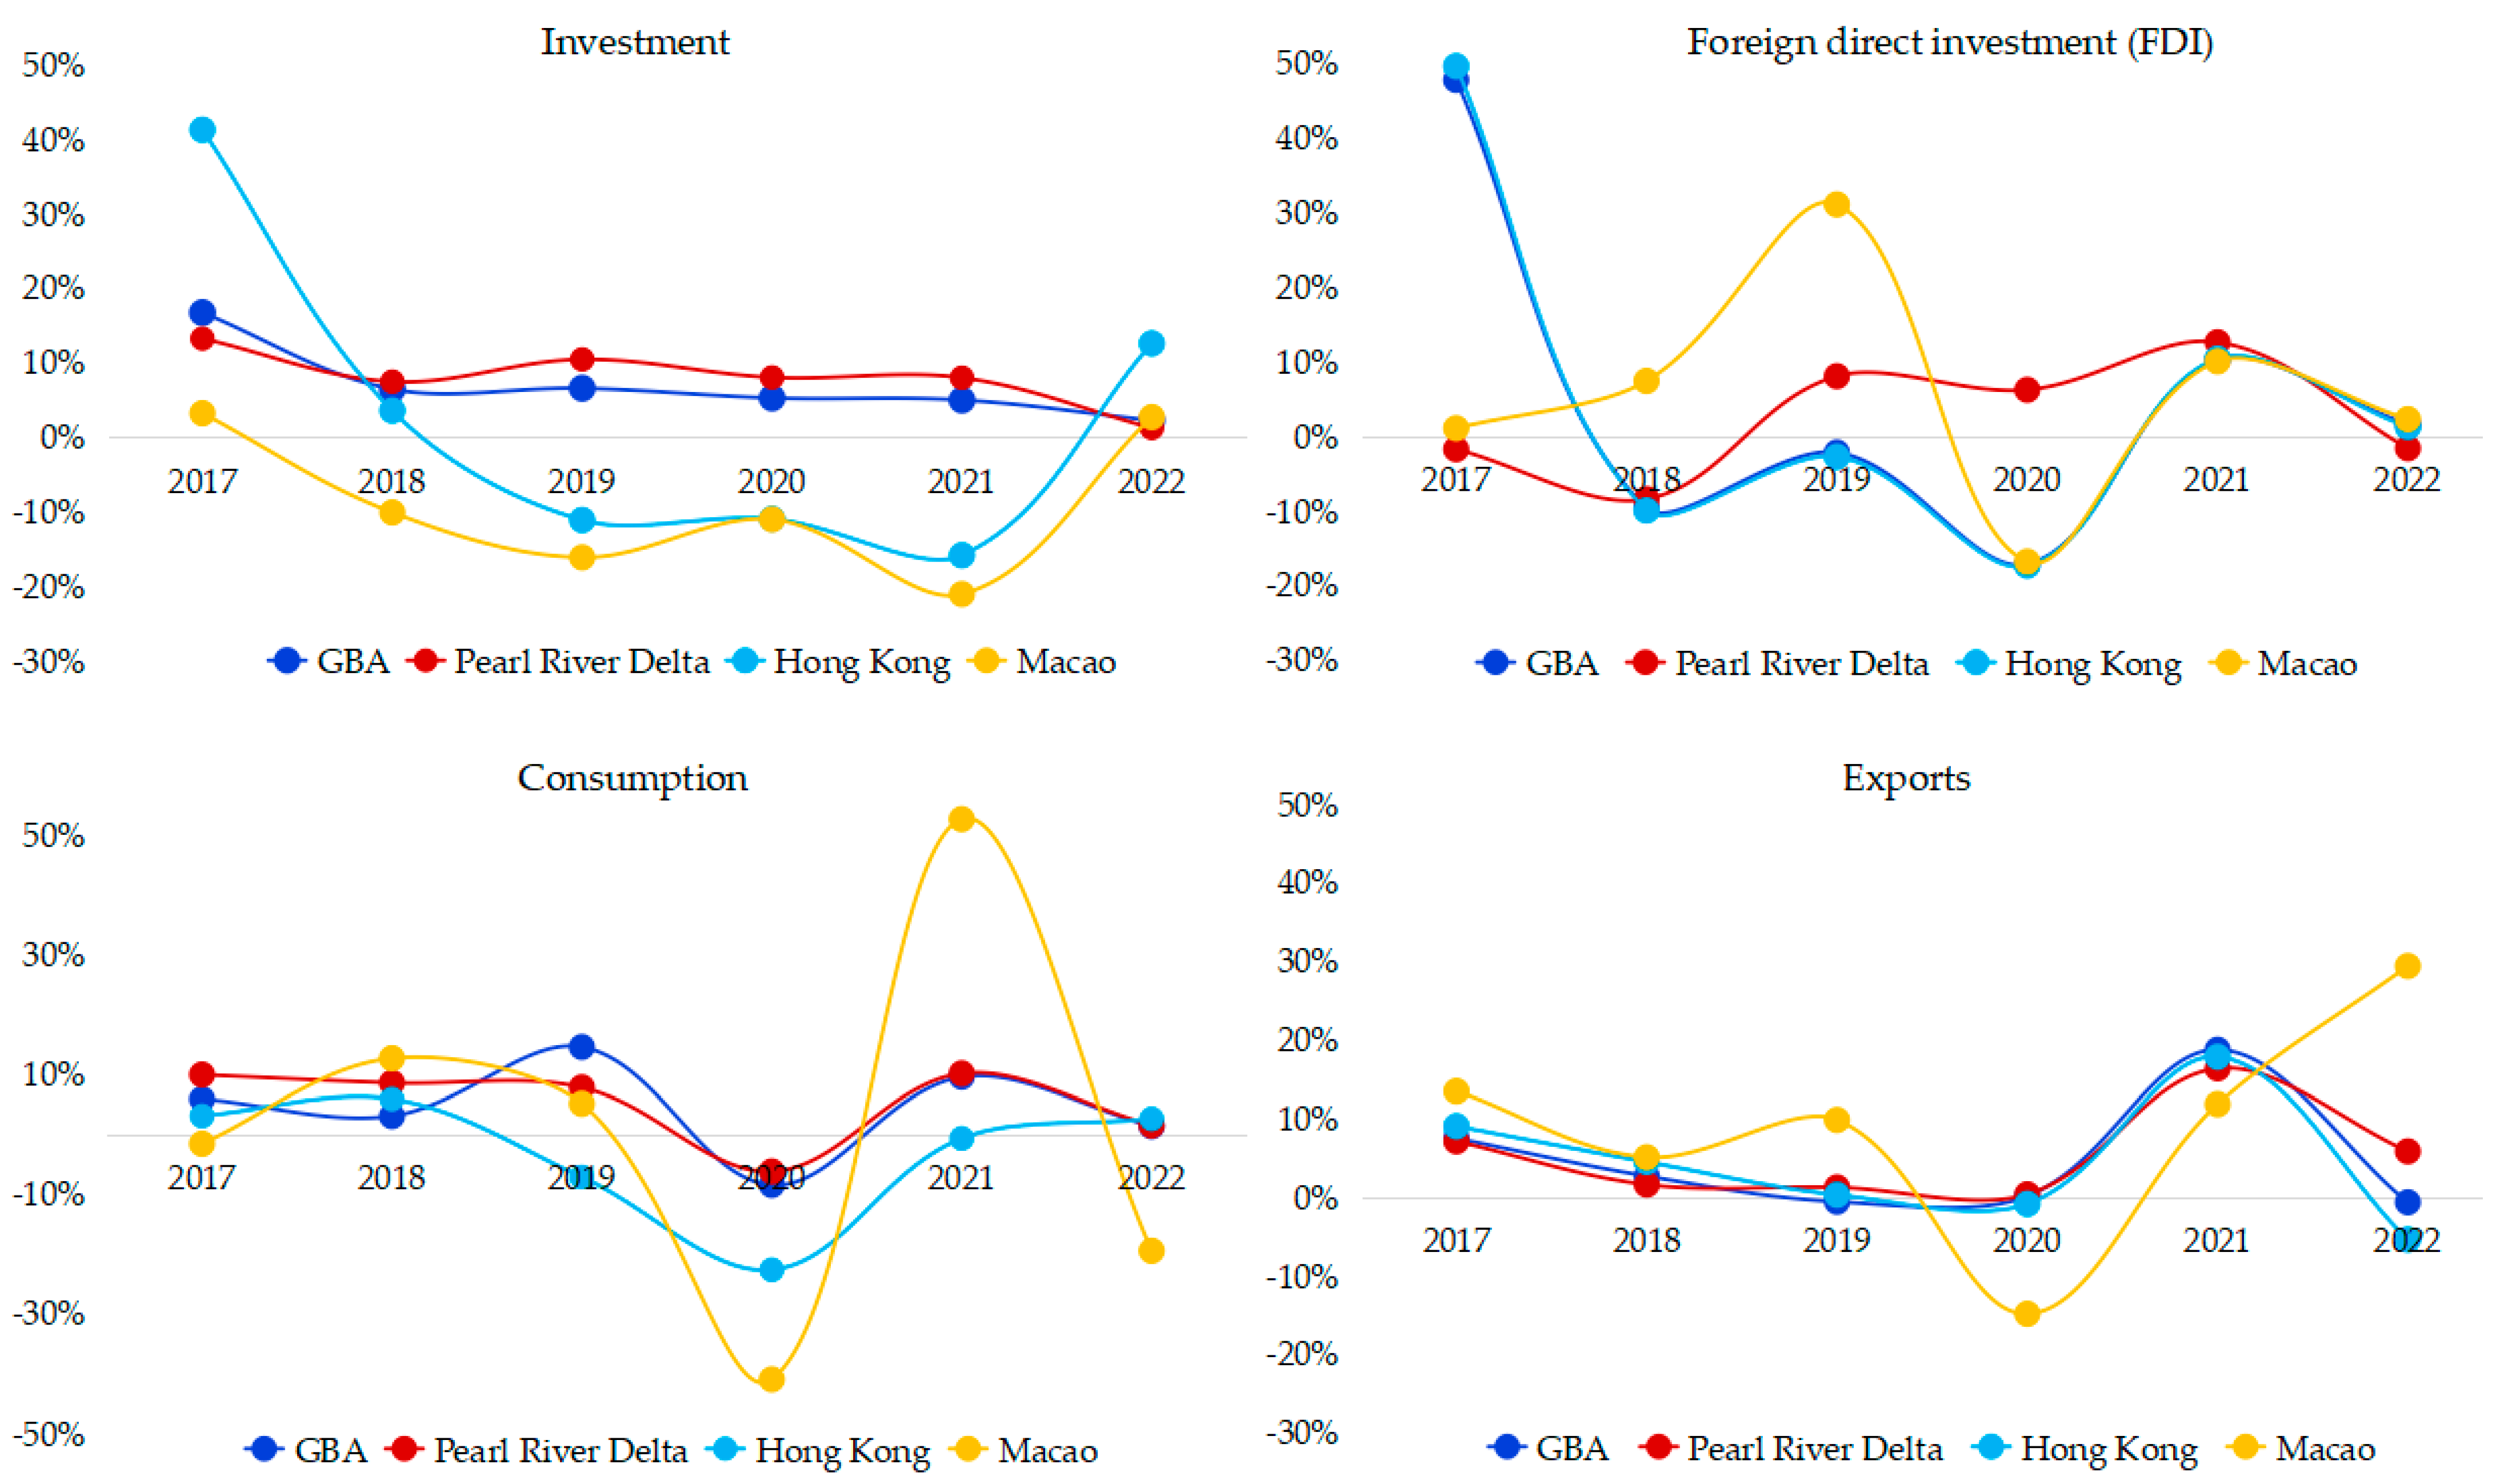
4.1.3. Changes in Major Economic Indicators

From the changes in economic indicators, there are significant fluctuations in the investment, consumption, FDI, and exports curves of various regions from 2017 to 2022 (Figure 4). The investment curve in the GBA is relatively stable, but the overall trend is downward (Figure 4, Investment). From 2017 to 2019, the investment growth rate remained above 6%, and the growth rate in 2020, 2021, and 2022 was 5.29%, 5.02%, and 2.30%, respectively. A regional comparison shows that, although the investment growth rate in the PRD has declined, it still maintains a high level, while the investment growth rate in Hong Kong and Macao is mostly negative, the curve fluctuation large, and the decline speed is fast. Expanding asset investment has always been an important means for developing countries (or regions) to boost their economies [12]. The cities of Hong Kong and Macao and the PRD are in two different stages of development. The PRD is still at the stage of rapid urbanization, and its economic development has not yet completely moved on from its dependence on traditional infrastructure. The reason for the sharp decline in investment growth in Hong Kong and Macao during the investigation period may be related to the fact that the urbanization of Hong Kong and Macao is in a mature and stable stage, and the demand for infrastructure investment is reduced.
The consumption curve of each region showed a clear trough shape in 2020. Compared with other indicators, the trough shape of the consumption curve in each region is the most significant one (Figure 4, consumption). The consumption decline in the GBA reached 8.37%, which is significantly greater than the other indicators, indicating that consumption was the indicator most affected by the COVID-19 pandemic. From a regional perspective, the consumption curve in Macao fluctuates the most, followed by Hong Kong, and the PRD’s curve is the most stable. Osterhaven and Linden argue that consumer demand is the most important factor sustaining economic growth in developed European countries as they move into the late industrialization period [44]. Hong Kong and Macao are also at a late stage of industrialization, and the instability of consumption in these regions has increased the instability of their economic development.
The FDI curve troughs in the GBA, PRD, and Hong Kong all appeared in 2018, and the PRD resumed a positive growth after 2018 (Figure 4, FDI). The FDI in the GBA significantly decreased in 2018, and exports also decreased significantly (Figure 4, FDI, export). This may be related to the overall deterioration of trade between China and the United States after 2018, with both sides imposing high tariffs on each other. The trade war has, to some extent, disrupted the originally favorable investment environment, increased the exports cost of goods, and, thus, dealt a blow to foreign investment confidence. However, from 2019 to 2022, the continuous growth in FDI in the PRD showed us that foreign capital still has great confidence in China’s economic development [43].
The export curves of various regions also showed a significant trough curve in 2020. From 2017 to 2019, the exports growth in the GBA showed a decreasing trend year by year (Figure 4, exports). In 2020, the exports growth rate of the PRD was only 0.42%, with negative growth in Hong Kong and Macao. In 2021, the exports growth in the GBA bucked the trend by 18.76%. The counter-trend growth in exports occurred against the backdrop of the ongoing spread of the epidemic. During this period, China’s epidemic prevention and control measures were in place and production activities resumed faster than in other countries. The counter-trend growth in exports undoubtedly has a huge supporting effect on economic growth in the GBA. However, as the social production order of various countries gradually recovers, China’s exports advantage gradually decreases, and exports may return to a low growth state or even a stagnant state. Despite the incomplete recovery of the domestic consumer market size and consumer confidence, economic development in the GBA will still face enormous challenges during the post-pandemic period.
Overall, the asset investment volatility in the GBA is relatively small, but the growth rate gradually decreases. The FDI, consumption, and export curves fluctuate significantly. The outbreak of COVID-19 had a significant impact on consumption and exports: the consumption and export curves both showed significant trough shapes in 2020. The influence of COVID-19 on FDI in the PRD was relatively small. The stability of various economic indicators in Hong Kong and Macao is lower than that of those in the PRD. This is consistent with the view of Liu Yi and others that Hong Kong and Macao have poor economic resilience due to their attachment to and coupling with global financial and hotel networks [45].

4.2. Comparation of Driving Factors of Economic Growth

4.2.1. Selection of Spatial Econometric Models

The Geoda software was used to analyze the results of the global spatial autocorrelation test of county GDP in the GBA between 2017 and 2022. Under the two spatial weight matrices, the Moran’s I values of the county GDP in the GBA were significant at the levels of 1% and 5%, respectively (Table 4). This indicates that there is a significant positive spatial autocorrelation in the GDP of counties in the GBA, and there is spatial agglomeration between regions of a similar economic scale. Moran’s I value continues to increase, indicating that the overall trend of economic agglomeration in the GBA is improving. It is worth noting that the growth rate of Moran’s I value in 2020–2022 is greater than that in 2017–2019, which further confirms the strengthening of the economic agglomeration pattern in the GBA after the outbreak of the epidemic.
Drawing on previous research [46], we selected the model as follows: Firstly, the LM test statistics of the LM spatial lag, robust LM spatial lag, LM spatial error, and robust LM spatial error all passed the 1% significance test, so the SDM model was preferred. In addition, the Hausman test statistic passed the 5% significance level. Through combining the Wald and LR tests, it was found that the Wald and LR statistics of the SAR and SEM also passed the 5% significance test, leading us to reject that the hypothesis could be simplified. This meant that the two spatial transmission mechanisms included in the SDM could not be ignored in terms of the economic growth in the GBA. Therefore, this article’s authors chose the SDM model for their research.

4.2.2. Comparison of Economic Growth Drivers and Spatial Spillover Effects

(1)
Economic Drivers and Spatial Spillover Effects in the GBA
Model 1 in Table 5 displays the regression results of the economic growth model for counties in the GBA, using the method introduced in Section 2. The R2 value is 0.8007, and the log-likelihood value is 344.8771, indicating that the model has a good fit and a high confidence. The spatial lag coefficient (ρ) of the GDP is 0.232, passing the 1% significance level test, which demonstrates that the economic growth in counties in the GBA has significant positive spatial spillover effects. Investment, consumption, exports, labor, and innovation all have significantly positive impact coefficients. This indicates that these factors are helpful in the growth of the GBA’s economy. The value of investment is far greater than that of the other factors, indicating that investment has the strongest driving effect on economic growth. Investment has always been regarded as one of the “three carriages” that drive economic growth, and it has a significant role in enhancing the economy [12]. The coefficient value of foreign trade exports is higher than that of domestic consumption, which suggests that the economy of the GBA has not yet formed a dual circulation model, with domestic circulation as the main body and domestic and foreign double circulation. The development of domestic consumer demand requires further improvement. The value of innovation is significantly positive, indicating that it has a positive effect on the economy, which is similar to previous research findings [21,47]. A numerical comparison shows that labor factors are a stronger driving force for economic growth than innovation. Among the factors, innovation has a relatively small role in driving the economy. The coefficient of fiscal expenditure is positive but not significant. The value of FDI is significantly negative, indicating that FDI is an impediment to economic growth. The reasons may be that the Guangdong Province was the first to carry out reform around opening up and introducing FDI and that FDI has long been dominated by labor-intensive manufacturing. Multinational companies, in particular, can rely on capital advantages to produce a “squeeze effect” on domestic high-tech enterprises and weaken urban innovation capabilities, thereby hindering technological progress and, ultimately, limiting economic growth.
Model 2 is used as a robustness test for a comparison of the spatial adjacency weight matrix. The results show that, although there are some differences in the size of the variable estimation coefficients, the direction and significance have not changed fundamentally, in particular for ρ, which are always strongly significant (Table 5, Model 1, Model 2). This indicates that the model design of this study is feasible and that the results are robust.
By means of “partial differentiation” [25], the total effect, direct effect, and indirect effect of each variable on the dependent variable in Model 1 were obtained (Table 6). The direct effect reflects the impact of various factors on local economic growth. A positive direct effect value indicates that the factor has a driving effect on local economic growth, and a negative value indicates a hindrance effect, with the absolute value expressing the strength of the effect. The indirect effect reflects the results of factor competition and cooperation between counties [25]. The indirect effect of exports is significantly positive, indicating that all the districts and counties in the GBA formed strong cooperative relations in the production and exports of foreign trade commodities. However, asset investment, consumption, and innovation are not significantly positive, indicating that the effect of promoting the coordinated development of various regions through investment, consumption, and technological exchanges still needs to be improved. The indirect effects of the FDI, fiscal spending, and labor factors are negative, implying that the competition for relevant factors is relatively strong between regions, resulting in “negative spillover effects”.
(2)
Comparison of different periods
In 2020, the large-scale outbreak and spread of the COVID-19 epidemic severely affected investment, consumption, production, supply chains, and freight transportation around the world. In order to understand the impact of the epidemic on economic development in the GBA, this paper compares the samples from 2017–2019 and 2020–2022, and the results are shown in Model 3 and Model 4 in Table 6. The GBA economy had significant positive spatial spillovers in both periods, but the spillovers during the pandemic were weakened. At different times, factors have different impacts on economic growth in the GBA. In 2017–2019, investment and exports played a significant role in driving the economy of the GBA, while the role of consumption was not significant. In 2020–2022, investment and consumption became the main drivers of economic growth, and their coefficient values increased significantly. This shows that, considering the impact of the COVID-19 epidemic, increasing asset investment and consumption is an important way of ensuring stable economic growth. The export coefficient transitioned from being significantly positive to being insignificantly positive, which may be related to the significant decline in China’s exports during the early stages of the epidemic.

5. Conclusions

This paper used panel data on the county scale in the GBA from 2017 to 2022. Firstly, the evolution of the economic factors of the GBA was analyzed, and then we used SDM to study economic growth drivers and spatial spillover effects. The main conclusions are as follows:
① The economic spatial distribution pattern of the GBA shows a “core–edge” characteristic, and the economic agglomeration is remarkable. After the outbreak of the COVID-19 epidemic, the economic agglomeration in the GBA intensified, and the economic gap between the core area and the edge area further widened. The SDE of GDP in the GBA county regions generally follows a southeast-to-northwest pattern. After the COVID-19 outbreak, the economic center shifted slightly towards the northwest.
② From 2017 to 2022, the investment volatility in the GBA was relatively small, but the growth rate gradually decreased. FDI, consumption, and export curves fluctuated significantly. COVID-19 had a significant impact on consumption and exports but had a smaller impact on FDI in the PRD. The stability of various economic indicators in Hong Kong and Macao was lower than that in the PRD.
③ The county economy of the GBA has significant spatial spillover effects. Investment, consumption, exports, labor, and innovation all have a positive impact on the economic growth of counties in the GBA, while FDI has a negative impact. The driving effect of investment on the economy is stronger than that of the other variables. Exports are stronger than consumption. A time comparison shows that the spatial spillover effect of the county economy in the GBA weakened during the epidemic, with investment and consumption becoming the main driving forces behind economic growth.

6. Discussion

6.1. Spatial Spillover and Regional Inequality

This study found that the development of the GBA is uneven, but there is a significant spatial spillover effect. The economic spillover effect indicates the possibility of narrowing the regional development gap. After the outbreak of COVID-19, the economic gap in the GBA widened, and the spillover effect weakened. This phenomenon may be related to the obstruction of intercity movement during the epidemic period. With the lifting of epidemic prevention and control measures and the disappearance of obstacles to regional connections, the intensity of economic spillover should gradually recover. However, there are still differences in various regions in the GBA, such as “one country, two systems, three tariff zones, and three currencies”. They restrict the flow of factors, which is not conducive to the enhancement of economic spillover effects. Therefore, integrating standards and rules and eliminating institutional, cultural, and policy barriers are of great significance for narrowing the development gap in the GBA.

6.2. The Economic Impact of COVID-19 on the GBA

The impact of COVID-19 on the economy of the GBA is mainly reflected in the weakening of spatial spillovers, the strengthening of economic agglomeration, the decline in factor growth, and the change in the driving effect of factors on the economy. After the outbreak of COVID-19, the economic agglomeration in the GBA further intensified. Consumption, foreign direct investment, and exports were greatly impacted by COVID-19, but the impact on investment was relatively small. In different periods, the driving effects of various factors on economic growth also varied. From 2017 to 2019, investment and exports played a significant role in driving economic growth, while consumption was not significant. From 2020 to 2022, investment and consumption became the main driving forces. We also discovered that Hong Kong and Macao were significantly impacted by COVID-19, leading to instability in their economic development.

6.3. Spatial Autocorrelation, Spatial Spillover Effect, and Spatial Agglomeration

After the outbreak of COVID-19, economic agglomeration in the Greater Bay Area strengthened, and the Global Moran’ I of the GDP in the counties significantly increased, while the spatial spillover effect weakened. There are some connections among these phenomena. Global Moran’s I reflects whether spatial data exhibit a trend of clustering or dispersion as well as the strength and significance of this trend. The spatial spillover effect refers to the impact of one region’s economic growth on neighboring regions through the externalities of factors such as capital and knowledge. The interaction between regions often provides conditions for spatial spillover effects. The enhancement of spatial spillover is conducive to the coordinated development of the region in question. However, during the pandemic, interregional connections were greatly hindered, resulting in a weakening of spillover effects. This is likely to be one of the important reasons for the intensification of economic agglomeration in the GBA.

6.4. Limitations and Prospects

This study provides a comprehensive understanding of the economic impact of COVID-19 using various methods, providing the foundation for formulating targeted policies to promote economic recovery. There are still some limitations to this study that can serve as the focal points for future research. Firstly, due to the time limit on the statistical data, the timespan of this study is relatively short. The long-term impact of the COVID-19 pandemic on the global economy needs to be continuously tracked and revealed. The COVID-19 pandemic caused significant obstacles to the flow of people, logistics, information technology, and other factors between regions, inevitably affecting inter-regional economic cooperation. In the future, we will attempt to conduct research into inter-regional economic connections and the evolution of regional economic patterns from the perspective of factor flow.

Author Contributions

Methodology, Xiaojin Huang, Xiaoming Li and Renzhong Guo; software, Xiaojin Huang and Minmin Li; validation, Xiaojin Huang and Yong Fan; formal analysis, Renzhong Guo; data curation, Yaxing Li; writing—original draft preparation, Xiaojin Huang and Xiaoming Li; writing—review and editing, Xiaojin Huang and Minmin Li; supervision, Xiaoming Li and Renzhong Guo. All authors have read and agreed to the published version of the manuscript.

Funding

This research was funded by the Guangdong Science and Technology Strategic Innovation Fund (the Guangdong–Hong Kong–Macao Joint laboratory Program) (No.2020B1212030009), the Major consulting project of the Chinese Academy of Engineering (No. 2022-XBZD-10), the Shenzhen Science and Technology Program (Shenzhen Key laboratory of Digital Twin Technologies for Cities) (Grant Number ZDSYS20210623101800001), the Shenzhen Polytechnic Research Fund (6023310002K).

Data Availability Statement

The data presented in this study are available on request from the corresponding author. The data are not publicly available because research is ongoing.

Conflicts of Interest

The authors declare no conflicts of interest.

References

  1. Takyi, P.O.; Dramani, J.B.; Akosah, N.K.; Aawaar, G. Economic activities’ response to the COVID-19 pandemic in developing countries. Sci. Afr. 2023, 20, e01642. [Google Scholar] [CrossRef] [PubMed]
  2. Wu, J.; Zhan, X.; Xu, H.; Ma, C. The economic impacts of COVID-19 and city lockdown: Early evidence from China. Struct. Chang. Econ. Dyn. 2023, 65, 151–165. [Google Scholar] [CrossRef] [PubMed]
  3. Goel, R.K.; Saunoris, J.W.; Goel, S.S. Supply chain performance and economic growth: The impact of COVID-19 disruptions. J. Policy Model. 2021, 43, 298–316. [Google Scholar] [CrossRef]
  4. Salamaga, M. Assessment of the risk of foreign divestment in Poland during the COVID-19 pandemic. Wiad. Stat. 2021, 66, 26–42. [Google Scholar] [CrossRef]
  5. Liu, H.; Fang, C.; Gao, Q.; Yang, J. Evaluating the Real-Time Impact of COVID-19 on Cities: China as a Case Study. Complexity 2020, 2020, 1–11. [Google Scholar] [CrossRef]
  6. Cheng, Y.; Liu, H.; Wang, S.; Cui, X.; Li, Q. Global Action on SDGs: Policy Review and Outlook in a Post-Pandemic Era. Sustainability 2021, 13, 1–25. [Google Scholar] [CrossRef]
  7. Dritsaki, C.; Stiakakis, E. Foreign Direct Investments, Exports, and Economic Growth in Croatia: A Time Series Analysis. Procedia Econ. Financ. 2014, 14, 181–190. [Google Scholar] [CrossRef]
  8. Szkorupová, Z. A Causal Relationship between Foreign Direct Investment, Economic Growth and Export for Slovakia. Procedia Econ. Financ. 2014, 15, 123–128. [Google Scholar] [CrossRef]
  9. Rahman, M.M.; Alam, K. Exploring the driving factors of economic growth in the world’s largest economies. Heliyon 2021, 7, e07109. [Google Scholar] [CrossRef]
  10. E.Baldwin, R.; Martin, P.; Ottaviano, G.I.P. Global Income Divergence, Trade, and Industrialization: The Geography of Growth Take-Offs. J. Econ. Growth 2001, 6, 5–37. [Google Scholar] [CrossRef]
  11. Oosterhaven, J.; Hoen, A.R. Preferences, Technology, Trade and Real Income Changes in the European Union. Ann. Reg. Sci. 1998, 32, 505–524. [Google Scholar] [CrossRef]
  12. Wang, Y. The Stage Characteristics of the Evolution of Chinese Resident Consumption Patterns. Economist. 1994, 2, 52–58. [Google Scholar] [CrossRef]
  13. Lin, X. Multiple pathways of transportation investment to promote economic growth in China: A structural equation modeling perspective. Transp. Lett. 2019, 12, 471–482. [Google Scholar] [CrossRef]
  14. Ullah, S.; Ali, K.; Ehsan, M. Foreign direct investment and economic growth nexus in the presence of domestic institutions: A regional comparative analysis. Asia-Pac. J. Reg. Sci. 2022, 6, 735–758. [Google Scholar] [CrossRef]
  15. Minchun, H.; Lina, Z. The Impact of FDI Withdrawing in Manufacturing on Chinese Employment and the Effectiveness of Respongding Policies. J. Quant. Technol. Econ. 2015, 32, 56–72. [Google Scholar]
  16. Mah, J.S. Economic growth, exports and export composition in China. Appl. Econ. Lett. 2007, 14, 749–752. [Google Scholar] [CrossRef]
  17. Li, W. Changes in China’s Consumption, Investment and Export and Their Contributions to Economic Growth. Econ. Geogr. 2019, 39, 31–38. [Google Scholar] [CrossRef]
  18. Lucas, R.E. On the Mechanics of Economic Development. J. Monet. Econ. 1988, 22, 3–42. [Google Scholar] [CrossRef]
  19. Krugman, P. Increasing Returns and Economic Geography. J. Political Econ. 1991, 99, 483–499. [Google Scholar] [CrossRef]
  20. Conley, T.G.; Ligon, E. Economic distance and cross-country spillovers. J. Econ. Growth 2002, 7, 157–187. [Google Scholar] [CrossRef]
  21. Sheng, Y.; Luo, H.; Song, J.; Zhao, J.; Zhang, X. Evaluation, influencing factors and spatial spillover of innovation efficiency in five major urban agglomerations in coastal China. Geogr. Res. 2020, 39, 257–271. [Google Scholar] [CrossRef]
  22. Tang, C.; Qiu, P.; Dou, J. The impact of borders and distance on knowledge spillovers—Evidence from cross-regional scientific and technological collaboration. Technol. Soc. 2022, 70, 1–11. [Google Scholar] [CrossRef]
  23. Sun, C.; Yang, Y.; Zhao, L. Economic spillover effects in the Bohai Rim Region of China: Is the economic growth of coastal counties beneficial for the whole area? China Econ. Rev. 2015, 33, 123–136. [Google Scholar] [CrossRef]
  24. Gong, W.; Ni, P.; Xu, H. The Spatial Spillover Effect and Spillover Bandwidth of Influential Factors to Urban Economic Competitiveness: Based on the Spatial Econometric Analysis of 285 Cities in China. Nanjing J. Soc. Sci. 2019, 9, 23–30, 38. [Google Scholar]
  25. Yan, D.; Yue, W.; Wei, S.; Li, P. A comparative study on the driving factors and spatial spillover effects of economic growth across different regions of China. Geogr. Res. 2021, 40, 3137–3153. [Google Scholar] [CrossRef]
  26. Wang, S.; Wang, Y.; Zhao, Y. Spatial spillover effects and multi-mechanism for regional development in Guangdong province since 1990s. Acta Geogr. Sin. 2015, 70, 965–979. [Google Scholar] [CrossRef]
  27. Sun, B.; Song, D. Do large cities contribute to economic growth of small cities? Evidence from Yangtze River Delta in China. Geogr. Res. 2016, 35, 1615–1625. [Google Scholar]
  28. Wu, S.; Li, L.; Li, S. Natural resource abundance, natural resource-oriented industry dependence, and economic growth: Evidence from the provincial level in China. Resour. Conserv. Recycl. 2018, 139, 163–171. [Google Scholar] [CrossRef]
  29. Zhu, F.; Wu, X.; Peng, W. Road transportation and economic growth in China: Granger causality analysis based on provincial panel data. Transp. Lett. 2021, 14, 710–720. [Google Scholar] [CrossRef]
  30. Zhang, X.; Yu, S.; Ding, X.; Li, M.; Miao, Y.; Wang, C. Urban growth and shrinkage with Chinese characteristics: Evidence from Shandong Province, China. Appl. Geogr. 2023, 159, 1–13. [Google Scholar] [CrossRef]
  31. Zeng, G.; Hu, Y.; Zhong, Y. Industrial agglomeration, spatial structure and economic growth: Evidence from urban cluster in China. Heliyon 2023, 9, 1–11. [Google Scholar] [CrossRef] [PubMed]
  32. Yang, Z.; Shao, S.; Xu, L.; Yang, L. Can regional development plans promote economic growth? City-level evidence from China. Socio-Econ. Plan. Sci. 2021, 83, 1–13. [Google Scholar] [CrossRef]
  33. Fang, Z.; Chen, Y. Human capital and energy in economic growth—Evidence from Chinese provincial data. Energy Econ. 2017, 68, 340–358. [Google Scholar] [CrossRef]
  34. Li, H.; Strauss, J.; Hu, S.; Lui, L. Do high-speed railways lead to urban economic growth in China? A panel data study of China’s cities. Q. Rev. Econ. Financ. 2018, 69, 70–89. [Google Scholar] [CrossRef]
  35. Li, S.; Hou, Y.; Liu, Y.; Chen, B. The Analysis on Survey of Local Protection in China Domestic Market. Econ. Res. J. 2004, 11, 78–84. [Google Scholar]
  36. Chen, P.; Zhu, X. Regional Inequalities in China at Different Scales. Acta Geogr. Sin. 2012, 67, 1085–1097. [Google Scholar]
  37. Li, D.; Yu, H.; Li, X. The Spatial-Temporal Pattern Analysis of City Development in Countries along the Belt and Road Initiative Based on Nighttime Light Data. Geomat. Inf. Sci. Wuhan Univ. 2017, 42, 711–720. [Google Scholar]
  38. Hengmei, G.; Xiaodong, M. Evolution of Economic Spatial Pattern and Centrality Measure of Huaihai Economic Zone Based on Night-Time Light Data. Geogr. Geo-Inf. Sci. 2020, 36, 34–40, 125. [Google Scholar]
  39. Yu, S.; Ting, L.; Yao, T.; Weiping, Z.; Wei, T. Quantitative analyses of changes in urban spatial morphology under rapid urbanization in China. Ecol. Sci. 2015, 34, 122–126. [Google Scholar] [CrossRef]
  40. Amelin, L. Local Indicators of Spatial Association-LISA. Geogr. Anal. 1995, 27, 93–115. [Google Scholar]
  41. Chen, G.; Wang, Z. Local fiscal expenditure and economic growth in China Analysis of Linear Mixed Models for Inter provincial Data. Public Financ. Res. 2014, 8, 42–45. [Google Scholar] [CrossRef]
  42. Hu, G.; Liu, S. Economic Policy Uncertainty (EPU) and China’s Export Fluctuation in the Post-pandemic Era: An Empirical Analysis based on the TVP-SV-VAR Model. Front. Public Health 2021, 9, 1–11. [Google Scholar] [CrossRef] [PubMed]
  43. Di Stefano, E.; Giovannetti, G.; Mancini, M.; Marvasi, E.; Vannelli, G. Reshoring and plant closures in Covid-19 times: Evidence from Italian MNEs. Int. Econ. 2022, 172, 255–277. [Google Scholar] [CrossRef]
  44. Oosterhaven, J.; Van Der Linden, J.A. European Technology, Trade and Income Changes for 1975–85: An Intercountry Input–Output Decomposition. Econ. Syst. Res. 1997, 9, 393–412. [Google Scholar] [CrossRef]
  45. Yi, L.; Ji, J.; Zhang, Y.; Yu, Y. Economic resilience and spatial divergence in the GuangdongHong Kong-Macao Greater Bay Area in China. Geogr. Res. 2020, 39, 2029–2043. [Google Scholar] [CrossRef]
  46. Elhorst, J.P. Applied Spatial Econometrics: Raising the Bar. Spat. Econ. Anal. 2010, 5, 9–28. [Google Scholar] [CrossRef]
  47. Ye, A.; Chen, X. Impulse response analysis on FDI, innovation and economic growth in time and space. Geogr. Res. 2019, 38, 273–284. [Google Scholar]
Figure 1. (a) Location of GBA in China; (b) Urban composition of the GBA; (c) Degree of dependence of the GBA on foreign trade exports.
Ijgi 13 00009 g001
Figure 2. GDP standard deviation ellipse and economic core area of the counties in the GBA. Note: 2018 SDE and 2017 SDE are covered by 2019 SDE due to their close centers and similar shapes.
Ijgi 13 00009 g002
Figure 3. Evolution of economic density of the GBA.
Ijgi 13 00009 g003
Figure 4. Changes in the growth rate of major economic indicators.
Ijgi 13 00009 g004
Table 1. Main variables in the SDM.
TypeNameUnitDescription
Dependent variable (Y)GDPbillion RMBGross Domestic Product
Core variables (X)Investment (Inv)¥100 millionFixed asset investment
Consumption (Con)¥100 millionThe total retail sales of social consumer goods
Foreign direct investment (FDI)¥100 millionActual use of foreign direct investment
Exports (Exp)¥100 millionTotal foreign trade exports
Control variables (Z)Fiscal (Fis)¥100 millionLocal general public budget expenditure
Labor (Lab)peopleYear-end employees of the entire society
Innovation (Inn)Items per 10,000 peopleThe number of authorized domestic invention patents 1/Year-end permanent population
1 There is a certain lag in the transformation of scientific innovation from patent to productivity, so the number of domestic invention patents authorized uses data from the previous 5 years.
Table 2. Comparison of the main statistical indicators.
Mainland ChinaHong KongMacao
Gross Domestic Product (GDP)Gross Domestic ProductGross Domestic Product
Year-end permanent populationMid-year permanent populationMid-year population
Year-end employees of the whole societyMid-year employed populationMid-year employed population
Fixed asset investmentGross domestic fixed capital formationGross Fixed Capital Formation
Local general public budget expenditureTotal government spendingTotal government expenditure
Actual use of foreign direct investmentYear-end foreign investment positionTotal foreign direct investment
The number of authorized domestic invention patentsNumber of patents granted in Hong Kong *Number of patents granted in Macao *
The total retail sales of social consumer goodsTotal retail sales of social consumer goodsMajor retail sales of social consumer goods
Total foreign trade exportsOverall exports of foreign merchandise tradeForeign merchandise trade exports
* Since Hong Kong and Macao do not distinguish between invention patents, utility model patents, and design patents, the number of invention patents in the two Special Administrative Regions was estimated by multiplying the ratio of invention patents in the nine cities of Guangdong to the total patents by the total number of patents in Hong Kong and Macao.
Table 3. The economic concentration (R).
Region201720182019202020212022
Core area 12.622.622.632.672.662.67
Edge area0.220.220.210.190.200.19
1 The core area comprises the 27 counties (county-level cities and districts) identified above, while the edge area includes non-core areas.
Table 4. Global Moran’ I of county GDP in the GBA.
Weight Matrix201720182019202020212022
W10.123 ***
(3.371)
0.131 ***
(3.491)
0.134 ***
(3.554)
0.154 ***
(3.862)
0.178 ***
(4.028)
0.185 ***
(4.142)
W20.097 ***
(2.201)
0.101 **
(2.213)
0.102 **
(2.214)
0.117 **
(2.481)
0.140 **
(2.684)
0.145 **
(2.754)
Note: Numbers in parentheses are t values; *** and ** refer to significance at the 1% and 5% levels, respectively; W1 is the geographical distance weight matrix; and W2 is the spatial adjacency matrix.
Table 5. Comparison of the main statistical indicators.
VariableModel 1Model 2Model 3Model 4
lnInv0.220 ***
(6.89)
0.199 ***
(6.48)
0.086 ***
(3.4)
0.065 *
(1.80)
lnCon0.054 **
(2.15)
0.051 **
(2.12)
0.009
(0.56)
0.137 ***
(3.86)
lnFDI−0.017 **
(−2.53)
−0.013 **
(−2.01)
−0.007
(−1.35)
−0.004
(−0.81)
lnExp0.093 ***
(3.67)
0.082 ***
(3.35)
0.044 **
(2.08)
0.027
(1.48)
lnFis0.003
(0.50)
0.003
(0.55)
lnLab0.090 *
(1.88)
0.096 *
(1.93)
lnInn0.019 ***
(2.74)
0.016 **
(2.53)
WxlnInv0.107
(1.65)
0.166 ***
(2.61)
0.013
(0.26)
0.117 *
(1.68)
WxlnCon0.017
(0.37)
−0.014
(−0.35)
0.022
(0.78)
0.432 ***
(5.13)
WxlnFDI−0.004
(−0.41)
−0.0003
(−0.02)
−0.003
(−0.44)
0.013
(1.47)
WxlnExp0.100 **
(2.15)
0.057
(1.15)
−0.044
(−1.19)
0.023
(0.69)
WxlnFis−0.014
(−0.62)
−0.027 ***
(−2.73)
WxlnLab−0.015
(−0.21)
−0.108
(−1.40)
WxlnInn0.003
(0.38)
−0.004
(−0.40)
ρ 0.232 ***
(3.50)
0.328 ***
(5.12)
0.666 ***
(11.10)
0.3244 ***
(4.02)
Log-likelihood344.8771360.3395296.9834301.8451
R20.80070.77920.76610.7227
N312312156156
Note: Numbers in parentheses are t values; ***, **, and * refer to significance at the 1%, 5%, and 10% level; Model 1 and Model 2 used the 2017–2022 county sample of the GBA, and the spatial weight matrices used W1 and W2, respectively; Model 3 used the 2017–2019 GBA county sample and W1; Model 4 used the 2020–2022 GBA county sample and W1.
Table 6. Effect breakdown of the Model 1.
Total EffectDirect EffectIndirect Effect
lnInv0.423 ***0.231 ***0.192 ***
(5.67)(7.13)(2.80)
lnCon0.0970.055 **0.042
(1.62)(2.27)(0.76)
lnFDI−0.027 *−0.017 ***−0.010
(−1.84)(−2.61)(−0.76)
lnExp0.246 ***0.100 ***0.147 ***
(4.18)(4.10)(2.80)
lnFis−0.0110.003−0.014
(−0.36)(0.40)(−0.48)
lnLab0.0930.092 **0.001
(1.12)(2.00)(0.02)
lnInn0.029 **0.019 ***0.010
(2.29)(2.78)(0.89)
Note: Numbers in parentheses are t values; ***, **, and * refer to significance at the 1%, 5%, and 10% level.
Disclaimer/Publisher’s Note: The statements, opinions and data contained in all publications are solely those of the individual author(s) and contributor(s) and not of MDPI and/or the editor(s). MDPI and/or the editor(s) disclaim responsibility for any injury to people or property resulting from any ideas, methods, instructions or products referred to in the content.

