Article

Detecting the Spatial Association between Commercial Sites and Residences in Beijing on the Basis of the Colocation Quotient

School of Internet of Things, Nanjing University of Posts and Telecommunications, Nanjing 210023, China
*
Author to whom correspondence should be addressed.
ISPRS Int. J. Geo-Inf. 2024, 13(1), 7; https://doi.org/10.3390/ijgi13010007
Submission received: 25 October 2023 / Revised: 11 December 2023 / Accepted: 21 December 2023 / Published: 26 December 2023

Abstract

:
Identifying the spatial association between commercial sites and residences is important for urban planning. However, (1) the patterns of spatial association between commercial sites and residences across an urban space and (2) how the spatial association patterns of each commercial format and different levels of residences vary remain unclear. To address these gaps, this study used point-of-interest data of commercial sites and residences in Beijing, China, to calculate colocation quotients, which were used for identifying the spatial association characteristics and patterns of commercial sites and residences in the city. The results show that (1) the global colocation quotient of commercial sites and residences in Beijing is below 1, indicating relatively weak spatial association. The spatial association between each commercial format and residences varies greatly and shows the characteristics of integration of high-frequency consumption and separation of low-frequency consumption. Additionally, the spatial associations between high-grade residences and commercial formats are relatively weak, whereas those between low-grade residences and commercial formats are relatively strong. (2) The local spatial association patterns of various commercial formats and residences exhibit obvious spatial heterogeneity. Overall, the proportions of various commercial formats attracted by residences are considerably higher than those of residences attracted by various commercial formats, revealing spatial asymmetry. Within the Fourth Ring Road, commercial formats are mainly attracted by residences, showing a spatial association pattern of “distribute commercial sites according to the location of residences”. The proportions of residences attracted by commercial formats increase outside the Fourth Ring Road, presenting a spatial association pattern of “commercial formats attracting residences”. The findings offer valuable insights into the development mechanisms of commercial and residential spaces and provide valuable information for urban planning.

1. Introduction

Commercial sites and residences are the two dynamic and vital components of urban spaces. Owing to socioeconomic development, commercial sites and residences have become spatially dependent and closely connected physical spaces [1,2]. Traditionally, commercial sites and residences always present specific spatial associations. In early feudal society in China, the spatial association between commercial sites and residences manifested as the separation of “neighborhood” and “market” in the “Lifang system” [3]. After the middle of the Tang Dynasty, the spatial association between commercial sites and residences appeared as a combination of “neighborhood” and “market” in the “Jiefang system” [3]. In modern society, commercial sites are always concentrated around residences, and the development of commerce is dominated by the relocation of residences during suburbanization. All these phenomena reflect shifts in spatial associations between commercial sites and residences in the form of geospatial associations, such as distribution, distance, and topological associations. China’s rapid urbanization and population growth are causing polycentricity, decentrality, and even recentrality in its urban commercial and residential spaces [4]. Specifically, its residential spaces have been restructured as a result of the marketization of land and housing as well as increasing suburbanization [5]. Moreover, the rise of e-commerce and online purchasing has substantially altered the original urban commercial formats, which refer to the business forms or sales forms of commerce [4], and has shifted the focus from shopping to experiential consumption. These changes have resulted in a mismatch between commercial sites and residences in terms of scale, function, format, and distribution [4,5,6,7]. As the spatial association between commercial sites and residences has a significant impact on people’s daily lives and social fairness [8,9,10], investigating and assessing the spatial associations between commercial sites and residences is essential to streamlining commercial facilities’ and residences’ organization, increasing the efficiency of urban function allocation, and realizing scientific planning and management [11,12].
According to Tobler’s first law of geography, “all things and phenomena on the earth surface are spatially associated” [13]. Spatial association is a fundamental characteristic of geospatial phenomena and processes [14]. The spatial association between commercial sites and residences comprises three elements: commercial sites, residences, and the flow of consumption between them [15]. Current research has focused on two aspects: the physical spatial association between the distributions of the two types of spaces from a static perspective [4,16,17,18] and the functional spatial association based on the consumption behavior of the two types of spaces from a dynamic perspective [15,19,20,21]. Studies based on the dynamic perspective are often based on questionnaire survey data [22]. Owing to the number of samples in residential areas and the accuracy of data, determining the characteristics of the spatial association between commercial sites and residences in a whole city is difficult. By employing the concept of “self-containment” in the urban planning field, static research on this topic has mostly been conducted from a mixed-land-use perspective, referring to an appropriate commercial facility–housing ratio [23] or the spatial correlation between the distributions of commercial facilities and housing [4,24]. These studies have mainly focused on the static spatial correlation and mismatch between commercial sites and residences by employing land-use or point-of-interest (POI) data [4,25]. These two types of functional spaces affect each other’s spatial distributions in different ways and to varying degrees, and their spatial association is heterogeneous across a city. Moreover, people with varying sociodemographic traits often reside in residences of different levels in a city. The spatial association between each commercial format and residences of different levels also varies [24]. However, current analysis methods cannot capture the process and mechanism underlying the spatial association between commercial sites and residences, creating a research gap that needs to be filled.
With the advancement of big data collection and analysis technologies, POI data have become key data sources for explaining urban spatial organization. By reflecting the locations and attributes of geographic entities [26], POI data have expanded the research possibilities for urban spatial organization [27]. With the rapid expansion of urban commercial sites and residences, POI data with full-sample characteristics provide a new perspective for quantitative research on the spatial association between the two types of spaces. By adopting the concept of location quotient in economic geography, Leslie et al. [28,29] introduced a quantitative analysis method called the colocation quotient, which measures the directed spatial dependence among different elements. This method allows for the analysis of the spatial association among spatial elements from the perspective of asymmetric spatial dependence and of the spatial heterogeneity of spatial association at the local scale [30]. The application of this method has been widely recognized in research on the spatial association of a variety of situations, such as crime, urban planning, transportation, and public health, and it has become valuable for discovering the patterns of spatial interaction, dependence, causality, or symbiosis among spatial entities [30,31,32,33,34,35,36].
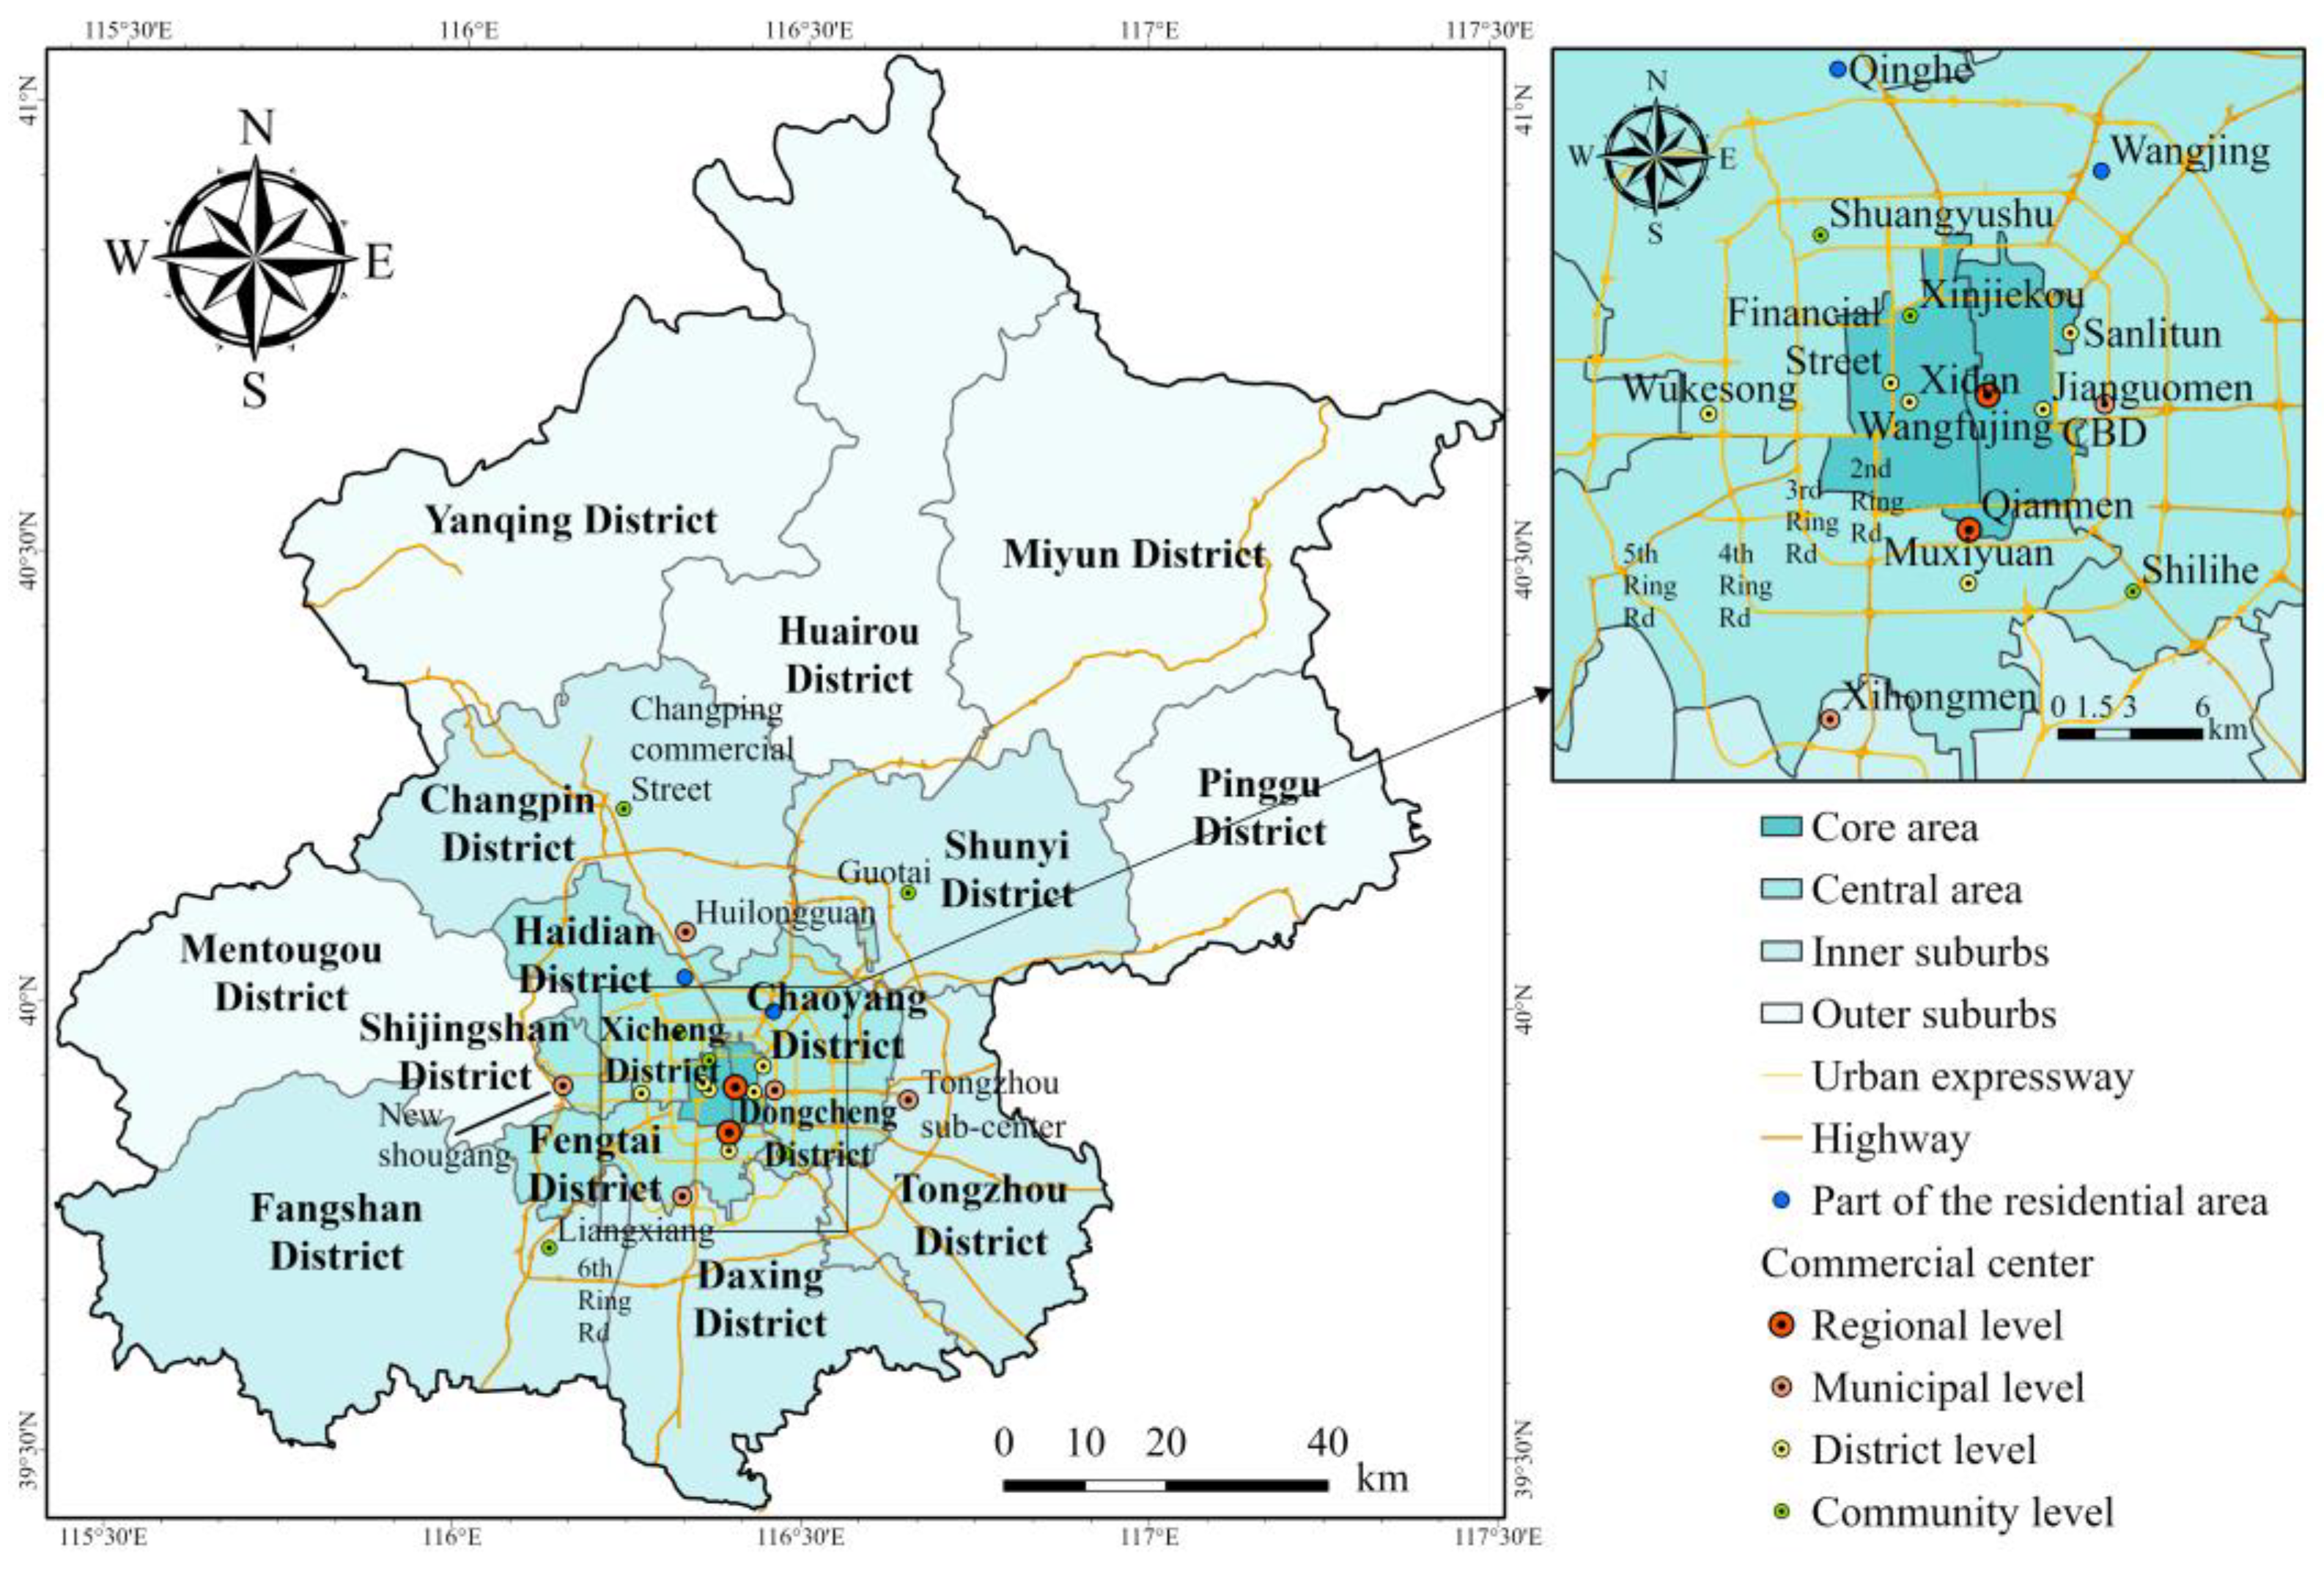
This study employs POI data of commercial sites and residences in Beijing and the colocation quotient to analyze the characteristics and patterns of the spatial association between commercial sites and residences. First, the global colocation quotient (GCLQ) is applied to explore the spatial association between different commercial formats and different levels of residences at the city scale. Second, the local colocation quotient (LCLQ) is applied to explore the local characteristics of the spatial associations between commercial sites and residences. The research aims to answer the following questions: (1) what are the spatial association patterns between commercial sites and residences across an urban space, (2) how do the spatial association patterns of each commercial format and different levels of residences vary, which commercial format in an area contributes to the development of residence, and which commercial format in an area is attracted by the development of residence? The findings of this research can help reveal the spatial development mechanisms of urban commercial sites and residences and create a commerce–residence balanced region, providing insights for urban planners to improve commercial accessibility, reduce consumption inequality, and achieve self-contained goals in the context of urban spatial restructuring.

2. Literature Review

2.1. Spatial Association of Commercial and Residential Spaces

Residents value having access to commercial facilities, and a livable residence is correlated with high commercial accessibility [17]. However, different residential areas may have different levels of commercial accessibility, leading to differentiated commercial and residential spatial associations, because business owners’ decisions about where to locate their establishments are influenced by the sociodemographic characteristics of residences [24]. Contrary to what the term “retail deserts” suggests, wealthy residential areas have better access to commercial facilities than residential areas with low household incomes and low levels of education, which exhibit few commercial facilities [4,6,9,12]. Few merchants enter high-poverty residential areas because of negative market conditions (i.e., low-income households are associated with low demand for goods and services) [9]. By contrast, high-income residents may keep specific unwanted commercial establishments that cause traffic or noise problems out of their local vicinity. These findings imply that high-income residents prefer to live in low-density residential areas [37] and suggest notable variations among different residential areas and different commercial formats in terms of spatial association between the two spaces.

2.2. Chinese Context

Suburbanization has led to the expansion and decentralization of urban facilities and populations [38]. Many mid- and high-income residents in North American cities have decentralized to suburban areas, while low-income residents remain primarily concentrated in city cores [39]. Apart from the suburbanization of the population, many commercial establishments have moved to suburban areas [40]. Thus, suburban residential areas in North American metropolises have high concentrations of commercial facilities [41]. However, Chinese cities present a suburbanization paradigm distinct to that in North America. Owing to the limited land and high housing prices in the city cores in China, manufacturing and housing are dispersed to suburban areas [42]. Low-income residents are the first to settle in suburban areas. In newly established communities in suburban area, the issue “retail deserts” has been raised [43]. As low-income residential areas are already at a disadvantage in the housing market and often face residential segregation, the self-contained community design norm has not been proven to be effective in practice. Thus, Chinese suburban areas have less self-contained and balanced spatial associations between commercial sites and residences than suburban areas in North America. Residents in China’s city cores seem to be more resilient to problems with commercial accessibility because commercial facilities are concentrated around residential areas [44].
Disparities in the spatial association between commercial sites and residences among different residential areas and different commercial formats is increasingly becoming prominent with regard to the growing urban spatial restructuring and residential segregation in urban China [45]. Thus, exploring the patterns of spatial association between commercial sites and residences and evaluating social justice in consumption among different residential areas are imperative.

3. Study Area, Data, and Methodology

3.1. Study Area

Beijing is one of the top 10 commercial cities in China and has a long history of commercial development and a variety of commercial functions. Beijing’s commercial spaces have gradually evolved from an early monocentric and pyramid-type structure to a polycentric and flattening structure with commercial centers showing complex formats during the past few decades [46]. Social segmentation and residential differentiation in this city have grown in importance because of housing marketization and rapid suburbanization [47,48]. The concentrated population and functions in Beijing have caused a series of serious metropolitan problems, such as traffic congestion, housing shortage, and high prices. Thus, since 2005, the Beijing government has initiated an urban master plan to relocate residential function and some industries from the city core. On the basis of the existing satellite towns, 11 new towns were planned to decentralize the population and urban functions of the city core. The suburbanization of residential function has been successful, whereas the diffusion of commercial facilities to the suburbs remains relatively insufficient, leading to a mismatch between commercial and residential spaces [49]. Thus, given the prominently uneven distribution of commercial facilities and residences in Beijing, it is an ideal city for the study on spatial association between commercial sites and residences.
Beijing has a total area of 16,410.54 km2, with 16 municipal districts under its jurisdiction. As we will explore differences among urban circles in terms of the spatial association between commercial sites and residences, we divide the city into four circles according to the Beijing Urban Master Plan (2016–2035): core area, central area, inner suburbs, and outer suburbs (Figure 1). The commercial centers in Beijing have four levels, namely, regional, municipal, district, and community (Figure 1).

3.2. Data

Third-party web data crawler tools were applied to obtain the POI data of commercial sites and residences from Baidu Map (https://map.baidu.com) on 20 December 2018 and Lianjia.com (https://www.lianjia.com) on 22 December 2018 (Figure 2). Baidu Map and Lianjia.com are reputable and popular platforms in China and have strict data quality control measures. The data on these two platforms are timely updated and reviewed by a large number of users. A series of preprocessing steps was completed before analysis. First, invalid data were eliminated by filtering data. Then, the coordinate systems of data from different sources were corrected and matched. Finally, the POI data were reclassified according to the needs of our study. We checked the accuracy of the data through map identification and sampling. The commercial POI data comprised various types of information, such as merchant name, address, latitude and longitude coordinates, and commercial format. According to the Chinese National Standard Classification of Commercial Formats and the attribute code of the commercial POI data, the commercial formats in Beijing can be divided into 10 categories (Table 1). A total of 235,549 valid commercial POI data were collected. Meanwhile, the residential POI data comprised various types of information, including residential neighborhood name, housing price, building age, and latitude and longitude coordinates. A total of 7618 valid residential POI data were obtained. Given that the sociodemographic characteristics of the residents in a neighborhood considerably influence the distribution of surrounding commercial establishments, we needed to classify the residences to determine the differences among the spatial associations of different residences and commercial formats. We used the average housing price of the residence to differentiate the grades of residences because of the lack of household income and family type of residence. According to urban planning and construction, residential neighborhoods are usually categorized into three levels: high-, middle-, and low-grade residences. To minimize the differences within groups and maximize differences among groups, we applied Jenks natural breaks algorithm to classify residences into three groups according to housing price (Table 2).

3.3. Methodology

The colocation quotient can effectively explore the spatial association between different elements and can be measured at the global and local scales, that is, global colocation quotient (GCLQ) and local colocation quotient (LCLQ) [30,36]. GCLQ is measured on the basis of the nearest neighbors and is calculated as follows:
G C L Q A B = N A B / N A N B / ( N 1 ) ,
where G C L Q A B is the degree to which elements A are attracted by elements B; N is the number of all elements in the study area; N A is the number of elements A; N B is the number of elements B; N A B is the number of elements A having elements B as their nearest neighbors; N A B / N A is the proportion of elements B having elements A as their nearest neighbor in the study area; and N B / ( N 1 ) is the proportion of elements B that are the nearest neighbors of elements A in a random situation; G C L Q A B indicates that the association between elements A and B is asymmetric, and its value can reflect the spatial association degree between the two elements. If G C L Q A B is greater than 1, then the spatial association between elements A and B is strong, and elements A tends to be attracted by elements B. If G C L Q A B is less than 1, then the attraction of elements B to elements A is weak, and the distributions of the two elements tend to be scattered. If G C L Q A B is equal to 1, then elements A and B tend to be randomly distributed (Figure 3).
Cromley et al. [30] extended the GCLQ and considered the spatial heterogeneity of the association between different elements, and LCLQ can provide detailed site-specific association patterns and can capture the variability of association patterns across places. It can effectively reveal the spatial processes and potential driving factors of the development of regional associated elements. Thus, LCLQ is used to reveal the local spatial association between elements and is expressed as follows:
L C L Q A B i = N A B i N A / ( N 1 ) ,
N A B i = j = 1 N ( w i j f i j j = 1 ( j i ) N w i j ) , ( j i ) ,
w i j = exp ( 0.5 d i j 2 d i b 2 )
where L C L Q A B i is the degree of elements A attracted by element Bi; N A B i is the weighted average of the number of elements A in the neighborhood of element Bi; f i j is a binary variable indicating whether point j belongs to elements A (values of 1 for yes, and 0 for no); and w i j is the weight of point j, representing the importance of point j to element Bi and can be obtained by a Gaussian kernel density function. The farther point j is from elements B, the lower its importance to elements B and the smaller its weight w i j are; d i j is the distance between element Bi and point j, and d i b is the bandwidth distance near the element Bi, which is determined by spatial adaptive filters [50]; L C L Q A B i that is larger than 1 demonstrates that elements A are attracted by element Bi at a local scale. The presence of elements A are highly dependent on the presence of element Bi; the higher the value is, the more evident the colocation pattern is; L C L Q A B i that is less than 1 suggests that elements A are likely to be distant from element Bi at a local scale [30].

4. Global Characteristics of the Spatial Associations between Commercial Sites and Residences

GCLQ analysis of residences and various commercial formats (Table 3) shows that GCLQR→Ci and GCLQCi→R are less than 1, indicating that the spatial association between commercial sites and residences in Beijing is weak and presents the characteristic of relatively independent distribution. Considerable differences were observed in the GCLQR→Ci of the residences attracted by each commercial format; the following are the values in descending order: catering service > life service > specialty store > recreation and leisure service > convenience store > farmers’ market > supermarket > shopping mall > home building material market > home appliance and electronics store. Catering service and life service are the commercial formats with high frequency consumption and high demand. The highest GCLQR→Ci with values close to 1 are recorded for the residences attracted by these two commercial formats, indicating that residences are preferentially distributed near catering and life services. Recreation and leisure service covers a wide range of segmented commercial formats, and convenience stores, farmers’ markets, and supermarkets target daily family consumption. These four commercial formats are widely distributed, and the GCLQR→Ci values of the residences attracted by them are relatively high. The shopping mall, home appliance and electronics store, and home building material market are the non-daily consumption commercial formats characterized by a large market, small number, and fragmented distribution. Thus, the GCLQR→Ci values of the residences attracted by them are relatively low.
The GCLQCi→R of each commercial format attracted by residences differs from the GCLQR→Ci, and the values in descending order are as follows: life service > catering service > recreation and leisure service > convenience store > supermarket > farmers’ market > specialty store > shopping mall > home building material market > home appliance and electronics store (Table 3). The dense population distribution of the residential area has a strong attraction to the site selection of recreation and leisure service. Thus, the GCLQCi→R value of recreation and leisure service attracted by residences is higher than the GCLQR→Ci value. The GCLQCi→R value of convenience store and supermarket attracted by residences is also higher than the GCLQR→Ci value, showing that both have a strong attachment to residences as daily consumption commercial formats. The GCLQCi→R value of specialty stores attracted by residences is lower than the GCLQR→Ci value; the main reason is that some specialty stores rely on the distribution of large commercial centers and have a low degree of attachment to residential areas. Large-scale commercial formats, such as shopping malls, home appliance and electronics stores, and home building material markets occupy a relatively large area, and their location selection mostly considers factors, such as agglomeration and land price. Thus, these commercial formats are less attracted by residences, leading to their relatively low GCLQCi→R. The life service, catering service, recreation and leisure service, and convenience store are commercial formats with high daily consumption frequencies and small footprints. The GCLQCi→R values of these four commercial formats attracted by residences are close to 1, indicating that their location tends to be dependent on residence distribution.
GCLQ analysis of high-, medium-, and low-grade residences with each commercial format (
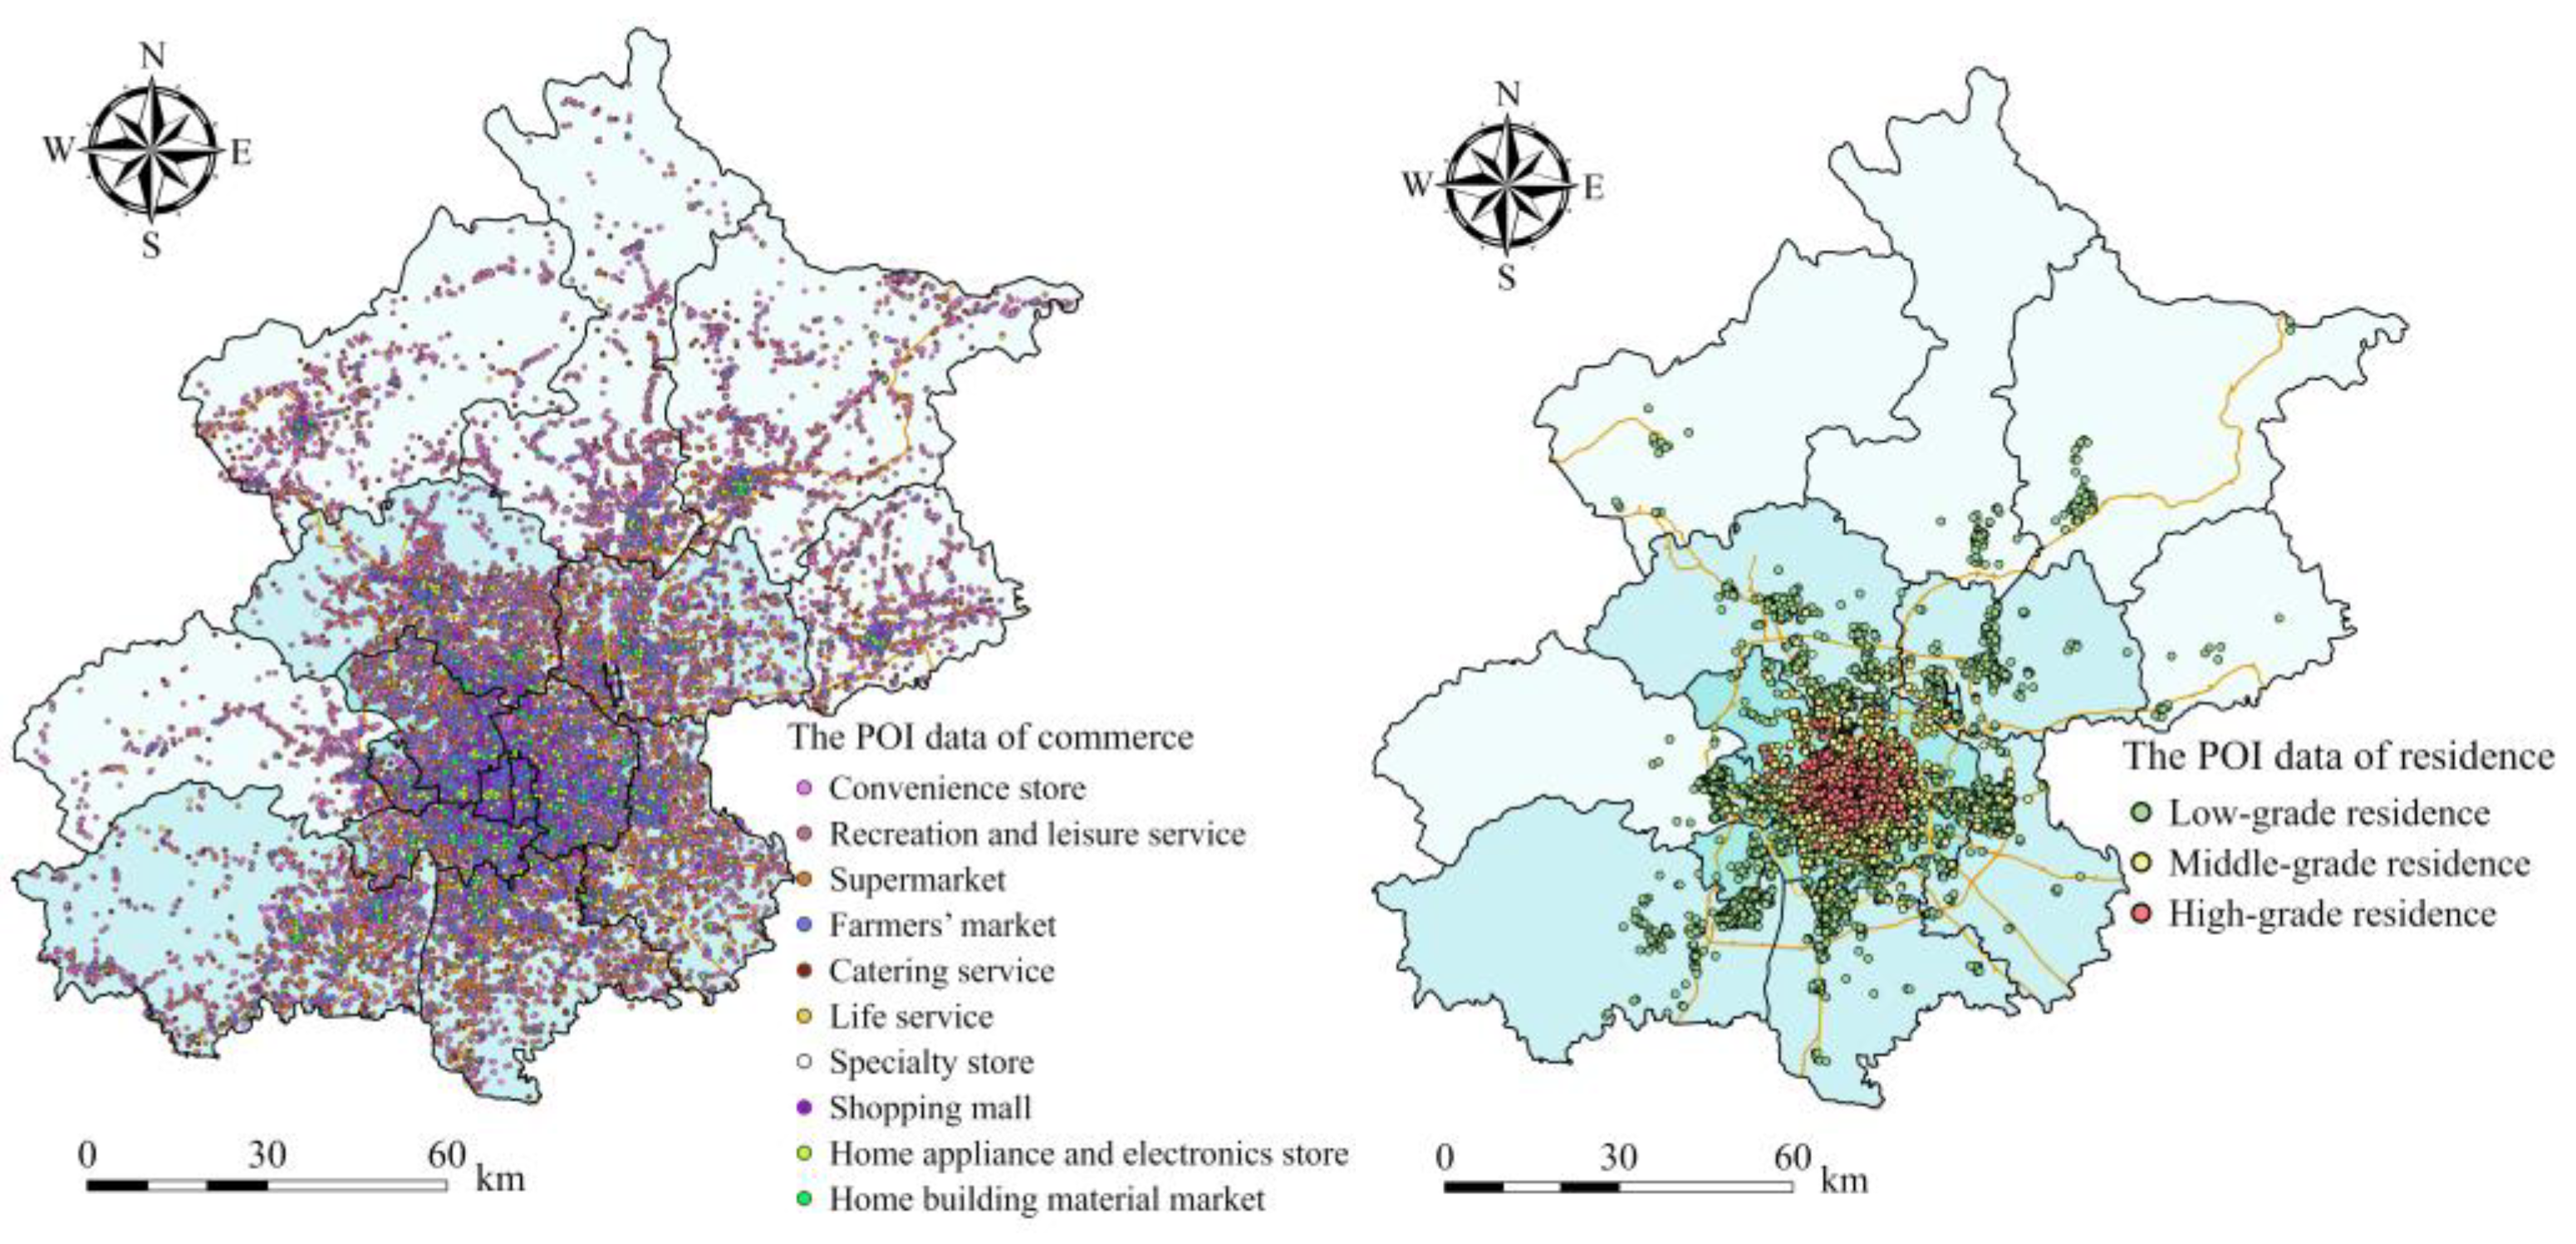
Table 3) shows that the spatial associations between low-grade residences and commercial formats are relatively strong, whereas those between high-grade residences and commercial formats are relatively weak. High-grade residences are mainly clustered in the core and central areas with a relatively high land price (Figure 2). In recent years, the number of commercial formats in the core area has been reduced because of high operating costs and the policy of optimizing Beijing’s urban functions [44,49]. As a consequence, the spatial association between high-grade residences and various commercial formats is low. Low-grade residences present a spatial distribution pattern of clustering from the center area to the surrounding areas along major traffic arteries (Figure 2). The areas where they are located have relatively low land prices. Thus, the colocation characteristics of low-grade residences with commercial sectors are highly evident. Moreover, people living in low-grade residences mostly have a relatively low consumption level. Convenience is an important factor in choice of residence. The distribution of commercial formats with high frequency consumption has a stronger attraction to the distribution of low-grade residence than medium- and high-grade residences.

5. Local Characteristics of the Spatial Associations between Commercial Sites and Residences

5.1. Spatial Association Pattern of Commercial Sites and Residences

LCLQR→C analysis of the residences attracted by all commercial formats shows that 20.35% of the LCLQR→C in Beijing is greater than 1, and 68.29% of the LCLQR→C is between 0.9 and 1 (Table 4). The order of LCLQR→C values greater than 1 for the residences attracted by commercial formats in each urban circle in descending order is outer suburbs > inner suburbs > central area > core area. For the optimization of urban functions, the residents of the core area of Beijing have moved out. Meanwhile, commerce is highly clustered in the commercial centers of the core area, such as Wangfujing and Xidan, which have limited scale and formats. Thus, the spatial association between commercial sites and residences is weak in this area. In general, residence is characterized by an independent distribution from commercial sites. However, the residences around Wangfujing and Xidan show a strong dependence on commercial sites (Figure 4). For the outer suburbs, only a small number of residences are found. For consumption convenience, residences are concentrated around commercial centers in each district. Thus, the residences are highly attracted by the commercial formats (Figure 4), presenting a spatial association pattern of “commercial formats attracting residences”.

5.2. Spatial Association Patterns of Various Commercial Formats and Residences

5.2.1. Local Characteristics of Residences Attracted by Various Commercial Formats

Significant differences in LCLQR→Ci were observed among the residences attracted by each commercial format (Table 5). The proportion of LCLQR→Ci greater than 1 within the whole city has the following sequence in descending order: life service > catering service > specialty store > shopping mall > supermarket > farmers’ market > convenience store > recreation and leisure service > home building material market > home appliance and electronics store. Residences attracted by various commercial formats are generally characterized by the spatial association pattern of integration of high-frequency consumption and separation of low-frequency consumption. The proportion of LCLQR→Ci greater than 1 for the residences attracted by each commercial format in each urban circle increases outward from the core area to the outer suburbs. This finding presents a spatial pattern of “commercial formats attracting residences”, showing that the influence of commercial sites on the distribution of residence increases with distance from the city center.
In terms of the spatial characteristics of residences attracted by each commercial format (Figure 5), the LCLQR→Ci of the residences attracted by the four daily consumption commercial formats (convenience store, supermarket, farmers’ market, and recreation and leisure service) is the lowest in the core area and the highest in the outer suburbs. Specifically, the high land price and the optimization of urban functions in the core area of Beijing have reduced the survival space of these four commercial formats, resulting in their low level of attraction to the residences. In the central area, only residences located outside of the Fourth Ring Road are highly attracted by the convenience store. The residences between the Third and Sixth Ring Road are mostly attracted by the supermarket. Some large-scale farmers’ markets have been relocated outside the Fourth Ring Road to facilitate the transportation and trading of agricultural products, resulting in the poor spatial association between residences and farmers’ markets within the Fourth Ring Road. For recreation and leisure services, only the residences around the commercial centers, such as Sanlitun, CBD, Shilihe, and Shuangyushu, in the central area and the large residential areas, such as Wangjing and Qinghe, are attracted by this commercial format. Within the inner and outer suburbs, residences exhibit a strong spatial association with convenience stores, supermarkets, farmers’ markets, and recreation and leisure services. This finding indicates that the distribution of residences is dependent on these four commercial formats. Some areas within the inner suburbs close to the central area are not well supported by the daily consumption commercial formats (e.g., the east side of Mentougou, Liangxiang, Xihongmen, Tongzhou subcenter, and Huilongguan), and the residents prefer commercial centers in the central area. This situation results in the weak spatial association between the residences and these four commercial formats in this area.
The LCLQR→Ci values of residences attracted by life and catering services gradually increase from the core area to the inner and outer suburbs (Figure 5). Life and catering services are commercial formats with daily high-frequency consumption. These services are numerous and widely distributed. Thus, their LCLQR→Ci values are often greater than 1 in large residential areas and in the vicinity of some commercial centers. Life service shows a strong spatial association with residences in various places, such as Jianguomen in the core area and CBD-Sanlitun, Muxiyuan-Shilihe, and Wangjing in the central area. Life service highly attracts residences in the centers of districts in the inner suburbs, such as Changping, Shunyi, Tongzhou, and Daxing. Most of the residences in the outer suburbs are concentrated around the commercial centers and have a strong spatial association with life service. Catering service exhibits a strong spatial association with residences in various places, such as Xidan-Jianguomen in the core area and Shuangyushu, CBD and Muxiyuan-Shilihe in the central area. Residences around the commercial centers in the inner and outer suburbs are attracted by catering services.
Specialty stores covering complex commercial subcategories are mostly characterized by clustered distribution. A strong spatial association exists between residences and specialty stores in the Muxiyuan of the central area. In addition, specialty stores are mostly attached to commercial centers. Thus, a strong spatial association exists between residences and specialty stores in the commercial centers of Xidan and Sanlitun in the core area and Shuangyushu and Wukesong in the central area.
The LCLQR→Ci of residences attracted by the shopping mall, home building material market, and home appliance and electronics store are all low, showing that the distribution of residences is independent from the distribution of these three commercial formats. Given that shopping malls are often located in busy areas with convenient transportation, the degree of residences attracted is high around Xinjiekou, Financial Street–Xidan, Qianmen, and Jianguomen in the core area and Shuangyushu, Wukesong, Muxiyuan-Shilihe, and Sanlitun in the central area. Home building material markets and home appliance and electronics stores are non-daily consumption commercial formats with low consumption frequencies. They are mostly distributed in areas outside of the Third Ring Road with convenient transportation and low land prices. As a result, the LCLQR→Ci of residences attracted by home appliance and electronics stores and home building material markets is greater than 1 in areas around some commercial centers and on both sides of urban expressways or highways.

5.2.2. Local Characteristics of Various Commercial Formats Attracted by Residences

Significant differences between the LCLQCi→R of each commercial format attracted by residences and the LCLQR→Ci of residences attracted by each commercial format were found. The proportion of LCLQCi→R greater than 1 is significantly higher than that of LCLQR→Ci, indicating that the spatial association pattern of “distribute commercial sites according to the location of residences” in Beijing is more pervasive than “commercial formats attracting residences”. The LCLQCi→R in descending order is recreation and leisure service > convenience store > life service > supermarket > home appliance and electronics store > farmers’ market > shopping mall > catering service > specialty store > home building material market (Table 6). This finding shows that the spatial distribution of each commercial format exhibiting a mechanism of locational choice differs from the spatial distribution of residences. The proportion of LCLQCi→R greater than 1 for each commercial format attracted by residences in each urban circle decreases outward from the core area to the outer suburbs, presenting a significant spatial asymmetry characteristic compared with the LCLQR→Ci of residences attracted by each commercial format. The proportion of LCLQCi→R greater than 1 is high in the core area and the central area, indicating that the commercial formats within the central area tend to distribute around the residences, and the spatial association between commercial sites and residences presents the pattern of “distribute commercial sites according to the location of residences”. A number of large residential areas are found in the inner suburbs. However, the residents prefer the commercial centers with a wide range of formats in the central area, resulting in the lack of attraction of residences to the commercial formats within this area. Thus, the proportion of LCLQCi→R greater than 1 in the inner suburbs is relatively low. For the outer suburbs, the proportion of LCLQCi→R greater than 1 is also relatively low because of the low population size.
In terms of the spatial characteristics of each commercial format attracted by residences (Figure 6), convenience store, supermarket, farmers’ market, recreation and leisure service, catering service, and life service all present a pattern of being highly attracted by residences within the core area and less attracted toward the outer suburbs. These six commercial formats are characterized by daily high-frequency consumption and a relatively small service radius and tend to distribute within the central area with a large number of residences and a dense population. Except the area around the Wangfujing commercial center, the distribution of the six commercial formats within the core area is highly attracted by residences. The spatial association between these six commercial formats and residences is strong within the Fifth Ring Road in the central area but relatively weak outside of the Fifth Ring Road. The residences clustered in the inner suburbs, such as Liangxiang, Xihongmen, Tongzhou subcenter, Guotai, Changping, and Huilongguan, are strongly attracted to the distribution of the six commercial formats. The large number of residences on the east side of the Mentougou District in the outer suburbs attract the distribution of these six commercial formats. However, the spatial association between residences and these six commercial formats is weak in the other areas of the outer suburbs.
The proportion of LCLQCi→R greater than 1 for the specialty stores attracted by residences is less than 30% in the core area, central area, and inner suburbs and even lower in the outer suburbs (Table 6). Specifically, the specialty stores in the commercial centers in the core area, such as Xinjiekou, Financial Street, Xidan, Wangfujing, and Chongwenmen, are mostly dependent on the distribution of large-scale shopping malls, and the residences draw less attention to the distribution. The specialty stores in the commercial centers in the central area, such as Muxiyuan, New Shougang, Shuangyushu, CBD, Sanlitun, and Shilihe, are less attracted by the residences. The residences in the inner suburbs are mostly clustered in the commercial centers of the districts and collocated with specialty stores. Thus, the specialty stores around commercial centers within the inner suburbs have a good association with the residences. The specialty stores in Mentougou District within the outer suburbs are attracted by the residences clustered on the east side of the district, and the specialty stores in the other districts show an independent distribution from the residences.
Shopping malls, home appliance and electronics stores, and home building material markets present poor spatial associations with residences and are largely independent from the distribution of residences. The location selection of these three commercial formats is mainly influenced by factors, such as land price and transportation accessibility, and is less affected by the distribution of residences. The home appliance and electronics stores, home building material markets and shopping malls with better spatial association with residences are mostly distributed on both sides of urban expressways and highways. The shopping malls in the commercial centers of Wangfujing, Xidan and Sanlitun in the core area have weak spatial association with the residences, showing that their distribution is independent of the residences.

6. Conclusions and Discussion

The colocation quotient is used to measure the spatial association characteristic and pattern of commercial sites and residences in Beijing on the basis of the POI data of commercial sites and residences. The results demonstrated wide variations in the spatial associations of each commercial format and residences, exhibiting the characteristic of integrated high-frequency consumption and segregated low-frequency consumption. In addition, the degrees of various commercial formats attracted by residences are significantly higher than those of residences attracted by various commercial formats, reflecting the differentiated distribution mechanism of various commercial formats and residences. In terms of residences, high-grade residences and commercial formats have relatively weak spatial associations, whereas low-grade residences and commercial formats have relatively strong ones. These results are different from those obtained in North America, where the spatial associations of commercial formats with high-grade residences are strong and those in low-grade residences are relatively weak [41]. This discrepancy may due to the fact that the high-grade residences in Beijing are mainly clustered in the core and central areas with relatively high land prices. The number of commercial formats in the core area has decreased recently because of high operating costs and the policy of optimizing Beijing’s urban functions [44,49]. As a consequence, the spatial association between high-grade residences and various commercial formats is low.
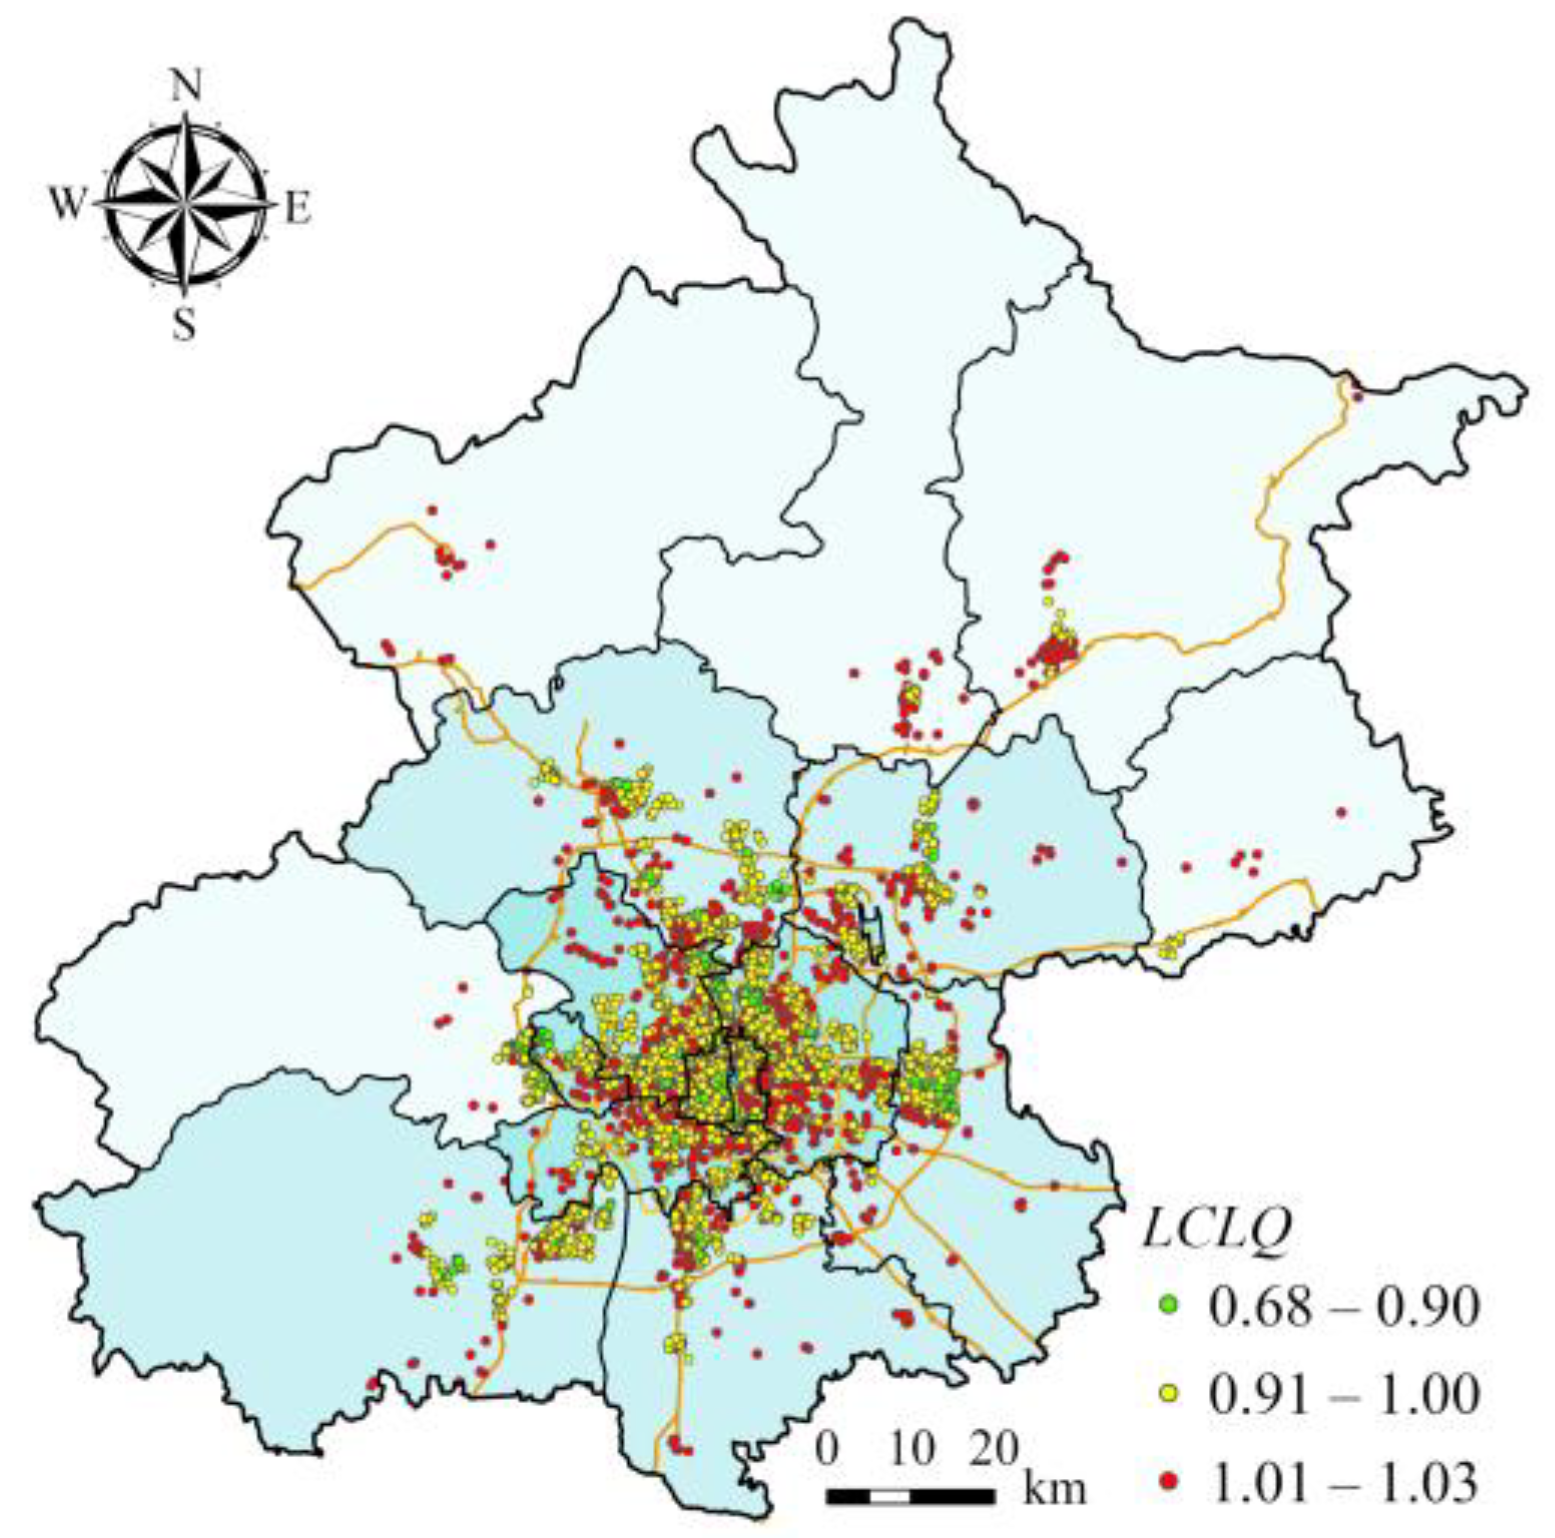
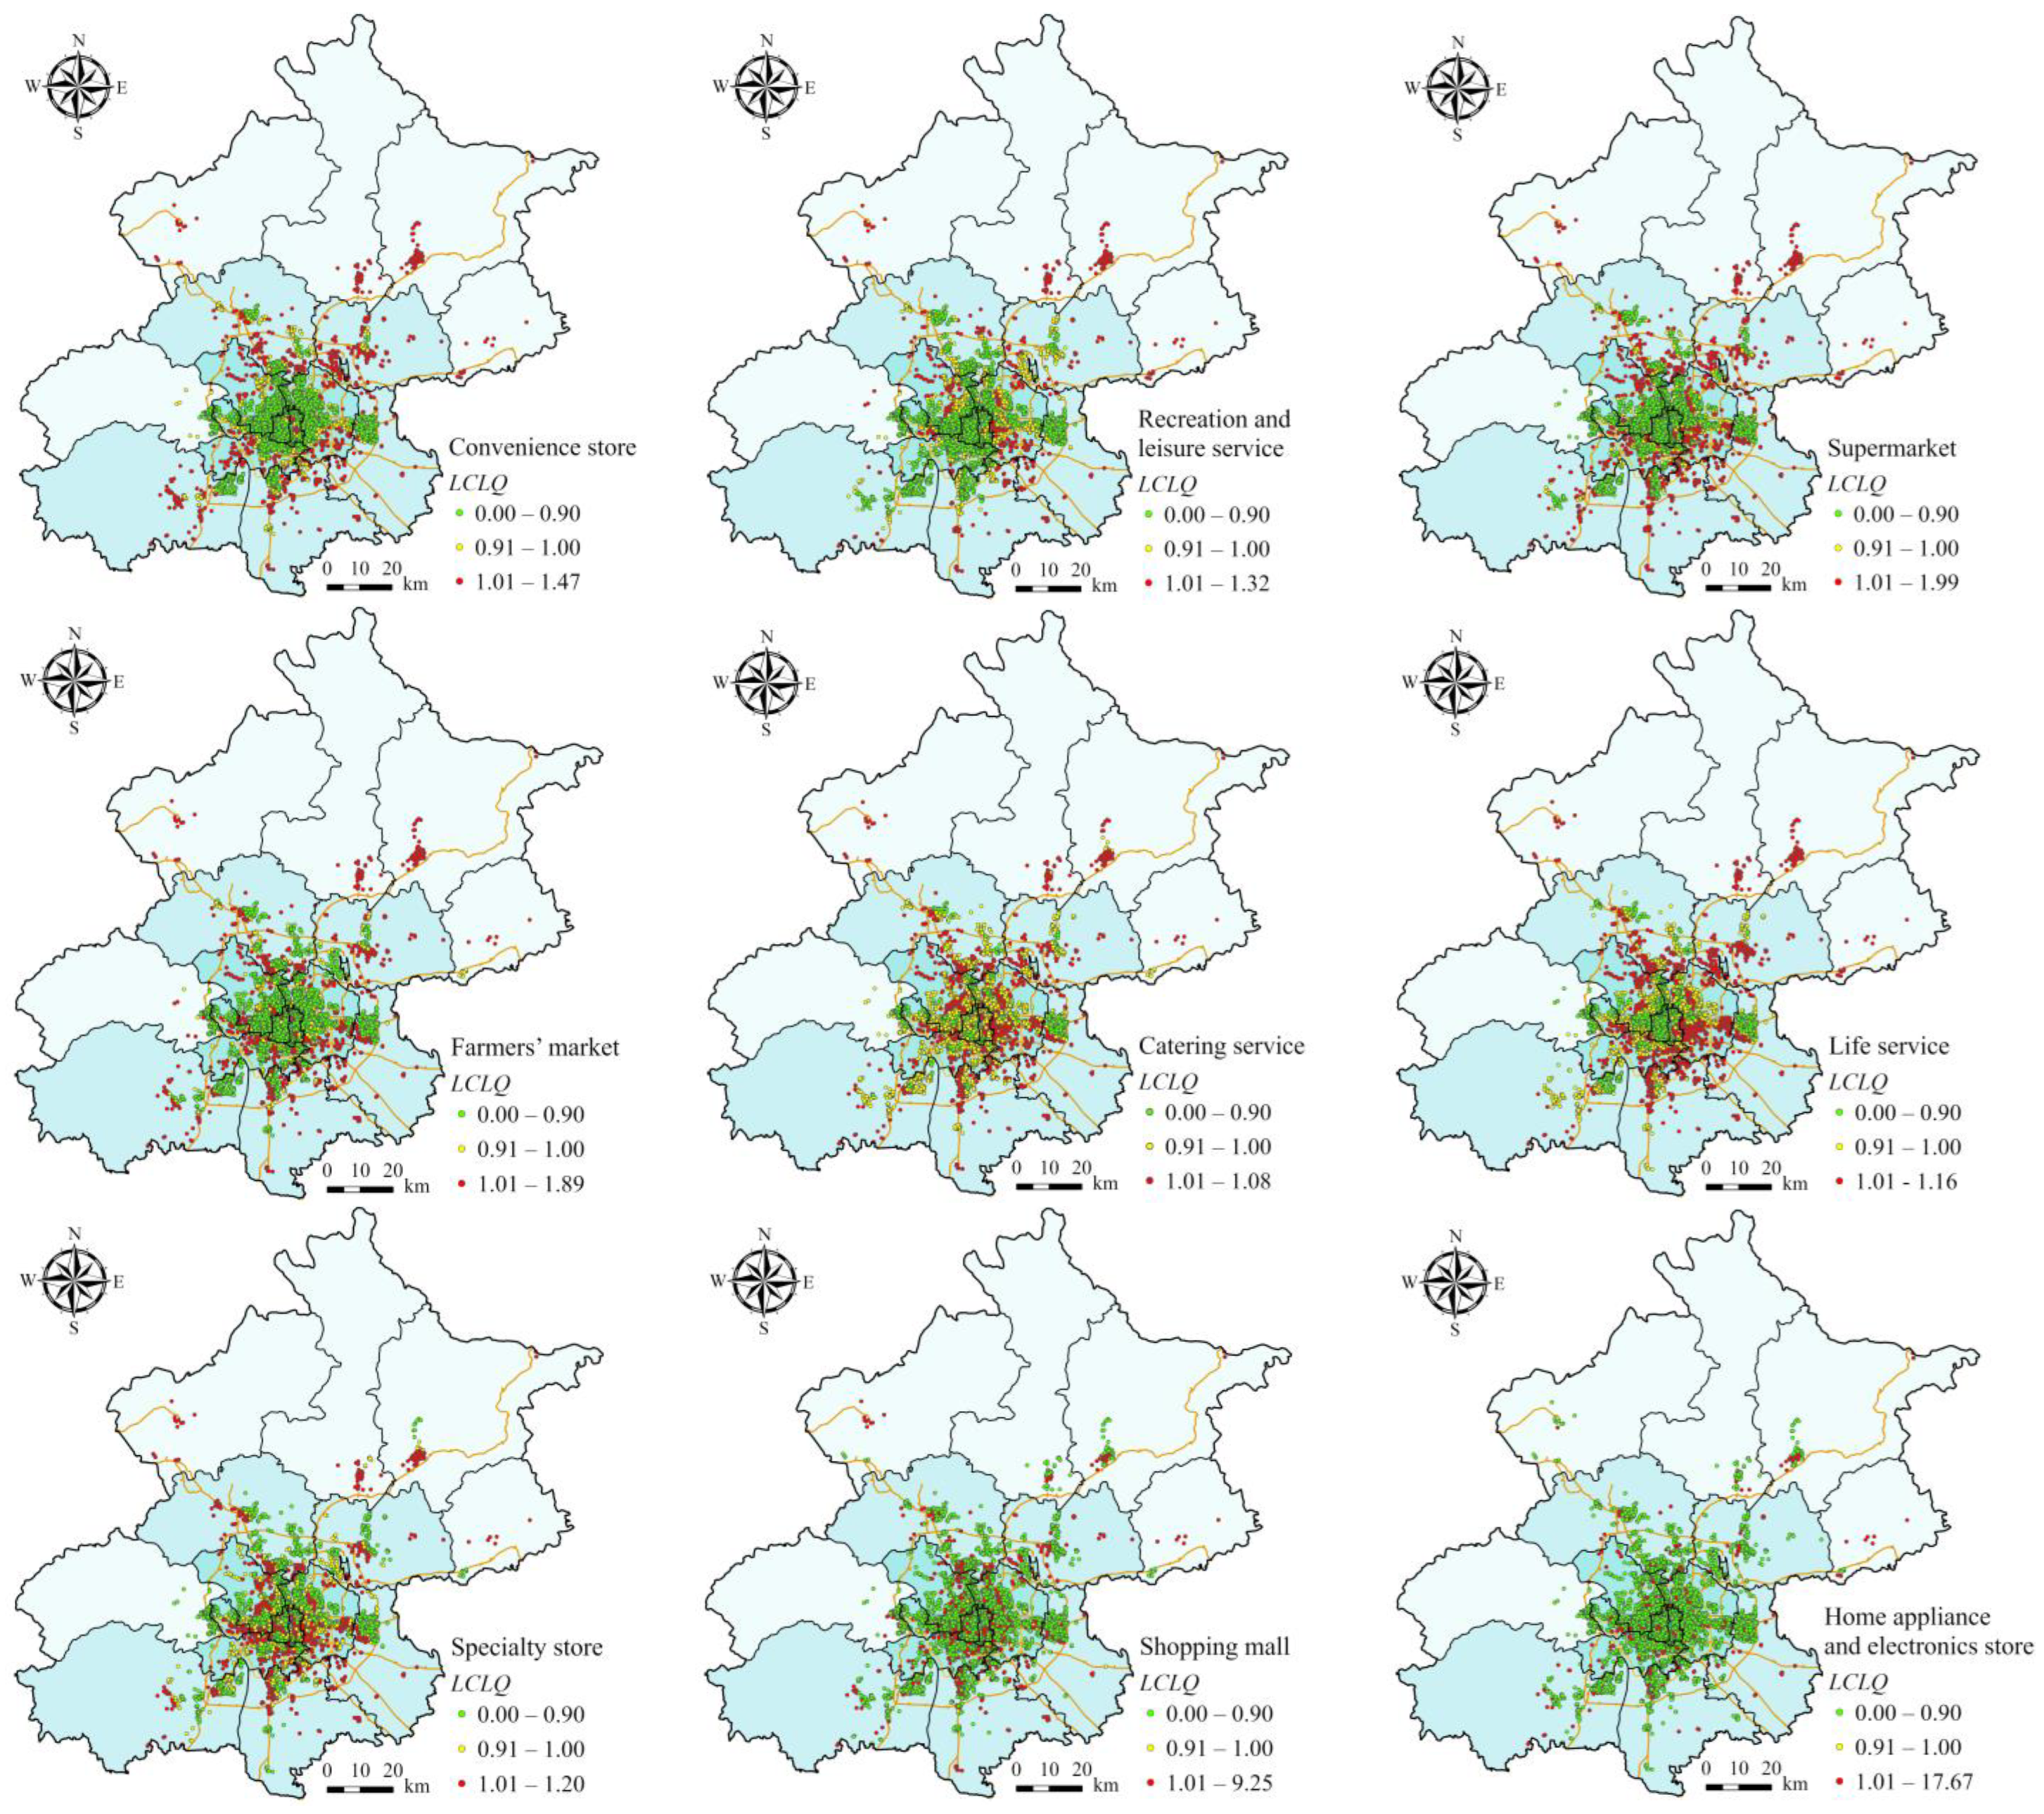
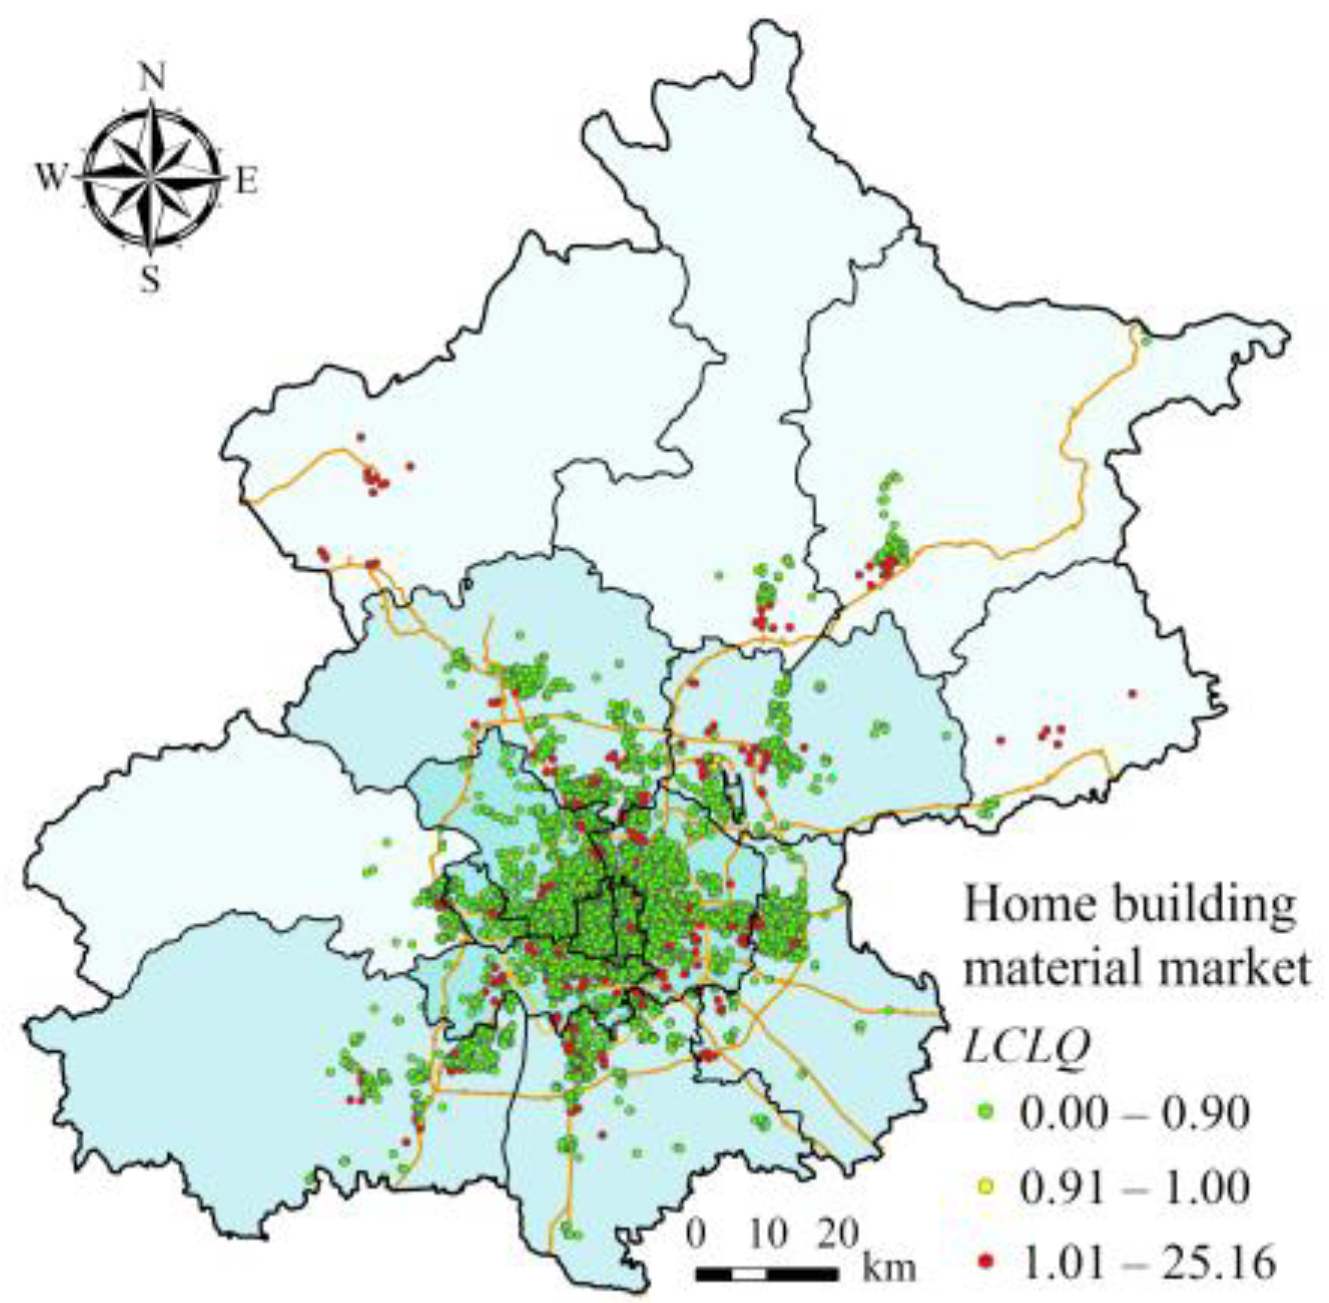
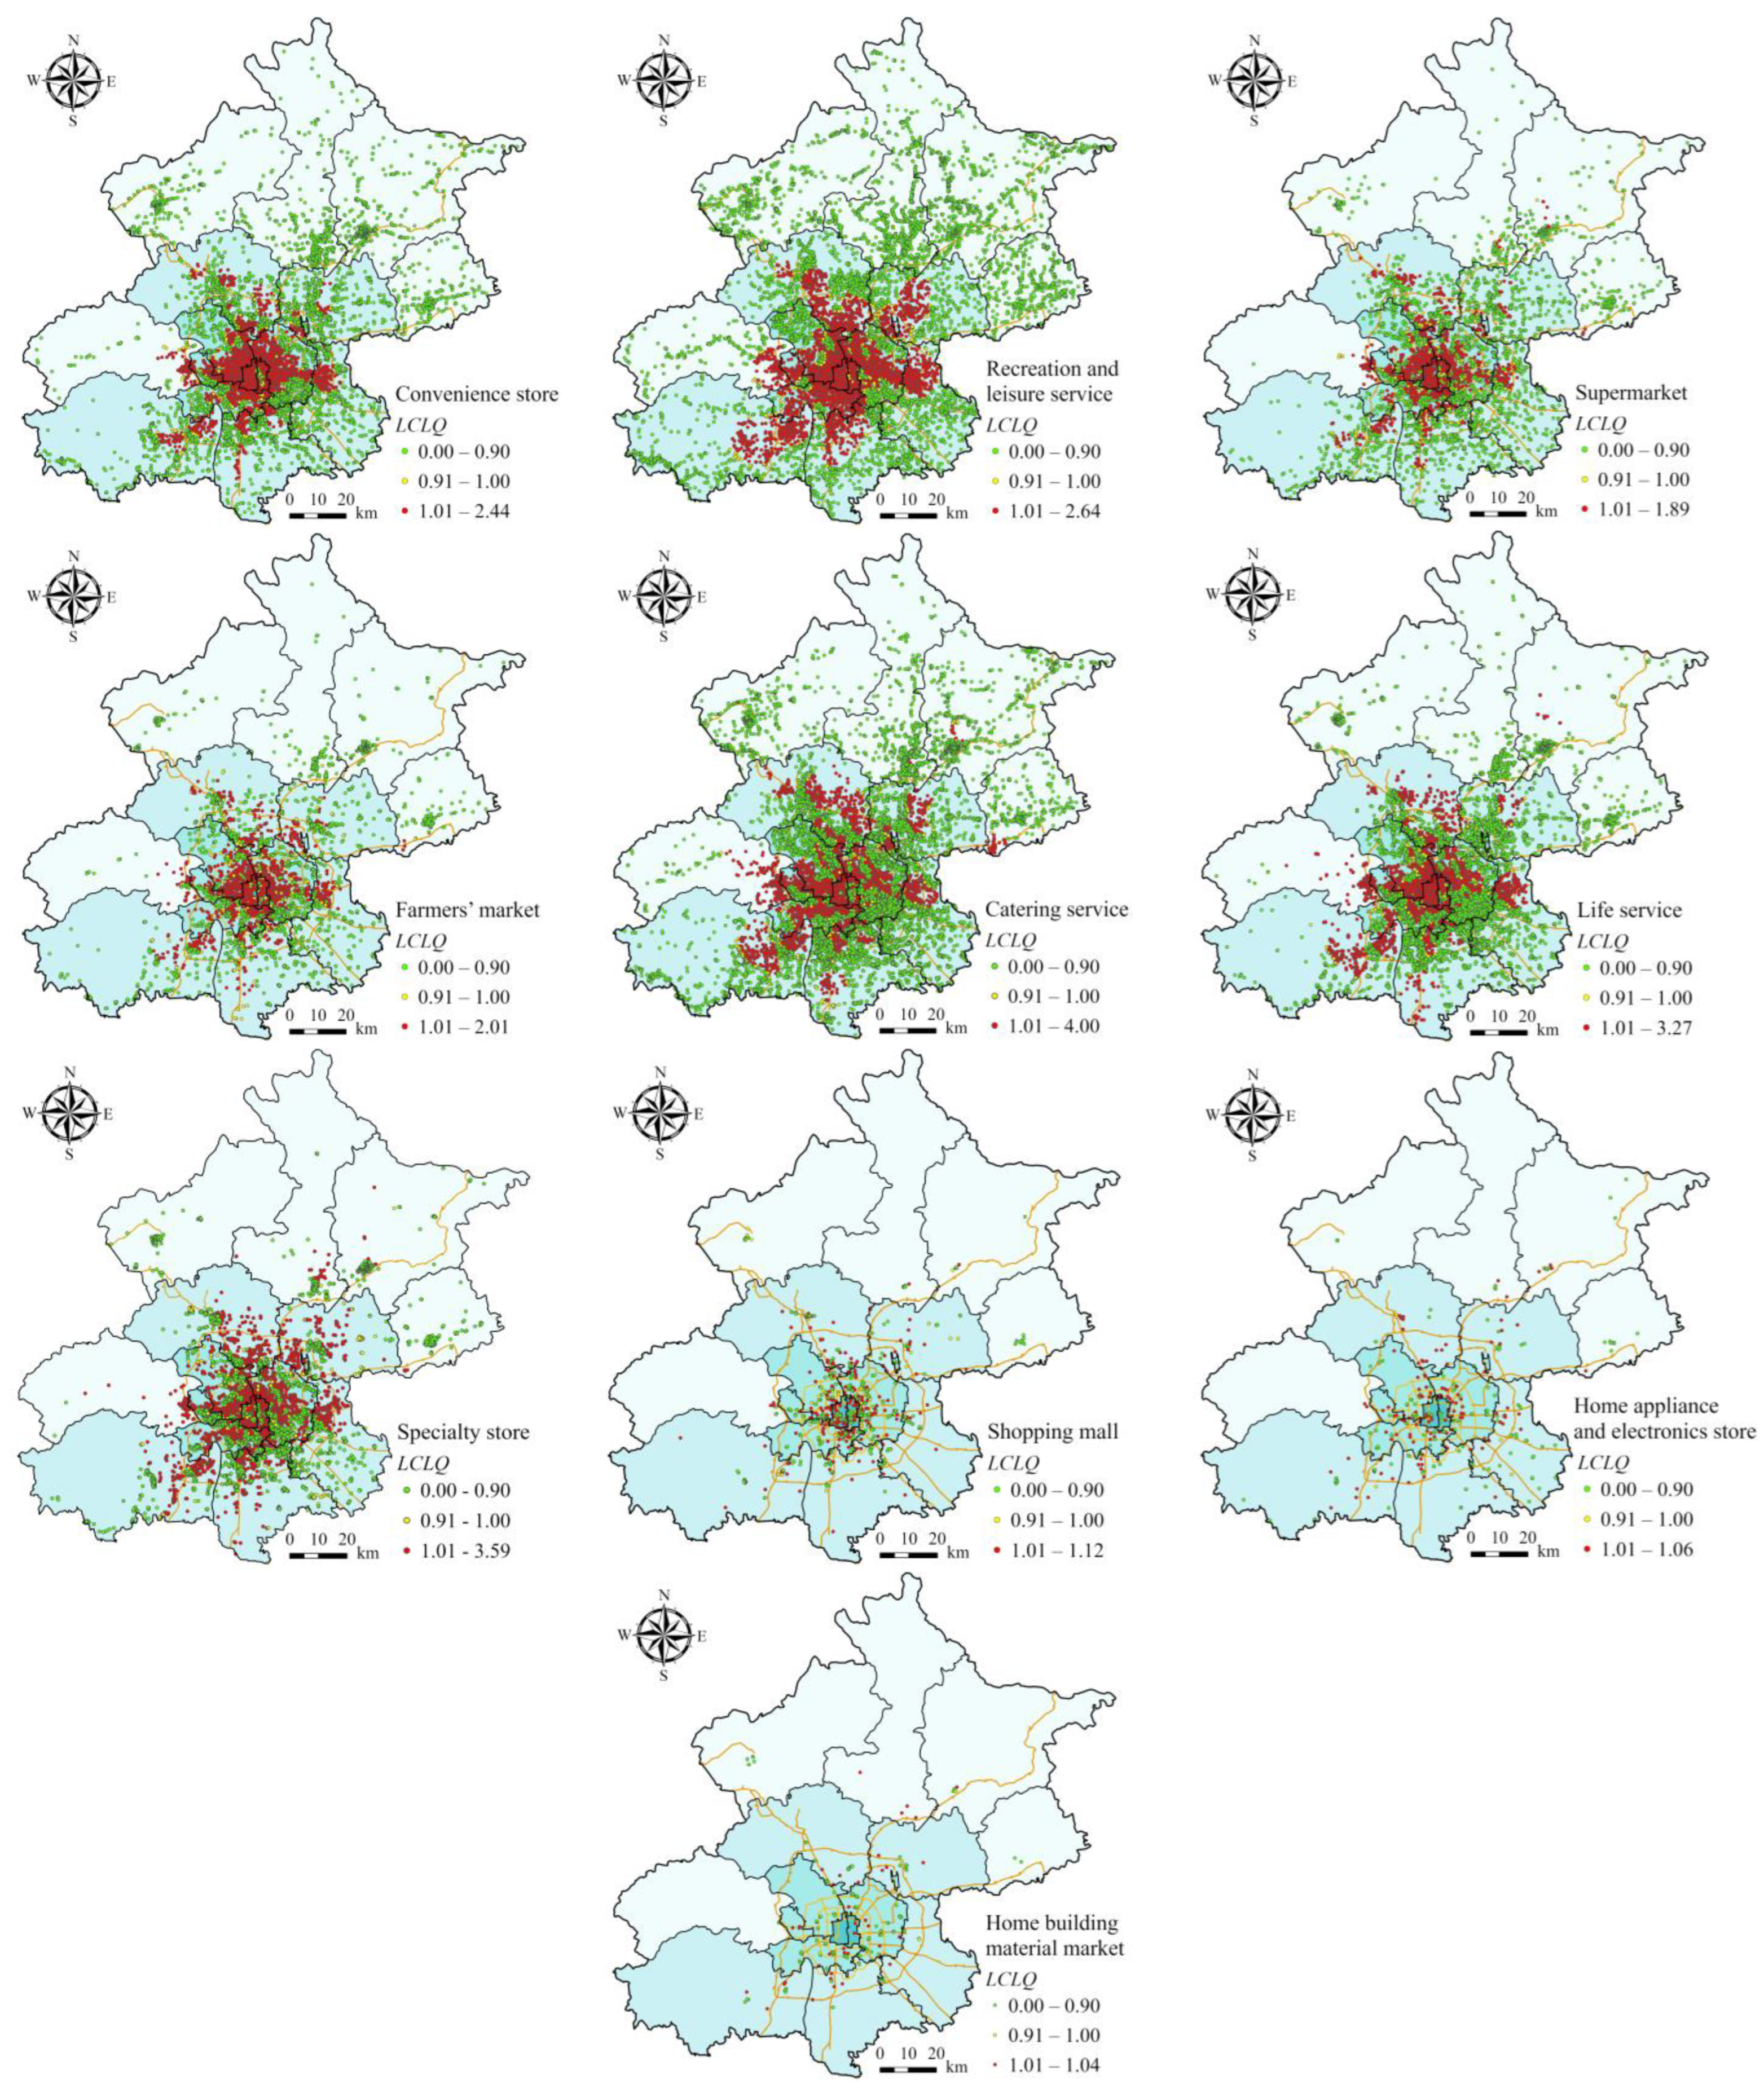
LCLQ can effectively reflect the spatial heterogeneity of the spatial associations of various commercial formats and residences. The asymmetric spatial dependence of commercial sites and residences was found. The proportion of various commercial formats attracted by residences is significantly higher than that of residences attracted by various commercial formats. Within the Fourth Ring Road, the commercial formats are mainly attracted by residences, showing a spatial association pattern of “distribute commercial sites according to the location of residences”. However, the proportions of residences attracted by commercial formats increase outside the Fourth Ring Road, presenting a spatial association pattern of “commercial formats attracting residences”. The findings help reveal the spatial development of commercial sites and residences in Beijing. The spatial association between commercial sites and residences considerably varies between the north and south regions bound by Chang’an Street. The spatial association between commercial sites and residences is strong in the northern part of the city where the commercial facilities in the residential areas are relatively well developed. This finding partially explains residential preferences in the northern part of the city in Beijing. On the basis of the spatial association pattern of commercial sites and residences, strengthening the allocation of commercial formats of daily consumption and physical experience in residential areas can promote the balanced development of commerce and residence.
As a method to measure the spatial association between point elements, a colocation quotient is adopted to explore the spatial association between commercial sites and residences from the perspective of asymmetric spatial dependence and to investigate the spatial heterogeneity of the spatial association across the city. On the basis of the LCLQ analysis results, this study draws a spatial association pattern of commercial sites and residences, that is, “distribute commercial sites according to the location of residences” and “commercial formats attracting residences” from the city center to the outer parts of Beijing. As the political and cultural center of China, Beijing is experiencing a unique form of suburbanization of commercial and residential spaces because of population agglomeration and the urban function optimization policy. Whether the spatial association pattern of commercial sites and residence from the city center outward is applicable to other cities remains to be further verified.
Metropolitan areas in China are confronted with issues arising from the spatial imbalance between commerce and residence as urban space is restructured and residential segregation intensifies [15]. The distinctiveness of Beijing, as the capital of China, can cause the findings to be different from those obtained from other cities. This phenomenon is not the same as the inadequate commercial facilities of low-income neighborhoods in the city core of a North American metropolis, where decline in commercial services and the decentralization of mid- and high-income residents and commercial functions turn the city core into a habitat for low-income residents [39]. In Chinese cities, the city core is more developed than the suburban areas. The disparities between Beijing and North American metropolises are mostly due to differences in urban spatial restructuring processes. Therefore, the spatial association between commercial sites and residences in cities of different scales and urban structures should be further studied.

Author Contributions

Conceptualization, Lei Zhou; methodology, Lei Zhou and Chen Wang; software, Chen Wang; validation, Lei Zhou and Chen Wang; formal analysis, Lei Zhou and Chen Wang; investigation, Lei Zhou and Chen Wang; resources, Lei Zhou and Chen Wang; data curation, Lei Zhou and Chen Wang; writing—original draft preparation, Lei Zhou and Chen Wang; writing—review and editing, Lei Zhou; visualization, Chen Wang; supervision, Lei Zhou; project administration, Lei Zhou; funding acquisition, Lei Zhou. All authors have read and agreed to the published version of the manuscript.

Funding

This research was funded by National Natural Science Foundation of China (grant number: No. 42071212, No. 41701185).

Data Availability Statement

The data presented in this study are available upon request from the corresponding author.

Conflicts of Interest

The authors declare no conflicts of interest.

References

  1. Zhou, S.; Lin, G.; Yan, X. The relationship among consumer’s travel behavior, urban commercial and residential spatial structure in Guangzhou, China. Acta Geogr. Sin. 2008, 63, 395–404. [Google Scholar]
  2. Ye, Q.; Cao, S.; Nie, C. Research on the correlativity of urban residential and commercial spatial structure evolution based on GIS—Case of Changsha. Econ. Geogr. 2012, 32, 65–70. [Google Scholar]
  3. Wu, Z.; Li, D. Principles of Urban Planning; China Architecture & Building Press: Beijing, China, 2010. [Google Scholar]
  4. Zhou, L.; Liu, M.; Zheng, Z.; Wang, W. Quantification of Spatial Association between Commercial and Residential Spaces in Beijing Using Urban Big Data. ISPRS Int. J. Geo-Inf. 2022, 11, 249. [Google Scholar] [CrossRef]
  5. Zhang, L.; Zhu, L.; Shi, D.; Hui, E.C. Urban residential space differentiation and the influence of accessibility in Hangzhou, China. Habitat Int. 2022, 124, 102556. [Google Scholar] [CrossRef]
  6. Schuetz, J.; Kolko, J.; Meltzer, R. Are poor neighborhoods “retail deserts”? Reg. Sci. Urban Econ. 2012, 42, 269–285. [Google Scholar] [CrossRef]
  7. Wang, B.; Wen, B. The spatial distribution of businesses and neighborhoods: What industries match or mismatch what neighborhoods? Habitat Int. 2021, 117, 102440. [Google Scholar] [CrossRef]
  8. Ma, L.; Xiu, C. Research on the matching relationship between residential and commercial space in Shenyang based on shopping trips. Hum. Geogr. 2022, 37, 63–70. [Google Scholar]
  9. Ruiz-Rivera, N.; Suarez, M.; Delgado-Campos, J. Urban segregation and local retail environments. Evidence from Mexico City. Habitat Int. 2016, 54, 58–64. [Google Scholar] [CrossRef]
  10. Zhou, L.; Xiao, W.; Zheng, Z.; Zhang, H. Commercial dynamics in urban China during the COVID-19 recession: Vulnerability and short-term adaptation of commercial centers in Shanghai. Appl. Geogr. 2023, 152, 102889. [Google Scholar] [CrossRef]
  11. Lee, C.M.; Ahn, K.H. Five new towns in the Seoul metropolitan area and their attractions in non-working trips: Implications on self-containment of new towns. Habitat Int. 2005, 29, 647–666. [Google Scholar] [CrossRef]
  12. Nicoletti, L.; Sirenko, M.; Verma, T. Disadvantaged communities have lower access to urban infrastructure. Environ. Plan. B Urban Anal. City Sci. 2023, 50, 831–849. [Google Scholar] [CrossRef]
  13. Tobler, W.R. A computer movie simulating urban growth in the Detroit region. Econ. Geogr. 1970, 46, 234–240. [Google Scholar] [CrossRef]
  14. Koperski, K.; Han, J. Discovery of spatial association rules in geographic information databases. Lect. Notes Comput. Sc. 1995, 951, 47–66. [Google Scholar]
  15. Zhou, L.; Wang, C.; Zhen, F. Exploring and evaluating the spatial association between commercial and residential spaces using Baidu trajectory data. Cities 2023, 141, 104514. [Google Scholar] [CrossRef]
  16. Jang, M.; Kang, C.D. Retail accessibility and proximity effects on housing prices in Seoul, Korea: A retail type and housing submarket approach. Habitat Int. 2015, 49, 516–528. [Google Scholar] [CrossRef]
  17. Kang, C.D. Effect of neighborhood income and consumption on retail viability: Evidence from Seoul, Korea. Habitat Int. 2019, 94, 102060. [Google Scholar] [CrossRef]
  18. Anguera-Torrell, O.; Cerdan, A. Which commercial sectors coagglomerate with the accommodation industry? Evidence from Barcelona. Cities 2021, 112, 103112. [Google Scholar] [CrossRef]
  19. Fan, Y.; Khattak, A.; Rodríguez, D. Household Excess Travel and Neighbourhood Characteristics: Associations and Trade-offs. Urban Stud. 2011, 48, 1235–1253. [Google Scholar] [CrossRef]
  20. Wu, H.; Chen, Y.; Jiao, J. Impact of neighborhood built environments on shopping travel modes in Shanghai, China. Transp. Res. Rec. 2019, 2673, 669–681. [Google Scholar] [CrossRef]
  21. Smith, L.G.; Ma, M.Y.; Widener, M.J.; Farber, S. Geographies of grocery shopping in major Canadian cities: Evidence from large-scale mobile app data. Environ. Plan. B Urban Anal. City Sci. 2023, 50, 723–739. [Google Scholar] [CrossRef]
  22. Wu, D.; Zhou, S. The matching pattern of housing-shopping space based on residents’ daily shopping behaviors: A case study of communities in Guangzhou, China. Sci. Geogr. Sin. 2017, 37, 228–235. [Google Scholar]
  23. Cervero, R.; Duncan, M. Which reduces vehicle travel more: Jobs-housing balance or Retail-housing mixing? J. Am. Plan. Assoc. 2006, 72, 475–490. [Google Scholar] [CrossRef]
  24. Meltzer, R.; Schuetz, J. Bodegas or bagel shops? Neighborhood differences in retail and household services. Econ. Dev. Q. 2012, 26, 73–94. [Google Scholar] [CrossRef]
  25. Xue, B.; Xiao, X.; Li, J.; Xie, X.; Lu, C.; Ren, W. POI-based Spatial Correlation of the Residences and Retail Industry in Shenyang City. Sci. Geogr. Sin. 2019, 39, 442–449. [Google Scholar]
  26. Jiang, S.; Zhang, H.; Wang, H.; Zhou, L.; Tang, G. Using restaurant POI data to explore regional structure of food culture based on cuisine preference. ISPRS Int. J. Geo-Inf. 2021, 10, 38. [Google Scholar] [CrossRef]
  27. Liu, K.; Yin, L.; Lu, F.; Mou, N. Visualizing and exploring POI configurations of urban regions on POI-type semantic space. Cities 2020, 99, 102610. [Google Scholar] [CrossRef]
  28. Leslie, T.F.; Kronenfeld, B.J. The colocation quotient: A new measure of spatial association between categorical subsets of points. Geogr. Anal. 2011, 43, 306–326. [Google Scholar] [CrossRef]
  29. Leslie, T.F.; Frankenfeld, C.L.; Makara, M.A. The spatial food environment of the DC metropolitan area: Clustering, co-location, and categorical differentiation. Appl. Geogr. 2012, 35, 300–307. [Google Scholar] [CrossRef]
  30. Cromley, R.G.; Hanink, D.M.; Bentley, G.C. Geographically weighted colocation quotients: Specification and application. Prof. Geogr. 2014, 66, 138–148. [Google Scholar] [CrossRef]
  31. Wang, F.; Hu, Y.; Wang, S.; Li, X. Local Indicator of Colocation Quotient with a Statistical Significance Test: Examining Spatial Association of Crime and Facilities. Prof. Geogr. 2017, 69, 22–31. [Google Scholar] [CrossRef]
  32. Cao, W.; Li, Y.; Cheng, J.; Millington, S. Location patterns of urban industry in Shanghai and implications for sustainability. J. Geogr. Sci. 2017, 27, 857–878. [Google Scholar] [CrossRef]
  33. Yue, H.; Zhu, X.; Ye, X.; Guo, W. The Local Colocation Patterns of Crime and Land-Use Features in Wuhan, China. ISPRS Int. J. Geo-Inf. 2017, 6, 307. [Google Scholar] [CrossRef]
  34. Xia, Z.; Li, H.; Chen, Y.; Yu, W. Detecting urban fire high-risk regions using colocation pattern measures. Sustain. Cities Soc. 2019, 49, 101607. [Google Scholar] [CrossRef]
  35. Li, L.; Cheng, J.; Bannister, J.; Mai, X. Geographically and temporally weighted co-location quotient: An analysis of spatiotemporal crime patterns in greater Manchester. Int. J. Geogr. Inf. Sci. 2022, 36, 918–942. [Google Scholar] [CrossRef]
  36. Meng, B.; Gao, L.; Li, R. Spatial correlation analysis of residential and employment elements in Beijing based on collaborative location quotient. Acta Geogr. Sin. 2021, 76, 1380–1393. [Google Scholar]
  37. Scroop, D. The anti-chain store movement and the politics of consumption. Am. Quart. 2008, 60, 925–949. [Google Scholar] [CrossRef]
  38. Zhou, X.; Yeh, A.G.; Yue, Y. Spatial variation of self-containment and jobs-housing balance in Shenzhen using cellphone big data. J. Transp. Geogr. 2018, 68, 102–108. [Google Scholar] [CrossRef]
  39. Knox, P.; Pinch, S. Urban Social Geography: An Introduction; Routledge: New York, NY, USA, 2010. [Google Scholar]
  40. Champion, A.G. A changing demographic regime and evolving poly centric urban regions: Consequence for the size, composition and distribution of city populations. Urban Stud. 2001, 38, 657–677. [Google Scholar] [CrossRef]
  41. Coffey, W.J.; Shearmur, R.G. Agglomeration and dispersion of high-order service employment in the Montreal metropolitan region, 1981–1996. Urban Stud. 2002, 39, 359–378. [Google Scholar] [CrossRef]
  42. Zhou, J.; Wang, Y.; Cao, G.; Wang, S. Jobs-housing balance and development zones in China: A case study of Suzhou Industry Park. Urban Geogr. 2017, 38, 363–380. [Google Scholar] [CrossRef]
  43. Vongpraseuth, T.; Seong, E.Y.; Shin, S.; Kim, S.H.; Choi, C.G. Hope and reality of new towns under greenbelt regulation: The case of self-containment or transit-oriented metropolises of the first-generation new towns in the Seoul Metropolitan Area, South Korea. Cities 2020, 102, 102699. [Google Scholar] [CrossRef]
  44. Zhang, H.; Tang, H.; Zhang, A. Study on the characteristics and formation mechanism of residential space division in the core area of capital functions of Beijing. Urban Dev. Stud. 2019, 26, 98–106. [Google Scholar]
  45. Li, Z.; Wu, F. Tenure-based residential segregation in post-reform Chinese cities: A case study of Shanghai. Trans. Inst. Br. Geogr. 2008, 33, 404–419. [Google Scholar] [CrossRef]
  46. Zhang, X.; Zhang, X.; Zhong, E.; Wang, S.; Zhang, J. Study on the spatial structure and driving force of urban areas in Beijing based on building space structure. Geogr. Res. 2013, 32, 2055–2065. [Google Scholar]
  47. Wang, F.; Niu, F.; Wang, Z. Commercial spatial structure optimization based on trade area analysis from a micro-scale perspective in Beijing. Geogr. Res. 2017, 36, 1697–1708. [Google Scholar]
  48. Liu, S.; Lin, J. Study on expansion pattern of urban residential land of Beijing. Urban Dev. Stud. 2018, 25, 100–106. [Google Scholar]
  49. Yu, W.; Yang, S.; Guo, M.; Song, J. A research on commercial suburbanization in Beijing under the background of urban function dissemination. Geogr. Res. 2012, 31, 123–134. [Google Scholar]
  50. Brunsdon, C.; Fotheringham, S.; Charlton, M. Geographically weighted local statistics applied to binary data. In Proceedings of the International Conference on Geographic Information Science, Boulder, CO, USA, 25–28 September 2002; Springer: Berlin/Heidelberg, Germany, 2002; pp. 38–50. [Google Scholar]
Figure 1. Study area.
Ijgi 13 00007 g001
Figure 2. Commercial and residential POI data in Beijing.
Ijgi 13 00007 g002
Figure 3. Schematic of the spatial association of elements, (a) aggregated distribution; (b) randomized distribution; (c) scattered distribution.
Ijgi 13 00007 g003
Figure 4. LCLQR→C of the residences attracted by all commercial formats.
Ijgi 13 00007 g004
Figure 5. Distribution of the LCLQ of residences attracted by various commercial formats.
Ijgi 13 00007 g005aIjgi 13 00007 g005b
Figure 6. Distribution of LCLQ of various commercial formats attracted by residences.
Ijgi 13 00007 g006
Table 1. Classification of commercial formats in Beijing.
Commercial FormatsPOI SubcategoriesNumberProportion (%)
Convenience store 15,6246.63%
Recreation and leisure serviceKaraoke television (KTV), bowling alleys, fishing parks, movie theaters, ski resorts, golf-related, fitness centers, game centers, skating rinks, agritainment, amusement parks, multipurpose sports stadiums23,3619.92%
Supermarket 72023.06%
Farmers’ market 85423.63%
Catering serviceChinese restaurant, fast food restaurant, tea house, cafe, bakery, foreign restaurant, hot pot restaurant97,19841.26%
Life serviceBeauty salon, bath and massage, logistics and express delivery, laundry, telecommunication business hall, photography and printing, post office43,14418.32%
Specialty storePersonal goods store, sporting goods store, cultural goods stores, clothing, shoes, hat, and leather goods store38,83816.49%
Shopping mall 8820.37%
Home appliance and electronics store 4570.19%
Home building material marketFabric market, lamp and porcelain market, home building material market3010.13%
Table 2. Classification of residential grades in Beijing.
ResidenceHousing Price (Yuan/m2)NumberProportion (%)
Low-grade residence (LR)10,031–61,310409353.73
Middle-grade residence (MR)61,310–106,556268635.26
High-grade residence (HR)106,556–280,99483911.01
Table 3. GCLQ of residences and various commercial formats.
GCLQR→CiHR→CiMR→CiLR→CiCi→RCi→HRCi→MRCi→LR
Convenience store0.840.680.680.850.90.750.70.93
Recreation and leisure service0.860.710.810.820.920.740.820.9
Supermarket0.810.430.590.780.850.470.610.87
Farmers’ market0.820.510.590.80.80.510.580.76
Catering service0.970.930.950.960.950.810.850.94
Life service0.960.820.90.950.970.790.810.91
Specialty store0.960.850.870.910.770.550.630.68
Shopping mall0.750.310.450.520.750.30.430.5
Home appliance and electronics store0.520.150.240.420.650.220.240.44
Home building material market0.620.110.260.510.660.060.150.47
Table 4. LCLQR→C of the residences attracted by all commercial formats.
Whole City (%)Core Area (%)Central Area (%)Inner Suburbs (%)Outer Suburbs (%)
>10.9–1>10.9–1>10.9–1>10.9–1>10.9–1
Residences20.3568.298.6178.0721.5870.0122.9262.7741.1638.27
Table 5. LCLQ of residences attracted by various commercial formats.
Commercial FormatsWhole City (%)Core Area (%)Central Area (%)Inner Suburbs (%)Outer Suburbs (%)
>10.9–1>10.9–1>10.9–1>10.9–1>10.9–1
Convenience store16.11 12.43 3.68 5.89 7.94 11.24 34.05 20.21 55.23 2.17
Recreation and leisure service11.71 19.73 2.06 5.52 12.22 25.19 11.13 21.30 56.32 1.08
Supermarket19.75 9.14 2.94 1.84 15.65 10.21 33.52 13.03 54.87 0.36
Farmers’ market17.40 7.43 4.86 4.56 12.66 6.94 29.39 10.22 54.15 7.22
Catering service25.77 49.99 8.76 53.20 28.42 51.96 29.34 48.03 45.13 21.66
Life service29.05 32.68 5.00 14.79 30.66 39.01 38.23 36.76 54.87 0.72
Specialty store25.46 23.24 20.01 21.85 24.78 27.13 28.01 36.89 42.24 4.69
Shopping mall19.90 1.23 16.41 1.47 21.20 1.39 19.35 0.95 23.10 0.00
Home appliance and electronics store6.89 0.17 3.68 0.07 6.01 0.23 9.32 0.10 16.61 0.36
Home building material market7.02 0.14 0.88 0.00 6.65 0.15 9.94 0.24 20.22 0.00
Table 6. LCLQ of various commercial formats attracted by residences.
Commercial FormatsWhole City (%)Core Area (%)Central Area (%)Inner Suburbs (%)Outer Suburbs (%)
>10.9–1>10.9–1>10.9–1>10.9–1>10.9–1
Convenience store38.924.6482.337.6963.436.0823.024.424.760.82
Recreation and leisure service44.735.0688.546.8764.718.3244.064.63.140.24
Supermarket31.996.7984.5327.2144.448.6818.076.168.623.16
Farmers’ market26.8511.2766.768.7640.726.9522.246.94.170.91
Catering service25.2211.1557.125.3433.545.465.3924.6610.50.31
Life service32.345.4977.454.6234.246.4322.625.5112.020.18
Specialty store25.054.0924.593.3427.75.4224.773.2410.030.28
Shopping mall25.85037.39026.89023.0808.770
Home appliance and electronics store27.353.5252.527.592.46304.7118.184.55
Home building material market12.962.9910006.952.6722.353.5318.523.7
Disclaimer/Publisher’s Note: The statements, opinions and data contained in all publications are solely those of the individual author(s) and contributor(s) and not of MDPI and/or the editor(s). MDPI and/or the editor(s) disclaim responsibility for any injury to people or property resulting from any ideas, methods, instructions or products referred to in the content.

