Article

A GIS-Based Evacuation Route Planning in Flood-Susceptible Area of Siraha Municipality, Nepal

1
Department of Geomatics Engineering, Pashchimanchal Campus, Tribhuvan University, Lamachaur, Pokhara 33700, Nepal
2
Institute of Transportation Studies, University of California Davis, Davis, CA 95616, USA
*
Author to whom correspondence should be addressed.
ISPRS Int. J. Geo-Inf. 2023, 12(7), 286; https://doi.org/10.3390/ijgi12070286
Submission received: 23 April 2023 / Revised: 6 July 2023 / Accepted: 13 July 2023 / Published: 16 July 2023
(This article belongs to the Special Issue Urban Geospatial Analytics Based on Crowdsourced Data)

Abstract

:
Flood is one of the most frequently occurring and devastating disasters in Nepal. Several locations in Nepal are at high risk of flood, which requires proper guidance on early warning and safe evacuation of people to emergency locations through optimal routes to minimize fatalities. However, the information is limited to flood hazard mapping only. This study provides a comprehensive flood susceptibility and evacuation route mapping in the Siraha Municipality of Nepal where a lot of flood events have occurred in the past and are liable to happen in the future. The flood susceptibility map was created using a Geographic Information System (GIS)-based Analytical Hierarchy Process (AHP) over nine flood conditioning factors. It showed that 47% of the total area was highly susceptible to flood, and the remaining was in the safe zone. The assembly points where people would gather for evacuation were selected within the susceptible zone through manual digitization while the emergency shelters were selected within a safe zone such that they can host the maximum number of people. The network analysis approach is used for evacuation route mapping in which the closest facility analysis proposed the optimum evacuation route based on the walking speed of evacuees to reach the emergency shelter place considering the effect of slope and flood on the speed of the pedestrian. A total of 12 out of 22 suggested emergency shelters were within 30 min, 7 within 60 min, and 2 within 100 min walk from the assembly point. Moreover, this study suggests the possible areas for further shelter place allocations based on service area analysis. This study can support the authorities’ decision-making for the flood risk assessment and early warning system planning, and helps in providing an efficient evacuation plan for risk mitigation.

1. Introduction

Nepal is highly vulnerable to natural disasters due to its diverse geo-climatic system which includes topographical differences, heavy monsoons, steep terrain, fast-flowing rivers, and many more [1,2]. Nepal lies in the top 20 list of global multi-hazard-prone countries in the world, where around 80% of the total population is exposed to the risk of different natural hazards [3]. Climate change is one of the major causes of natural disasters being frequent and more devastating in Nepal [4]. Shrinking of snow and glacier coverage, frequent glacier lake outbursts, and change in the pattern of rainfall as a result of global warming are causing multiple hazards [5,6].
More than 6000 rivers and rivulets originating from the Himalayas travel through hills to the plain of Terai [7]. These rivers have different morphology depending upon their origin, flow magnitude, and sediment load. The river of Nepal drains to the Ganges basin passing through the Nepal–India border in Terai. The width of the river becomes narrower as it reaches the border, and several major water control structures built by India such as embankments and dams at the border block the river flow and natural passage of drainage causing flooding and inundation in Nepalese territory [6].
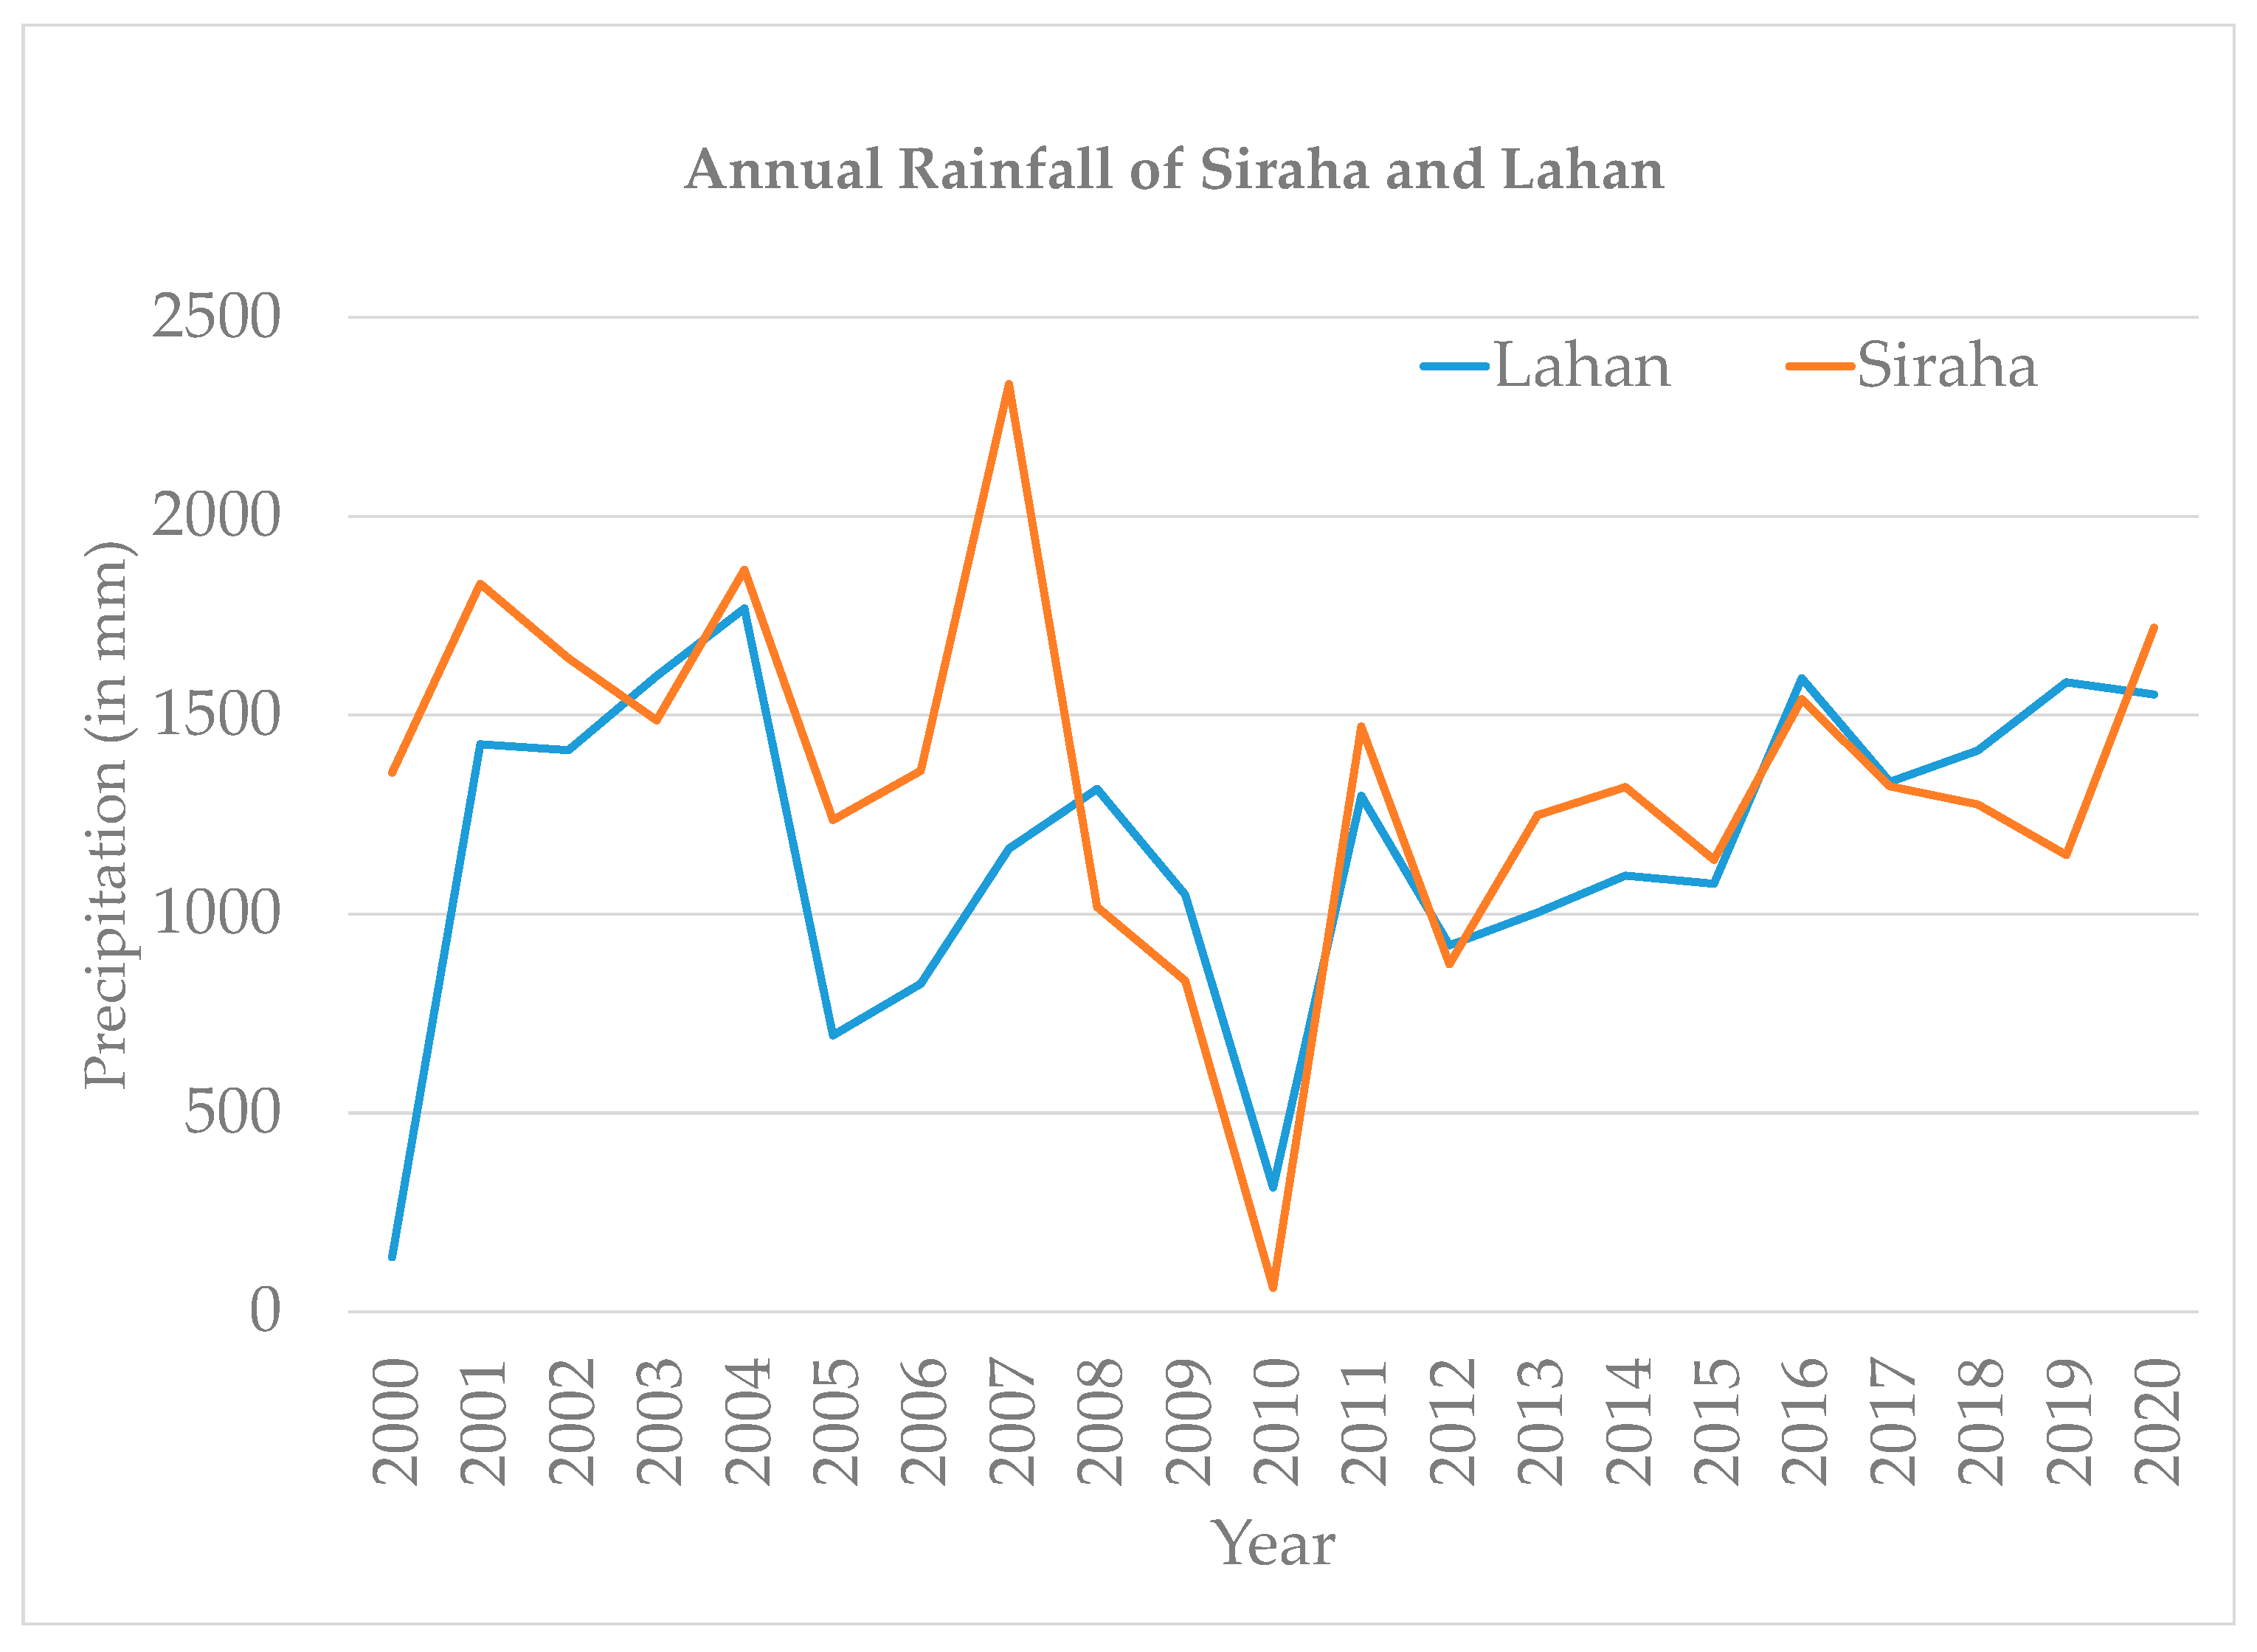
River flooding is one of the most recurring, highly damaging, and widespread natural disasters that occurs mainly in the monsoon season (June–September), in which the maximum annual rainfall of around 80% occurs in Nepal [8,9]. River flood mainly depends upon the intensity of the rainfall and river catchment characteristics resulting in loss of human life and negative effects on the population, damage to the infrastructure and essential services, damage to crops and animals, the spread of diseases, and contamination of the water supply [10]. In Nepal, historical data show that there was a total of 59 major floods recorded between the period 1980 and 2022, in which 7282 people were killed and more than 6 million people were affected, which provides an annual average death toll of 272 people [11].
Floods can be triggered by many reasons, such as heavy rainfall, tropical cyclones or tsunamis in coastal regions, and various climatic and non-climatic processes [12]. A hazard is a potentially damaging physical event that causes a threat to people and their property, and can cause disaster in the future [13]. The flood hazard map shows the area that will be covered by the flood based on input variables based on future scenarios. Similarly, vulnerability is the process of determining the extent to which a place is likely to be damaged or affected by the impact of a hazard [14]. Risk is the probability of harmful consequences or the expected degree of loss resulting due to the interaction of hazards and vulnerability conditions [15]. Susceptibility refers to the condition of an area likely or liable to be affected by a particular disaster.
In recent years, there have been many factors besides rainfall such as extreme weather conditions, lack of land use and development planning [16], deforestation in catchment areas, and lack of proper management of river discharges that are contributing to flood. So, it is crucial to take into consideration all these factors for creating a flood susceptibility map that identifies areas susceptible to flood, and can be used for flood risk mitigation and management [17].
Different tools and approaches have been developed in creating a flood susceptibility map. Multi-criteria decision-making (MCDM) in combination with geographical information system (GIS) is one of the approaches that is widely used for assessing flood susceptibility [18,19]. The most common MCDM method proposed by Saaty (1980) is Analytical Hierarchy Process (AHP) [20], which has been used in many applications including flood susceptibility mapping [18,19,21]. In AHP, the weight for each factor is considered based on their impact using the Pairwise Comparison Matrix [22]. Ouma et al. [23], Hammami et al. [24], Vojtek et al. [19], Rincón et al. [18], and G. Gacu et al. [21] used AHP in combination with GIS for risk assessment of flood. Swain et al. [25] combined the AHP with GIS/Remote Sensing (RS) with a cloud computing API on Google Earth Engine (GEE) platform to find the flood-susceptible region in Bihar, India. Flood susceptibility mapping was performed by Dano et al. [26] using GIS, Analytical Network Process (ANP), and RS in Perlis, Malaysia. One of the major issues found using the AHP technique was the uncertainty of using the number of conditioning factors. Four models that include frequency ratio (FR), weights-of-evidence (WofE), AHP, and an ensemble of frequency ratio with AHP (FR-AHP) were used by Khosravi et al. [27] to prepare a flood susceptibility map in Iran. Siahkamari et al. [28] used frequency ratio and maximum entropy models to predict flood-susceptible areas. Lin et al. [29] used maximum entropy and FLUS Model to predict future waterlogging-prone areas. Vojtek et al. [17] used machine learning-boosted classification (BCT) and boosted regression tree (BRT) to find flood-susceptible regions in Slovakia and compared it with AHP, but it may accumulate errors while transferring the model to another area as a boosted method is a sequential process.
During a flood, the important aspect of disaster management is that the residents at risk should be moved quickly and safely to safe areas [30]. The process is called evacuation, and the route assigned to it is called an evacuation route. Proper information must be provided to the citizens regarding the evacuation route at the time of disaster [31]. A proper evaluation of evacuation is a must to reduce the loss of human life and property in the time of emergency [32]. Usually, the evacuation process involves incident detection, shelter identification, warning, evacuation network planning, and at the end verification [33]. In this overall process, road networks play a vital role. Careful planning of the evacuation network should be performed at this time.
Much research has been focused on selecting the evacuation route based on the shortest distance between the risk zone to the shelter [34,35]. A widely used algorithm is the Dijkstra Algorithm, which finds the path of minimum total length between two nodes [36]. This method was not sufficient as it did not consider the fatal risk that the pedestrian might experience while walking through the hazard zone [31]. At present, the researchers are focused on providing importance to both citizens’ safety as well as distance in evacuation planning [37,38,39,40]. The present studies have common objectives that involve (1) the use of road hazards as a travel cost factor while traversing the road network and (2) finding the best route based on the shortest distance and minimal risk [31,40]. These routes were longer than that of the Dijkstra Algorithm but were to minimize the loss and fatalities caused during the disaster and were comparatively the best of optimum route planning for evacuation [31].
Globally, there are many studies, but fewer in Nepal despite many rivers with high risk. Some research has been performed on flood hazard mapping [16,41,42] and the vulnerability of the community toward flood [7,10,43,44,45]. Smith et al. [46] and Shrestha et al. [8] carried out research to provide an early warning system for flood risk mitigation. It is obvious that much research has been performed on flood vulnerability assessment in Nepal, but the sudden nature of flash floods provides no or little time for evacuation, and they have not been able to link up with creating suitable evacuation planning.
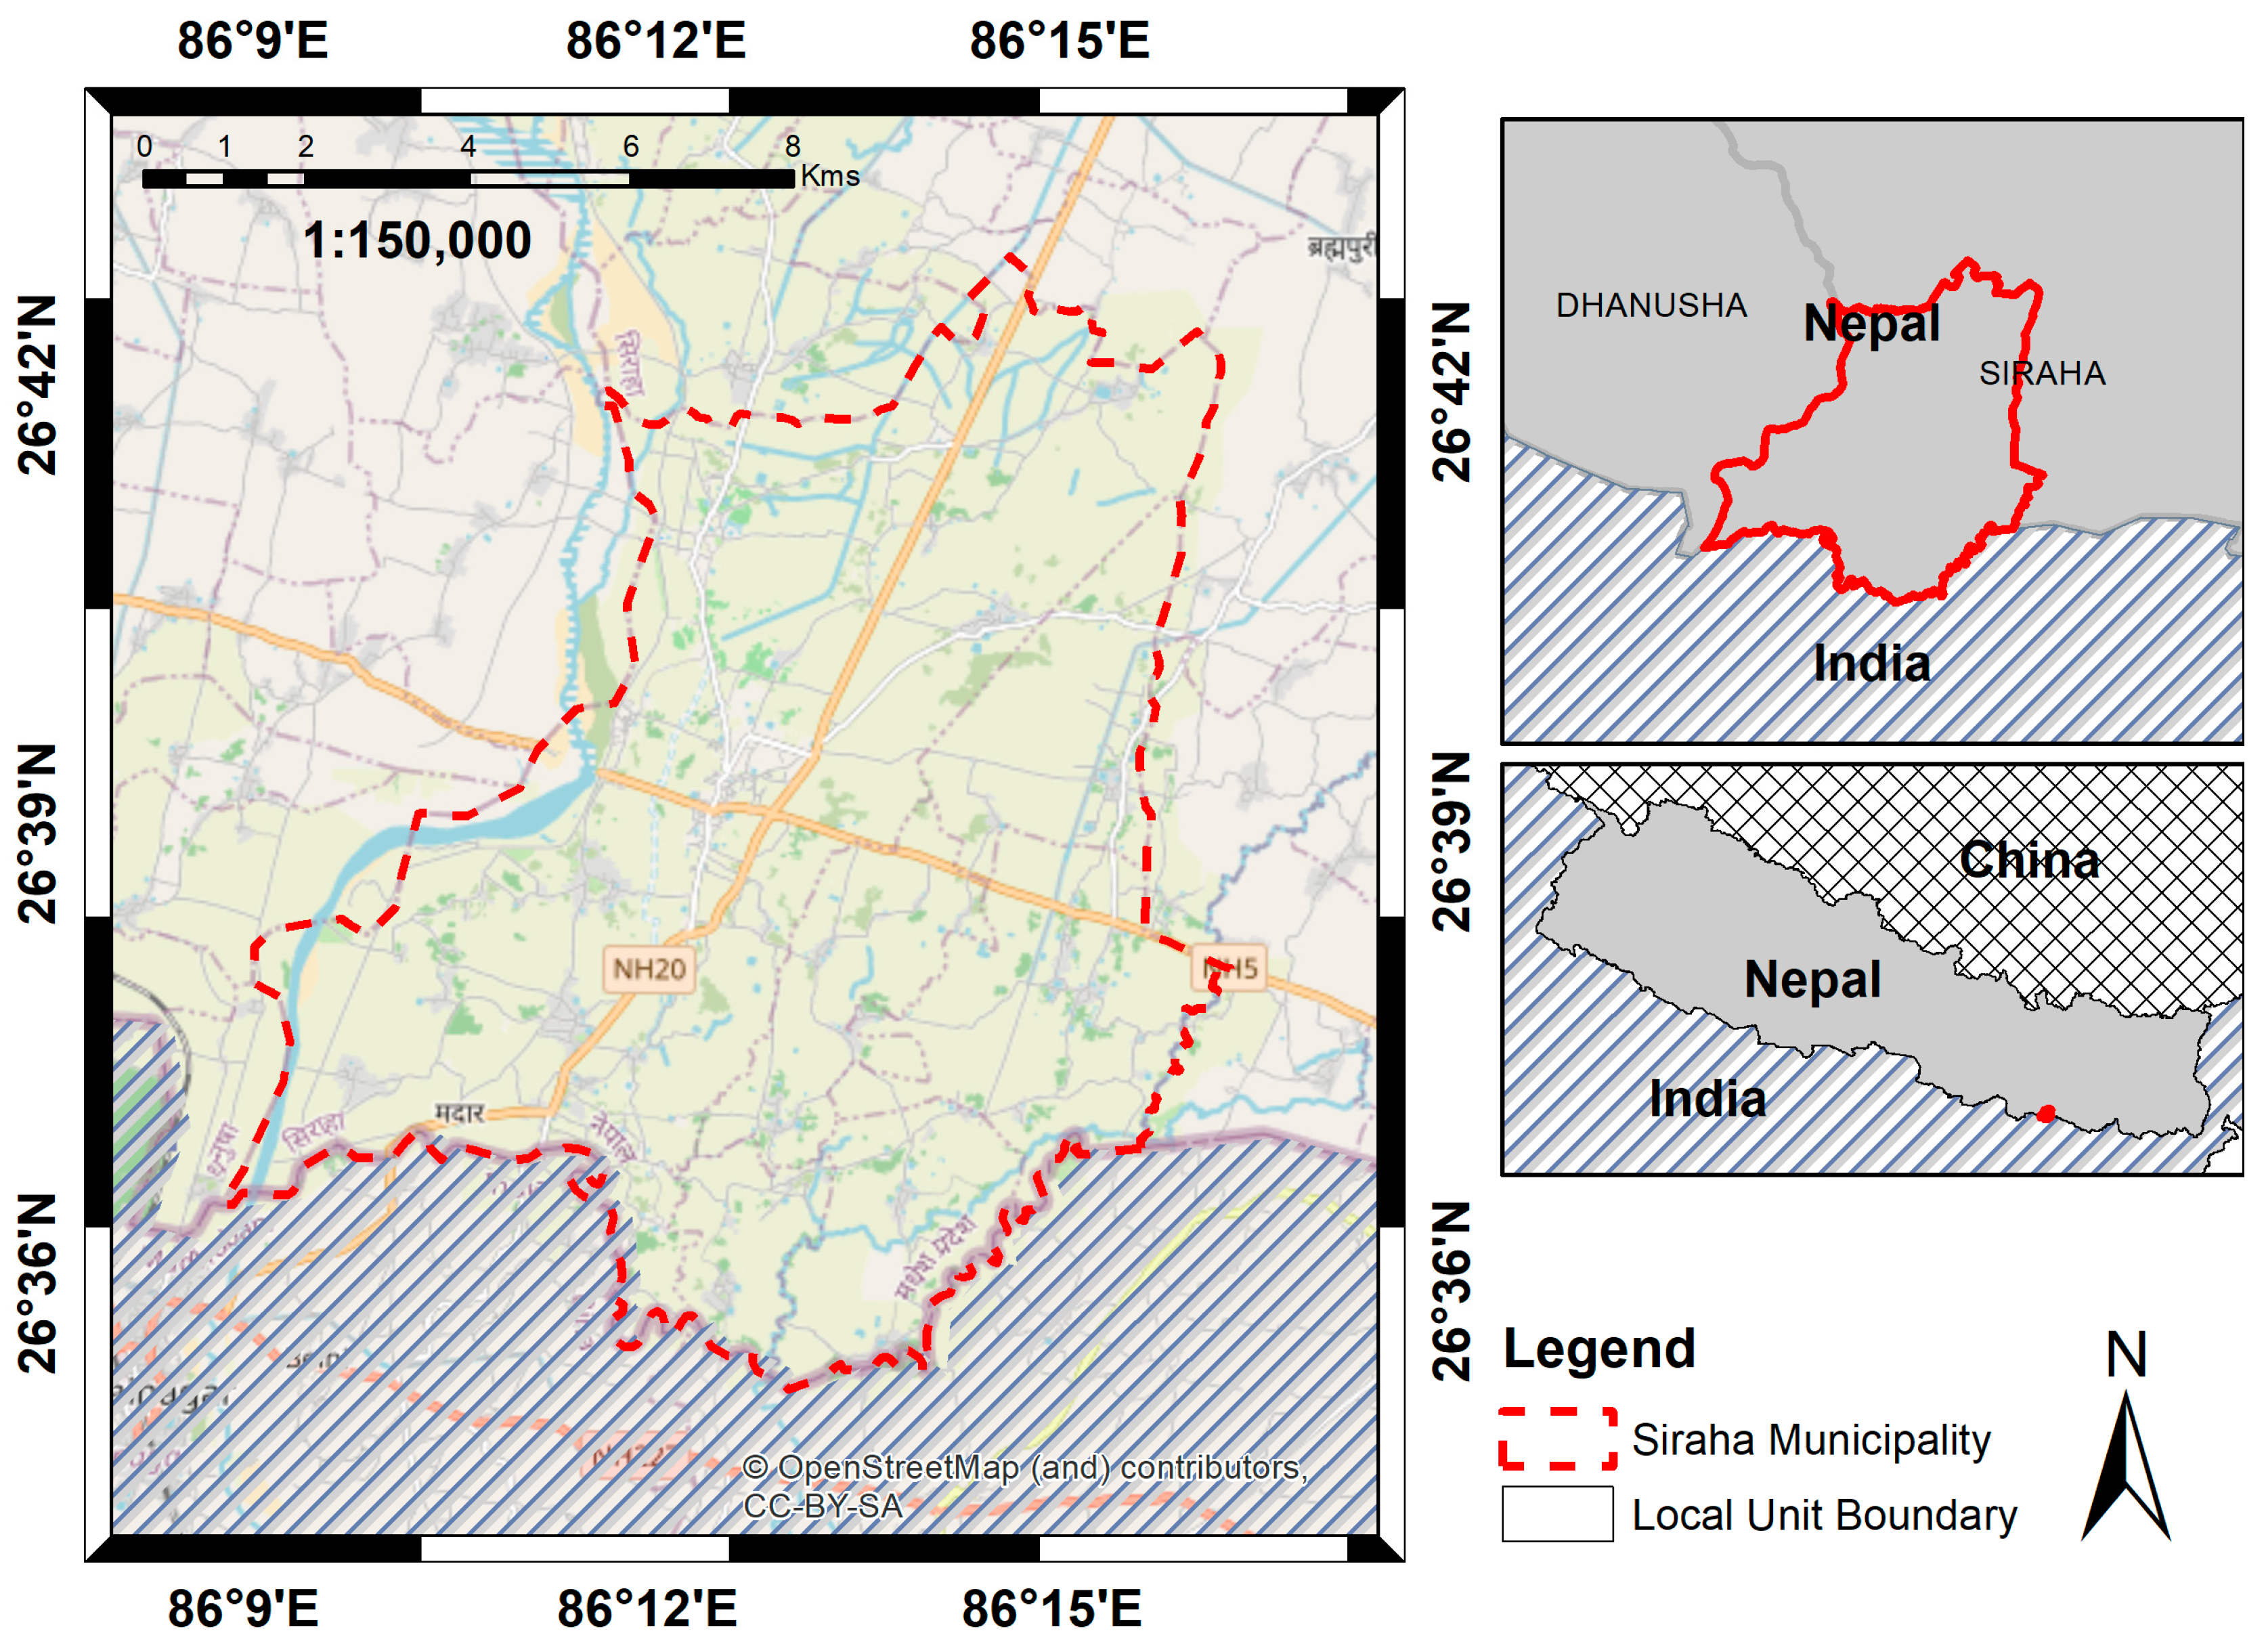
Siraha Municipality is one of the major municipalities of the Terai region in Nepal with a border with India that is affected by monsoon floods. It lies on the bank of the Kamala River, due to which the rise in the level of water causes floods every year. The municipality was hit hard by the flood of 2014, 2017, and 2019, as a result, hundreds of houses were inundated and damaged and thousands of people were displaced [47,48]. The area near the river is not the only susceptible area as the overall region is highly susceptible to future floods. There is a lack of proper research to aid the local authority and community to create an early warning mechanism for flood to mitigate the risk that flood might cause using cost-effective, local knowledge along with scientific approaches.
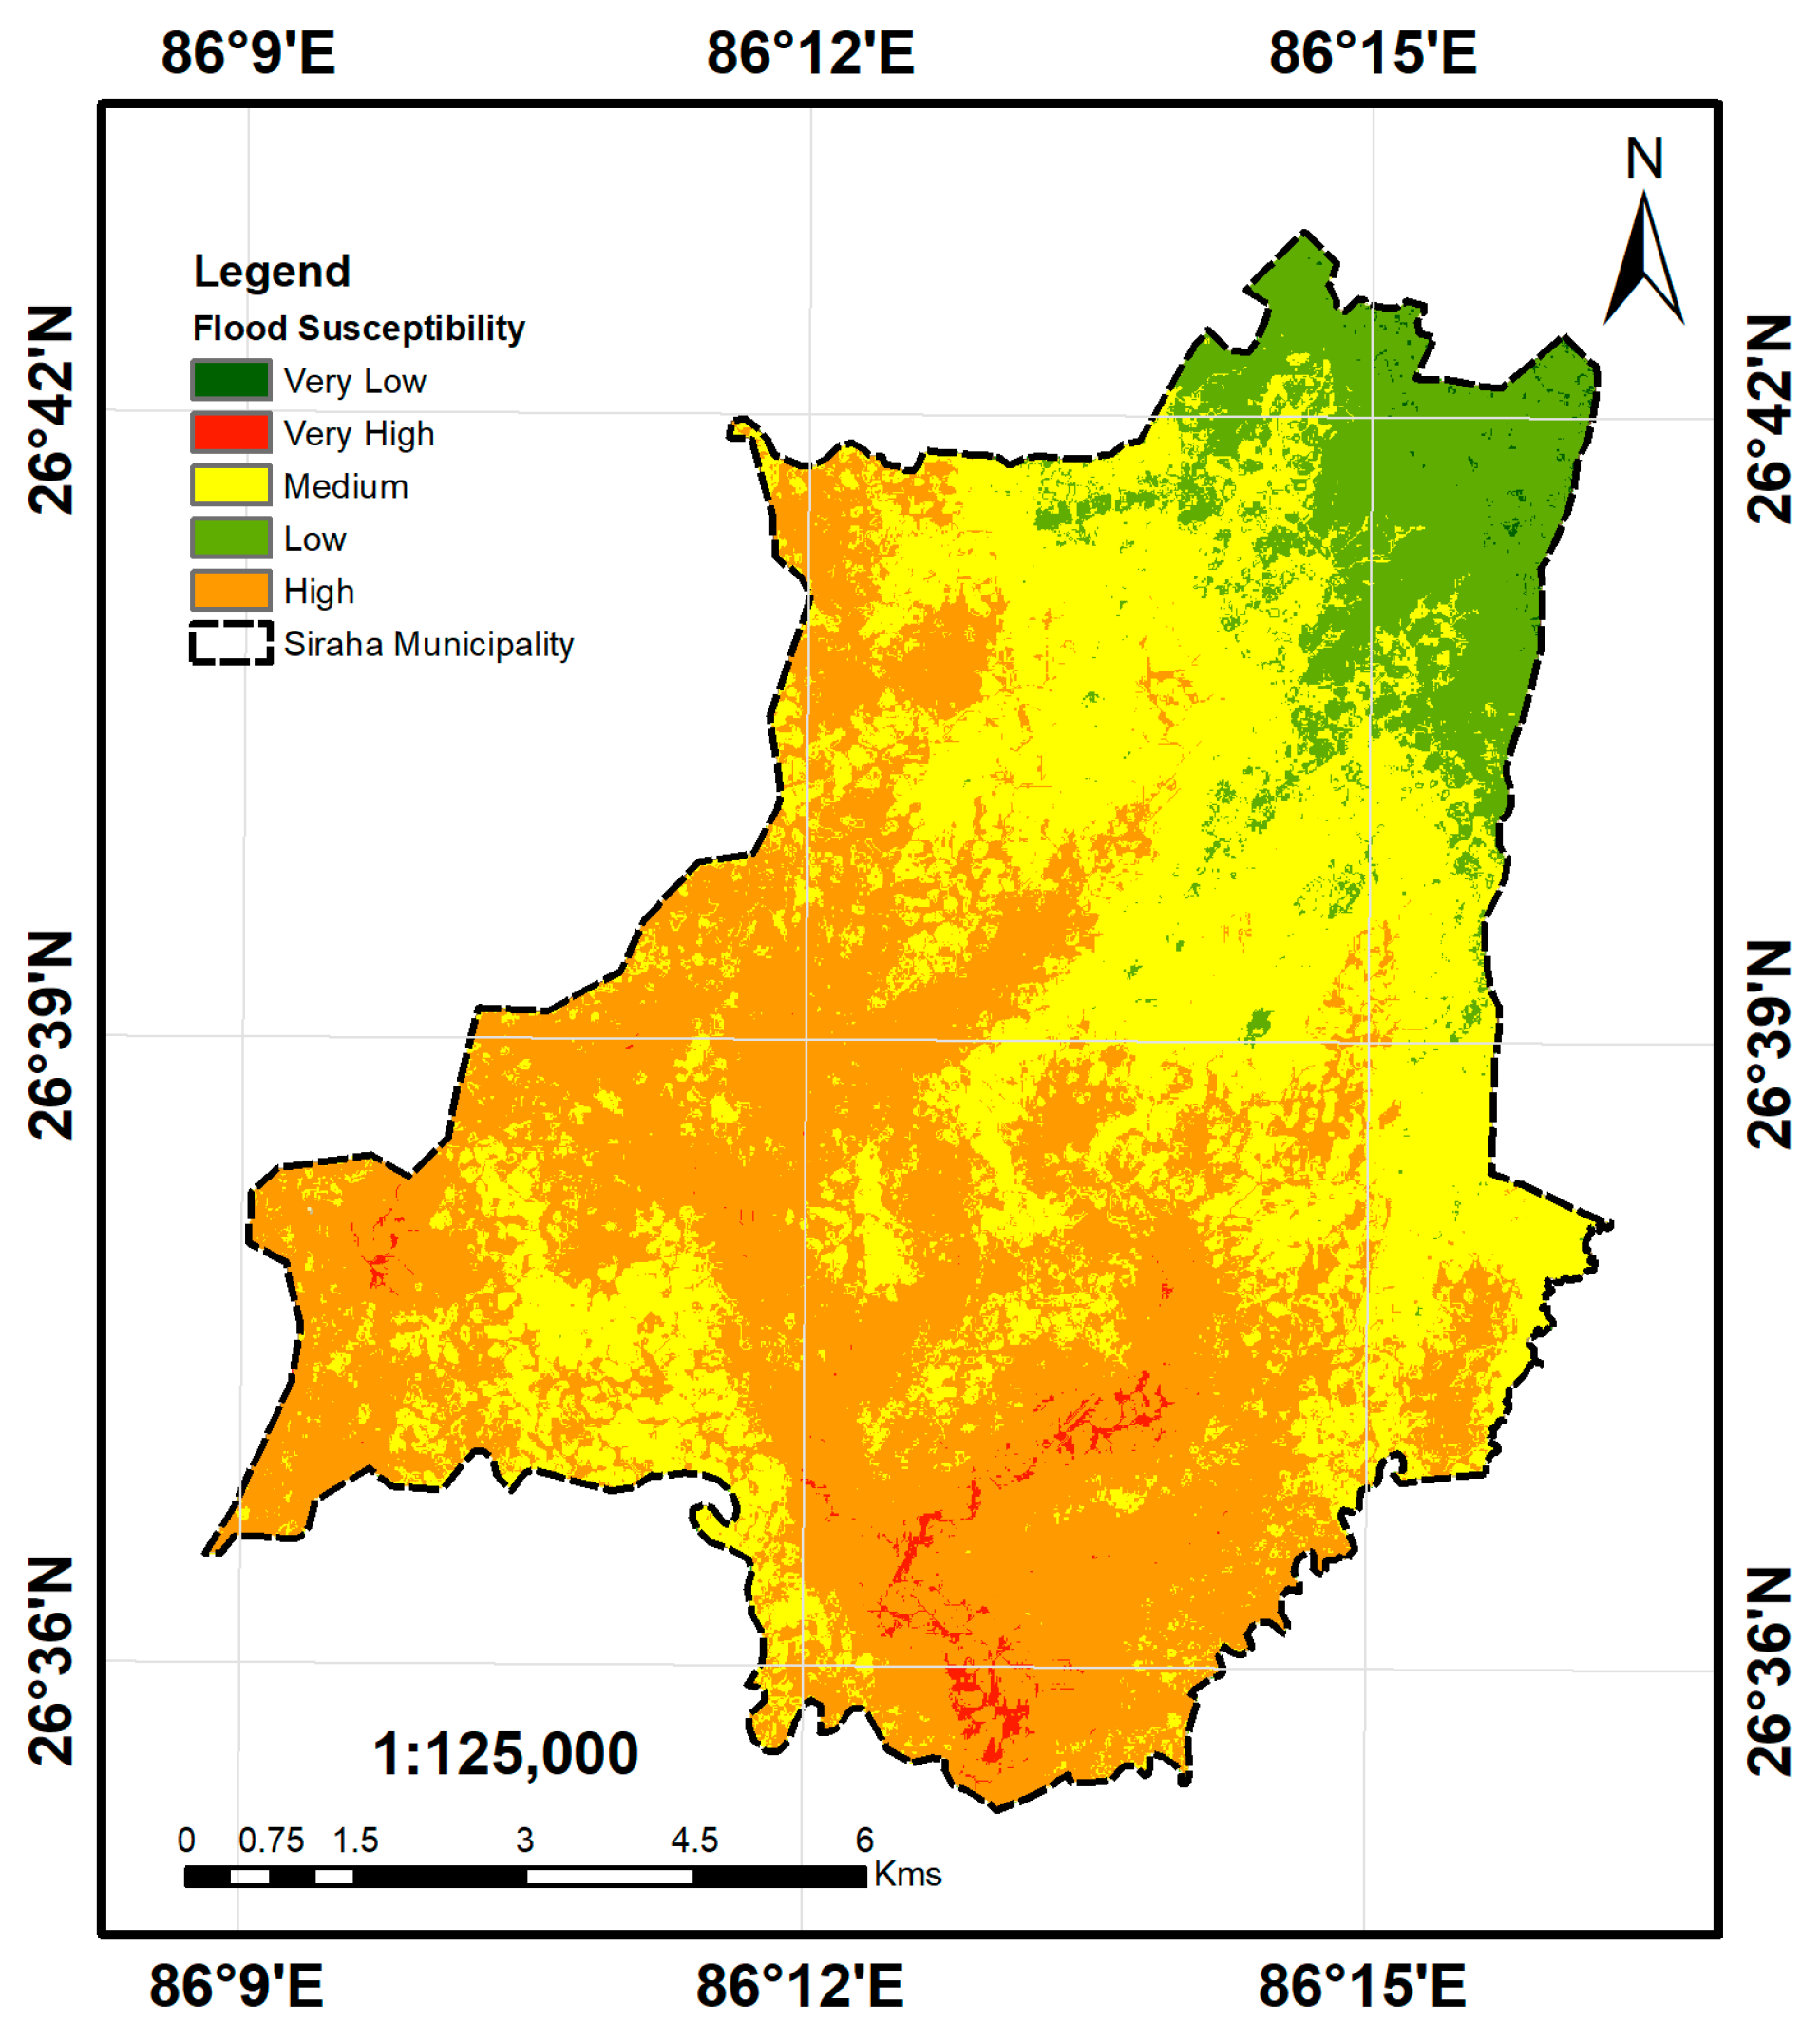
Taking Siraha Municipality as a case study and focusing on evacuation route planning, considering the flood impact on the road during a disaster, the objectives of the study are: (1) to find out the flood-susceptible region through the AHP method as susceptibility map is one of the key element for early warning system and to create strategies for future flood risk mitigation; (2) to find out the optimum evacuation route considering both effects of flood and minimizing the time as well as distance using network analysis; and (3) to suggest possible evacuation safety measures for the public for mitigating future risk that can be caused by the flood. 
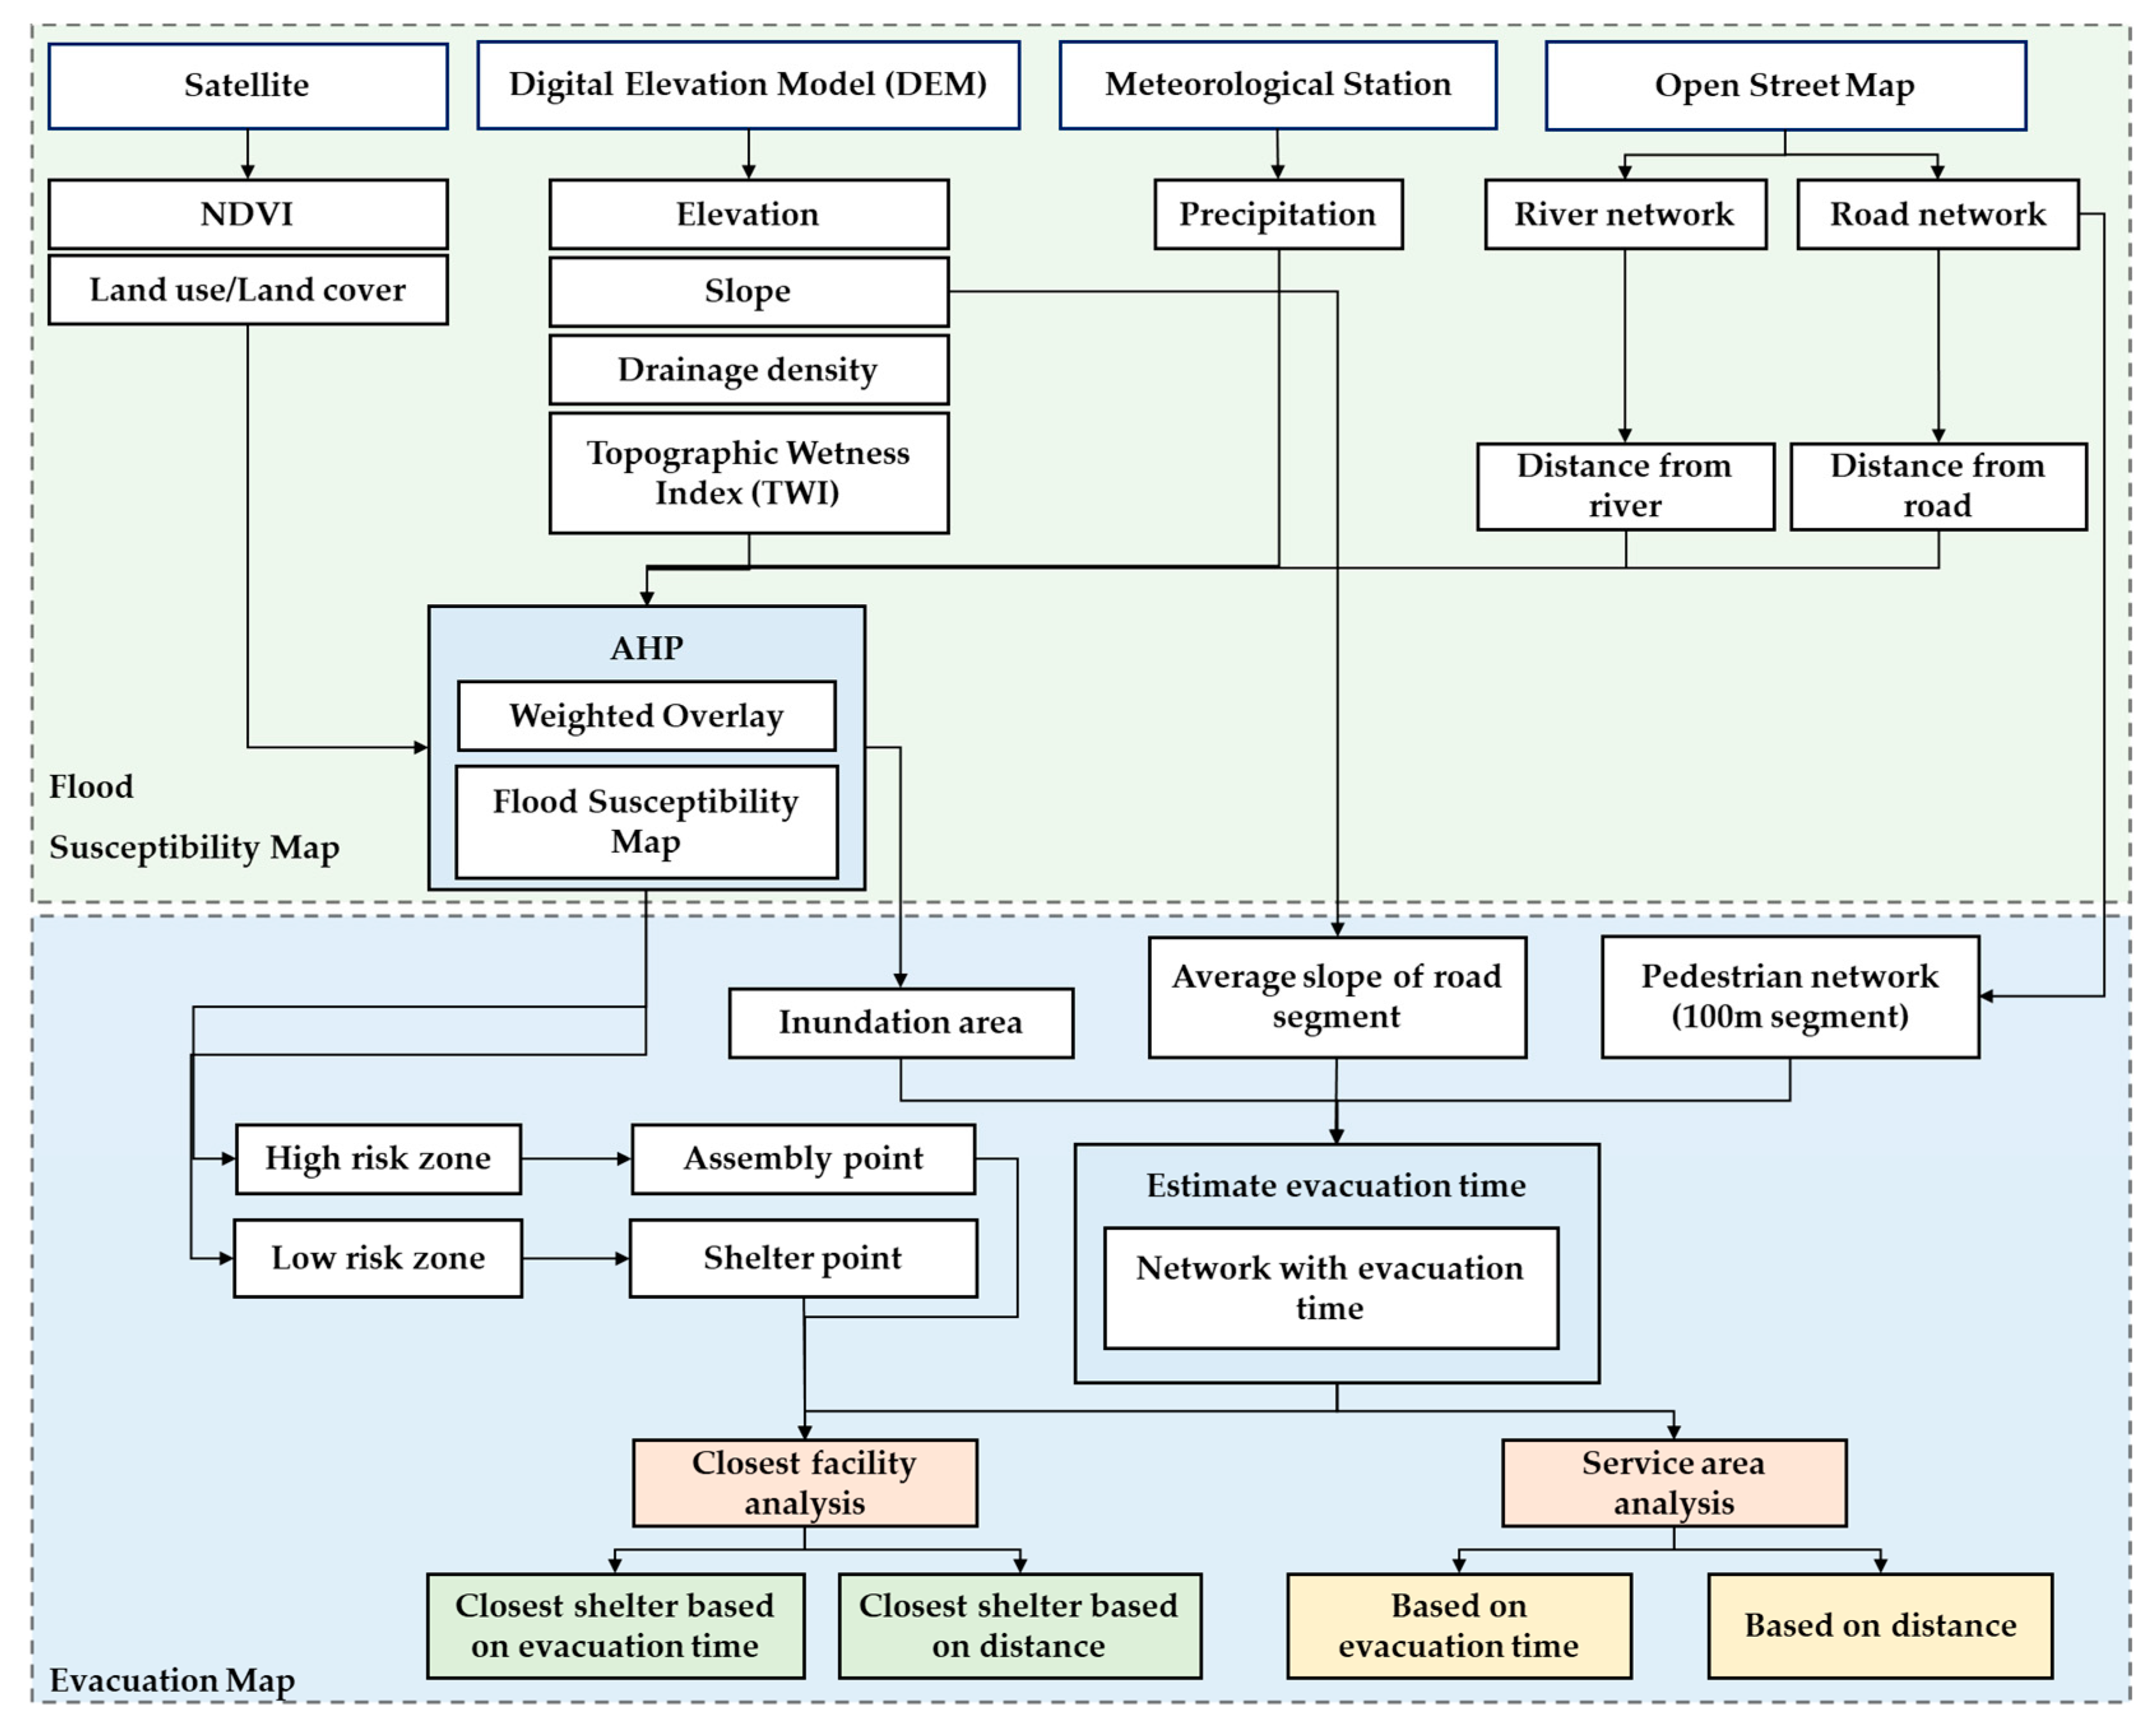
Figure 1 shows the overall workflow of the study. This study can support the authorities’ decision-making for flood risk assessment and help in providing an efficient evacuation plan.

2. Materials and Method

2.1. Study Area

Figure 2 shows Siraha Municipality as the study area. It lies in the Siraha District in the Eastern Terai Region of Nepal. Geographically, it lies between 25°35′18″ N and 26°42′53″ N latitude and 86°8′47″ E and 86°16′17″ E longitude with an area of 94.2 km2. The elevation of this region ranges from 62 m in the south to 97 m in the north. The postal road crosses the region in an east–west direction. According to the Nepal Census 2021, the total household in Siraha Municipality is 18,917 with a total population of 95,410 [49]. The maximum area of this region is covered with agricultural land while some are covered with vegetation. Similarly, the region near the Kamala River is mostly barren and the residential areas are scattered around the region but are in groups that are within certain areas only.
Siraha has a temperate highland tropical climate with an average temperature of 26–37 °C in summer (June–September) and 13–26 °C in winter (December–February). This area receives a mean annual rainfall of 1330 mm due to the eastern monsoon from the Bay of Bengal mostly in the summer season which is above the minimum threshold and sufficient in triggering severe floods [50]. There are two meteorological stations, Siraha and Lahan, near the study area that provide daily rainfall of the location, and the annual rainfall of these locations is shown in Figure 3. The annual rainfall of this area increases gradually after 2010, which shows that the area is highly susceptible to flood in the following years.
Kamala River lies in the western part of this municipality which makes this area highly susceptible to flood.

2.2. Data and Source

In this study, various thematic layers were created based on open-source primary data that are collected in the field such as rainfall records, soil information, and secondary spatial data such as elevation data and satellite imagery. The various data that were used along with their sources are listed in Table 1.

2.3. Flood Susceptibility Evaluation and Flood Conditioning Factors

The methodology adopted in creating a flood-susceptible map of the study area is illustrated in Figure 1. There is no such instruction regarding the selection of flood susceptibility criteria. Various input data that are required for flood susceptibility mapping were collected from different sources as mentioned in Table 1, and based on these data, various factors that are responsible for the flooding were derived. Nine flood conditioning factors were selected based on the literature review and their relevance to flood susceptibility: Topographic Wetness Index (TWI), slope, elevation, precipitation, land use/land cover, distance from a road, distance from rivers, drainage density, and Normalized Difference Vegetation Index (NDVI). In addition, all these factors were categorized into five different classes on a scale of 1 to 5 where 1 refers to very low flood risk while 5 refers to very high flood risk [51].
Jenks natural break is an algorithm that looks after clusters of data to divide them into homogeneous classes [52]. This algorithm divides the data value into these classes such that it seeks to minimize each class’s average deviation from the mean class while maximizing each class’s deviation from the mean of other groups [53,54]. A natural break is found to be one of the highly adopted and accurate algorithms for geographical environmental unit division [54]. As it is not possible to define the range of each class based on field verification, we used Jenks natural break algorithm to classify each geographical data layer into five classes.
The Topographic Wetness Index represents the specific location of surface saturation and spatial distribution of soil water and quantifies the effect of local topography on runoff generation [55,56,57]. When the saturation level increases, the level of groundwater rises, creating a condition for flooding. So, a higher TWI increases the chance of the area being flooded. The TWI in this area is computed from SRTM DEM using Equation (1) [55] and spatial analyst tools in ArcGIS Software.
TWI = ln(α/tanβ)
where α = specific catchment area and β = local slope.
The elevation is the height above or below certain reference points such as sea level, benchmarks, etc. [58]. The elevation plays a vital role in the direction as well as the depth of the flood [24]. So, elevation has an inverse relation with the flood as lower elevation is highly prone to flood and vice-versa [19]. The SRTM DEM data provided the elevation of each of the locations in the study area.
The slope is a surface indicator that defines flood sensitivity by finding out the surface runoff velocity and infiltration [24,59,60]. The higher the slope, the higher the runoff velocity in those areas, which makes the area that has a lower slope accumulate a large volume of water making it highly susceptible to flood [18,59,61]. Normally, the area with a slope less than 2 is highly sensitive to flood [21,62,63], so these areas are classified as high in Table 2. The slope was also extracted from SRTM DEM and used the slope function in Spatial Analyst Tool in the ArcGIS environment.
Precipitation is one of the major causes of river flooding when there is an excess of water in the river [18,51,62]. The amount of runoff depends upon the precipitation in the region. Higher precipitation causes higher runoff in the region, which makes it highly susceptible to flood [18,23,62]. Since there was only one meteorological station in Siraha, the nearby station Lahan was also used to obtain the rainfall data. Yearly rainfall data from 2000 to 2020 were used to find the mean annual rainfall of these stations and they were interpolated using Inverse Distance Weighted (IDW) method and clipped within the boundary of the study area.
Land use/land cover is one of the major factors to identify flood-susceptible areas [24]. The infiltration rate is influenced by land use [24]. The area covered with vegetation has a high infiltration rate so it is less susceptible to flood while the urban areas covered with an impervious surface such as buildings and roads are highly susceptible to flood [56,62]. The land was mainly divided into five classes, water bodies, vegetation, agricultural, settlement, and bare land, using Supervised classification on sentinel-2 imagery.
Normalized Difference Vegetation Index (NDVI) quantifies the vegetation characteristics in an area by measuring the difference between near-infrared (which vegetation strongly reflects) and red light (which vegetation absorbs) [27] as in Equation (2). The value ranges from −1 to +1 and the value near +1 represents vegetation which acts as a defense to flood [25].
NDVI = (NIR − R)/(NIR + R),
where NIR = Near Infra-Red values and R = Visible (red) values.
Distance from the river is another causing factor to flood as the river and the areas near the river are the main route for the flood making it highly prone to flood [62]. The river network was obtained from OpenStreetMap using overpass-turbo. Distance from each river was found using the Euclidean function in the ArcGIS environment.
Distance from road affects the flood susceptibility as near the road, impervious surface increases, making it prone to flood. The river network was also obtained from OpenStreetMap using overpass-turbo. Distance from each river was found using the Euclidean function in the ArcGIS environment.
Drainage density refers to the ratio of the total drainage channel to the area of the basin [64,65]. When the drainage density of an area is high, the water accumulation in this area is high which makes it more susceptible to flood [62]. Flow accumulation was created in the study area using SRTM DEM and the Raster calculator tool in ArcGIS, which helped in creating a drainage network. This drain network was further used to find the drainage density using the Line Density tool.
Distance from the river, precipitation, and drainage density are provided the maximum weightage in Table 2, as they have a direct relation with the flood in this region. The historical flood event shows that monsoon precipitation is the cause of the maximum flow of water in the river and drains cause the places near the river and maximum drainage density highly susceptible to flood. TWI, slope, and elevation are provided medium weightage as they are also key factors for floods with less effect. The region lies almost in plain areas with less slope and more wetlands, they play a medium role in flood. Similarly, LULC, NDVI, and distance from the road are provided less weightage as their impact was covered up by other factors.

2.4. Analytical Hierarchy Process (AHP)

AHP is a multi-perspective multi-criteria decision-making model that was developed by Saaty in 1990 [20] to improve and simplify the process of decision-making, which enables users and planners to quantitatively derive a scale of preference drawn from a set of alternatives [25]. In AHP, the weight or priority vector of each criterion is obtained using pair-wise comparison method (PCM) [66]. This allows for comparing the relative importance of one criterion over another based on the expert’s opinion and perception through a pairwise comparison matrix [18]. An n × n dimensional pairwise comparison matrix of the flood conditioning factor is prepared. The importance of these individual flooding factors is provided a value ranging in the scale of 1 to 9, where a lower value of 1 means both the factors are equally significant while the value of 9 represents row factor is more significant than the column factor in PCM as defined by the Saaty scale [20] in Table 3.
As a result of various literature reviews, in this methodology, a pairwise comparison matrix of selected flood conditioning factors of dimension 9 × 9 was formed. The pairwise comparison matrix is shown in Table 4 where each row is compared with each column element to find the relative importance for obtaining the rating score and the diagonal elements are always equal to 1 [51]. The approximation method is based on the evidence of previous studies, the expert’s opinion of who has worked in flood in the past, and the contribution of each factor to the flood was used to calculate the normalized pairwise matrix and final weights as shown in Table 5 [19].
There might be many inconsistencies while estimating the value for a pairwise comparison matrix, so there must be a consistency check by computing the Consistency Ratio (CR) [18]. Consistency Ratio is defined as the ratio of the Consistency Index (CI) and Random Inconsistency Index (RI) of a matrix of the same size and it should always be less than 0.1 for valid weightage [25]. The ratio is provided by Equation (3).
CR = CI/RI,
The Consistency Index (CI) was calculated using Equation (4).
CI = (λ − n)/(n − 1),
where n = number of factors and λ = average value of the consistency vector.
The Random Inconsistency Index (RI) is dependent on the number of conditioning factors that are used in creating a pairwise comparison matrix and the index value is provided by Saaty [20] in Table 6.
In this study, to find the areas susceptible to flood risk, nine factors are used, which are processed in ArcGIS 10.8 software. Each of the parametric maps is converted to a raster format of size 30 × 30 m and was reclassified into five different classes as mentioned in Table 2. The weighted overlay technique was used, where each reclassified map layer was multiplied by its factor weight and the sum of these results. Equation (5) provided the overall flood susceptibility map of the study area:
FS = ∑wi × xi
where FS = flood susceptibility, wi = factor weight, and xi = class of flood susceptibility for each factor i.

2.5. Evacuation Route Planning

The resident must be safely and timely evacuated to a safe place at the time of emergency. The evacuation route planning involves three spatial data, i.e., assembly point (point of departure), evacuation route (road network), and shelter point (destination point) [67].

2.5.1. Identification of Assembly Points

The assembly points should be in the shortest distance and within the risk zone where a large number of people can be gathered before evacuating to the shelter point. The assembly points in this study were identified based on the location having the highest population density. A place where the population is high can be considered a place that requires evacuation urgent [68]. Since it was not possible to obtain the population of every location in the study area, the buildings were extracted from OpenStreetMap, and the place with the highest building density was considered the location with the highest population density. The building data were matched with the existing Maxar Satellite imagery and the points were digitized at the place of road junctions, which acts as the evacuation point for starting the evacuation.

2.5.2. Identification of Emergency Shelter Points

The identification of suitable emergency shelter points is necessary to reduce the number of casualties caused by the flood. The safe public buildings are assigned as the emergency shelter for this case as they host a large number of evacuees. Government offices, school buildings, sports centers, medical facilities, etc., were identified and digitized to obtain the points of these locations and it was ensured that they are in the safe zone and have access to the health centers nearby [69,70,71].

2.5.3. Evacuation Route (Road Network Datasets)

The route is selected such that it reduces the distance a pedestrian has to walk with less exposure to the flood from each assembly point to the shelter point [72]. A well-connected and detailed road network dataset must be developed to perform the analysis along with each of the segments having an accurate travel time [73]. The road network datasets were downloaded from OpenStreetMap and thoroughly checked whether there was any network breakage before it was used for the analysis. The road network was dissolved to ensure that each road is connected well with the others.

2.5.4. Evacuation Speed and Time

An immediate evacuation is necessary at the time of flooding, so it is not possible to evacuate the people through vehicles or any form of transportation. In this study, the main way of evacuation is by walking from the assembly point to the sheltered zone through the optimal route [68]. The average walking speed of the evacuee during evacuation is set to be 1.5 m/s, which changes according to different time groups as shown in Table 7.
A slope slows down the speed of the evacuee during the evacuation. The road network was divided into multiple segments of 100 m each. The average slope of each road segment was calculated using the “add surface information” function in the GIS environment. Thus, these slopes were used to correct the evacuation speed based on Table 8.
It is necessary to consider that walking speed is decreased due to the flooding when the pedestrian walks through the flooded area while calculating the evacuation time. In this study, the area which is in the high susceptibility zone is considered a flooded zone. The maximum depth of the flood that a pedestrian can evacuate through is 0.55 m [68]. Considering these, the modified speed after considering the flood is calculated using Equation (6) [75]:
v (m/s) = V − 0.011d (cm),
where v is the walking speed in flood, d is the depth of the water, 0.001 is the decreasing rate by the depth, and V = 1.5 is the average walking speed.

2.6. Evacuation Model Building

An optimal evacuation model is developed to find the best route that evacuates the pedestrian in a short time. While preparing the evacuation model, we mainly focused on moving the residents from the high-risk zone to the low-risk zone. In this study, mainly two approaches were used to build the evacuation model: closest facility analysis and zone-based simulation.
The Network Analyst is an extension in ArcGIS Desktop which was used in this case to create a model that helps find the effective route and the zone for the probable additional shelter location within the time allocated for the evacuation.

2.6.1. Closest Facility Analysis

This model considers evacuation time as a cost factor to find the optimum evacuation route from the assembly point to the shelter point. The assumption is based on the fact that the evacuees always prefer the closest shelter facility during the evacuation [76]. The Origin–Destination matrix between each of the assembly points and shelter points can be created using the Closest Facility of Network Analyst tools. The time allocated for the evacuation is 30 min. So, this model considers those shelter facilities that lie within the 30 min walk from the assembly points.

2.6.2. Service Area Analysis

The people during the disaster must be safely evacuated within the possible evacuation time to the shelter locations. During a disaster, it might not always be possible that the shelter lies within the optimum distance and time for the people in need. This model suggests the zone is the total number of emergency shelter locations within the area of 30 min walk distance from the point of evacuation. The zone was developed based on the New Service Area tools of the Network Analyst. The service area shows the road networks that can be reached within 30 min from the assembly points. This model can also be used to create new shelter points if there are no sufficient points within the service area.

2.7. Validation of Susceptibility Map

To validate our flood susceptibility map, we looked at the historical flood event that occurred in Siraha Municipality from 2010 to 2023 in the Bipad portal ([77]) and found that a flood occurred on 17 July 2019. Synthetic Aperture Radar (SAR) can be used to extract the extent of historical flood events [52] as opposed to optical imagery because SAR can penetrate through clouds as well as can obtain data in night conditions [78]. The sentinel-1 provides dual-polarized SAR data. Two SAR imageries of resolution 10 × 10 m were obtained over the study area: one before the flood on 8 July 2019, and another after the flood on 17 July 2019 using the Google Earth Engine (GEE) platform. A speckle filtering technique was used to remove the noise in the image followed by mosaicking. The GEE platform was used to obtain the sample of the backscattered value of water bodies pixel in each image before and after the flood, and the threshold technique was used to extract the inundated area in the study area.

3. Results

3.1. Flood Susceptibility Mapping

The nine flood conditioning factors used in the study were each categorized into five classes depending on their range of values as shown in Figure 4. The AHP technique provided the relative importance of each factor based on PCMs and the weight of each factor. The distance from the river and precipitation were provided high importance with maximum weight as they have a high impact on flooding. Using the weighted overlay of all causative factors in the GIS environment, the final flood susceptibility map was generated with a CR of 0.086 (<0.1, validated).
The flood susceptibility map thus generated is shown in Figure 5, in which the study is mainly divided into five classes based on flood potentiality: (1) very low, (2) low, (3) medium, (4) high, and (5) very high susceptibility. The area’s coverage and percentage are shown in Table 9.
As per the share of flood susceptibility based on area, the most covered by highly susceptible (46.803%), while the lower by very low susceptible (1.18%). Similarly, the low susceptible class covers an area of 10.49%, medium covers 39.65%, and very high covers 1.87%. Furthermore, very low, low, and medium classes were merged into a single class as a safe zone and high and very high classes merged into another class as a risk zone for further evacuation route modeling.

3.2. Evacuation Route Modelling

Out of 40 assembly points, 20 assembly points were found to be risk zones, and out of 38 shelter points, 22 were in the safe zone. Thus, using these data, the final evacuation maps were produced to find the shelter home which is in the shortest time possible and shortest distance considering the impact of the flood on the speed of evacuees using closest facility analysis and service area analysis.

3.2.1. Closest Facility Analysis

The result of the closest facility is shown in Figure 6. In this analysis, two approaches of using evacuation time and distance were used as the cost factors to find the possible evacuation route from assembly to shelter points.
Based on the shortest time, it is found that 12 shelters lie within 30 min, 7 shelters lie within 60 min, and 2 shelters lie within 100 min from the assembly points. Similarly, 8 shelters lie within 1500 m, 11 shelters lie within 3000 m, and 3 shelters lie within 5500 m from the assembly points.

3.2.2. Service Area Analysis

The result of the service area analysis is shown in Figure 7 showing both the approaches of time and distance as a cost factor.
The green areas in Figure 7 show the zone that lies within 30 min walk and 1500 m from the assembly points and these places are the areas where the evacuee looks after the shelter home at the time of emergency. These are the places where possible new shelter homes can be built for maximizing the capacity of the shelter to host the evacuees.

3.3. Validation with SAR Images

The sentinel-1 SAR images were collected for the study area looking at the historical flood event of 2019. The GEE platform estimated the backscatter values (dB) of the VH polarized pre- and post-flood images. The inundation map as shown in Figure 8 shows the southern part and the area near the Kamala River which is about 30.196 km2 and 35.24% of the total area of the Siraha Municipality was under flood at this time.
The flood susceptibility map that was produced in this study through AHP Technique was compared with the inundation map obtained by analyzing the SAR image. It was found that the 22.35 km2 (74.03%) out of 30.19 km2 of inundated area in past floods lies within the highly susceptible areas shown by the result of this study. The comparison shows that the area that was defined as a highly susceptible area through this study is the one mostly inundated in the past flood event. This susceptibility map can be an early warning of those flooding events that might occur in the future in those areas.

4. Discussion and Conclusions

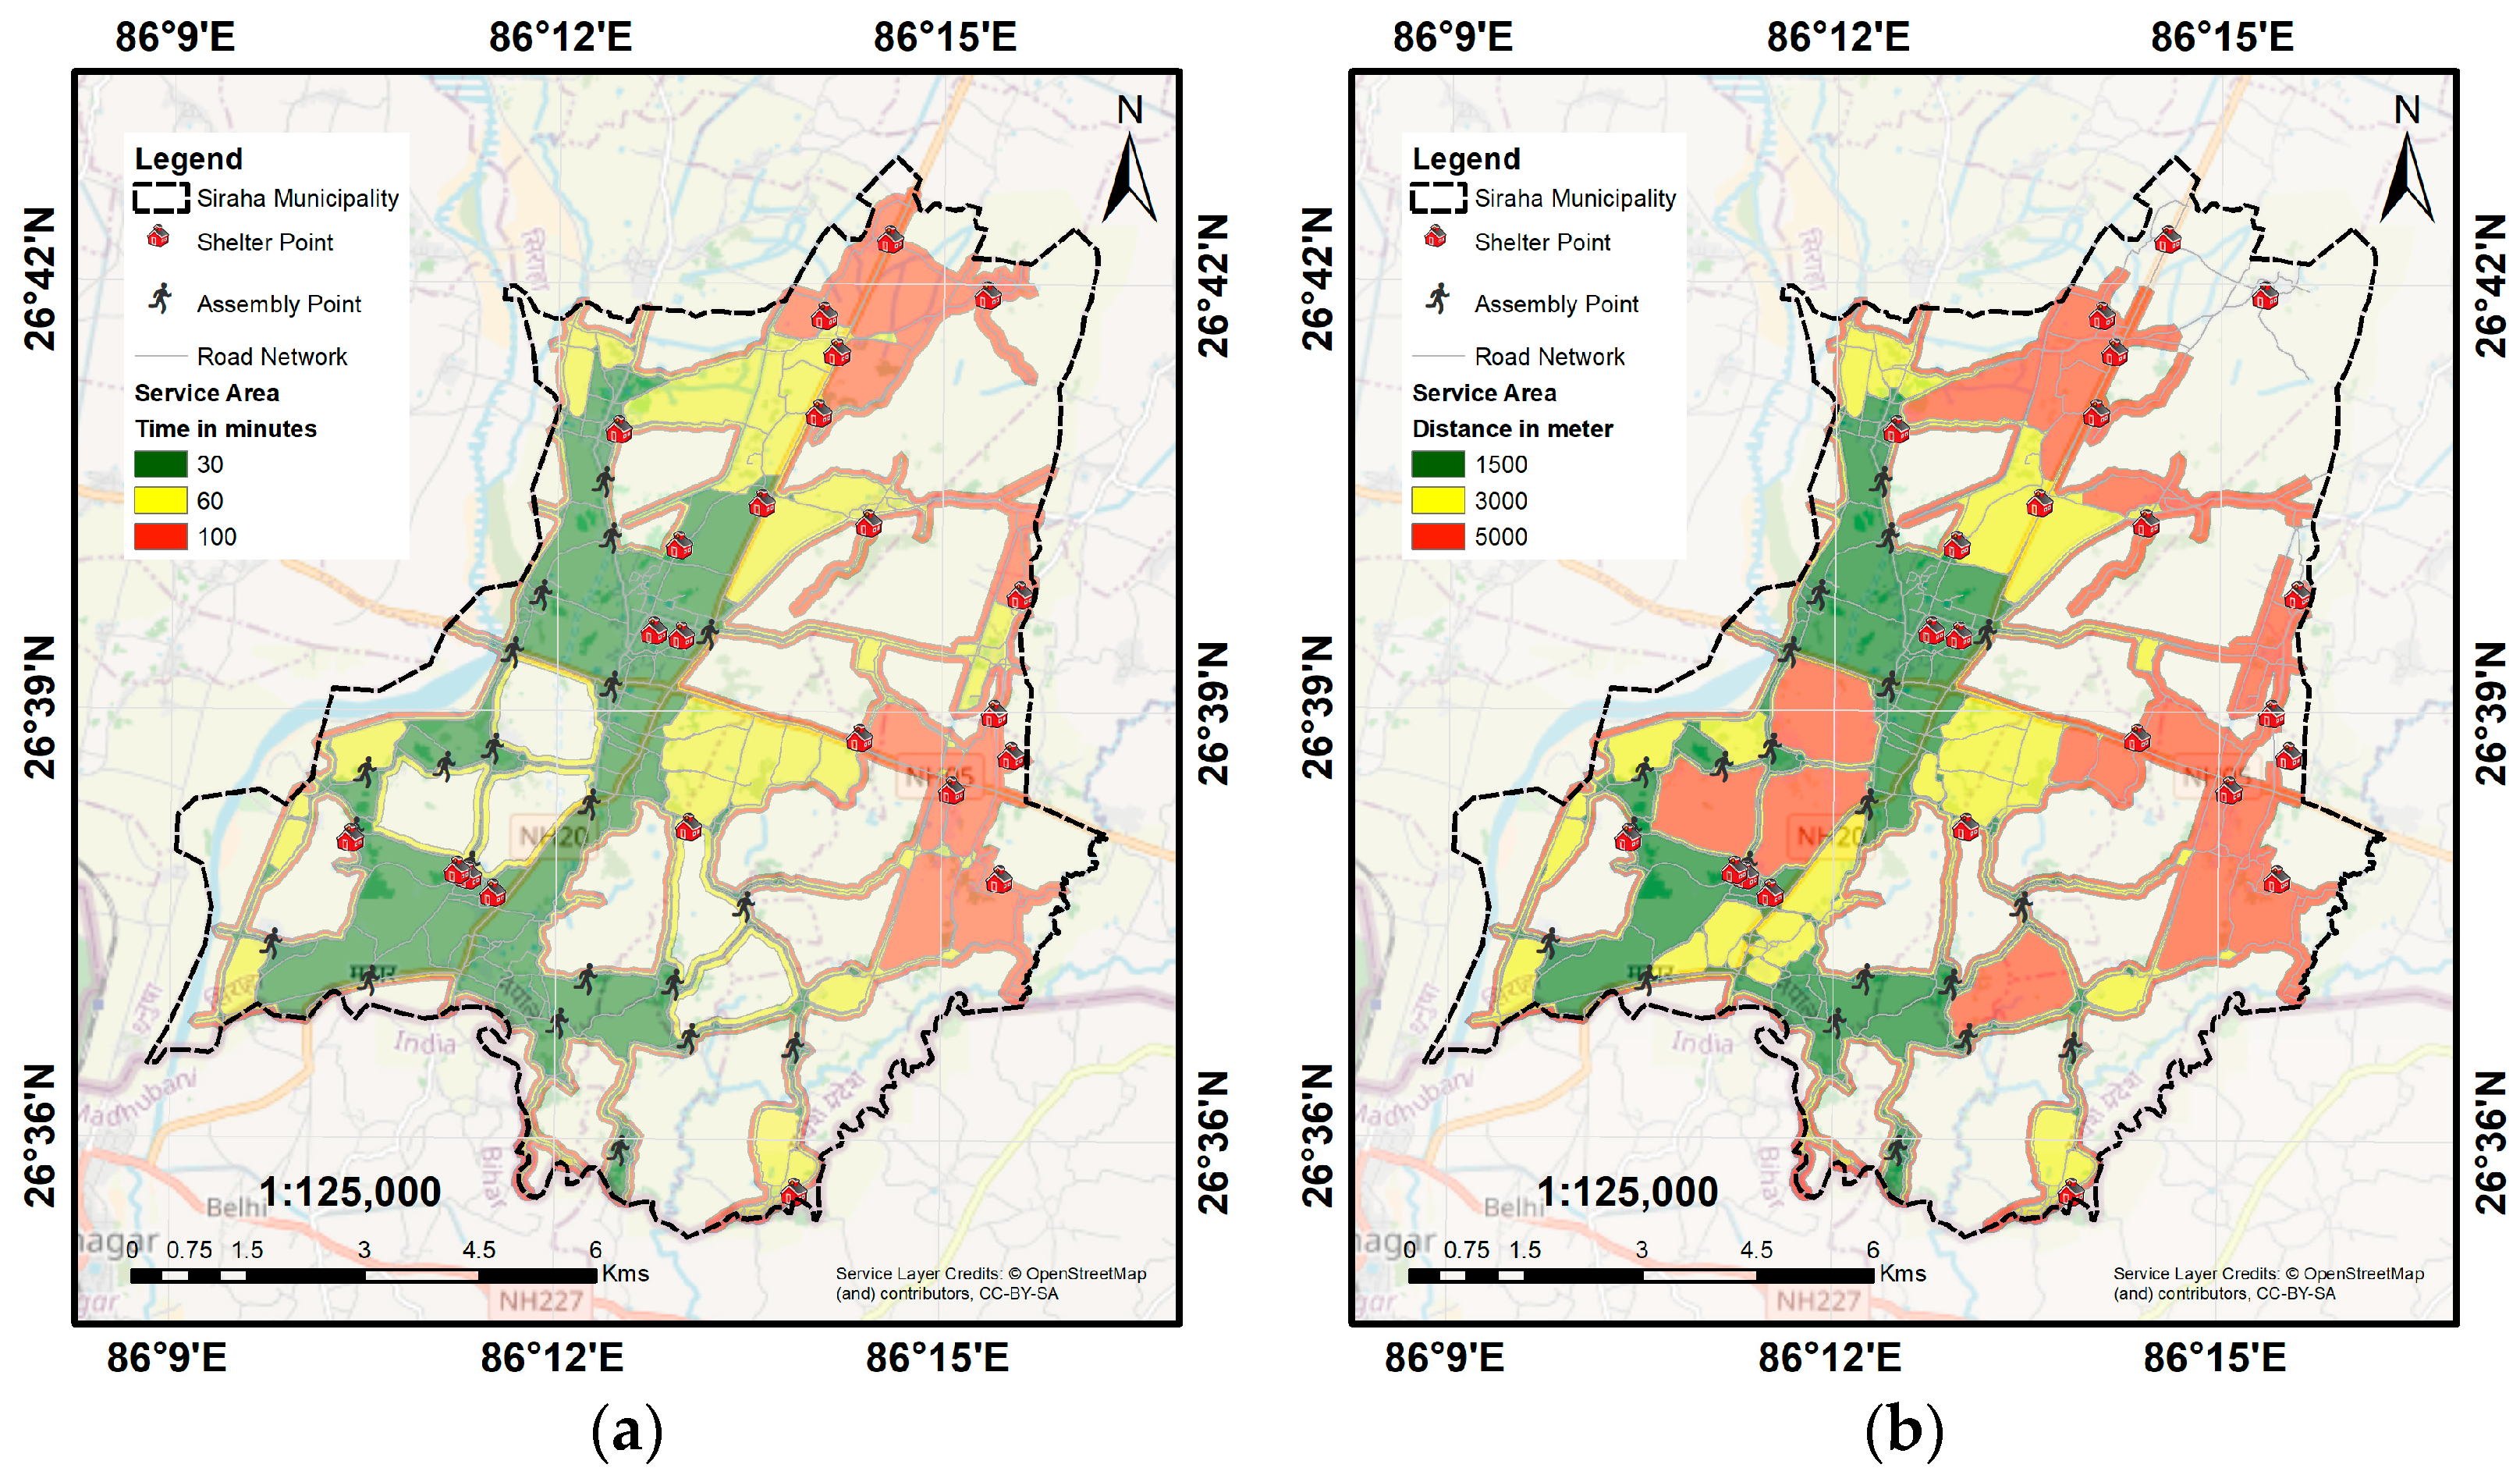
This study proposes an efficient way to precisely find the flood-susceptible areas and the best evacuation route to evacuate the people from those areas to a safe zone. The Multi-Criteria Decision Analysis (MCDA) approach is used along with the AHP technique proposed by Saaty [
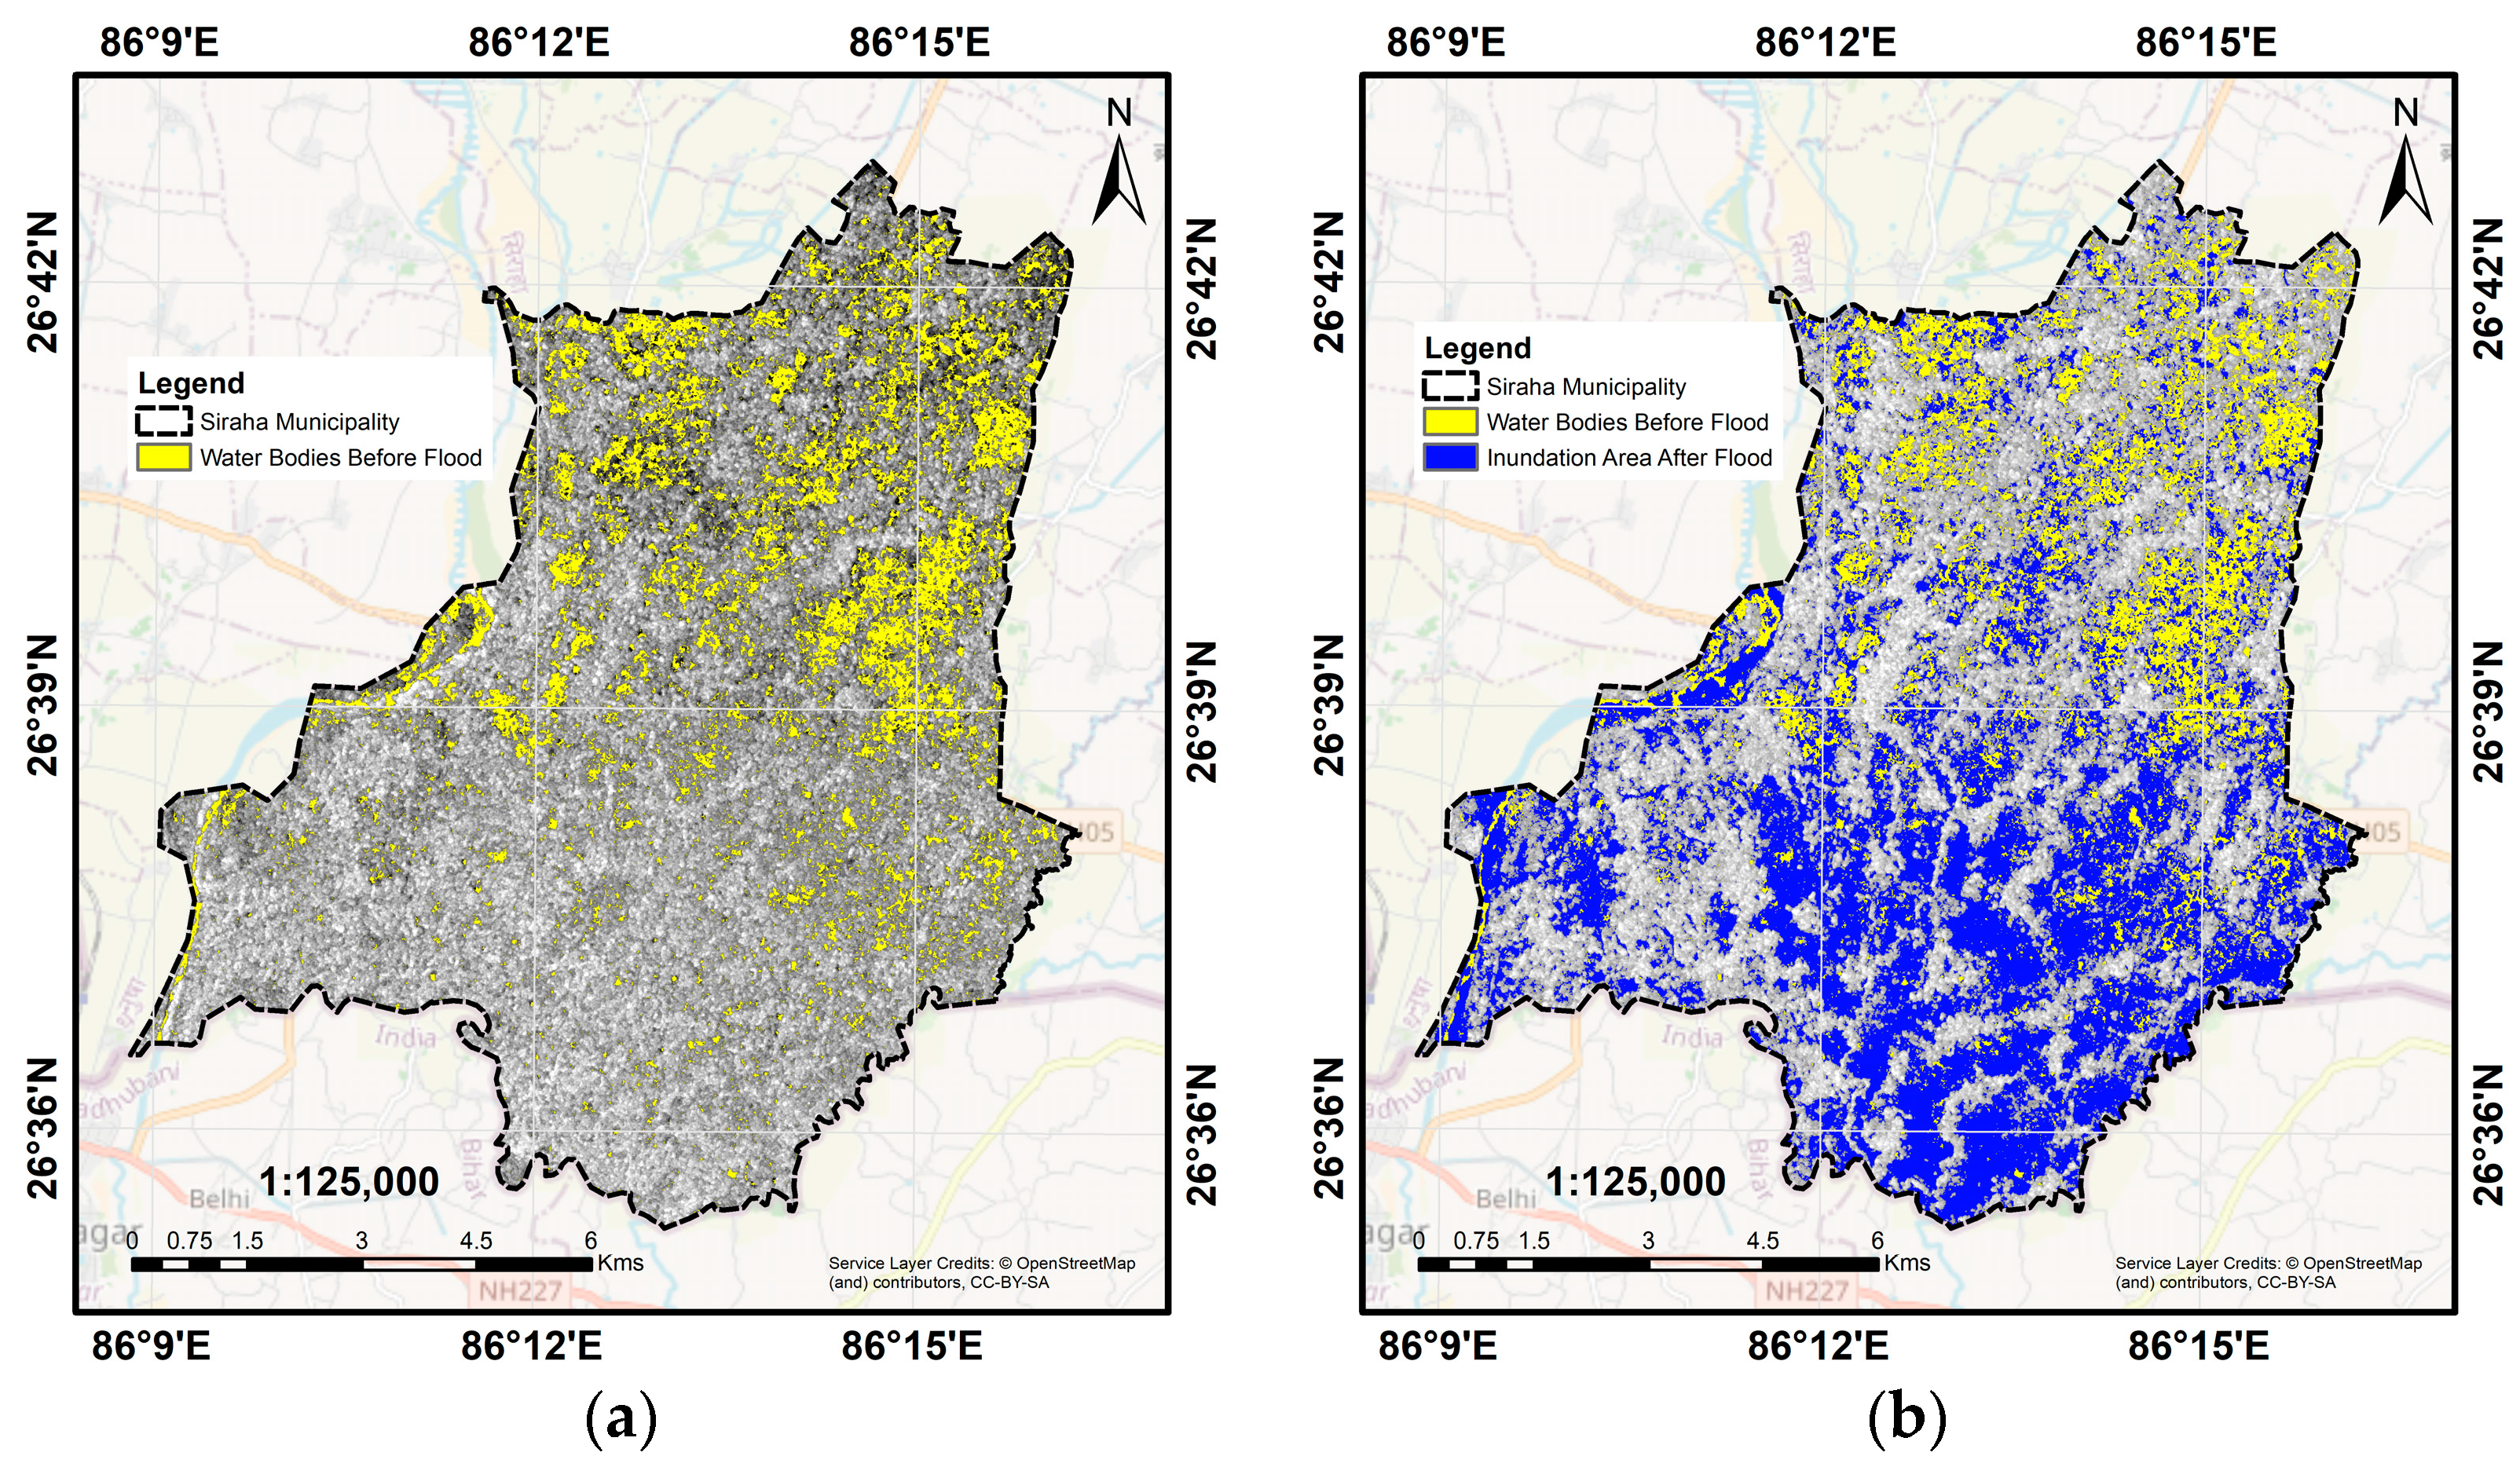
20] and GIS to find the relation between, and evaluate the effect of, nine flood conditioning factors that cause susceptibility of the flood to the area of Siraha Municipality. After finding the susceptible areas that can potentially be inundated at the time of the flood, the effect of the flood and the slope of the study area on the speed of the evacuees were used to find the fastest route toward the safe place using the closest facility analysis. Meanwhile, the probable place for a new shelter zone was also suggested using service area analysis. The flood susceptibility map obtained through the MCDA-AHP technique showed that half of the area of Siraha Municipality (48.6% of the total area) is susceptible to flood that includes mainly the eastern part that is nearest to Kamala River and the southern part nearest to Nepal–India border where a maximum number of dams and physical structures has been constructed obstructing the continuous flow of river water that aligns with the historical flood events in the region. Similarly, 57% of the total evacuation route (12 out of 21) lies within the 30 min evacuation time. Moreover, less than 50% (8 out of 22) of routes fall within 1500 m of distance from the assembly points. The flood susceptibility map was further validated with the flood inundation map of 2019 obtained through SAR images. Although the flood susceptibility map aligns well with the historical flood points and the flood map created by the municipality, the issue and the limitation must be well-discussed while carrying out the study.
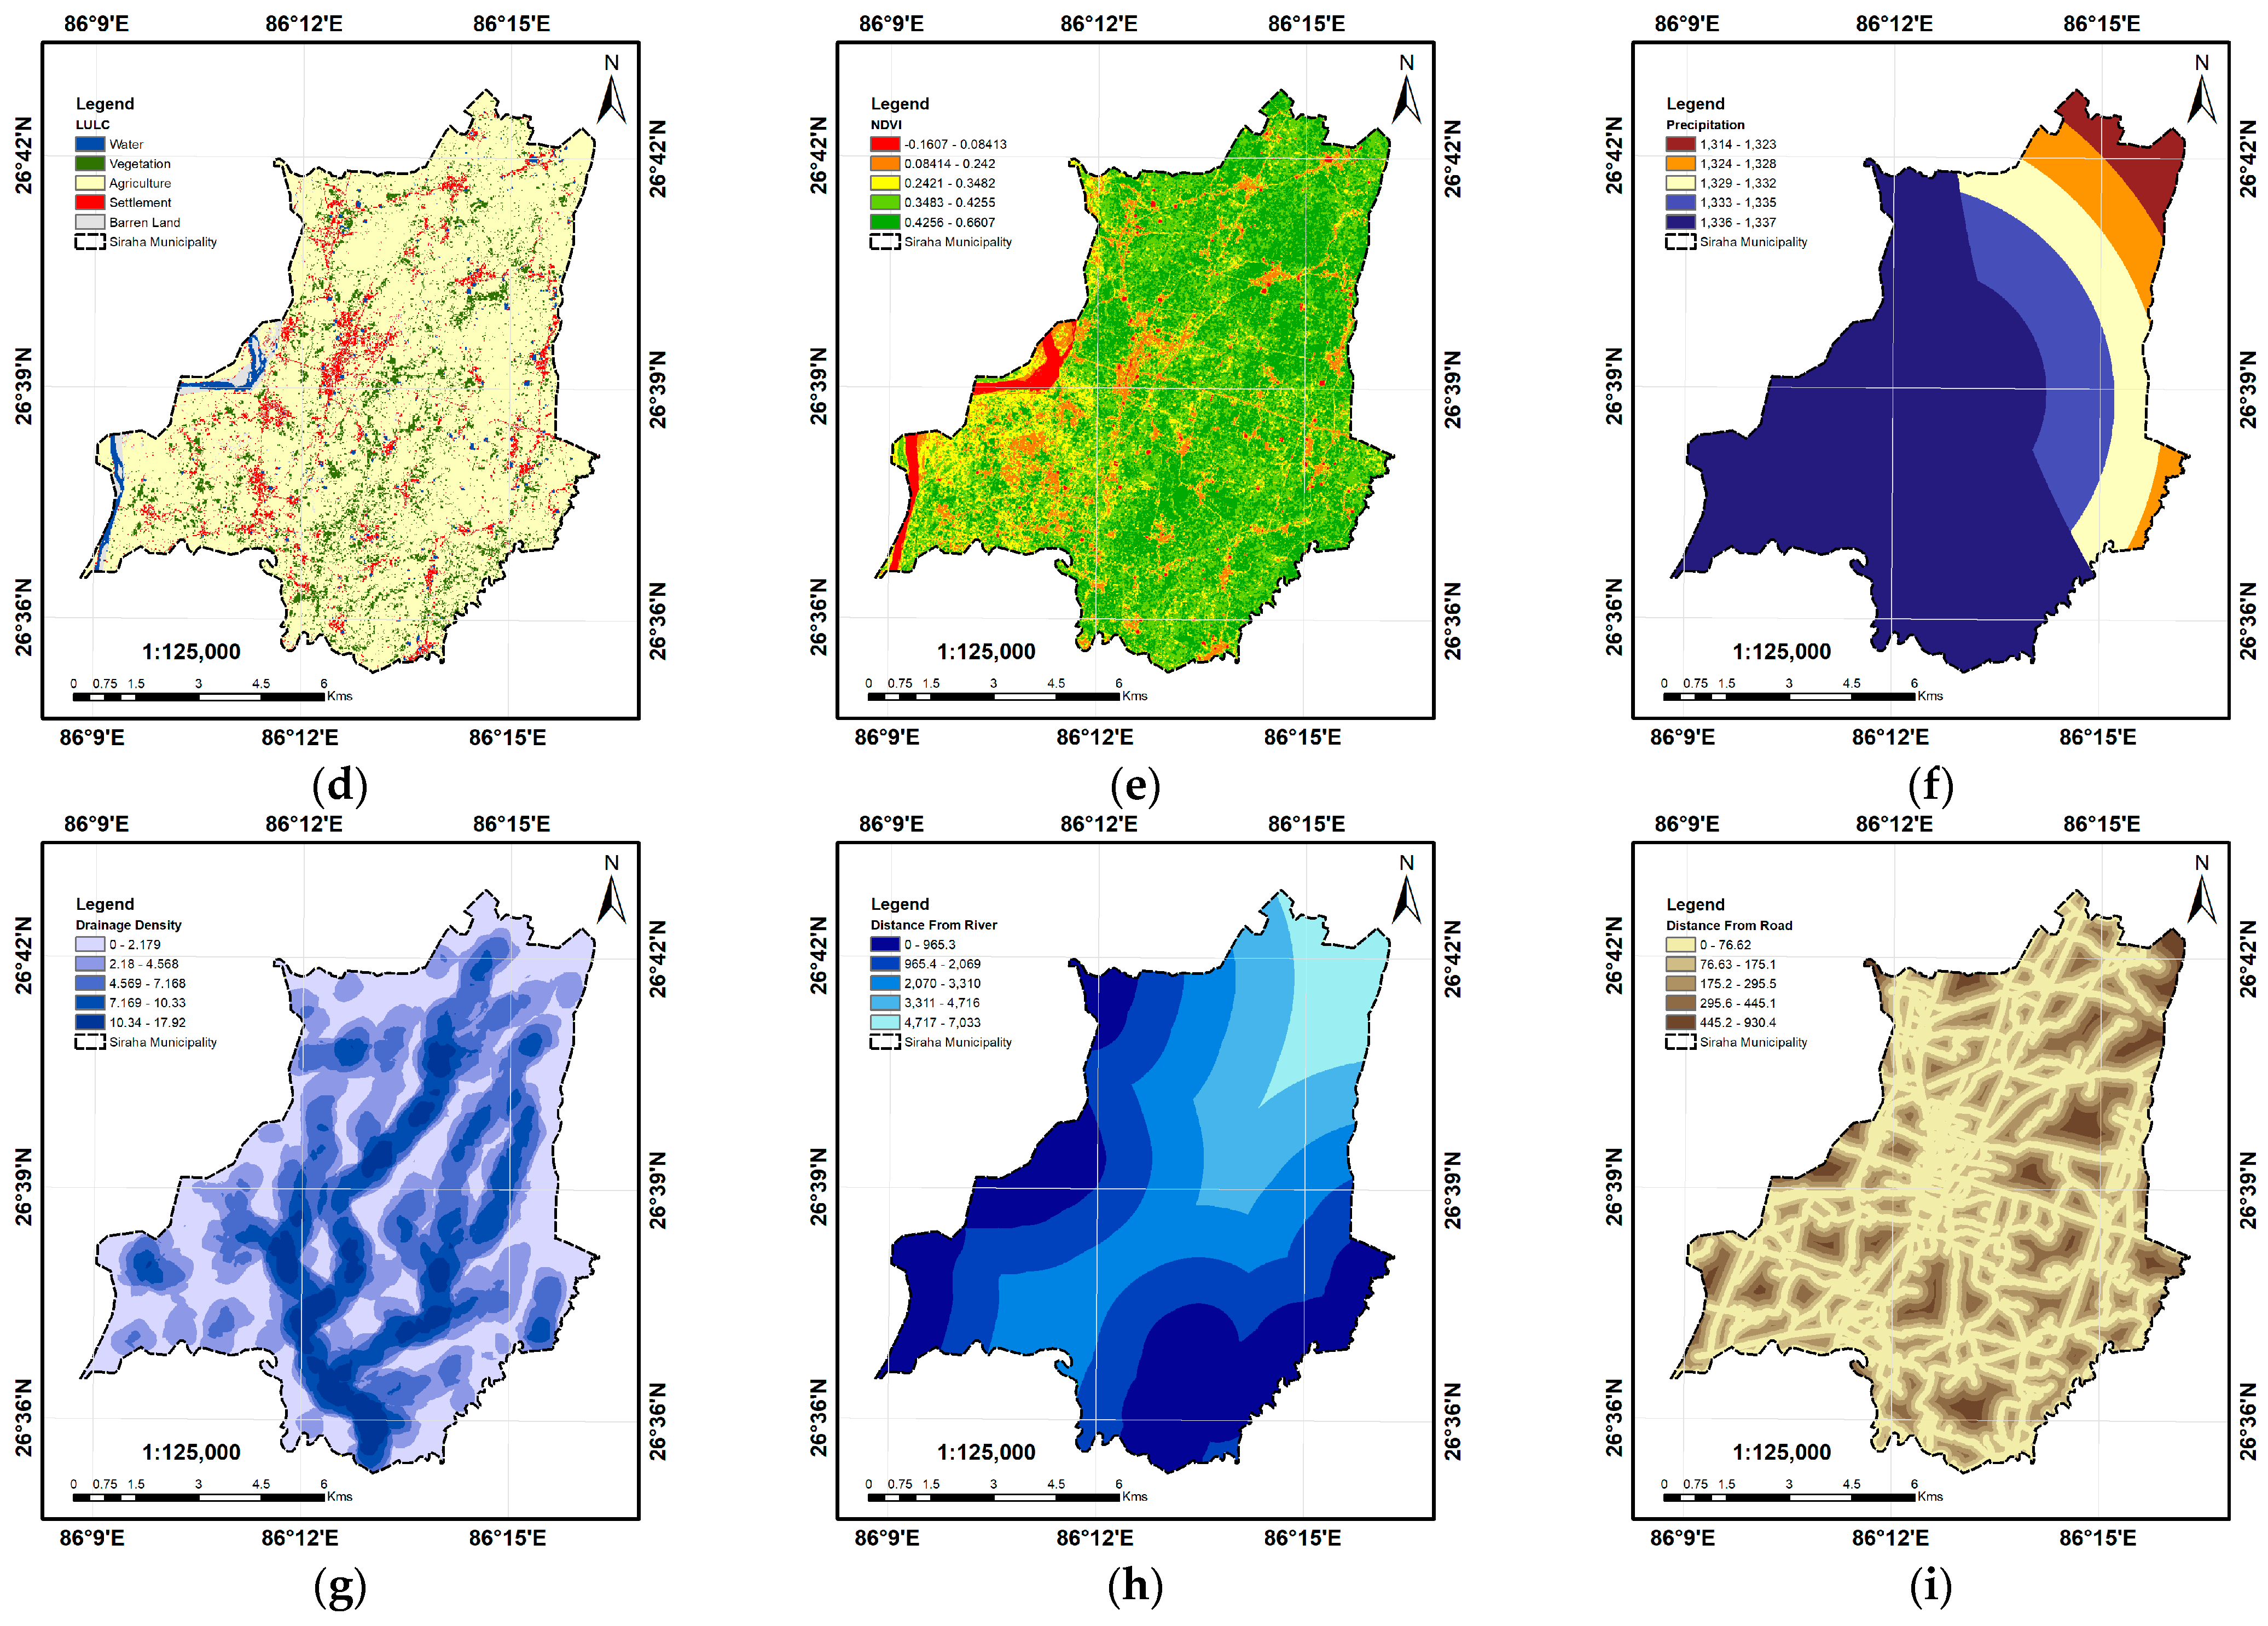
One of the major issues in finding the susceptibility using the MCDA approach is the number of flood conditioning factors and choosing the most suitable factors for the area. Nine factors were used in this study, which was similar to other studies by Nsangou et al. [62] and Khosravi et al. [27] which used ten factors. Similarly, Dahri et al. [58], Seejata et al. [51], and Ouma et al. [23] used six factors, Vojtek et al. [19] used seven factors, Hammami et al. [24] used eight factors, Negese et al. [79] used 11 factors, Gacu et al. [21] used 17 factors, and Swain et al. [25] used 21 factors, which shows that the number of factors can be variable, but should be selected such that the overall weightage is not dominated by the individual factor. The factors should also be selected such that they best fit with the geomorphologic and geologic conditions of the area.
There are a few problems while using the AHP technique. This method is not able to determine the uncertainty in selecting the criteria, comparing and ranking individual criteria based on their weightage. One of the greatest disadvantages is that the expert’s opinion is to be used while giving weightage to individual criteria, which might be a case of bias, and more experts might have different opinions [80]. Another disadvantage of this methodology is its suitability to scale up from the regional level to the global level. This is suitable for the regional level but scaling to the global level might be a problem as well.
Another issue is the use of factors that affect the speed of evacuation during the time of emergency. R. Dewi [73] used the same speed for all the evacuees while Bonilauri et al. [71] and González-Riancho et al. [72] added the effect of slope on the speed of the evacuees. Similarly, Zhu et al. [69] took into account road factors such as road width, slope, pedestrian density, etc., while Watik et al. [81] used the risk zone as a barrier and avoided the road that falls within this region to find the safest and shortest path. It is not always possible to avoid the inundation area while finding the shortest evacuation route. The effect of the flood on evacuation speed must also be considered. It might take a longer time to evacuate but it will be the actual time that differs from the one estimated without considering the flood effect. So, this study uses the effect of flood and slope to find the shortest route, which were similar to the studies carried out by Musolino et al., Jamrussri et al., and Park et al. [68,70,82].
From the study, we can discuss the following aspects of evacuation route finding in flood-susceptible regions:
i.
The top priority should be on finding the causes of the disaster and how this can be mitigated. Since the majority of the part of susceptible area lies near the river, a proper embankment should be constructed, which can potentially minimize the number of flooding events;
ii.
Risk reduction is another aspect that should be addressed. The shelter location with the maximum capacity should be built in a safe place that is accessible in the time of emergency. The results also suggest some of the possible areas where shelter locations with maximum capacity can be built;
iii.
Around half of the area is under the threat of possible flooding in the future, which is a crucial aspect. The concerned authorities should be well aware of this occurrence of flood and they should be well-communicated about the effective evacuation plan to reduce the fatalities caused by it;
iv.
Often, studies are not focused on proper evacuation planning, there should be a proper investigation and use of appropriate technology for disaster risk reduction such as geology, hydrology, meteorology, GIS, remote sensing, early warning system, etc.
This is the first of its kind in identifying an evacuation route to the safest part of the flood-susceptible region in Siraha Municipality. This study will bring insight to the local government and concerned authorities in proper planning to reduce the fatalities caused by the flood event. Similarly, it will also help the people of the area to choose the best possible shelter location and the optimum route to reach those places at the time of disaster. Despite our effort, the study faced some challenges and limitations:
  • Since it was not possible to obtain the data by field data collection, we had to depend on the secondary dataset which may not align perfectly with the ground data;
  • There is always uncertainty while using the AHP technique on using the number of criteria;
  • The weightage of each factor was used based on experts’ opinions which sometimes might create a business on the study;
  • The unavailability of high-resolution data affected the map that was produced. As a result of which, very low-resolution DEM data were used to extract different factors affecting flood, no soil information was used, and some possible factors had to be dropped. The local government authorities should look after preparing a high-quality database for future estimation of accurate flood-susceptible areas;
  • Another challenge faced was the allocation of proper shelter locations as there were no data that define the amenity as a shelter location. The area is susceptible to frequent flooding events, so there must be a proper allocation of shelter houses along with the capacity of that location;
  • Obtaining the proper road network dataset along with its type and width was not possible, so we had to use the dataset from OSM, where the width and road type was not available. Therefore, the municipality must create the complete road network dataset.
Although this study can effectively identify the potential evacuation route to the safe zone from the flood-susceptible area obtained through various risk factors, various gaps in the study can be potentially solved in future studies. Future research can be oriented toward using the latest technology in flood susceptibility mapping such as the naïve Bayes method of alternating decision tree (AD Tree), support vector machine models, Random Forest (RF), etc. The use of various factors that affect evacuation such as flood velocity, variant flood depth, the variable walking speed of different age groups, etc., can help in providing more accurate and real-time scenarios of evacuation route planning. Considering the road damage, bridge collapse as a result of a flood provides the proper evacuation route plan based on field scenarios in future research. Moreover, future research can elaborate on the connection between the potential losses and damage caused by flooding and possible civil protection actions such as the evacuation of people. This study focused on the administrative boundary as the emergency preparedness plans, as well as disaster response and damage assessment, which are carried out by the administrative units in Nepal, but future research can be scaled up to the basin level, multiple administrative units, or province level as waterborne disasters mostly affect the region within the basin area. To achieve a better (more realistic) result, it is not necessary to use the whole river basin; it is sufficient to extend the input data for the entire river floodplain. Finally, the GIS-AHP technique provided useful insight into finding the flood-susceptible region, and the closest facility analysis helped in finding the best evacuation route in Siraha Municipality.

Author Contributions

Conceptualization, Gaurav Parajuli; Data curation, Sandeep Kunwar and Ramesh Adhikari; Formal analysis, Gaurav Parajuli, Shankar Neupane, Sandeep Kunwar and Tri Dev Acharya; Investigation, Gaurav Parajuli, Shankar Neupane, Sandeep Kunwar, Ramesh Adhikari and Tri Dev Acharya; Methodology, Gaurav Parajuli, Shankar Neupane, Ramesh Adhikari and Tri Dev Acharya; Software, Gaurav Parajuli and Sandeep Kunwar; Supervision, Tri Dev Acharya; Validation, Gaurav Parajuli; Visualization, Gaurav Parajuli and Tri Dev Acharya; Writing—original draft, Gaurav Parajuli; Writing—review and editing, Tri Dev Acharya. All authors have read and agreed to the published version of the manuscript.

Funding

This research received no external funding. The APC was funded by the University of California Davis Open Access Fund (UCD-OAF).

Data Availability Statement

All the data used in the study are open source and the links to the data have been mentioned in the manuscript.

Acknowledgments

The authors would like to acknowledge that the research is an extension of an undergraduate final-year thesis supervised by Bikash Sherchan from the Department of Geomatics Engineering, Pashchimanchal Campus, Tribhuvan University, Nepal. The first author extends his appreciation to Aashish Sharma for his valuable suggestion during the conceptualization of this work. The manuscript is a result of the #Mentor4Nepal Initiative (https://github.com/trydave/Mentor4Nepal), which supports recent graduates and early career professionals focusing on the enhancement of one’s skill set, support for a research project, and a collaborative publication.

Conflicts of Interest

The authors declare no conflict of interest.

References

  1. MoHA Crisis to Resilience: Transforming Through Disaster Risk Reduction and Management. In Proceedings of the Asia Pacific Ministerial Conference on Disaster Risk Reduction (APMCDRR), Brisbane, Australia, 19–22 September 2022; Available online: https://www.preventionweb.net/quick/74205 (accessed on 22 April 2023).
  2. Climate Change Knowledge Portal. Available online: https://climateknowledgeportal.worldbank.org/country/nepal/vulnerability (accessed on 1 November 2021).
  3. UNDRR. Disaster Risk Reduction in Nepal; United Nations Office for Disaster Risk Reduction (UNDRR), Regional Office for Asia and the Pacific: Bangkok, Thailand, 2019. [Google Scholar]
  4. Tripathi, P.; Shrestha, M.; Kumar Shah, D.; Shakya, K. Using Earth Observation and Geospatial Applications for Disaster Preparedness—Training Manual; International Centre for Integrated Mountain Development: Kathmandu, Nepal, 2023. [Google Scholar] [CrossRef]
  5. Palash, W.; Bajracharya, S.R.; Shrestha, A.B.; Wahid, S.; Hossain, M.S.; Mogumder, T.K.; Mazumder, L.C. Climate Change Impacts on the Hydrology of the Brahmaputra River Basin. Climate 2023, 11, 18. [Google Scholar] [CrossRef]
  6. Adhikari, B.R. Flooding and Inundation in Nepal Terai: Issues and Concerns. Hydro Nepal J. Water Energy Environ. 2013, 12, 59–65. [Google Scholar] [CrossRef] [Green Version]
  7. Dewan, T.H. Societal Impacts and Vulnerability to Floods in Bangladesh and Nepal. Weather Clim. Extrem. 2015, 7, 36–42. [Google Scholar] [CrossRef] [Green Version]
  8. Shrestha, M.S.; Gurung, M.B.; Khadgi, V.R.; Wagle, N.; Banarjee, S.; Sherchan, U.; Parajuli, B.; Mishra, A. The Last Mile: Flood Risk Communication for Better Preparedness in Nepal. Int. J. Disaster Risk Reduct. 2021, 56, 102118. [Google Scholar] [CrossRef]
  9. Shrestha, M.S.; Artan, G.A.; Bajracharya, S.R.; Sharma, R.R. Using Satellite-Based Rainfall Estimates for Streamflow Modelling: Bagmati Basin. J. Flood Risk Manag. 2008, 1, 89–99. [Google Scholar] [CrossRef]
  10. Dhital, Y.P.; Kayastha, R.B. Frequency Analysis, Causes and Impacts of Flooding in the Bagmati River Basin, Nepal. J. Flood Risk Manag. 2013, 6, 253–260. [Google Scholar] [CrossRef]
  11. EM-DAT. The International Disasters Database. Available online: https://www.emdat.be/ (accessed on 7 February 2023).
  12. Chandrappa, R.; Gupta, S.; Kulshrestha, U.C. Hazard and Risk Assessment. In Coping with Climate Change; Springer: Berlin/Heidelberg, Germany, 2011; pp. 201–212. [Google Scholar]
  13. Gebre SL, G.Y. Flood Hazard Assessment and Mapping of Flood Inundation Area of the Awash River Basin in Ethiopia Using GIS and HEC-GeoRAS/HEC-RAS Model. J. Civ. Environ. Eng. 2015, 5, 1. [Google Scholar] [CrossRef]
  14. Danumah, J.H.; Odai, S.N.; Saley, B.M.; Szarzynski, J.; Thiel, M.; Kwaku, A.; Kouame, F.K.; Akpa, L.Y. Flood Risk Assessment and Mapping in Abidjan District Using Multi-Criteria Analysis (AHP) Model and Geoinformation Techniques, (Cote d’ivoire). Geoenviron. Disasters 2016, 3, 10. [Google Scholar] [CrossRef] [Green Version]
  15. Ali, K.; Bajracharya, R.M.; Koirala, H.L. A Review of Flood Risk Assessment. Int. J. Environ. Agric. Biotechnol. 2016, 1, 1065–1077. [Google Scholar] [CrossRef]
  16. Aryal, D.; Wang, L.; Adhikari, T.R.; Zhou, J.; Li, X.; Shrestha, M.; Wang, Y.; Chen, D. A Model-Based Flood Hazard Mapping on the Southern Slope of Himalaya. Water 2020, 12, 540. [Google Scholar] [CrossRef] [Green Version]
  17. Vojtek, M.; Vojteková, J.; Costache, R.; Pham, Q.B.; Lee, S.; Arshad, A.; Sahoo, S.; Linh, N.T.T.; Anh, D.T. Comparison of Multi-Criteria-Analytical Hierarchy Process and Machine Learning-Boosted Tree Models for Regional Flood Susceptibility Mapping: A Case Study from Slovakia. Geomat. Nat. Hazards Risk 2021, 12, 1153–1180. [Google Scholar] [CrossRef]
  18. Rincón, D.; Khan, U.T.; Armenakis, C. Flood Risk Mapping Using GIS and Multi-Criteria Analysis: A Greater Toronto Area Case Study. Geosciences 2018, 8, 275. [Google Scholar] [CrossRef] [Green Version]
  19. Vojtek, M.; Vojteková, J. Flood Susceptibility Mapping on a National Scale in Slovakia Using the Analytical Hierarchy Process. Water 2019, 11, 364. [Google Scholar] [CrossRef] [Green Version]
  20. Saaty, R.W. The Analytic Hierarchy Process—What It Is and How It Is Used. Math. Model. 1987, 9, 161–176. [Google Scholar] [CrossRef] [Green Version]
  21. Gacu, J.G.; Monjardin, C.E.F.; Senoro, D.B.; Tan, F.J. Flood Risk Assessment Using GIS-Based Analytical Hierarchy Process in the Municipality of Odiongan, Romblon, Philippines. Appl. Sci. 2022, 12, 9456. [Google Scholar] [CrossRef]
  22. Elsheikh, R.F.A.; Ouerghi, S.; Elhag, A.R. Flood Risk Map Based on GIS, and Multi Criteria Techniques (Case Study Terengganu Malaysia). J. Geogr. Inf. Syst. 2015, 7, 348–357. [Google Scholar] [CrossRef] [Green Version]
  23. Ouma, Y.O.; Tateishi, R. Urban Flood Vulnerability and Risk Mapping Using Integrated Multi-Parametric AHP and GIS: Methodological Overview and Case Study Assessment. Water 2014, 6, 1515–1545. [Google Scholar] [CrossRef] [Green Version]
  24. Hammami, S.; Zouhri, L.; Souissi, D.; Souei, A.; Zghibi, A.; Marzougui, A.; Dlala, M. Application of the GIS Based Multi-Criteria Decision Analysis and Analytical Hierarchy Process (AHP) in the Flood Susceptibility Mapping (Tunisia). Arab. J. Geosci. 2019, 12, 653. [Google Scholar] [CrossRef]
  25. Swain, K.C.; Singha, C.; Nayak, L. Flood Susceptibility Mapping through the GIS-AHP Technique Using the Cloud. ISPRS Int. J. Geo-Inf. 2020, 9, 720. [Google Scholar] [CrossRef]
  26. Dano, U.; Balogun, A.-L.; Matori, A.-N.; Wan Yusouf, K.; Abubakar, I.; Said Mohamed, M.; Aina, Y.; Pradhan, B. Flood Susceptibility Mapping Using GIS-Based Analytic Network Process: A Case Study of Perlis, Malaysia. Water 2019, 11, 615. [Google Scholar] [CrossRef] [Green Version]
  27. Khosravi, K.; Nohani, E.; Maroufinia, E.; Pourghasemi, H.R. A GIS-Based Flood Susceptibility Assessment and Its Mapping in Iran: A Comparison between Frequency Ratio and Weights-of-Evidence Bivariate Statistical Models with Multi-Criteria Decision-Making Technique. Nat. Hazards 2016, 83, 947–987. [Google Scholar] [CrossRef]
  28. Siahkamari, S.; Haghizadeh, A.; Zeinivand, H.; Tahmasebipour, N.; Rahmati, O. Spatial Prediction of Flood-Susceptible Areas Using Frequency Ratio and Maximum Entropy Models. Geocarto Int. 2018, 33, 927–941. [Google Scholar] [CrossRef]
  29. Lin, J.; He, P.; Yang, L.; He, X.; Lu, S.; Liu, D. Predicting Future Urban Waterlogging-Prone Areas by Coupling the Maximum Entropy and FLUS Model. Sustain. Cities Soc. 2022, 80, 103812. [Google Scholar] [CrossRef]
  30. Lim, H.; Lim, M.B.; Piantanakulchai, M. A Review of Recent Studies on Flood Evacuation Planning. J. East. Asia Soc. Transp. Stud. 2013, 10, 147–162. [Google Scholar] [CrossRef]
  31. No, W.; Choi, J.; Park, S.; Lee, D. Balancing Hazard Exposure and Walking Distance in Evacuation Route Planning during Earthquake Disasters. ISPRS Int. J. Geo-Inf. 2020, 9, 432. [Google Scholar] [CrossRef]
  32. Yang, Q.; Sun, Y.; Liu, X.; Wang, J. MAS-Based Evacuation Simulation of an Urban Community during an Urban Rainstorm Disaster in China. Sustainability 2020, 12, 546. [Google Scholar] [CrossRef] [Green Version]
  33. Stepanov, A.; Smith, J.M. Multi-Objective Evacuation Routing in Transportation Networks. Eur. J. Oper. Res. 2009, 198, 435–446. [Google Scholar] [CrossRef]
  34. Campos, V.; Bandeira, R.; Bandeira, A. A Method for Evacuation Route Planning in Disaster Situations. Procedia-Soc. Behav. Sci. 2012, 54, 503–512. [Google Scholar] [CrossRef] [Green Version]
  35. Wood, N.J.; Schmidtlein, M.C. Anisotropic Path Modeling to Assess Pedestrian- Evacuation Potential from Cascadia-Related Tsunamis in the US Pacific Northwest. Nat. Hazards 2012, 62, 275–300. [Google Scholar] [CrossRef] [Green Version]
  36. Dijkstra, E.W. A Note on Two Problems in Connexion with Graphs. Numer. Math. 1959, 1, 269–271. [Google Scholar] [CrossRef] [Green Version]
  37. Chen, P.; Chen, G.; Wang, L.; Reniers, G. Optimizing Emergency Rescue and Evacuation Planning with Intelligent Obstacle Avoidance in a Chemical Industrial Park. J. Loss Prev. Process Ind. 2018, 56, 119–127. [Google Scholar] [CrossRef]
  38. Yang, Q.; Zhang, X.; Zhang, Z.; He, L.; Yan, X.; Na, J. Fire Scenario Zone Construction and Personnel Evacuation Planning Based on a Building Information Model and Geographical Information System. ISPRS Int. J. Geo-Inf. 2022, 11, 110. [Google Scholar] [CrossRef]
  39. L Shen, Y.; Wang, Q.; Yan, W.; Wang, J. A transportation-location problem model for pedestrian evacuation in chemical industrial parks disasters. J. Loss Prev. Process Ind. 2015, 33, 29–38. [Google Scholar] [CrossRef]
  40. Li, J.J.; Zhu, H.Y. A Risk-Based Model of Evacuation Route Optimization under Fire. Procedia Eng. 2018, 211, 365–371. [Google Scholar] [CrossRef]
  41. Rijal, S.; Rimal, B.; Sloan, S. Flood Hazard Mapping of a Rapidly Urbanizing City in the Foothills (Birendranagar, Surkhet) of Nepal. Land 2018, 7, 60. [Google Scholar] [CrossRef] [Green Version]
  42. Basnet, K.; Acharya, D. Flood Analysis at Ramghat, Pokhara, Nepal Using HEC-RAS. Tech. J. 2019, 1, 41–53. [Google Scholar] [CrossRef]
  43. Samir, K.C. Community Vulnerability to Floods and Landslides in Nepal. Ecol. Soc. 2013, 18, art8. [Google Scholar] [CrossRef] [Green Version]
  44. Devkota, R.P.; Maraseni, T.N.; Cockfield, G.; Devkota, L.P. Earth Science & Climatic Change Flood Vulnerability through the Eyes of Vulnerable People in Mid-Western Terai of Nepal. J. Earth Sci. Climactic Chang. 2013, 4, 1–7. [Google Scholar] [CrossRef] [Green Version]
  45. Thapa, S.; Shrestha, A.; Lamichhane, S.; Adhikari, R.; Gautam, D. Catchment-Scale Flood Hazard Mapping and Flood Vulnerability Analysis of Residential Buildings: The Case of Khando River in Eastern Nepal. J. Hydrol. Reg. Stud. 2020, 30, 100704. [Google Scholar] [CrossRef]
  46. Smith, P.J.; Brown, S.; Dugar, S. Community-Based Early Warning Systems for Flood Risk Mitigation in Nepal. Nat. Hazards Earth Syst. Sci. 2017, 17, 423–437. [Google Scholar] [CrossRef] [Green Version]
  47. Centre for Disaster Management Studies (CDMS). Report on Assessment of Gender Sensitive Emergency Response of Flood Affected Area in Mahottari and Siraha Districts, Nepal Centre for Disaster Management Studies (CDMS) CARE Nepal. 20 July 2023. [Google Scholar]
  48. NRCS. Pre-Crisis Market Assessment in Siraha district; Nepal Red Cross Society: Kathmandu, Nepal, 2019; Available online: https://cash-hub.org/resource/pre-crisis-market-assessment-in-siraha-district (accessed on 22 April 2023).
  49. National Statistics Office. National Population and Housing Census 2021; National Statistics Office: Kathmandu, Nepal, 2023; Volume 39. [Google Scholar]
  50. Shreevastav, B.B.; Tiwari, K.R.; Mandal, R.A.; Singh, B. “Flood Risk Modeling in Southern Bagmati Corridor, Nepal” (a Study from Sarlahi and Rautahat, Nepal). Prog. Disaster Sci. 2022, 16, 100260. [Google Scholar] [CrossRef]
  51. Seejata, K.; Yodying, A.; Wongthadam, T.; Mahavik, N.; Tantanee, S. Assessment of Flood Hazard Areas Using Analytical Hierarchy Process over the Lower Yom Basin, Sukhothai Province. Procedia Eng. 2018, 212, 340–347. [Google Scholar] [CrossRef]
  52. Liu, J.; Xu, Z.; Chen, F.; Chen, F.; Zhang, L. Flood Hazard Mapping and Assessment on the Angkor World Heritage Site, Cambodia. Remote Sens. 2019, 11, 98. [Google Scholar] [CrossRef] [Green Version]
  53. Surabaya, C.S.; Java, E. Urban Flood Risk Mapping Using Analytic Hierarchy Process and Natural Break Classification. In Proceedings of the 2016 International Conference on Knowledge Creation and Intelligent Computing (KCIC), Manado, Indonesia, 15–17 November 2016; pp. 148–154. [Google Scholar]
  54. Chen, J.; Yang, S.T.; Li, H.W.; Zhang, B.; Lv, J.R. Research on Geographical Environment Unit Division Based on the Method of Natural Breaks (Jenks). Int. Arch. Photogramm. Remote Sens. Spat. Inf. Sci. 2013, XL-4/W3, 47–50. [Google Scholar] [CrossRef] [Green Version]
  55. Beven, K.J.; Kirkby, M.J. A Physically Based, Variable Contributing Area Model of Basin Hydrology/Un Modèle à Base Physique de Zone d’appel Variable de l’hydrologie Du Bassin Versant. Hydrol. Sci. Bull. 1979, 24, 43–69. [Google Scholar] [CrossRef] [Green Version]
  56. Vilasan, R.; Kapse, V. Evaluation of the Prediction Capability of AHP and F-AHP Methods in Flood Susceptibility Mapping of Ernakulam District (India). Nat. Hazards 2021, 112, 1767–1793. [Google Scholar] [CrossRef]
  57. Qin, C.-Z.; Zhu, A.-X.; Pei, T.; Li, B.-L.; Scholten, T.; Behrens, T.; Zhou, C.-H. An Approach to Computing Topographic Wetness Index Based on Maximum Downslope Gradient. Precis. Agric. 2011, 12, 32–43. [Google Scholar] [CrossRef]
  58. Dahri, N.; Abida, H. Monte Carlo Simulation-Aided Analytical Hierarchy Process (AHP) for Flood Susceptibility Mapping in Gabes Basin (Southeastern Tunisia). Environ. Earth Sci. 2017, 76, 302. [Google Scholar] [CrossRef]
  59. Zehra, S.; Afsar, S. Flood Hazard Mapping of Lower Indus Basin Using Multi-Criteria Analysis. J. Geosci. Environ. Prot. 2016, 4, 54–62. [Google Scholar] [CrossRef] [Green Version]
  60. Youssef, A.M.; Pradhan, B.; Hassan, A.M. Flash Flood Risk Estimation along the St. Katherine Road, Southern Sinai, Egypt Using GIS Based Morphometry and Satellite Imagery. Environ. Earth Sci. 2011, 62, 611–623. [Google Scholar] [CrossRef]
  61. Msabi, M.M.; Makonyo, M. Flood Susceptibility Mapping Using GIS and Multi-Criteria Decision Analysis: A Case of Dodoma Region, Central Tanzania. Remote Sens. Appl. Soc. Environ. 2021, 21, 100445. [Google Scholar] [CrossRef]
  62. Nsangou, D.; Kpoumié, A.; Mfonka, Z.; Ngouh, A.N.; Fossi, D.H.; Jourdan, C.; Mbele, H.Z.; Mouncherou, O.F.; Vandervaere, J.P.; Ndam Ngoupayou, J.R. Urban Flood Susceptibility Modelling Using AHP and GIS Approach: Case of the Mfoundi Watershed at Yaoundé in the South-Cameroon Plateau. Sci. African 2022, 15, e01043. [Google Scholar] [CrossRef]
  63. Samanta, S.; Koloa, C.; Pal, D.K.; Palsamanta, B. Flood Risk Analysis in Lower Part of Markham River Based on Multi-Criteria Decision Approach (MCDA). Hydrology 2016, 3, 29. [Google Scholar] [CrossRef] [Green Version]
  64. Ajin, R.S.; Krishnamurthy, R.R.; Jayaprakash, M.; Vinod, P.G. Flood Hazard Assessment of Vamanapuram River Basin, Kerala, India: An Approach Using Remote Sensing and GIS Techniques. Adv. Appl. Sci. Res. 2013, 4, 263–274. [Google Scholar]
  65. Elkhrachy, I. Flash Flood Hazard Mapping Using Satellite Images and GIS Tools: A Case Study of Najran City, Kingdom of Saudi Arabia (KSA). Egypt. J. Remote Sens. Sp. Sci. 2015, 18, 261–278. [Google Scholar] [CrossRef] [Green Version]
  66. Siddayao, G.P.; Valdez, S.E.; Fernandez, P.L. Analytic Hierarchy Process (AHP) in Spatial Modeling for Floodplain Risk Assessment. Int. J. Mach. Learn. Comput. 2014, 4, 450–457. [Google Scholar] [CrossRef]
  67. Yu, J.; Zhang, C.; Wen, J.; Li, W.; Liu, R.; Xu, H. Integrating Multi-Agent Evacuation Simulation and Multi-Criteria Evaluation for Spatial Allocation of Urban Emergency Shelters. Int. J. Geogr. Inf. Sci. 2018, 32, 1884–1910. [Google Scholar] [CrossRef]
  68. Park, S.; Lee, G.; Kim, J.O. Flood Evacuation Mapping Using a Time-Distance Cartogram. ISPRS Int. J. Geo-Inf. 2020, 9, 207. [Google Scholar] [CrossRef] [Green Version]
  69. Zhu, Y.; Li, H.; Wang, Z.; Li, Q.; Dou, Z.; Xie, W.; Zhang, Z.; Wang, R.; Nie, W. Optimal Evacuation Route Planning of Urban Personnel at Different Risk Levels of Flood Disasters Based on the Improved 3D Dijkstra’s Algorithm. Sustainability 2022, 14, 10250. [Google Scholar] [CrossRef]
  70. Jamrussri, S.; Toda, Y. Available Flood Evacuation Time for High-Risk Areas in the Middle Reach of Chao Phraya River Basin. Water 2018, 10, 1871. [Google Scholar] [CrossRef] [Green Version]
  71. Bonilauri, E.M.; Harris, A.J.L.; Morin, J.; Ripepe, M.; Mangione, D.; Lacanna, G.; Ciolli, S.; Cusolito, M.; Deguy, P. Tsunami Evacuation Times and Routes to Safe Zones: A GIS-Based Approach to Tsunami Evacuation Planning on the Island of Stromboli, Italy. J. Appl. Volcanol. 2021, 10, 4. [Google Scholar] [CrossRef]
  72. González-Riancho, P.; Aguirre-Ayerbe, I.; Aniel-Quiroga, I.; Abad, S.; González, M.; Larreynaga, J.; Gavidia, F.; Gutiérrez, O.Q.; Álvarez-Gómez, J.A.; Medina, R. Tsunami Evacuation Modelling as a Tool for Risk Reduction: Application to the Coastal Area of El Salvador. Nat. Hazards Earth Syst. Sci. 2013, 13, 3249–3270. [Google Scholar] [CrossRef] [Green Version]
  73. Dewi, R.S. A-Gis Based Approach of an Evacuation Model for Tsunami Risk Reduction. J. Integr. Disaster Risk Manag. 2012, 2, 108–139. [Google Scholar] [CrossRef] [Green Version]
  74. Yosritzal; Kemal, B.M.; Purnawan; Putra, H. An Observation of the Walking Speed of Evacuees during a Simulated Tsunami Evacuation in Padang, Indonesia. IOP Conf. Ser. Earth Environ. Sci. 2018, 140, 012090. [Google Scholar] [CrossRef]
  75. Lee, H.K.; Hong, W.H.; Lee, Y.H. Experimental Study on the Influence of Water Depth on the Evacuation Speed of Elderly People in Flood Conditions. Int. J. Disaster Risk Reduct. 2019, 39, 101198. [Google Scholar] [CrossRef]
  76. Lee, Y.H.; Kim, H.I.; Han, K.Y.; Hong, W.H. Flood Evacuation Routes Based on Spatiotemporal Inundation Risk Assessment. Water 2020, 12, 2271. [Google Scholar] [CrossRef]
  77. MoHA (The Government of Nepal—Ministry of Home Affairs) Nepal Disaster Risk Reduction Portal. Available online: http://drrportal.gov.np/ (accessed on 16 June 2023).
  78. Alahacoon, N.; Matheswaran, K.; Pani, P.; Amarnath, G. A Decadal Historical Satellite Data and Rainfall Trend Analysis (2001–2016) for Flood Hazard Mapping in Sri Lanka. Remote Sens. 2018, 10, 448. [Google Scholar] [CrossRef] [Green Version]
  79. Negese, A.; Worku, D.; Shitaye, A.; Getnet, H. Potential Flood-Prone Area Identification and Mapping Using GIS-Based Multi-Criteria Decision-Making and Analytical Hierarchy Process in Dega Damot District, Northwestern Ethiopia. Appl. Water Sci. 2022, 12, 255. [Google Scholar] [CrossRef]
  80. Tehrany, M.S.; Lee, M.J.; Pradhan, B.; Jebur, M.N.; Lee, S. Flood Susceptibility Mapping Using Integrated Bivariate and Multivariate Statistical Models. Environ. Earth Sci. 2014, 72, 4001–4015. [Google Scholar] [CrossRef]
  81. Watik, N.; Jaelani, L.M. Flood Evacuation Routes Mapping Based on Derived- Flood Impact Analysis from Landsat 8 Imagery Using Network Analyst Method. Int. Arch. Photogramm. Remote Sens. Spat. Inf. Sci. 2019, XLII-3/W8, 455–460. [Google Scholar] [CrossRef] [Green Version]
  82. Musolino, G.; Ahmadian, R.; Xia, J. Enhancing Pedestrian Evacuation Routes during Flood Events. Nat. Hazards 2022, 112, 1941–1965. [Google Scholar] [CrossRef]
Figure 1. The workflow of the flood susceptibility and evacuation route mapping adopted in the study.
Ijgi 12 00286 g001
Figure 2. Location map of the study area: Siraha Municipality with OpenStreetMap base map.
Ijgi 12 00286 g002
Figure 3. Annual rainfall of Siraha and Lahan station.
Ijgi 12 00286 g003
Figure 4. Flood conditioning factors: (a) elevation; (b) slope; (c) Topographic Wetness Index; (d) land use/land cover; (e) Normalized Difference Vegetation Index; (f) precipitation; (g) drainage density; (h) distance from the river; and (i) distance from the road.
Ijgi 12 00286 g004aIjgi 12 00286 g004b
Figure 5. Flood susceptibility map of the study area: Siraha Municipality.
Ijgi 12 00286 g005
Figure 6. Closest Facility: (a) shortest time; (b) shortest distance.
Ijgi 12 00286 g006
Figure 7. Service area analysis based on: (a) time; (b) distance.
Ijgi 12 00286 g007
Figure 8. (a) Water bodies before flood; (b) inundated area after flood.
Ijgi 12 00286 g008
Table 1. Description of data sources used in this study.
S. No.Data TypeDescriptionDate of AcquisitionSource
1DEMALOS PALSER (12.5 m)18 January 2009Alaska Satellite Facility Distributed Active Archive Center (https://search.asf.alaska.edu/)
2Satellite ImageSENTINEL-2A (10 m)29 September 2022Copernicus Open Access Hub (https://scihub.copernicus.eu/dhus/)
3Precipitation (mm/day)24-h interval, Government of Nepal, Department of Hydrology and Meteorology, Climate Data and Network sectionFrom 2000 to 2020Government of Nepal, Department of Hydrology and Meteorology (https://www.dhm.gov.np/meteorology-forecast/3)
4Road NetworkRoad Network in Siraha Municipality23 March 2023OpenStreetMap (https://www.openstreetmap.org/#map=13/26.6407/86.1987)
5River NetworkRiver Network in Siraha Municipality23 March 2022
6Assembly PointStarting point of evacuation28 March 2022Digitization in OpenStreetMap using Maxar Premium Satellite Imagery.
7Shelter PointSafest point after evacuation28 March 2022
Table 2. Flood susceptibility criteria and subcriteria range for flood susceptibility assessment.
Causative FactorUnitRangeClassRatingsWeight (%)
Topographic Wetness Index (TWI)Level3.47–7.39Very Low19
7.39–9.76Low2
9.76–11.61Moderate3
11.61–14.35High4
14.35–22.34Very High5
Elevationm64–78Very High511
78–82High4
82–86Moderate3
86–91Low2
91–101Very Low1
Slope%0–2Very High508
2.1–5High4
5.1–15Moderate3
15.1–35Low2
35.1–57.2Very Low1
Precipitationmm/year1312.79–1322.26Very Low118
1322.26–1327.04Low2
1327.04–1331.65Moderate3
1331.65–1334.99High4
1334.99–1336.80Very High5
LULCLevelWaterbodyVery High57
Agriculture LandHigh4
SettlementModerate3
Barren LandLow2
VegetationVery Low1
NDVILevel−0.16–0.08Very High56
0.08–0.24High4
0.24–0.34Moderate3
0.34–0.42Low2
0.42–0.66Very Low1
Distance from riverm0–965.33Very High522
965.33–2068.57High4
2068.57–3309.71Moderate3
3309.71–4716.34Low2
4716.34–7033.14Very Low1
Distance from roadm0–76.62Very High54
76.62–175.13High4
175.13–295.53Moderate3
295.53–445.12Low2
445.12–930.38Very Low1
Drainage densitym/km0–2.17Very Low115
2.17–4.56Low2
4.56–7.16Moderate3
7.16–10.33High4
10.33–17.2Very High5
Sum 100
Table 3. Saaty’s 1–9 scale for Analytical Hierarchy Process [20].
ScaleImportanceReciprocal
1Equal importance1
3Moderately importance1/3
5Essential or strong importance1/5
7Very strong importance1/7
9Extreme importance1/9
2, 4, 6, 8Intermediate values between the two factors1/2, 1/4, 1/6, 1/8
Table 4. Pair-wise comparison matrix.
FactorsELSLPPDRIDDTWILULCSTDRI
EL121/31/311223
SL1/211/21/32/32121
PP3211/213335
DRI332113335
DD11 1/21113241
TWI11/21/31/31/31118
LULC1/211/31/31/21113
NDVI1/21/21/31/31/41113
DRO1/311/51/511/81/31/31
Sum10.8312.506.034.376.7515.1314.3317.3330.00
Table 5. Normalized pair-wise comparison matrix.
FactorsELSLPPDRIDDTWILULCSTDRISumCriteria WeightsCriteria Weights (%)
EL0.0920.1600.0550.0760.1480.0660.1400.1150.1000.9530.10611
SL0.0460.0800.0830.0760.0990.1320.0700.1150.0330.7350.0828
PP0.2770.1600.1660.1150.1480.1980.2090.1730.1671.6130.17918
DRI0.2770.2400.3310.2290.1480.1980.2090.1730.1671.9730.21922
DD0.0920.1200.1660.2290.1480.1980.1400.2310.0331.3570.15115
TWI0.0920.0400.0550.0760.0490.0660.0700.0580.2670.7740.0869
LULC0.0460.0800.0550.0760.0740.0660.0700.0580.1000.6250.0697
NDVI0.0460.0400.0550.0760.0370.0660.0700.0580.1000.5480.0616
DRO0.0310.0800.0330.0460.1480.0080.0230.0190.0330.4220.0474
Sum 101100
Table 6. Random Inconsistency Indices for n = 1, 2…10.
n12345678910
RI000.580.901.121.241.321.411.451.49
If CR ≤ 0.1 or CR ≤ 10%, the matrix is consistent and if it exceeds 10%, a revision is required [62].
Table 7. Walking speed of different age groups during evacuation [74].
Age Group≤1020–40>60
Walking speed (m/s)1.3491.5051.402
Table 8. Evacuation speed correction based on slope.
Slope0–33–66–99–1212–1515–1818–21
Speed value100%85%70%55%45%40%35%
Table 9. Flood susceptibility area coverage and percentage.
Flood SusceptibilityArea (km2)Area (%)
Very low1.1201.18
Low9.88910.49
Medium37.35339.65
High44.08946.80
Very High1.6451.87
Total94.2100
Disclaimer/Publisher’s Note: The statements, opinions and data contained in all publications are solely those of the individual author(s) and contributor(s) and not of MDPI and/or the editor(s). MDPI and/or the editor(s) disclaim responsibility for any injury to people or property resulting from any ideas, methods, instructions or products referred to in the content.

