1. Introduction
The First Military Survey of the Habsburg Empire was conducted between 1763 and 1786, during the reign of Empress Maria Theresa and her son Emperor Joseph II [
1,
2]. The survey covered the Habsburg lands of the time, Austria (excluding Vorarlberg, Tyrol and Salzburg), historical Hungary and Transylvania, western Galicia, present-day Croatia and Slovenia, and included the border areas of the Romanian principalities, loosely connected to the Empire (
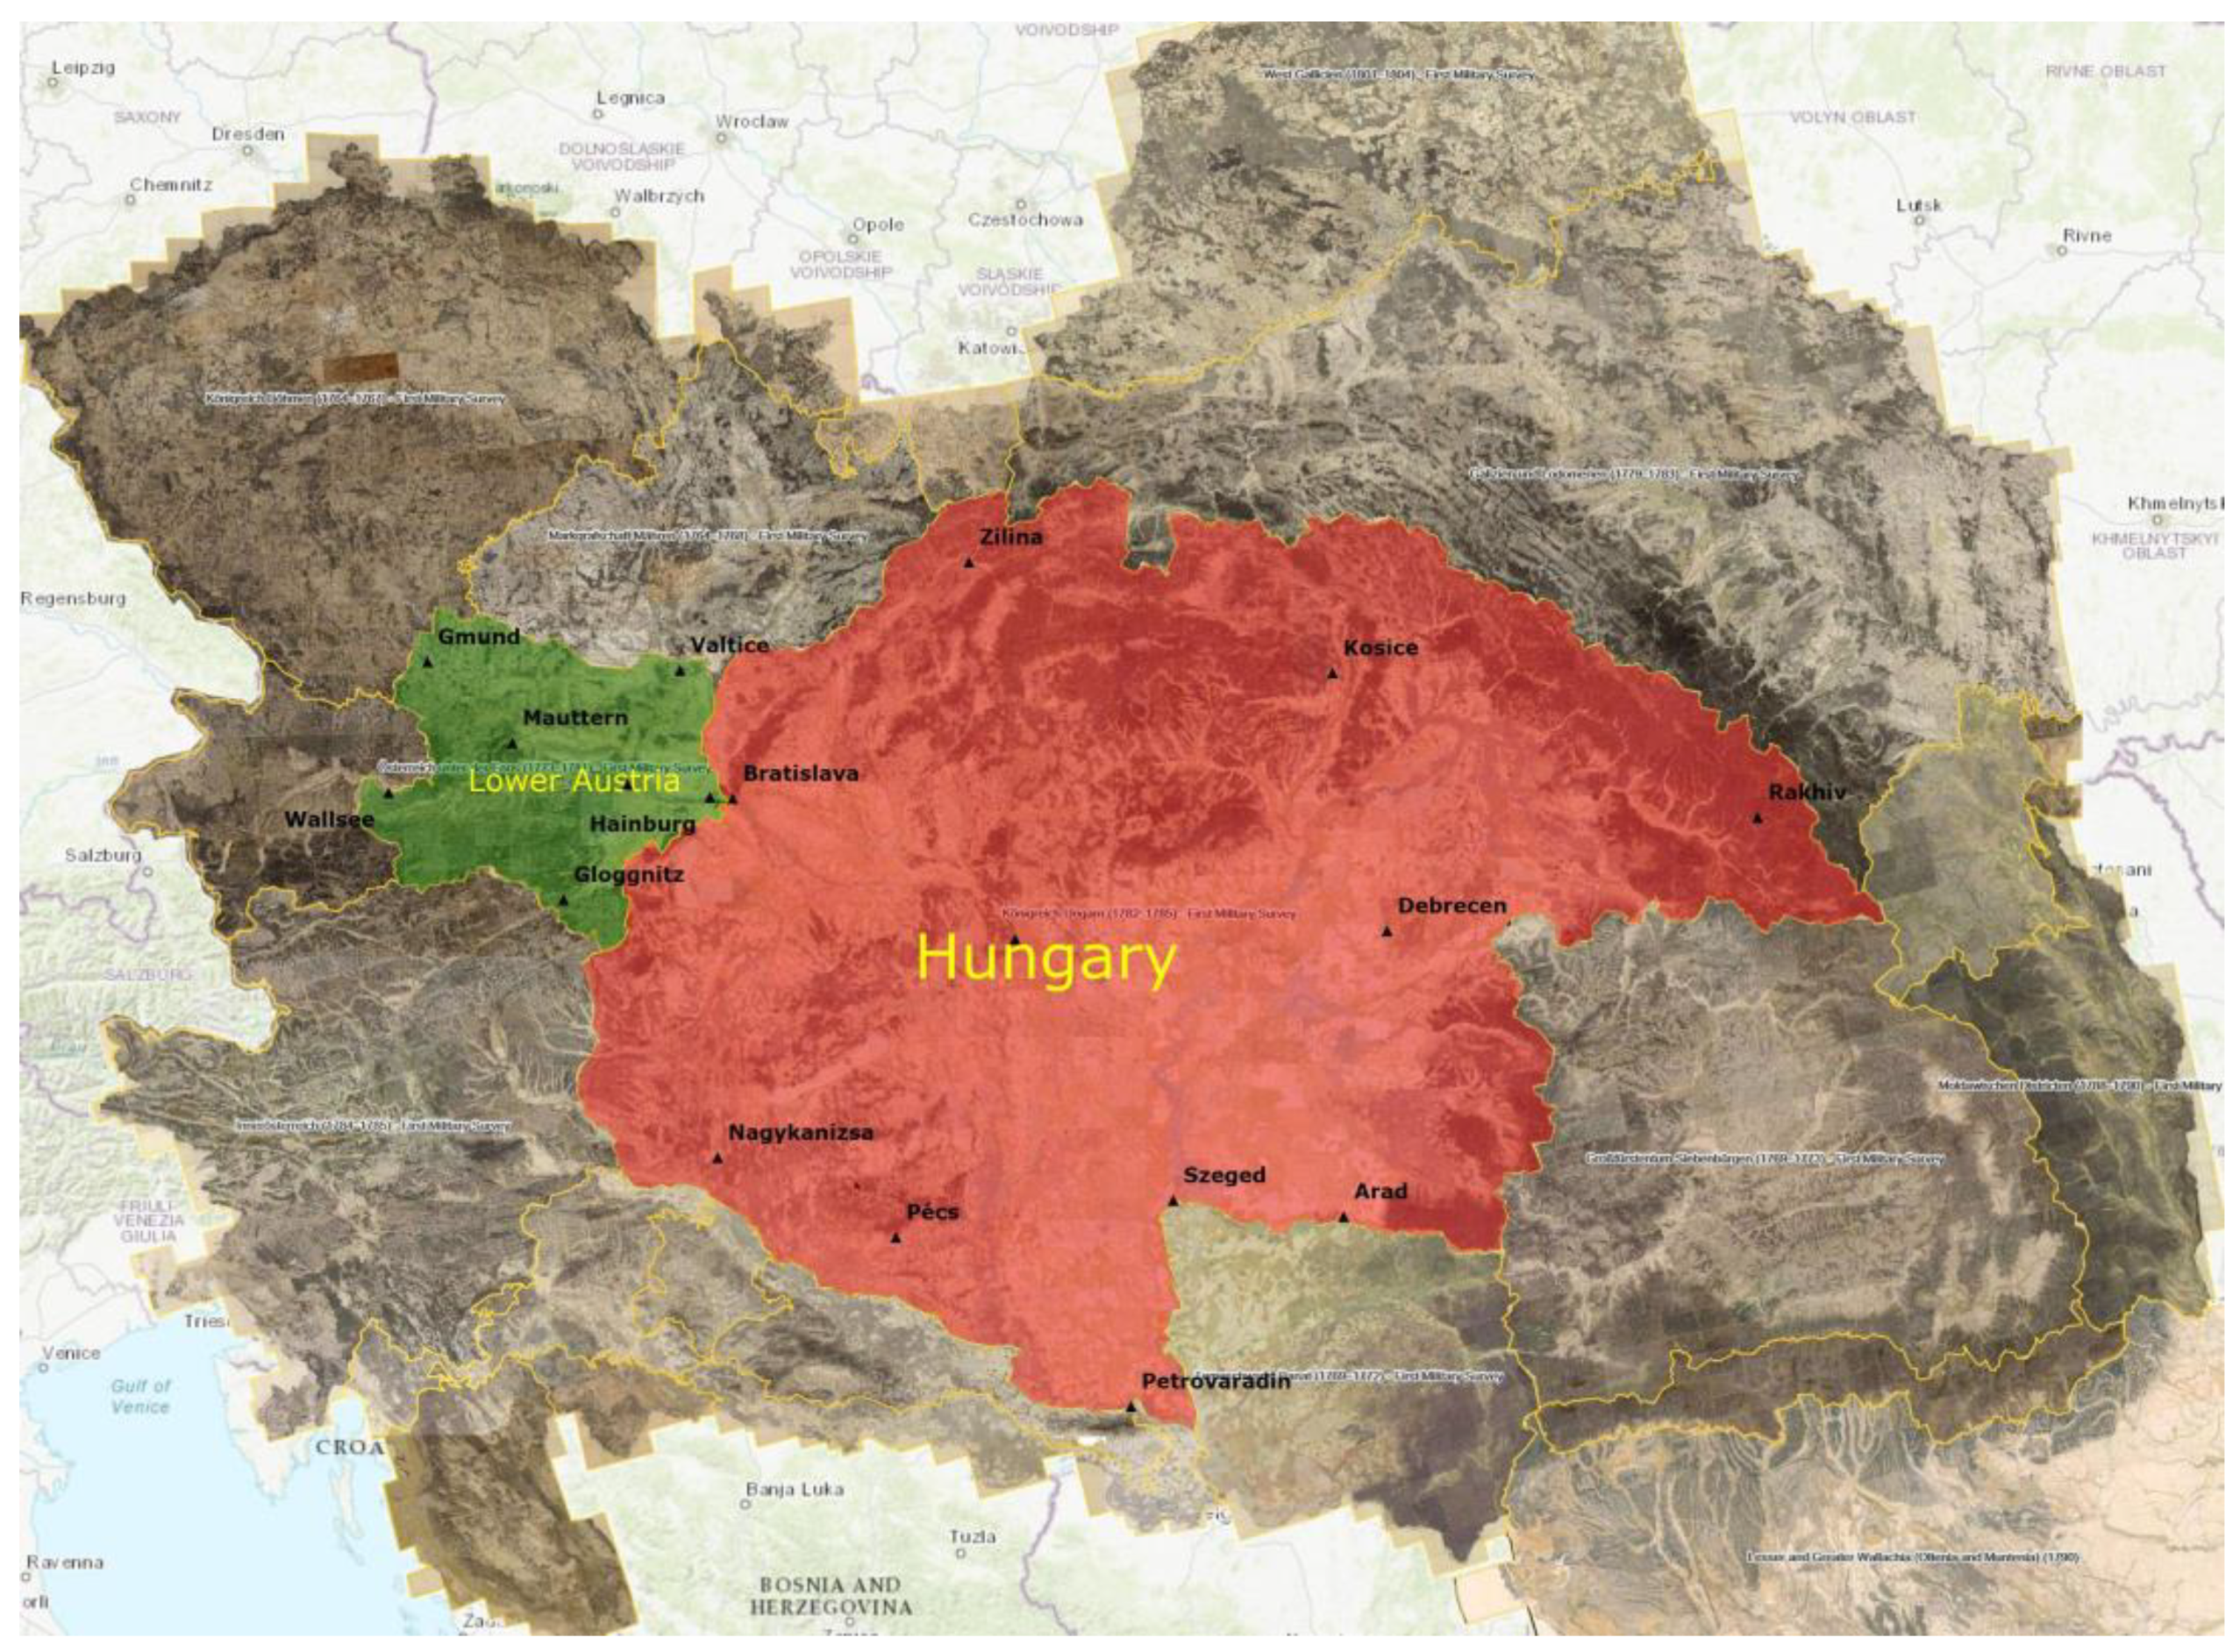
Figure 1). The survey was produced at a uniform scale of 1:28,800. The area covered by the survey sections was uniformly 9600 × 6400 Vienna fathoms (18,207 × 12,135 m). The section network was, however, not uniformly oriented over the mapped area. In general, the coordinate systems stretched by the sections had a different orientation. It is interesting to note that two different orientation methods were basically used: besides the Hungarian and Lower Austrian sections discussed in this paper, the maps of Upper Austria and the Czech lands are oriented to the geographic north, while the other section mosaics are oriented 13–16 degrees west of the north, presumably to the magnetic north of the time.
The First Military Survey, however, was not the first survey of its kind in Europe. The technology used was developed by French surveying and was used to produce the large 1:86,400 scale map of France. The map work by César-François Cassini de Thury (1714–1784) consisted of a number of sections drawn in a common coordinate system, thus guaranteeing an accurate fit on the boundaries. A triangulation network of hundreds of points covering the whole of France was developed to produce the map [
3]. Cassini later extended this network along the Rhine and Danube rivers to central Germany, Bavaria and Austria [
4]. Triangulation technology was also being used on German soil at this time, with several surveys based on the triangulation method used by Christian Mayer (1719–1783), Johann Heinrich Haas (1758–1810) and others. In both Austria and Germany, the Napoleonic Wars gave rise to major developments in surveying [
5].
The georeferencing of the thousands of sections of the entire survey, i.e., the fitting of the entire survey to today’s map coordinate systems, was carried out within the MAPIRE project [
6,
7], and the results are available free of charge on the project’s website at the time of publication of this article so that the orientation differences described above can be examined by anyone. As the survey was not previously assigned any projection information in the literature and was even considered to be a “projectionless system” [
1], the georeferencing was performed without projection assumptions. In the first step, the sections of the domains with the same section grid were aligned as virtual mosaics. We assigned 50–100 uniformly distributed control points (CGPs) to the mosaics, mainly in cities and on mountaintops, with the addition of landmark points on the boundaries. The GCPs were assigned to UTM zones corresponding to the longitudes using quadratic formulas, and the residual errors were reduced by a correction grid (GSB/NTv2). The result is generally a fit of around 200 m, which could be further refined by densifying the correction grid [
8].
Figure 1.
The area of the First Military Survey with maps of the related border regions. The ground control points (GCPs) used for the analysis are shown both in Lower Austria and Hungary. The georeferenced maps are available free of charge in full resolution on the MAPIRE [
7] portal (
www.mapire.eu (accessed on 21 May 2023)).
However, the maps of the First Military Survey were not only georeferenced as part of the MAPIRE project. In particular, the parts of the survey covering Poland [
9,
10,
11] and the Czech Republic [
12,
13] were examined. The solution directions were partly aimed at the use of higher-degree polynomials [
14,
15], cf. also [
16]. If the matching is done by this method but on a section-by-section basis, attention should also be paid to the application of matching boundary conditions on the section boundaries [
17]. In addition, fitting using the thin-plate spline method [
18] has also been investigated in the Czech lands [
12]. The method presented in this paper is a simpler one, which examines the applicability of the method previously used by the author for georeferencing the Second Military Survey [
19]. The aim of the research is to see if a projection can be found that is valid for the regions covered by the First Military Survey and with which georeferencing can be implemented.
However, the “projectionless” character has been a constant issue throughout our work. We have carried out an investigation to see which meridians in each range would be the best-fitting starting points based on the Cassini projection if the sectional classification were based on the GCP data. No estimate of the latitude of the starting points can be made in the fitting process; the Cassini grid north is invariant to the latitude of the projection centre. The best fit was provided by a longitude value of projection origin of 16.35 degrees from Greenwich in Lower Austria and 19.29 degrees in Hungary [
20]. In the case of Lower Austria, this is likely to be a fit for Vienna; however, there was no obvious landmark in Hungary that could have been an equally obvious starting point.
However, two questions obviously arise in relation to the georeferencing of the survey: if there was no standard geodetic basis, how was it possible to produce a relatively accurate survey of areas as large as the provinces of the Habsburg Empire? It is obvious that the survey is subject to very serious local distortions of hundreds of metres, sometimes even kilometres, compared to today’s cartographic accuracy. Nevertheless, over the whole of the mapped area—about 500 km in Hungary and 100 km in Lower Austria—the errors are roughly uniform. As will be seen, a simple mathematical-geometric model that realises this uniform error distribution can be given for these two zones, and bibliographic-archival evidence for this has been also found. In addition, the second question is as follows: if the map is generally more accurate than its predecessors using previous technology, what causes significantly larger errors locally than is common on later topographic maps?
2. Triangulation Networks before and during the First Military Survey
The above-mentioned uniform mapping accuracy over distances of up to several hundred km was achieved by two methods at the technological level of the time. It could be achieved by astronomical positioning or by triangulation. The astronomical method was, however, very limited by the contemporary method of accurately determining the longitude difference. The local time of the eclipses of Jupiter’s moons could of course be observed and compared with a value calculated for an observatory of known longitude, but this would have been very cumbersome in the field. The technology of the deployed ‘mobile’ observatory was known and used by the Vienna cartography—including in the Hungarian survey described below—but it was not a fast enough method to lay the geodetic foundations for a large area.
Nevertheless, the triangulation technique had been practically implemented by this time. The first large country survey was carried out by César-François Cassini de Thury in France in the first half of the 18th century [
3,
21]. As France and the Habsburg Empire became allies during the Seven Years’ War (1756–1763), scientific relations between the two states were strengthened. The observation of the transit of Venus in 1761 marked the culmination of this relationship-building [
22]. It was on this occasion that Cassini de Thury and the Jesuit Father Joseph Liesganig (1719–1799), two leading scholars in French and Austrian astronomy and surveying, met in Vienna in June 1761 [
23]. However, Cassini also spent the journey to Vienna surveying: he connected the eastern end of the French network, at Strasbourg, with Vienna by means of a triangular chain along the Danube and determined the coordinates of several geographical points in southern Germany and Austria in the Paris geodetic system, in French toise units [
4,
5].
Cassini’s triangulation method was relatively simple. At each survey point, it measured the angles between the directions of adjacent points, with a precision of 10 arc seconds. The excess angles due to the curved base surface were subtracted proportionally from the measured angles to give a sum of 360 degrees. To calculate the coordinates of the points, the astronomical coordinates of a point were needed. In Cassini’s original survey, this was the Paris Observatory, whose latitude was accurately determined, and longitude was taken to be zero. The orientation of the network was determined by measuring the azimuth of a point visible from the observatory. The scaling of the network was provided by the measurement of the length of just one triangle side. From this one measured side, all the other sides and the map coordinates of the basepoints were determined by the cosine theorem of the plane triangulation [
4]. Although Cassini did not define it in formulae, this method was later embodied in the equations of the “Cassini projection”.
He passed this knowledge on to Austrian scientists in a kind of technological transfer, and together they surveyed the Vienna area using this method during Cassini’s extended stay in Vienna [
23,
24]. Paris was no longer the geodetic centre for this survey: using the measurements from the Jesuit observatory in Vienna, a new, Viennese system was applied, transforming it into a kind of ‘outpost’ on the prominent and highly visible Stephansdom (St. Stephen’s Cathedral) tower [
25] (
Figure 2).
Figure 2.
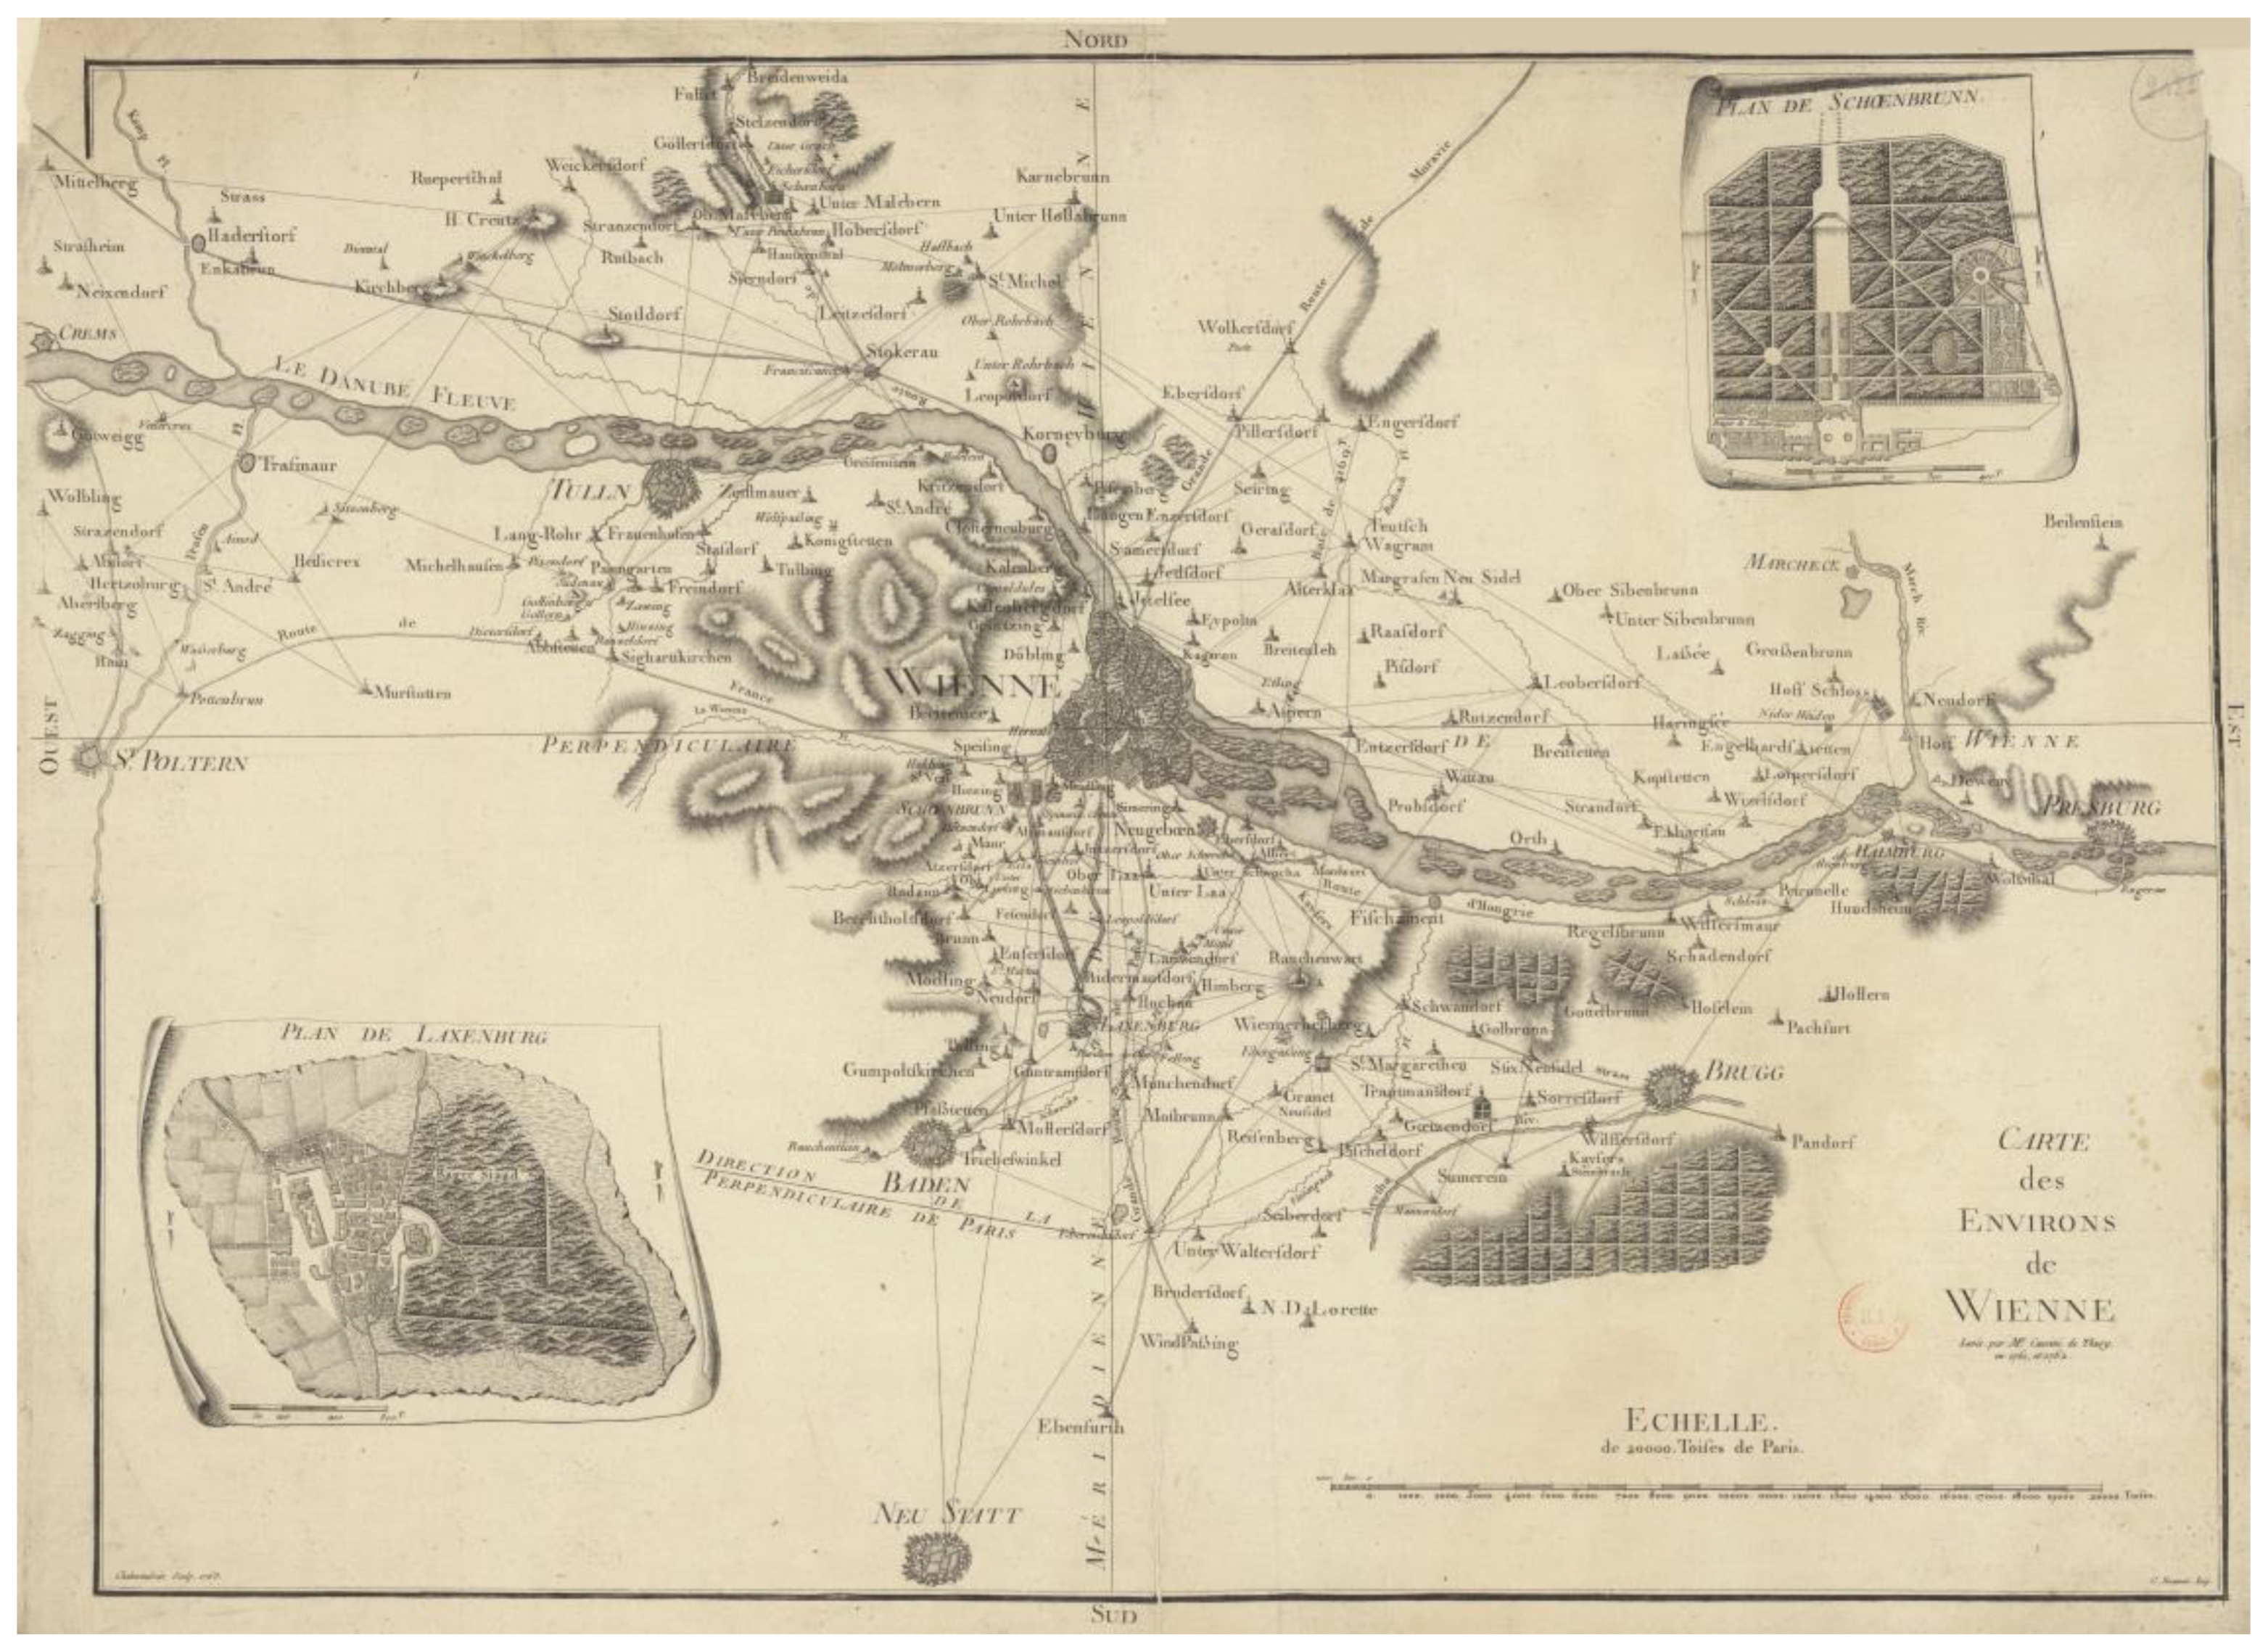
During his visit in Vienna in 1761, César-François Cassini de Thury taught his Austrian colleagues the triangulation and surveying techniques he used. The survey of Vienna and its surroundings using this method had already been carried out jointly with Joseph Liesganig, the head of Austrian geodesy. The map [
25] was drawn in the Cassini projection, now with the centre of St. Stephen’s Cathedral in Vienna, the intersection of the “Meridien” and “Perpendiculaire” lines, the standard coordinate axes of the Cassini projection. It also became the starting point for the Lower Austrian survey sections.
Figure 2.
During his visit in Vienna in 1761, César-François Cassini de Thury taught his Austrian colleagues the triangulation and surveying techniques he used. The survey of Vienna and its surroundings using this method had already been carried out jointly with Joseph Liesganig, the head of Austrian geodesy. The map [
25] was drawn in the Cassini projection, now with the centre of St. Stephen’s Cathedral in Vienna, the intersection of the “Meridien” and “Perpendiculaire” lines, the standard coordinate axes of the Cassini projection. It also became the starting point for the Lower Austrian survey sections.
Liesganig used the experience to carry out a meridian measurement on a French model. For the first time, he determined the ratio between the Viennese fathom and the French toise (1 toise = 1.02764 Viennese fathoms) [
26], a measure of length that had been compulsory in the Habsburg Empire since 1756. He measured the length of the meridian of Vienna by triangulation from Vienna north to Brünn (now Brno, Czech Republic) and south to Varaždin in Croatia, and compared the results with astronomical latitude measurements at points of interest [
23,
26,
27] (
Figure 3a). At that time, this was not primarily for mapping purposes: it contributed to determining the size and shape of the Earth [
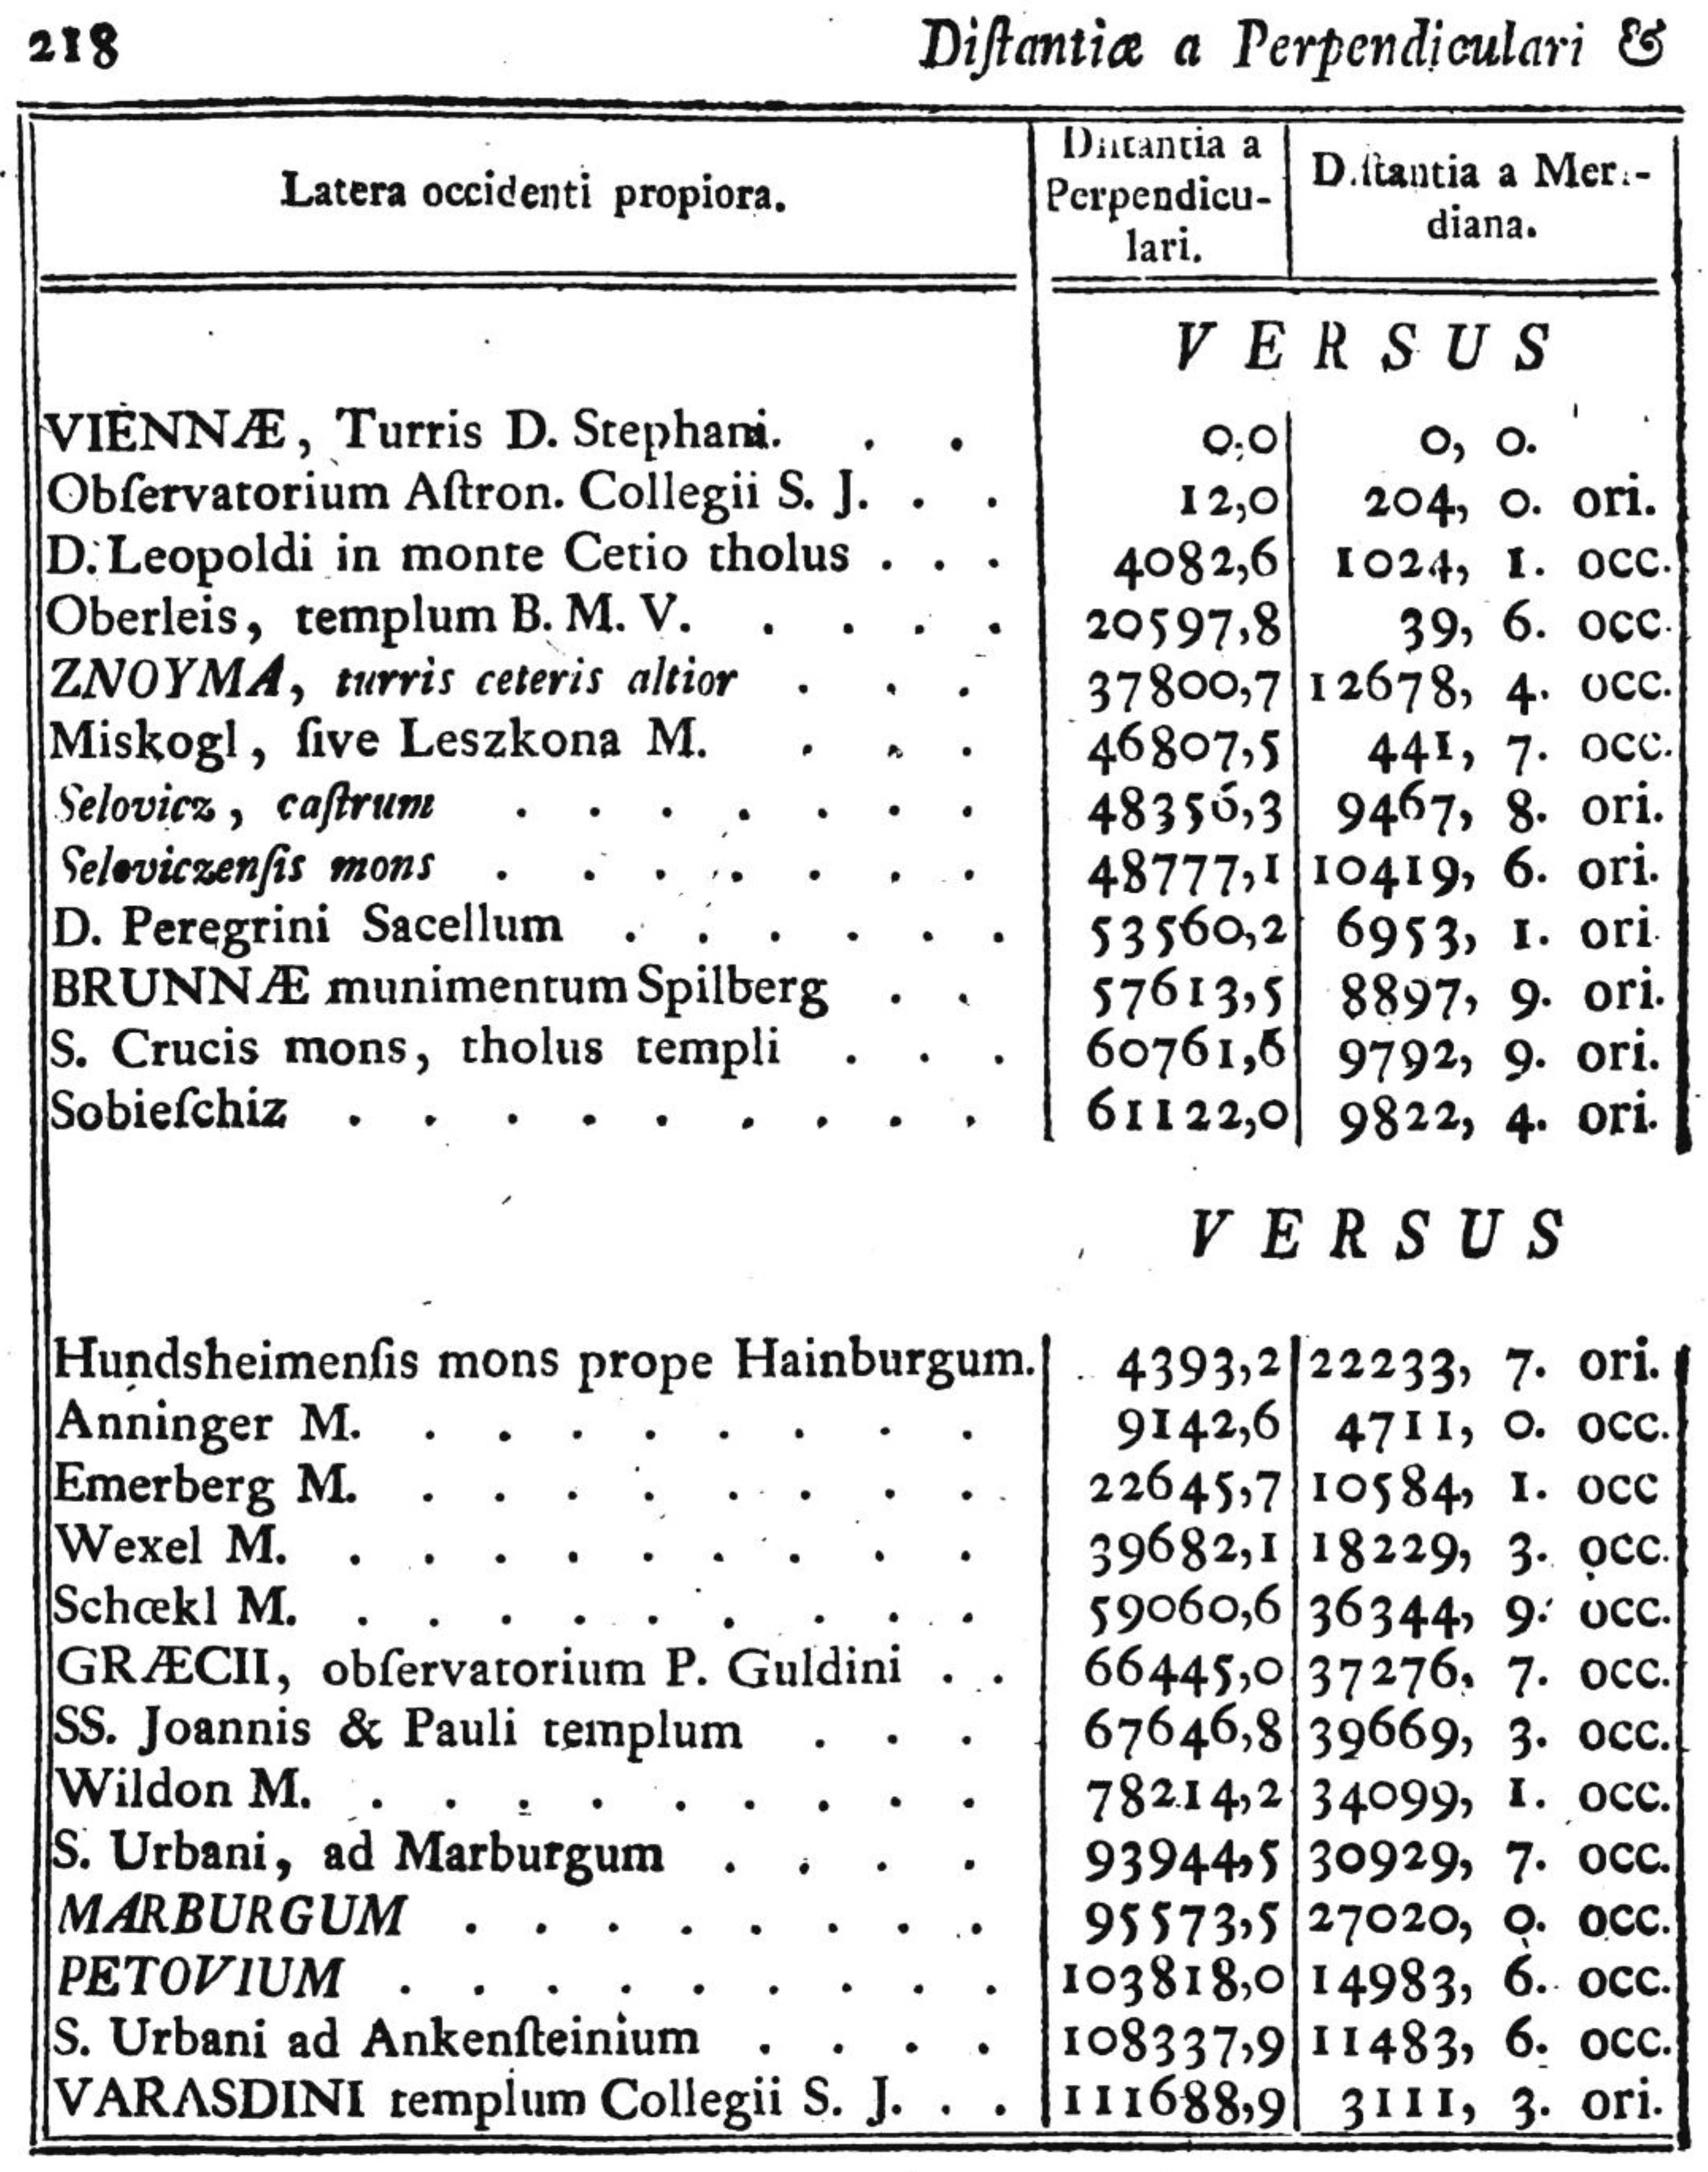
28]. The geographic and planar coordinates of the points of the triangulation network associated with the degree measurement were published in 1770 in his book, in units of Vienna fathoms, with the St. Stephen’s Cathedral in Vienna as the origin [
26] (pp. 218–219;
Figure 4).
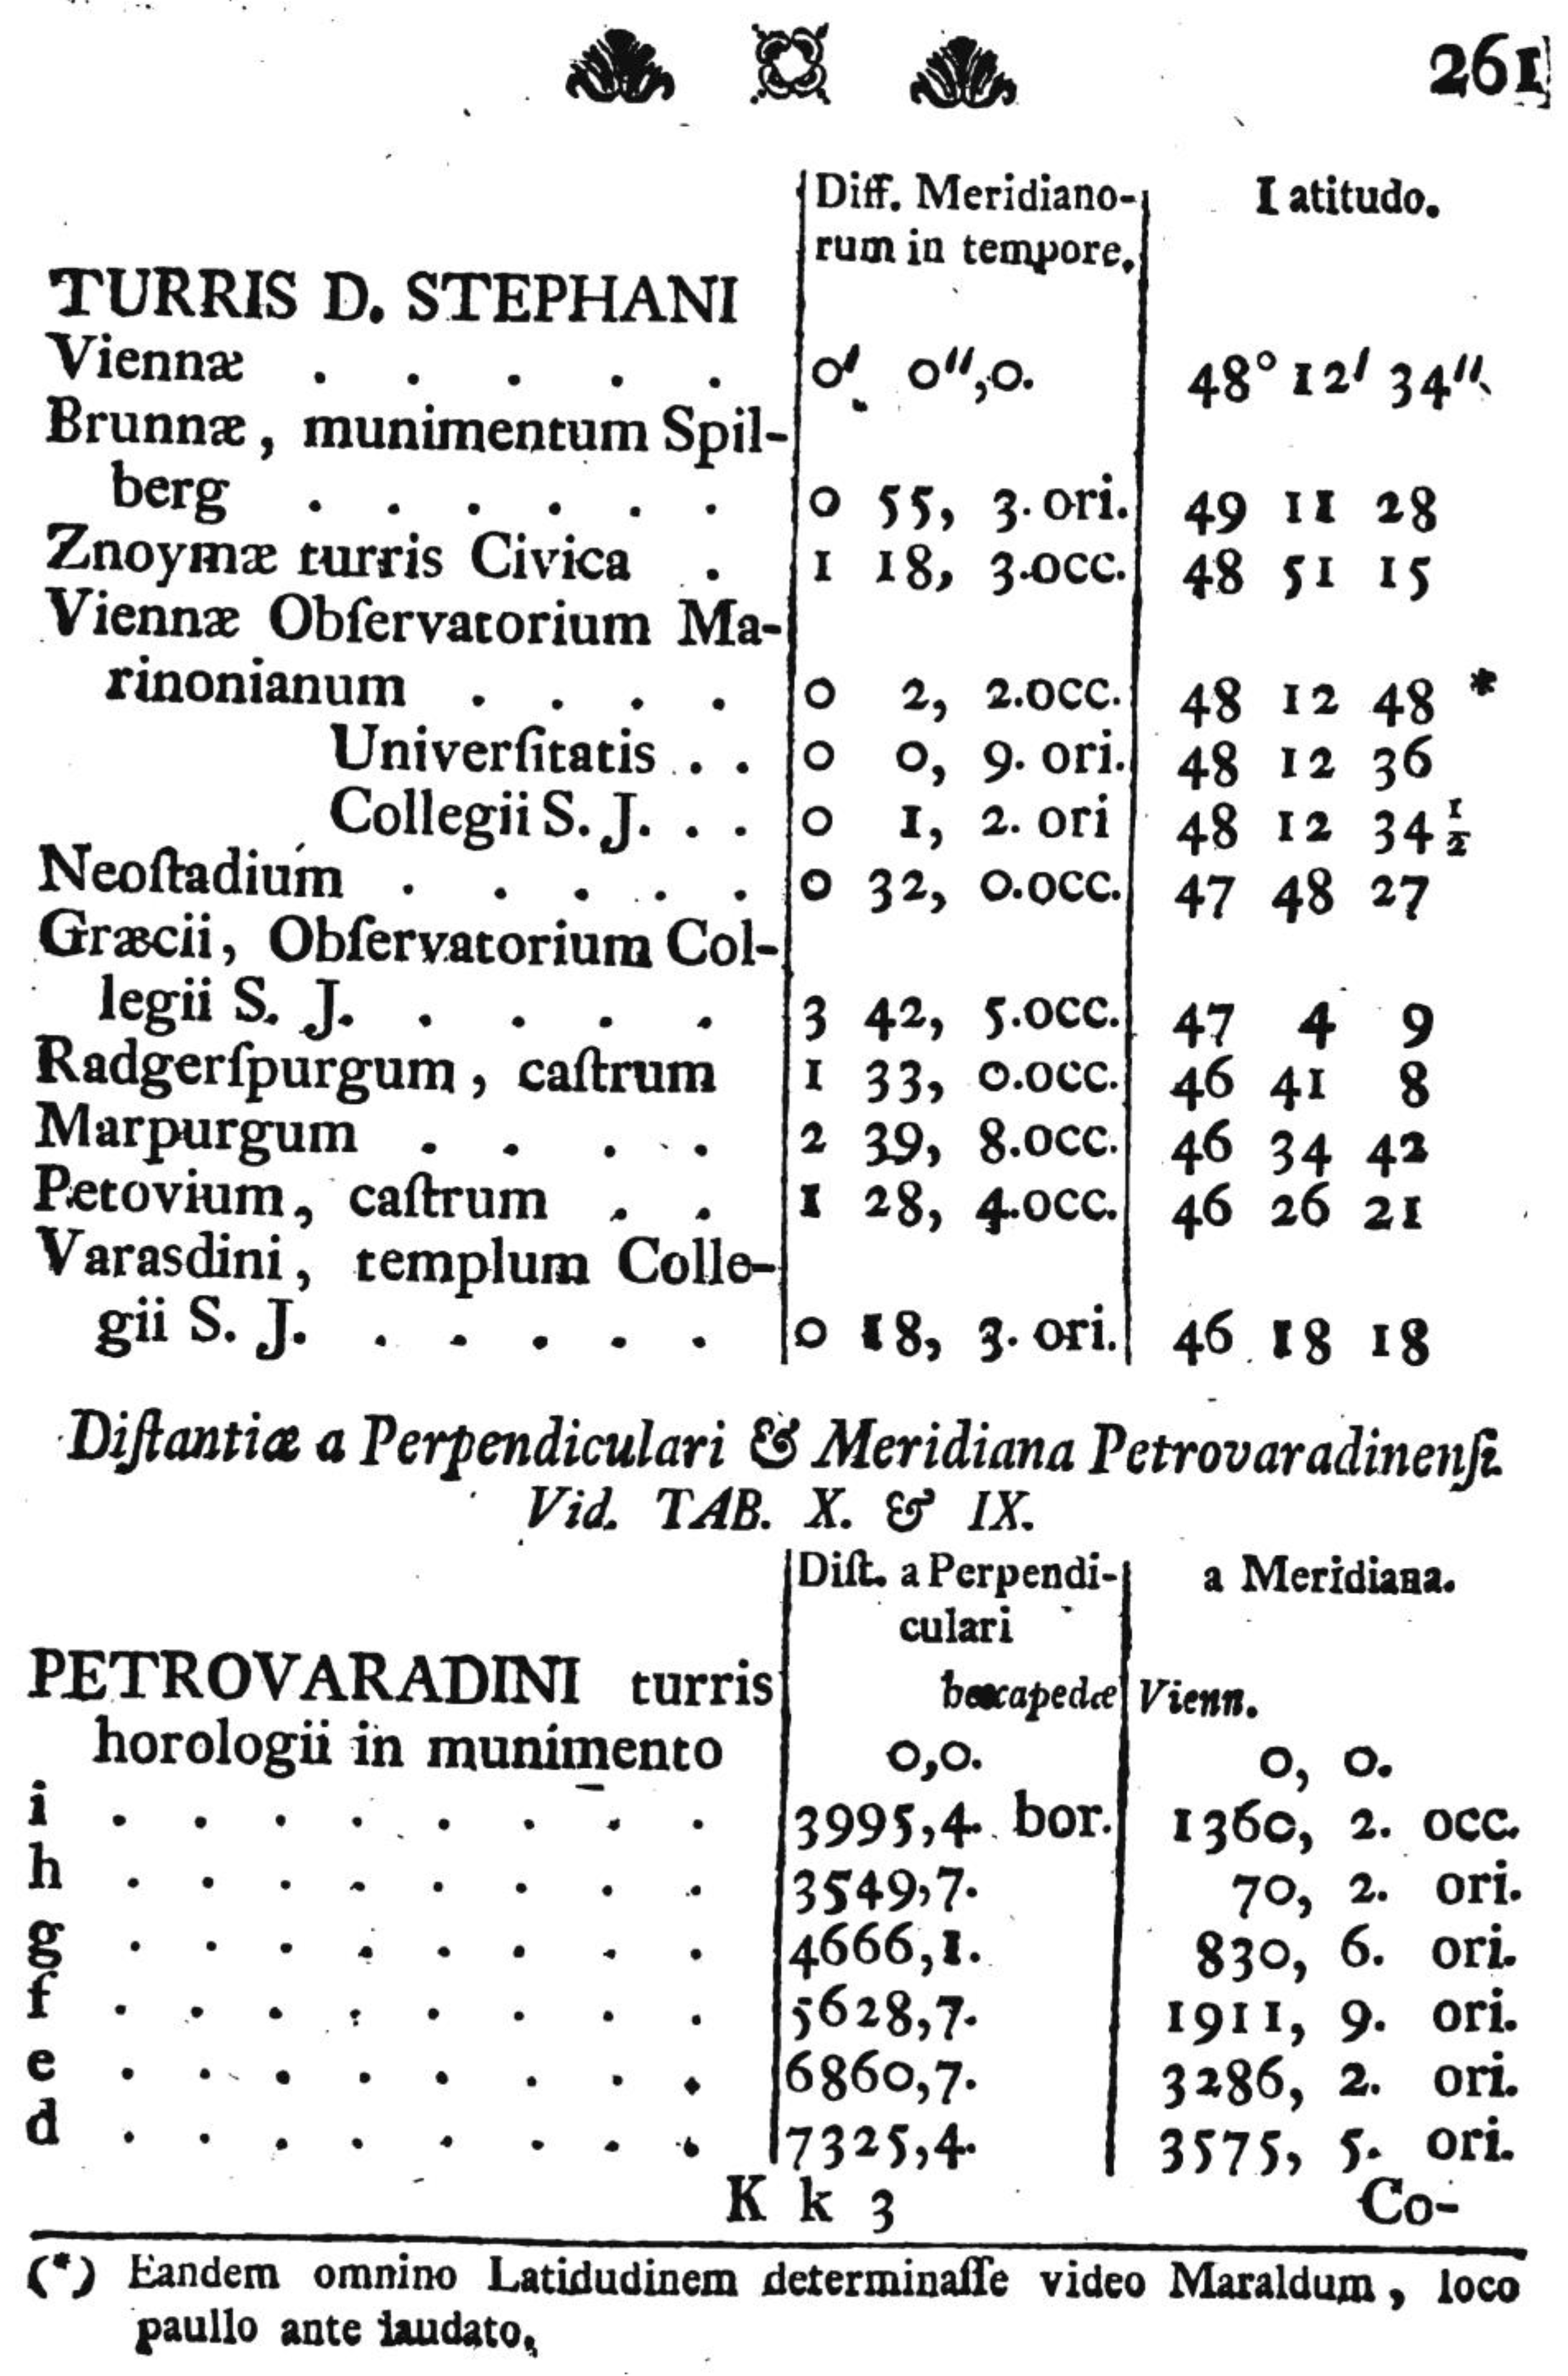
Liesganig then also carried out a degree measurement in southern Hungary. He started the determination of the arc length between Csurog (now Čurug, Serbia) and Kistelek by setting up a mobile observatory south of Csurog. Its position was determined in relation to the clock tower of the fortress of Pétervárad (now Petrovaradin; a district of Novi Sad, Serbia), the most important military object in the area at the time, as the origin [
26,
29,
30,
31,
32] (
Figure 3b). On the last pages of Liesganig’s book, the points of the triangulation chain at Csurog–Kistelek are listed in relation to this zero point, with plane coordinates in units of Vienna fathoms [
26] (pp. 261–262;
Figure 5)
Figure 3.
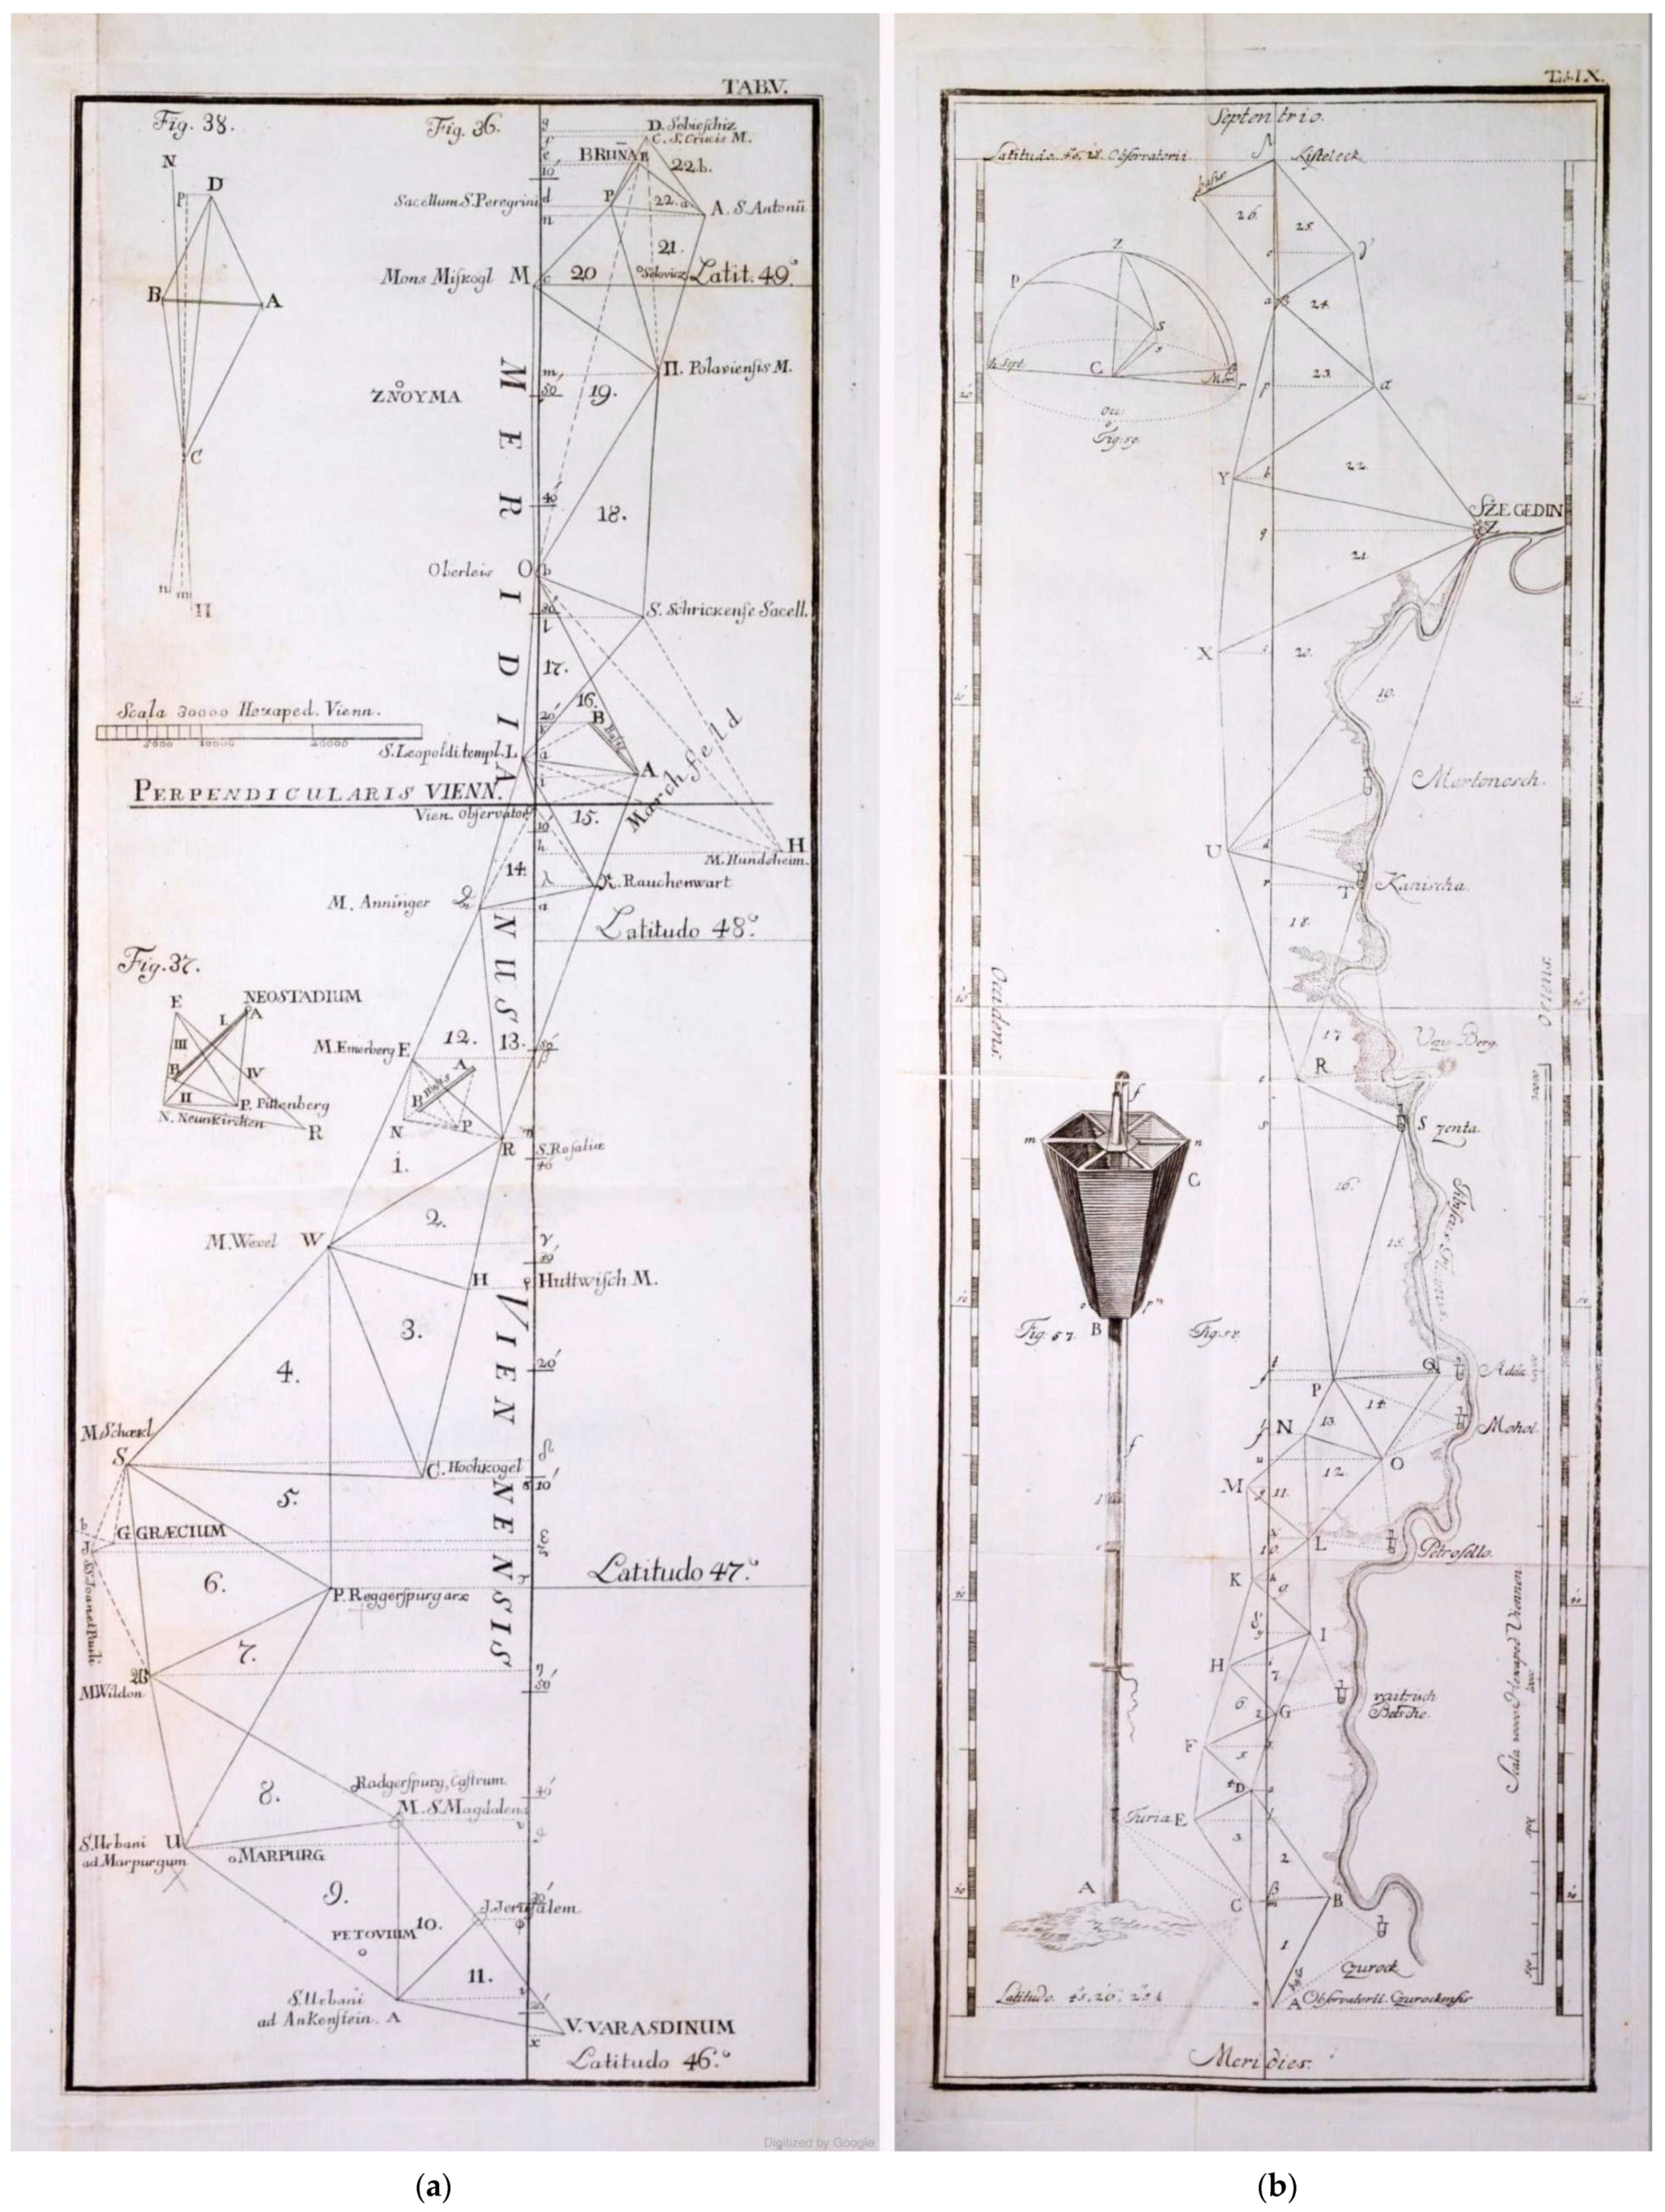
Sketches of two of Joseph Liesganig’s arc measurements from the 1760s. (
a) the Brno–Vienna–Varaždin triangulation chain with Vienna as the starting point [
27] (
b) the Csurog (Čurug)–Kistelek arc measurement [
30] in Hungary, starting in the south of the Csurog mobile observatory. The coordinate system of the network originated at the clock tower of the St. Petersburg fortress, which is located about 20 km from the southern endpoint of this chain (cf.
Figure 5).
Figure 3.
Sketches of two of Joseph Liesganig’s arc measurements from the 1760s. (
a) the Brno–Vienna–Varaždin triangulation chain with Vienna as the starting point [
27] (
b) the Csurog (Čurug)–Kistelek arc measurement [
30] in Hungary, starting in the south of the Csurog mobile observatory. The coordinate system of the network originated at the clock tower of the St. Petersburg fortress, which is located about 20 km from the southern endpoint of this chain (cf.
Figure 5).
Figure 4.
Table of Liesganig’s book [
26] on the survey of the Vienna meridian (cf.
Figure 3a). The starting point in Vienna is given in zero coordinates, the other points are given in the Cassini projection in Viennese fathoms.
Figure 4.
Table of Liesganig’s book [
26] on the survey of the Vienna meridian (cf.
Figure 3a). The starting point in Vienna is given in zero coordinates, the other points are given in the Cassini projection in Viennese fathoms.
Figure 5.
Penultimate page of Liesganig’s book [
26]: above are the geographical coordinates of the points of the Vienna arc survey; below are the coordinates of the southern end of the Hungarian arc survey in the Cassini projection in Viennese fathom units; the coordinates of the Petervaradin clock tower are defined as zero.
In archive documents, we can find traces of another triangulation carried out in Hungary more than a decade later [
33]. According to sketches signed by Colonel Andreas von Neu (1734–1803), a leading figure in Habsburg military cartography, a triangulation was carried out from the highest hills of present-day Budapest to the southeastern vicinity of the city. It is interesting to note that the sketch [
34] also shows a section layout corresponding to the section size of the First Military Survey, which, however, does not correspond to the later section system (
Figure 6). Colonel Neu’s signature also appears on another sketch [
35]. This shows the survey plan for the whole of historic Hungary (but excluding Transylvania and Croatia). However, the network, which corresponds to the section size of the military survey, is rotated by about 16 degrees to the west compared to the latter one (
Figure 7). This is related to the orientation of the surveys actually carried out in the other bordering provinces of the Empire (Transylvania, Croatia and the bordering regions, Inner Austria and Galicia). According to the historical geomagnetic model ‘gufm1’, the magnetic declination of the region between 1770 and 1790 was indeed 13–18 degrees west [
36], so it is likely that the network planned in Hungary, but not implemented accordingly, would have been aligned with magnetic north. This document by Colonel Neu shows the location of the triangulation network initiative in Budapest in a reduced form. However, it has not yet been possible to find archival evidence of triangulation networks developed in other areas of Hungary.
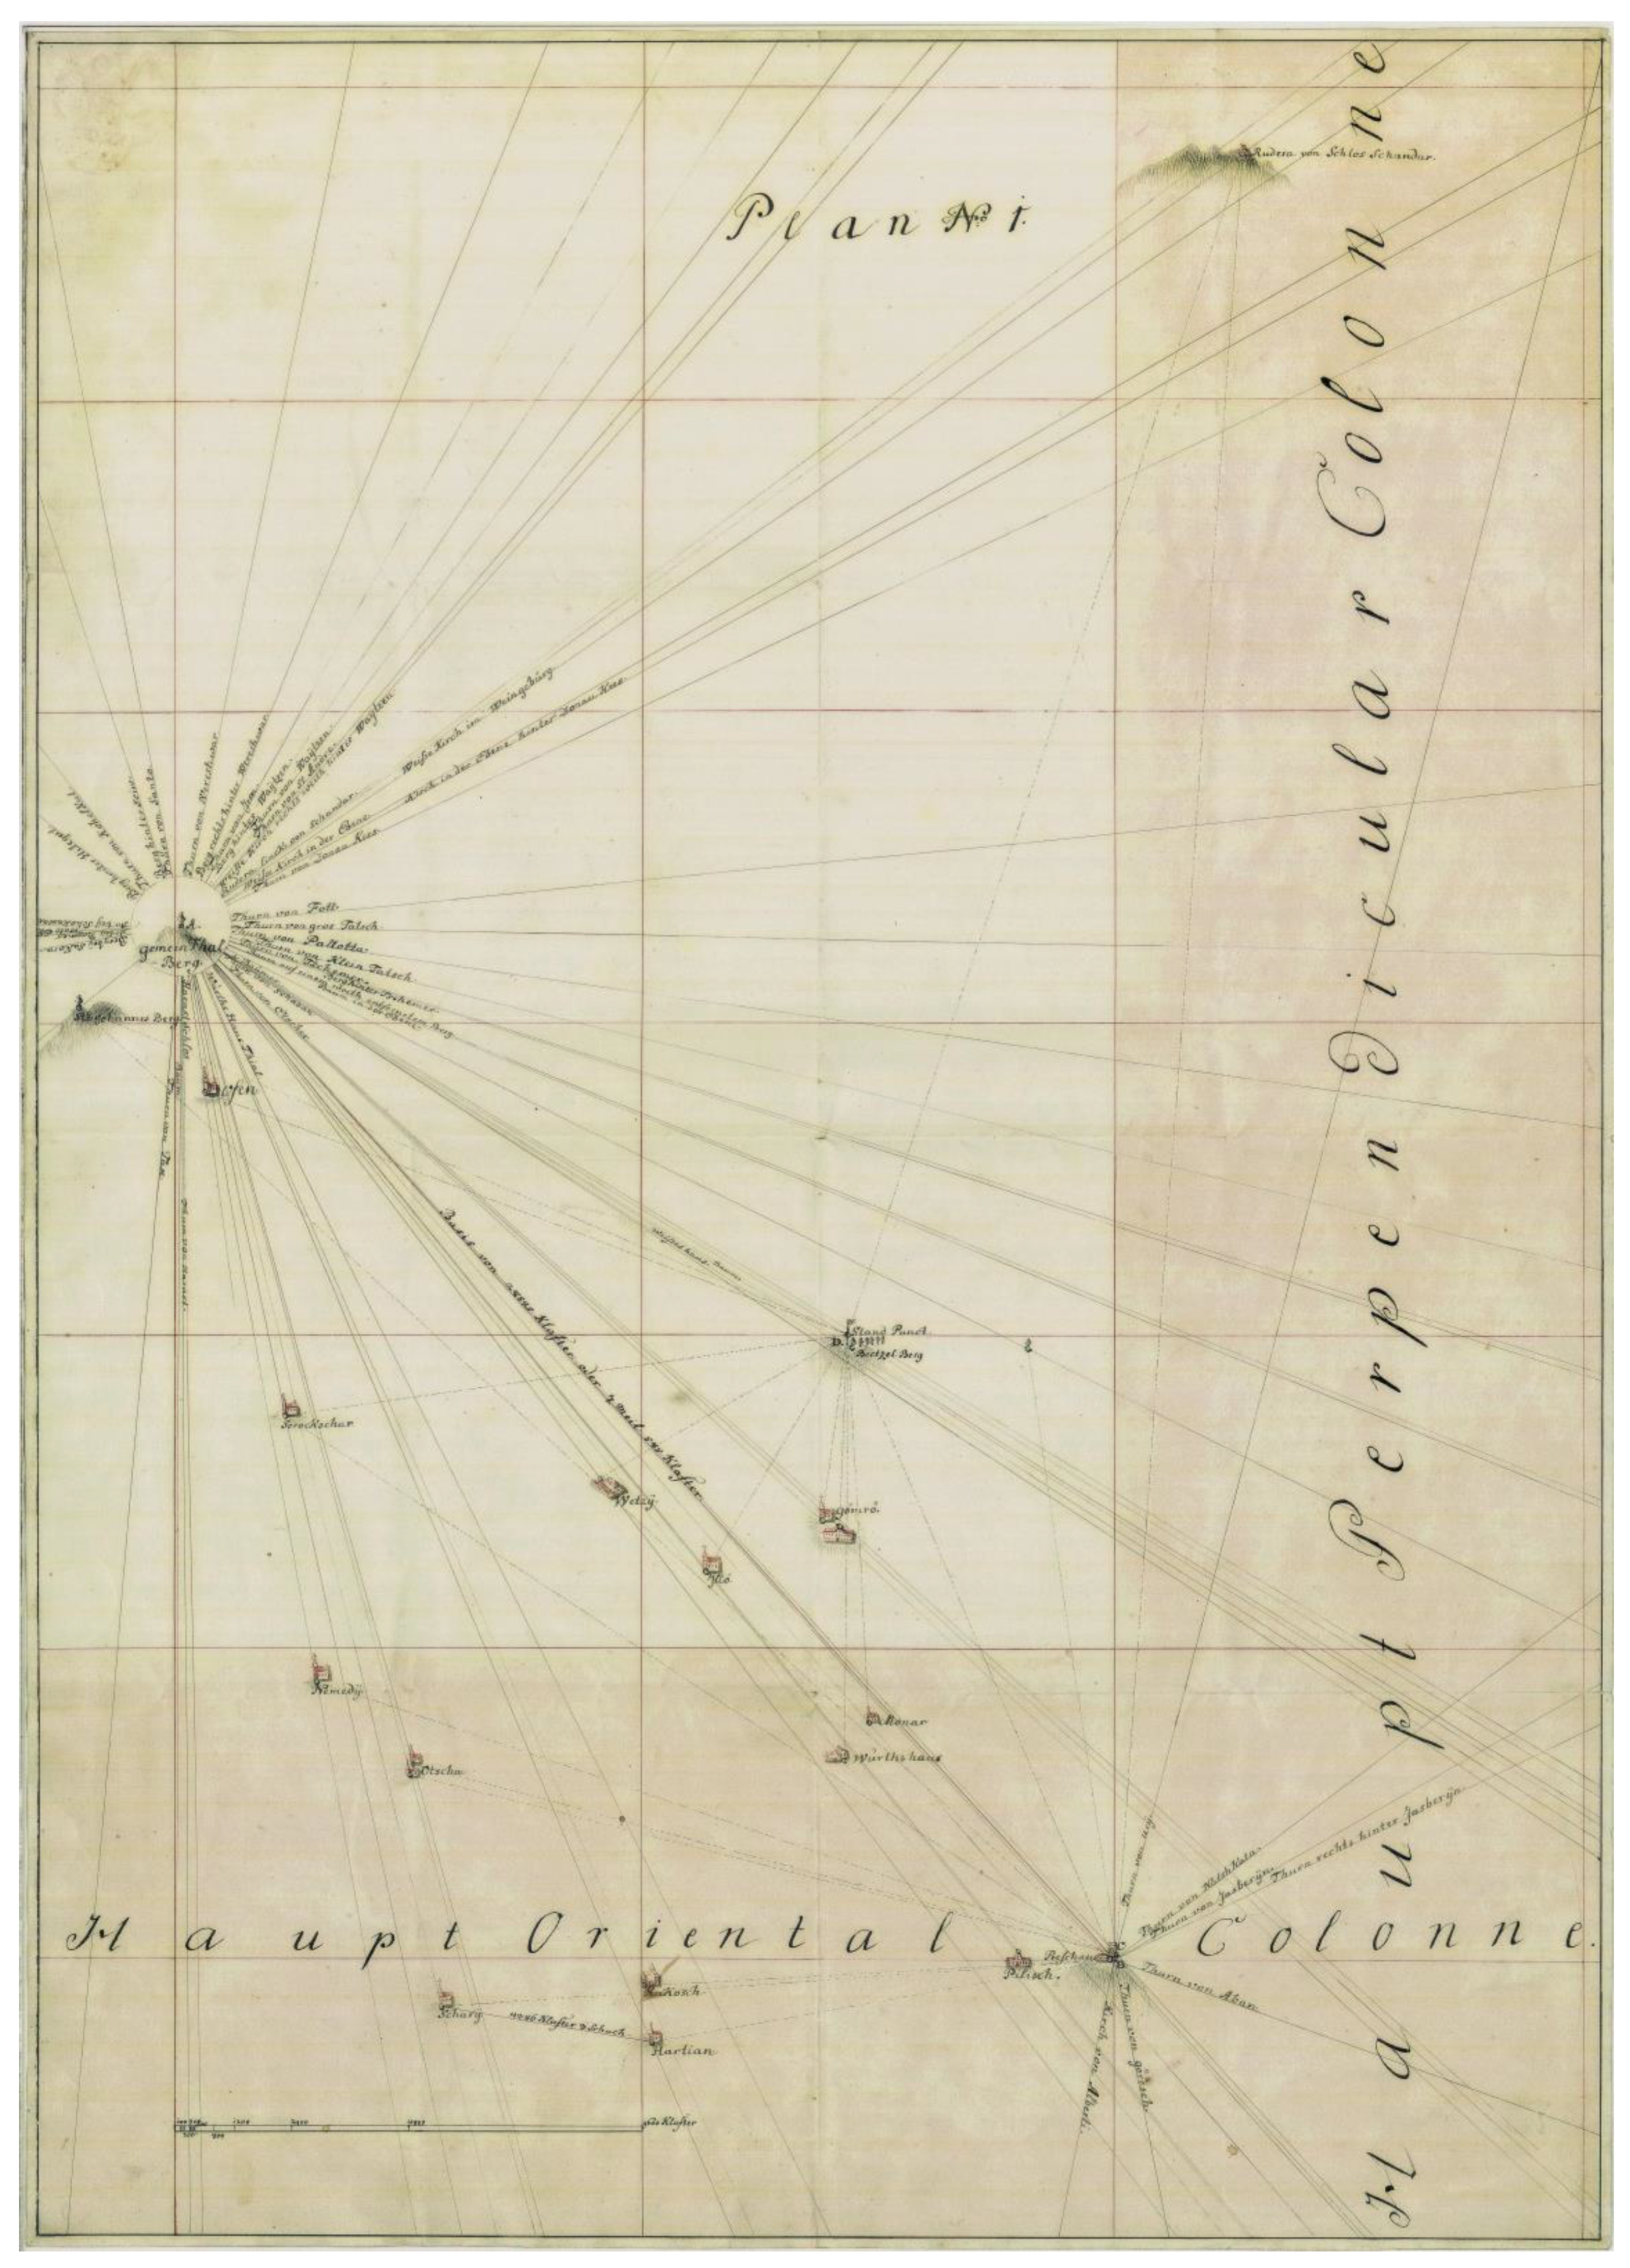
Figure 6.
Sketch map [
34] by Colonel Andreas von Neu of the triangulation of the east–southeast foreland of present-day Budapest (1782). A draft plan of sections is shown together with the survey points. The size of these sections is identical to that used in the First Military Survey. However, this network is not identical to the later map network but is rotated by about 15 degrees to the west, so that the ‘up’ direction on the sketch points not to the geographic but to the magnetic north, which is valid for the period. In the upper left corner of the section in the lower right corner is the press house of Szőlőhegy, east of the village of Pilis, which is the presumed starting point of this network.
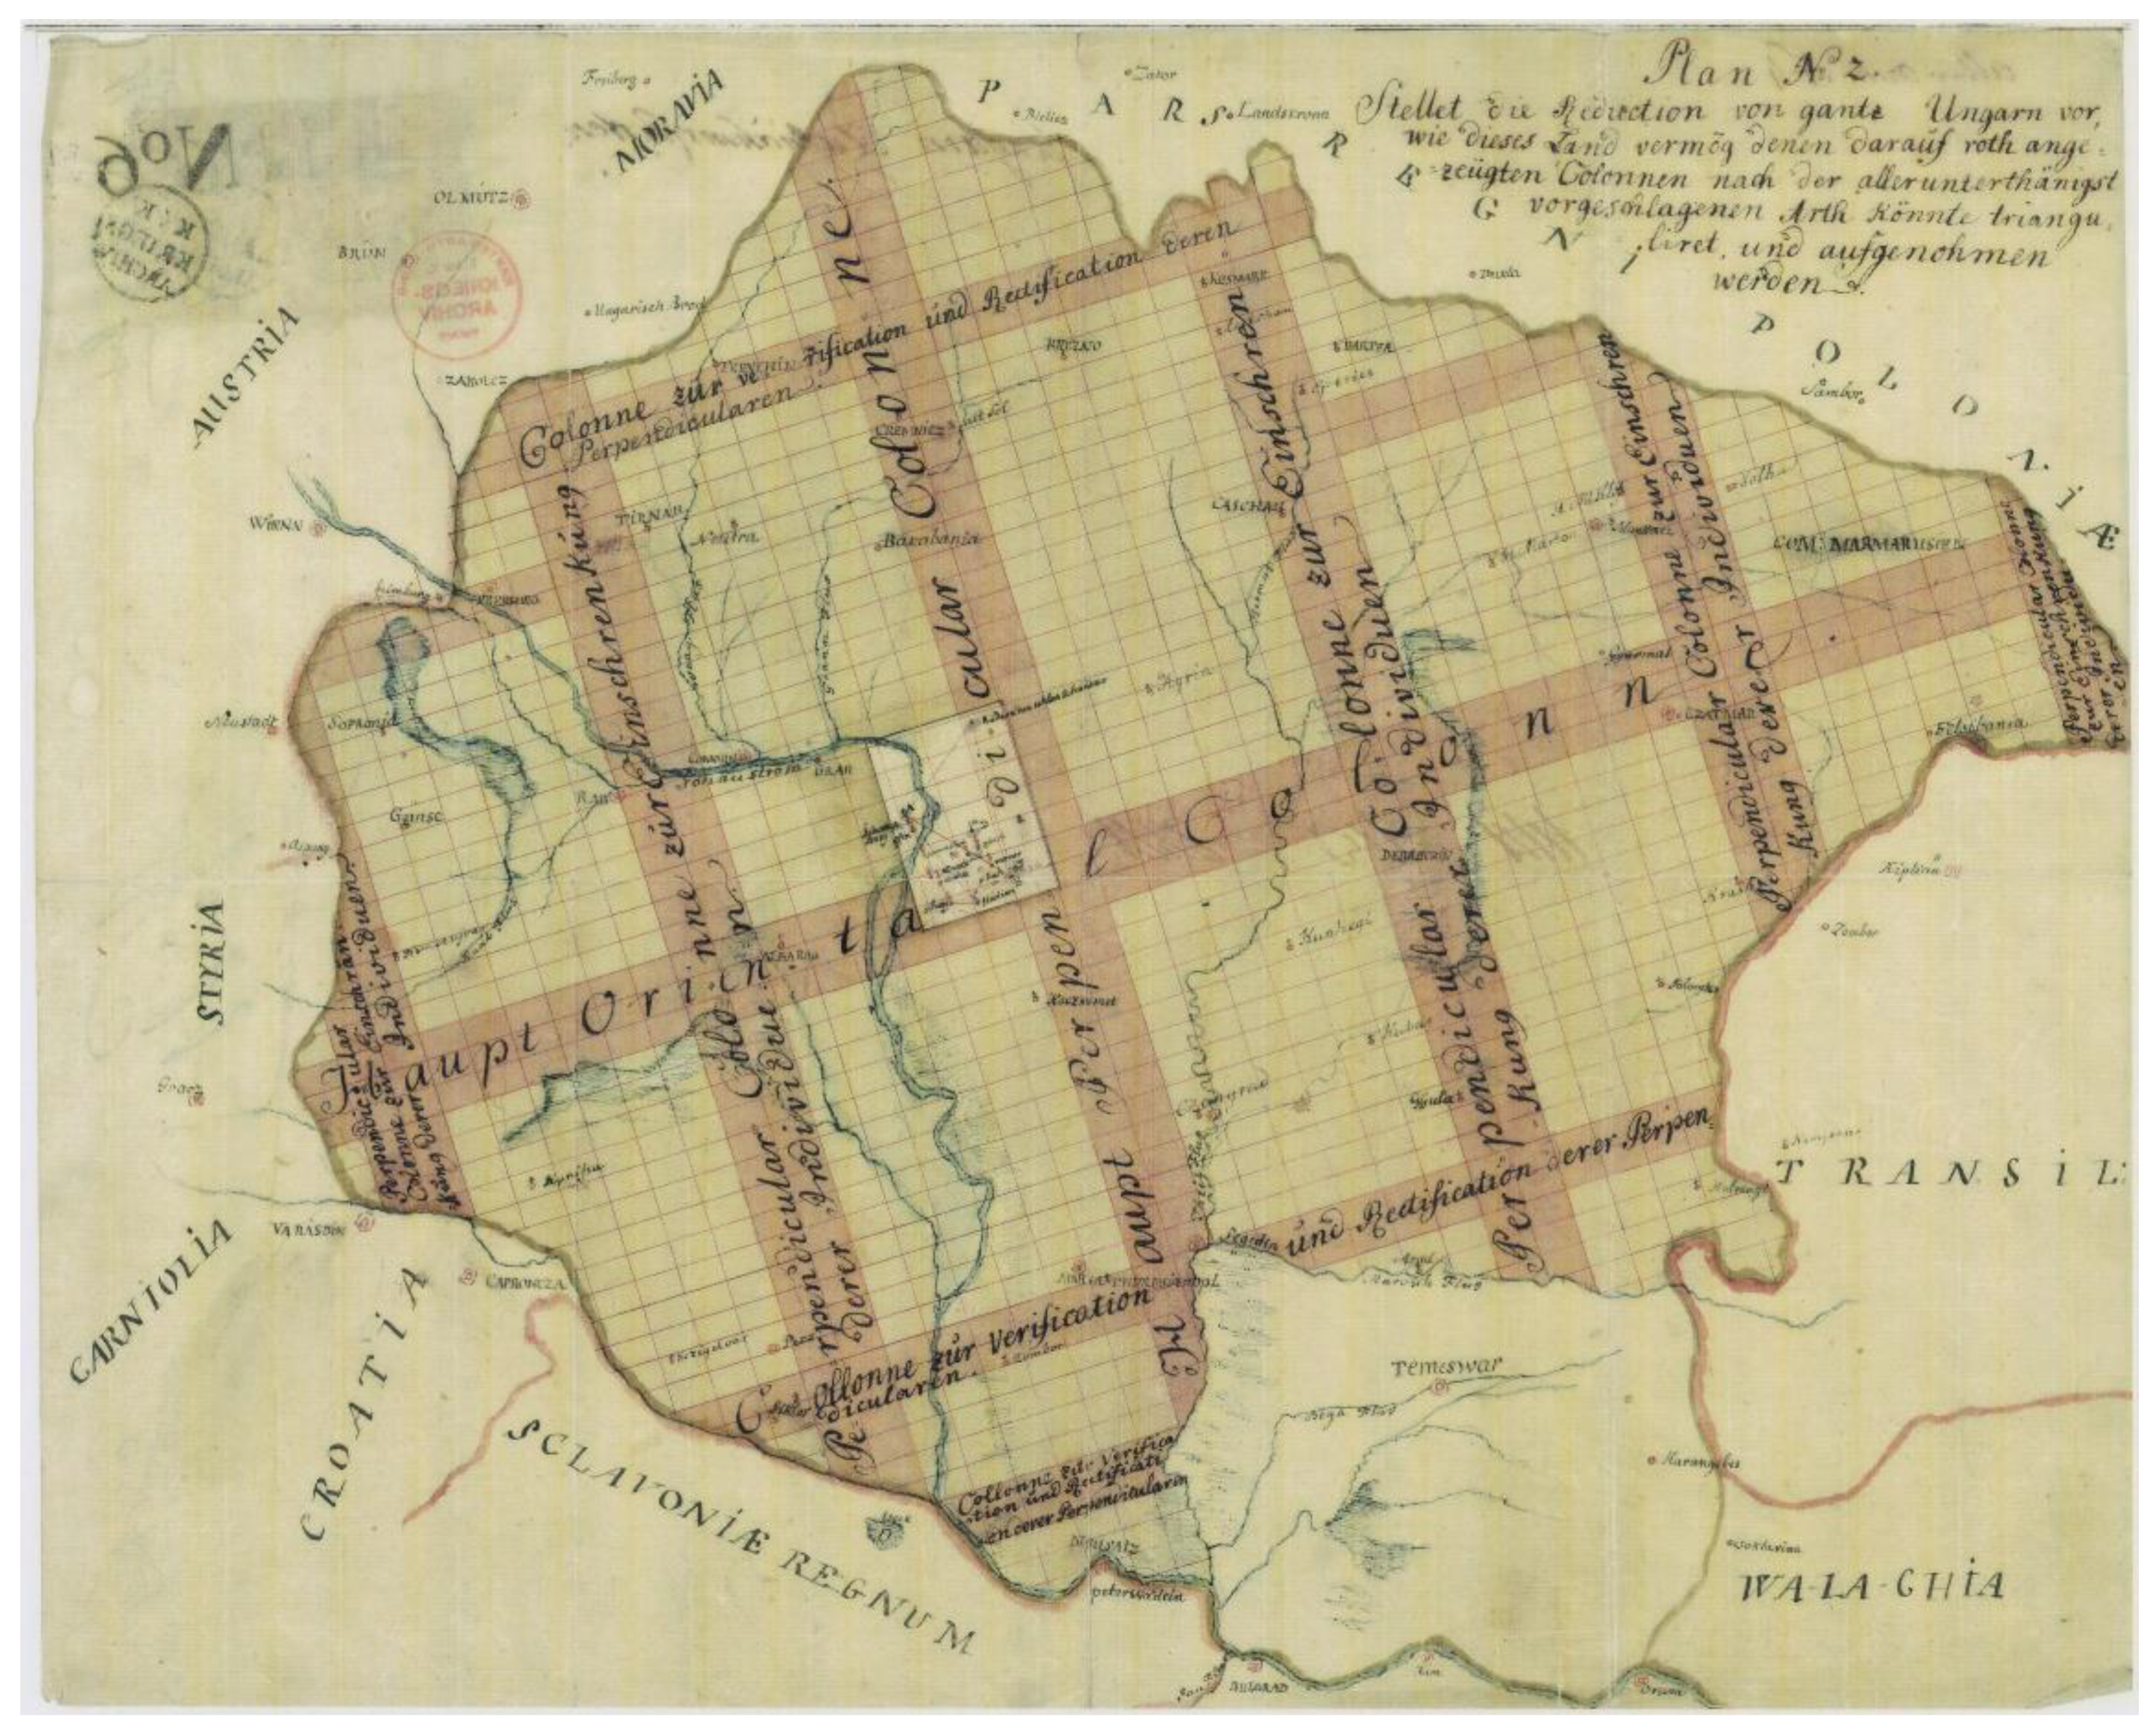
Figure 7.
Map sketch by Colonel Neu [
35] from 1782 of the planned but not implemented sectional layout of the First Military Survey. A scaled-down version of the sketch shown in
Figure 6 is also recognisable in the Budapest area.
Figure 7.
Map sketch by Colonel Neu [
35] from 1782 of the planned but not implemented sectional layout of the First Military Survey. A scaled-down version of the sketch shown in
Figure 6 is also recognisable in the Budapest area.
3. Georeferencing of the Survey Maps of Lower Austria and Hungary with the Cassini Projection
For both provinces, the starting data were image mosaics compiled from scanned original sections using simple image processing (not geospatial) methods. In Lower Austria and in Hungary, seven and eleven well-recognised points with uniform spatial distribution were used as control points. The number of points may seem small, but, as the aim is a linear fit to a well-chosen projection, this is sufficient in practice.
The goal is in fact to define the map mosaic’s own native “projection” coordinate system. The correct choice has two practical criteria:
once the coordinates of the control points, read in WGS84, are converted to the target system, the linear fit of the system should be accurate, and the total error of the linear fit should be the smallest compared to other possible systems;
after georeferencing, the rows and columns of the section mosaic in the chosen system must be exactly horizontal and vertical.
The first task is to choose the projection type. This selects the set of functions that establishes the relationship between the geographic and map coordinates. On the basis of the above, the Cassini projection is the most likely to be used. However, the original spherical Cassini projection is not generally available in geographic information systems. The projection was formalised and generalised to an ellipsoidal base surface by Johann Georg Soldner (1776–1833) in the first half of the 19th century. For this reason, in a GIS environment, the Soldner or Cassini–Soldner projection should be chosen.
The next step is to estimate the projection parameters. For the Cassini(–Soldner) projection, this means the geodetic coordinates (latitude and longitude) and the map coordinates (false eastings and false northings) of the projection origin. The latter need not be considered separately if they are set to zero at the projection origin. For the geodetic coordinates, the question of the base ellipsoid or sphere (the geodetic datum) arises. This is relevant if the map database to be georeferenced is to be fitted with the geographic coordinates of the period. An example is the georeferencing of the French Cassini map. In our case, however, this is not necessary: the maps of the First Military Survey do not contain any coordinate description, so the aim is simply to match the map content as accurately as possible to modern databases (e.g., OpenStreetMap). To do this, the coordinates of the projection start point can be given in WGS84 and used this as the geodetic datum. The actual geodetic datum used is based on the astronomical positioning of a single point, which is then linked to the WGS84 system by the local vertical deflections. The global deflection of vertical data for the continents is publicly available [
37] and nowhere in the area of the Habsburg surveys shows it values exceeding a few arc seconds, which is well below 300 m in the field and well below the accuracy limit of the estimate made in this paper.
In the case of Lower Austria, the choice of the projection starting point was obvious. As in our previous study, the most probable value for the longitude of the starting point east of Greenwich was 16.35 degrees, and the starting point for the Cassini–Liesganig survey and the Vienna meridian measurement was Vienna’s Stephansdom (16.3731 degrees from Greenwich); I chose this as the starting point. Both of the above two criteria were met.
The issue is more complex in the case of Hungary. In our previous study, we were unable to find any obvious starting point in Hungary along the longitude 19.29 degrees east of Greenwich. The abovementioned triangulation network surveyed by Colonel Neu, covering the southeastern foothills of Pest, does not include such a point either. For this reason, I attempted a first round of georeferencing with the Petervaradin clock tower (19.8612 degrees east of Greenwich) as the starting point of the Cassini projection. Thus, in the first experiment, I used the coordinate system of the arc measurement network in South Hungary.
The result was good, but not perfect. The fit of the georeferenced map met the first criterion, i.e., its accuracy was acceptable, but the section lines and columns showed a slight deviation (ca. 0.3 degrees) from the horizontal and vertical. If the starting point of the projection is set at an arbitrary point defined as 19.29 degrees east of Greenwich, the alignment of the lines and columns will be accurate. This suggests that the actual starting point of the projection was further west of the meridian of the Petervaradin tower. This also rules out the possibility that the projection starting point was on the meridian of the Kistelek–Csurog arc measurement since it lies further east of Petervaradin.
If a possible real field point is to be assigned to the Hungarian part of the survey, the solution is rather speculative and relies solely on the incompletely known archive basis.
In Colonel Neu’s first sketch, the two endpoints of the triangulation network covering the southwestern foothills of Pest are the Hármashatár hill in Buda (the second highest summit in Budapest) and an object marked on the map as a press house in the eastern foothills of the village of Pilis. The latter is also obviously a summit because it is connected by overlapping lines with many of the points depicted on the sketch, and even with those beyond it. This landmark is shown as a corner point of the planned but ultimately unrealised network of sections. This point (latitude 47.2921 degrees, longitude 19.6016 degrees east of Greenwich) can also be interpreted as the starting point of the projection of the actual gauge network. This assumption may be strengthened to some extent by the fact that the point lies practically at the centre of map Section 22 of column XVI. Obviously, there is no logical connection with the above, but it is an interesting fact that this place is still a geodetic basepoint; it is the fundamental point of the geodetic datum of modern Hungarian topographic maps, the Hungarian Datum 1972 (HD72).
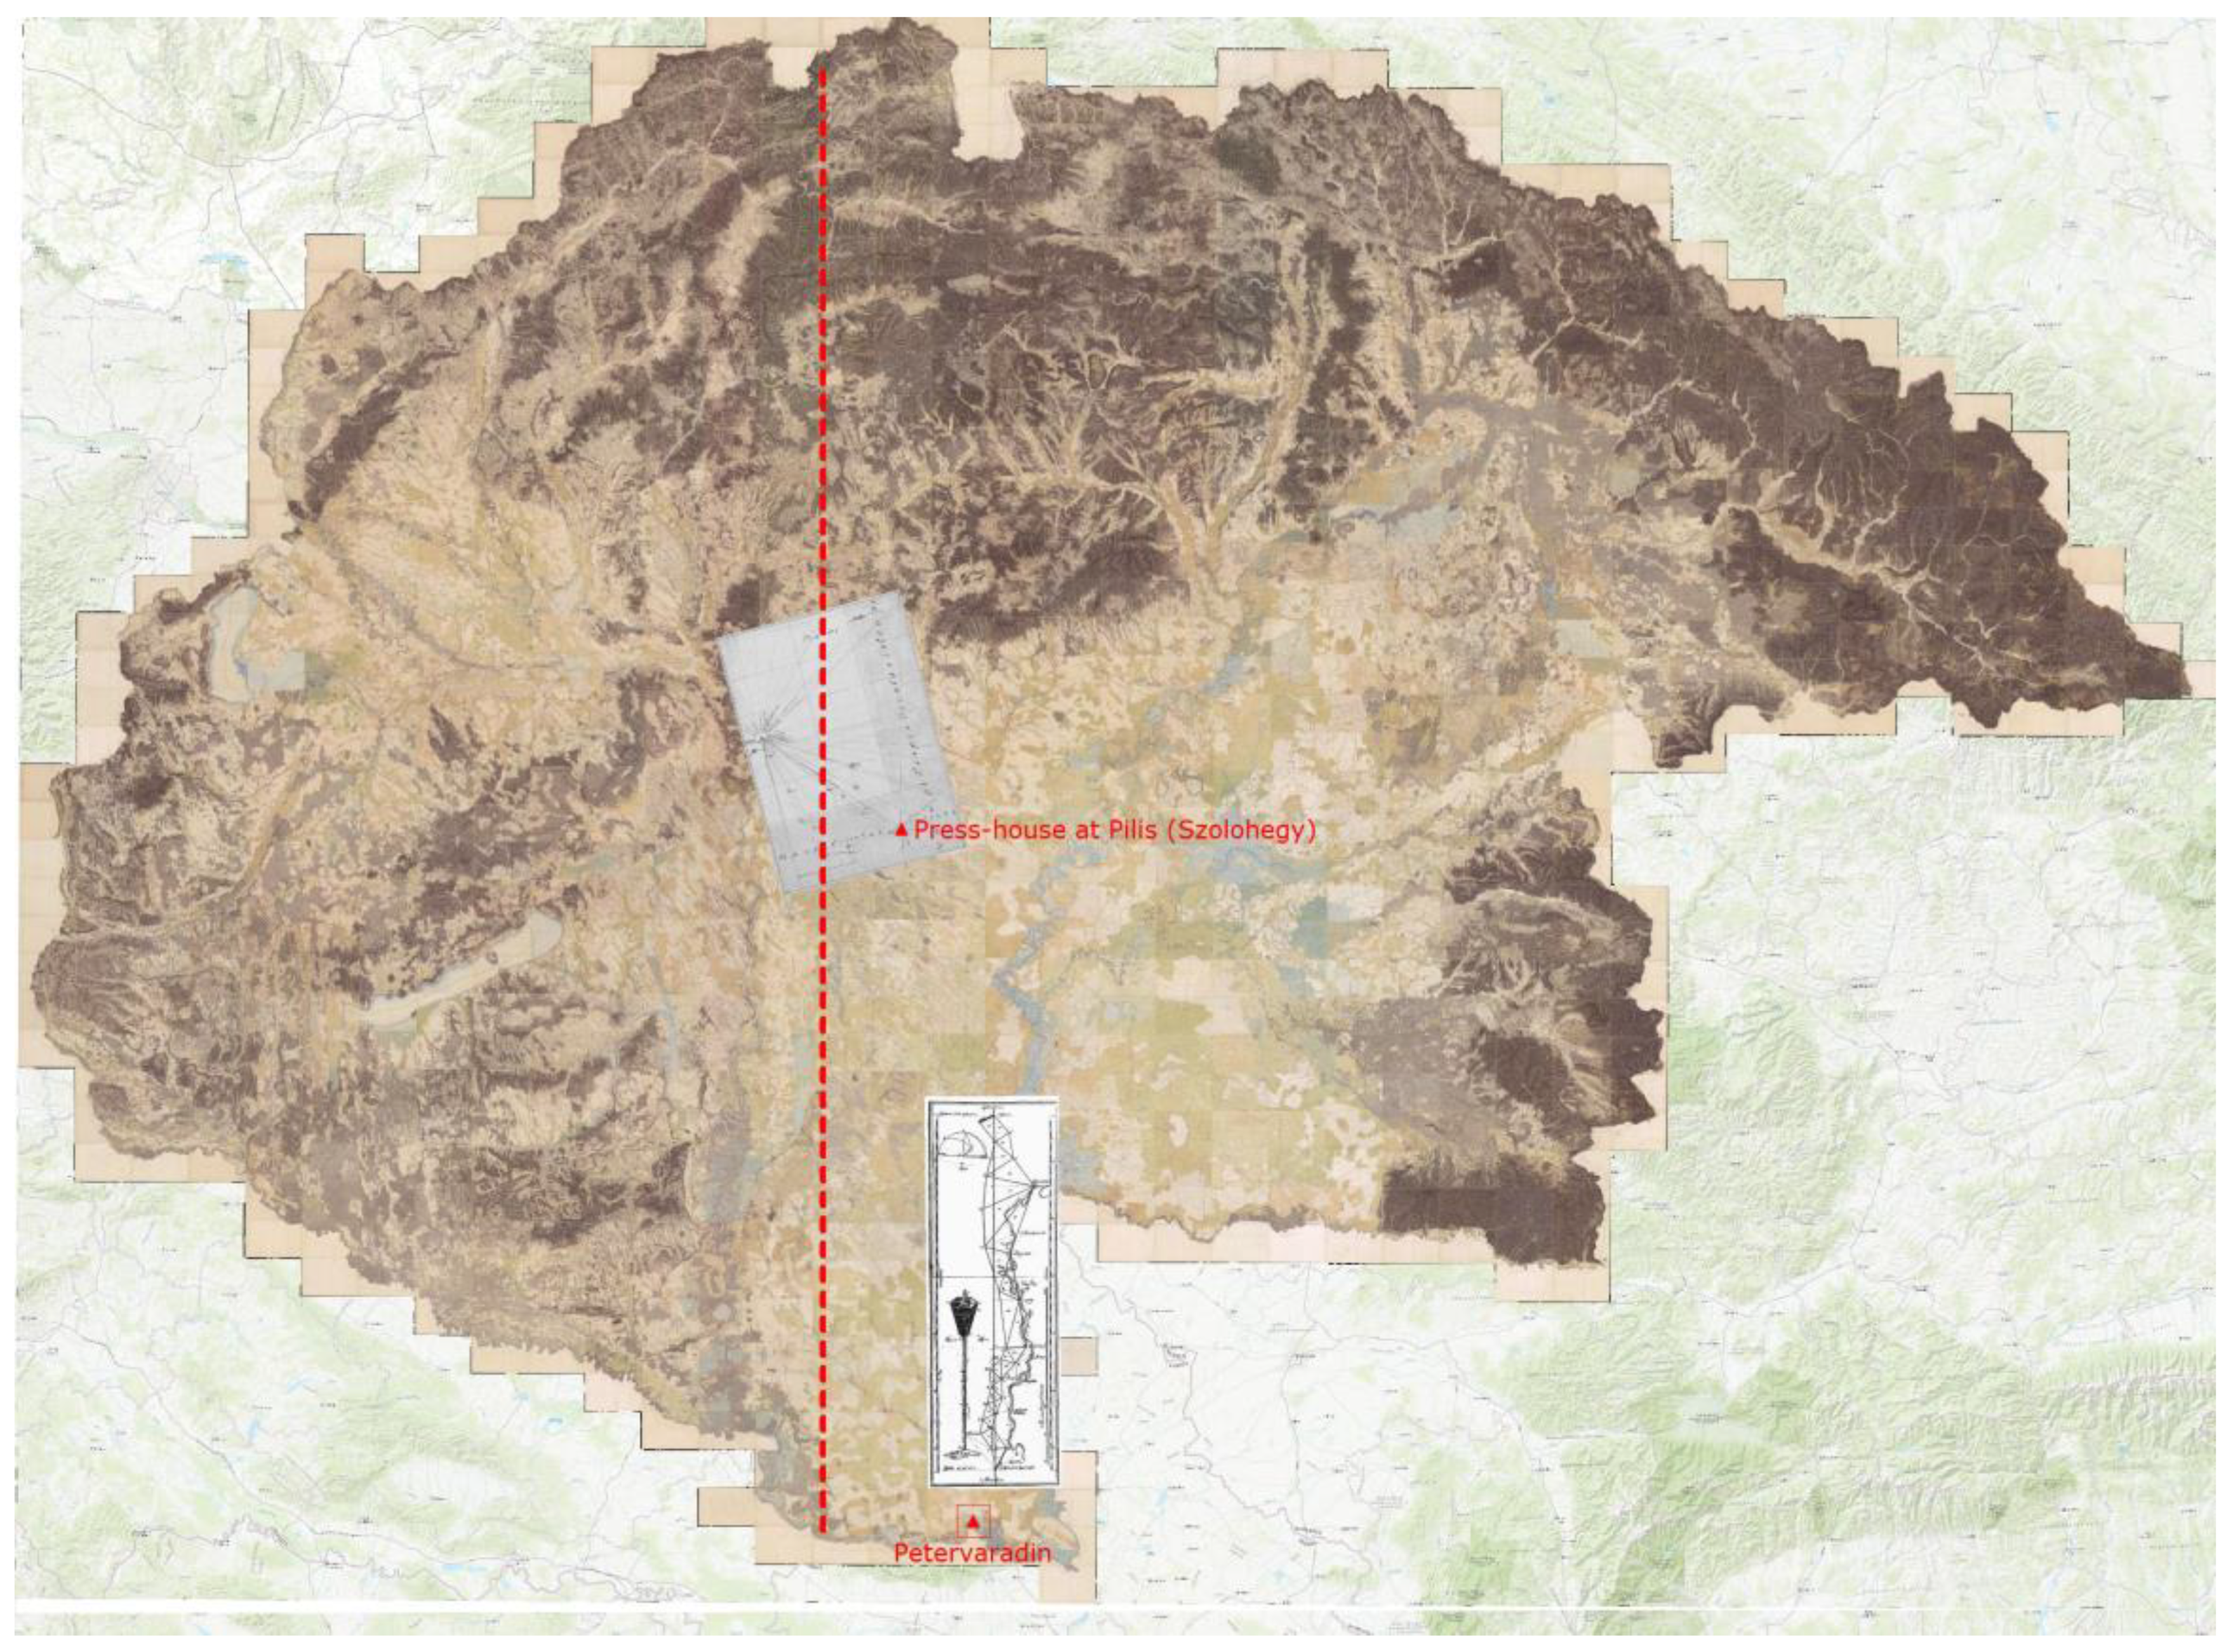
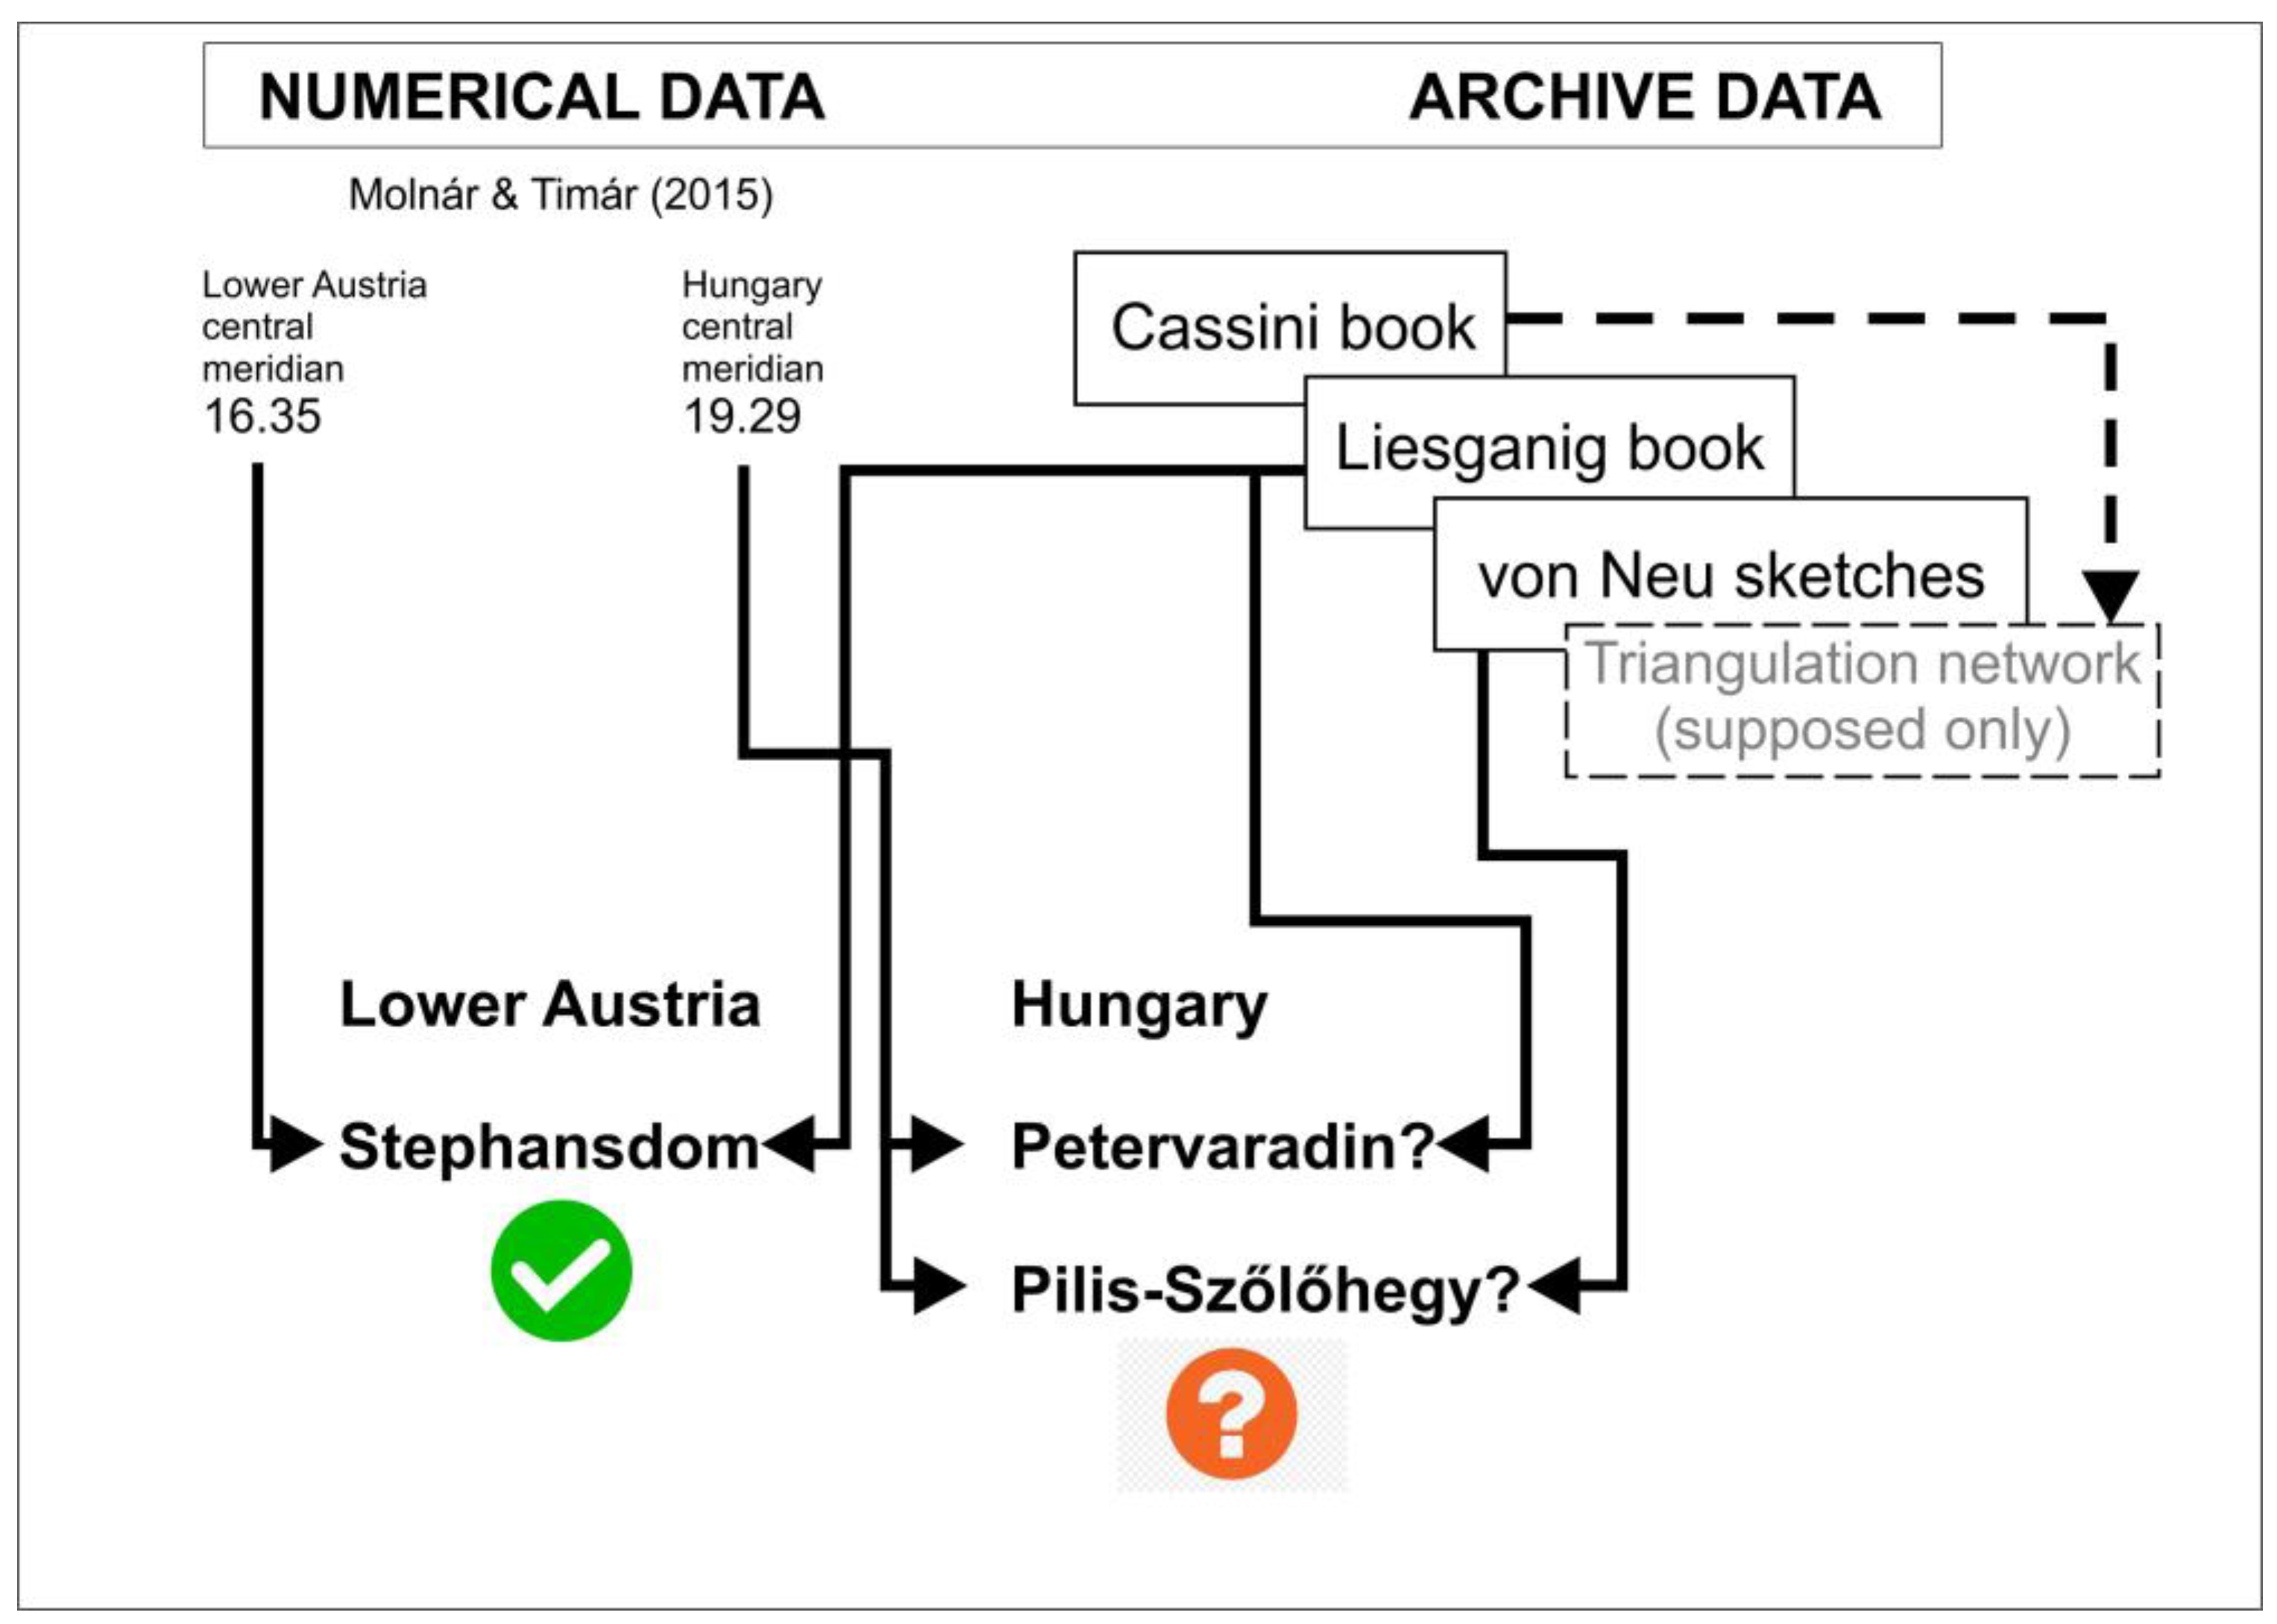
Thus, by modelling the projection of the First Military Survey with the Cassini projection, based on archival data, I was able to identify two possible starting points (
Figure 8):
the clock tower of the Petervaradin fortress, and
the “vineyard press-house” near the village of Pilis, the base point of the present-day geodetic system “Szőlőhegy” (it means ‘Vine Hill’ in Hungarian).
The first of the two, as was clearly the case in Lower Austria, is the documented zero point of the arc length measurement carried out in the area prior to the map survey. The second, on the other hand, is slightly more in line with the section network directions. Thus, the latter starting point is likely to be used as the final result (
Figure 9).
Another open question is as follows: if the two surveys under consideration were indeed based on the French method, invented for the Cassini map of France, why is their accuracy inferior to it? Why is it that there is no systematic bias over the entire survey area and that the errors are uniform but quite large?
The map of France is accurate to within a few hundred metres [
38]. Hundreds of points were used for the survey, developing the geodetic network from the points of the Paris meridian triangulation to the east and west. No such ‘first order’ network is known for the First Military Survey; its existence being assumed only by the relative accuracy of the map and the exact mathematical model nature of the Cassini projection. A hundred years later, when the accuracy of the survey and mapping was approaching today’s values, it was provided not only by the first-order network, but also by second- and third-order ones. The maps of the end of the 18th century, which were generally ‘well-done’ (accurate to within a few hundred metres to 1–2 km) but had almost as much local error, such as the First Military Survey, were produced without the main geodetic network and the subordinate networks that provided the link between the survey work by plane tables and the main geodetic network. This mapping method, the development of just one main triangulation network and the local plane table survey based on just that, can also explain the similar error characteristics of other map products of the era: the topographic maps of German [
39] and Italian lands [
40], Denmark [
41] and Norway [
42] and perhaps even for the earlier Mueller maps [
43].
4. Conclusions
The Cassini (or in other terms, the Cassini–Soldner) projection is a good mathematical model of the native map coordinate system of the Lower Austrian and Hungarian parts of the First Military Survey of the Habsburg Empire. Applying it to the mosaic of the scanned original survey sheets provides an acceptable fit by using a linear polynomial fitting with a proper selection of projection centres. The absolute error is quite big in modern terms (up to 2 km as extremities and several hundred metres on average); however, it shows no systematic territorial distortions.
The origin of the applied Cassini projection is the tower of St. Stephen’s Cathedral (Stephansdom), Vienna, for Lower Austria. This suggests that the survey also had a geodetic/triangulation network, based on the Liesganig arc measurements and Cassini’s map of Vienna and the surrounding territories. For Hungary, the projection origin can be acknowledged either at the clock tower of the Petervaradin fortress (now Novi Sad, Serbia) or at the eastern basis point of Colonel Neu’s survey of the southeastern foreland of present-day Budapest. The latter one provides the best orientation of the columns and rows of the survey sheets in the Cassini projection.
The weak (in modern terms), albeit territorially uniform fitting, accuracy can be explained by an existing, yet still not evidenced, first-order triangulation-geodetic basis, with no subordinate networks. The field survey by plane tables may have used the first-order basis only. For this reason, this method alone can certainly not be more accurate than versions with additional corrections. Nevertheless, for the purposes of an overview map, the method is much faster than any other alternative. This is of practical importance as a first step in the georeferencing of other maps of the same era and presumably using the same technology.


