
Verification of Geographic Laws Hidden in Textual Space and Analysis of Spatial Interaction Patterns of Information Flow
Abstract
:1. Introduction
2. Data and Methods
2.1. Data
2.2. Spatial Autocorrelation Analysis
2.2.1. Moran’s I Analysis
- Global Moran’s I
- 2.
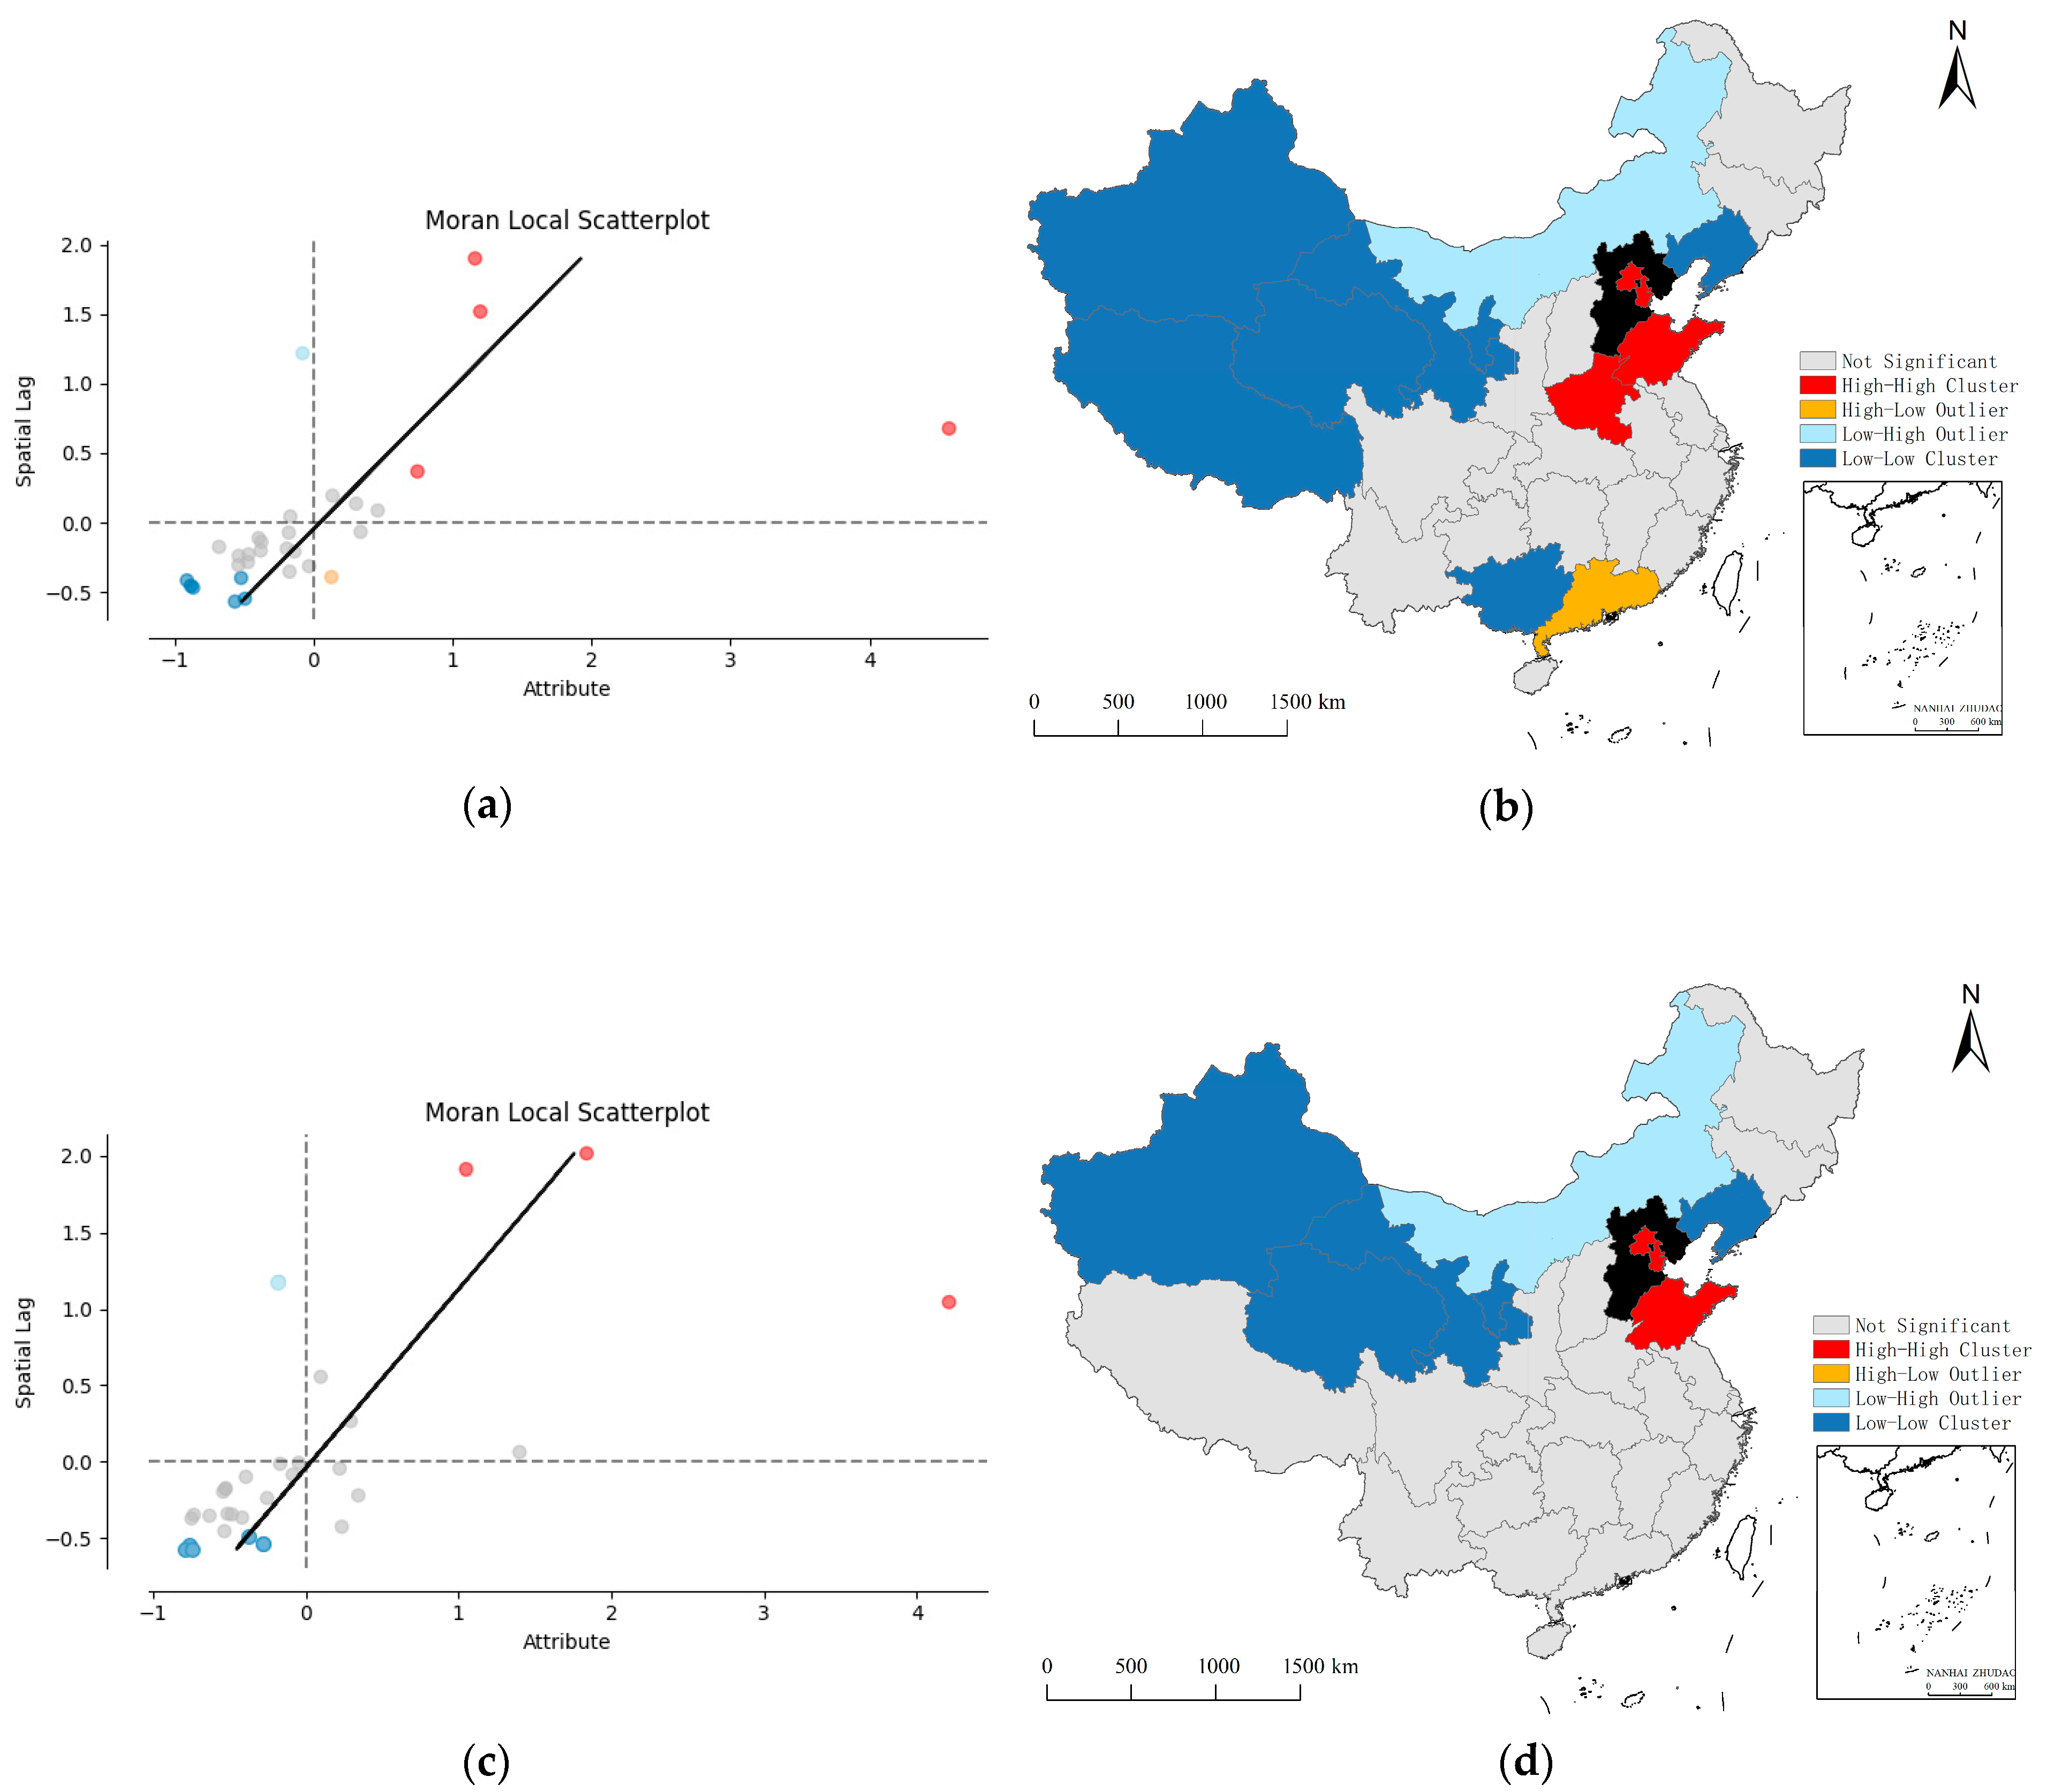
- Local Moran’s I
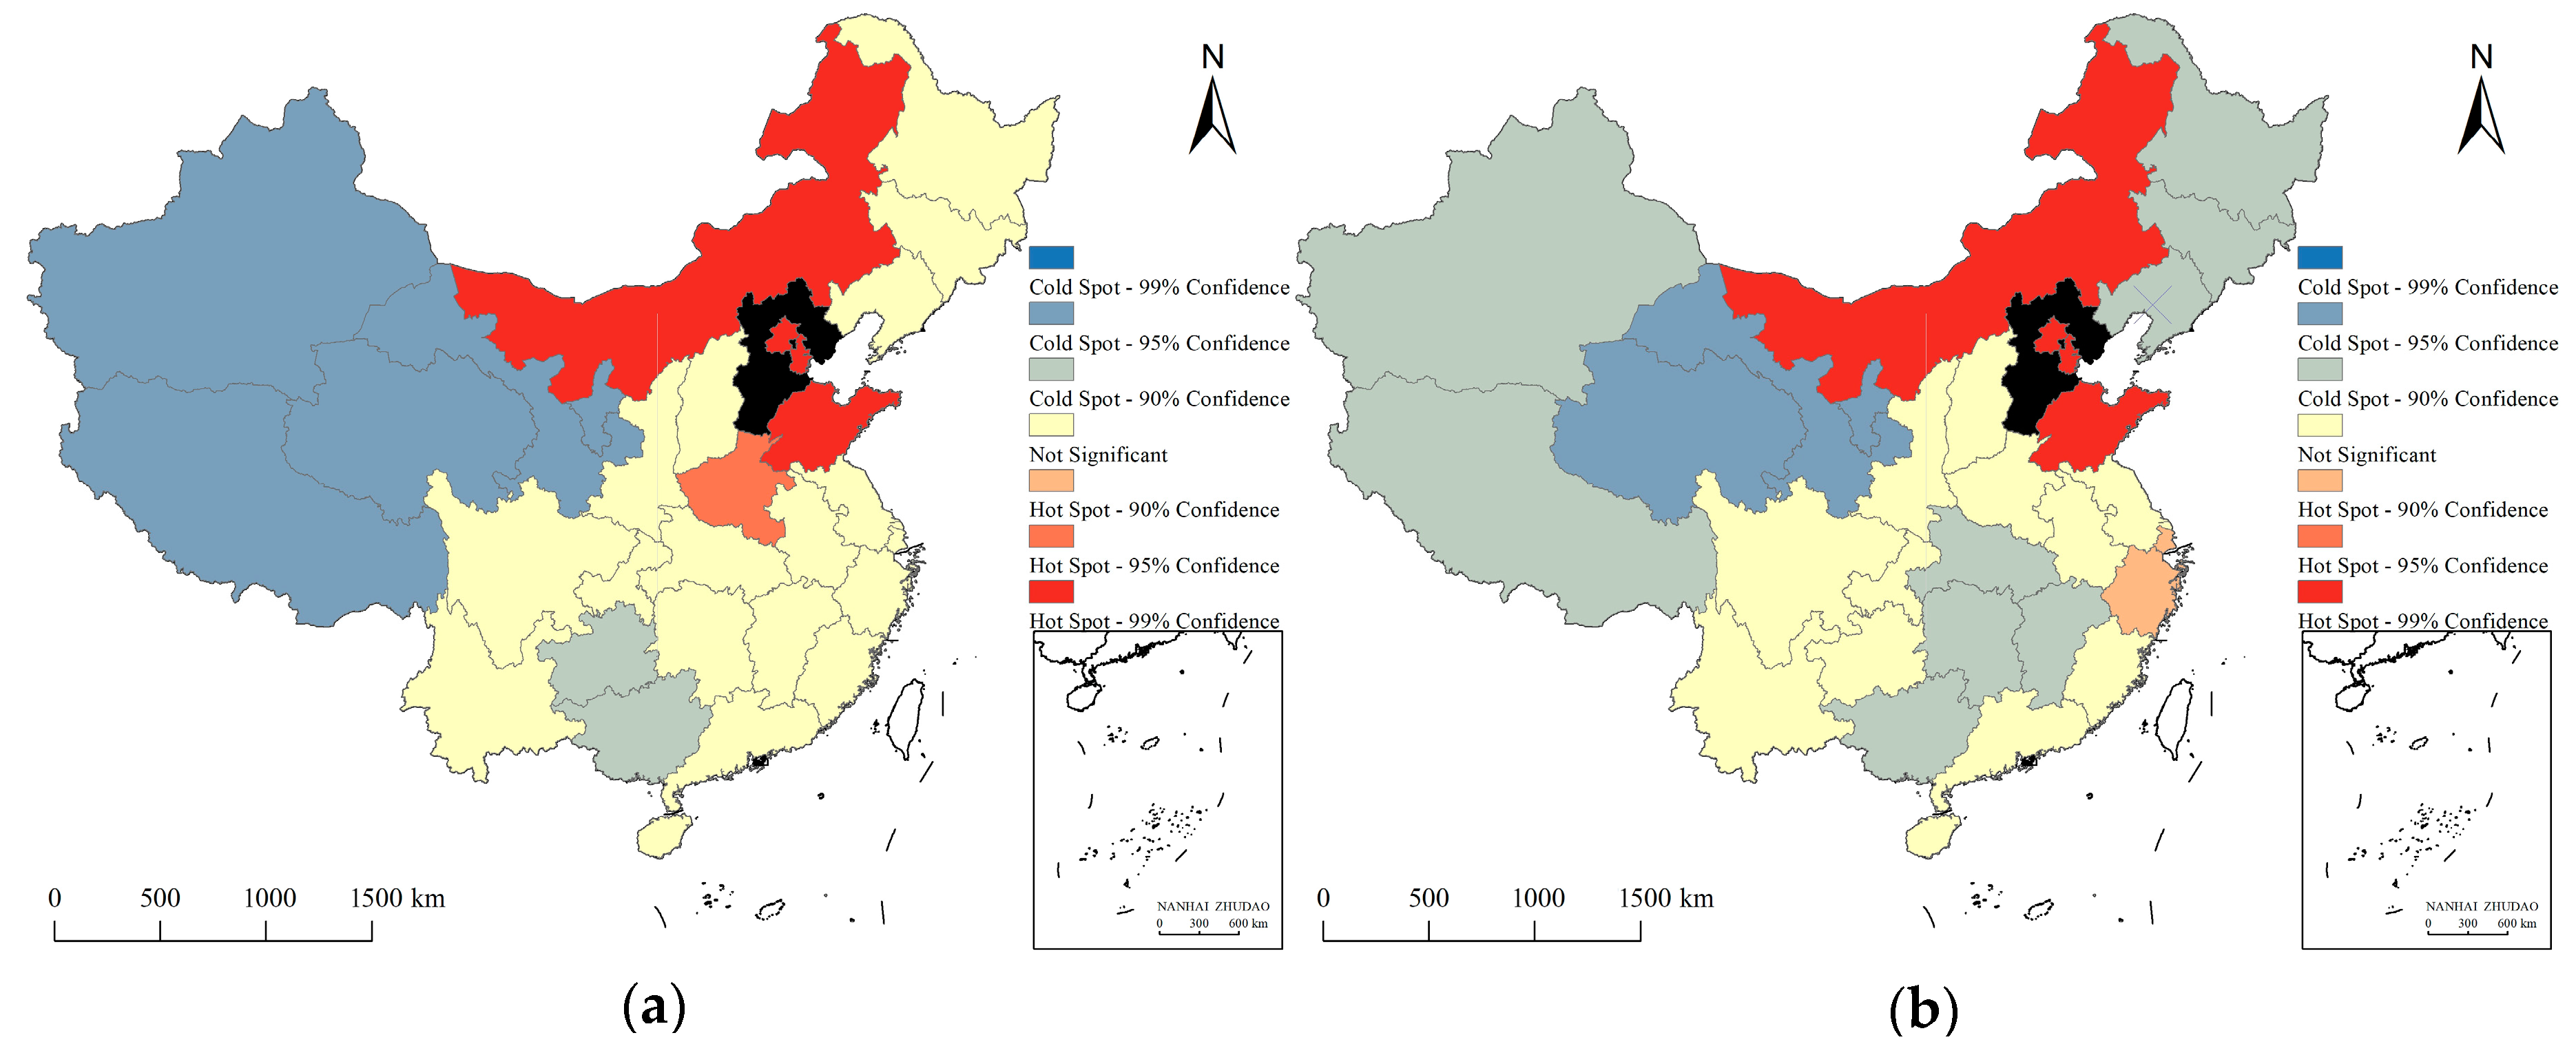
2.2.2. Cold-Hot Spot Analysis
2.3. Distance Decay Effect
2.4. Complex Network Analysis
2.5. Model of Gravity Center
2.6. Entropy Weight Method
3. Results
3.1. Laws of Geography in Information Flow
3.1.1. Discovering Correlation and Heterogeneity
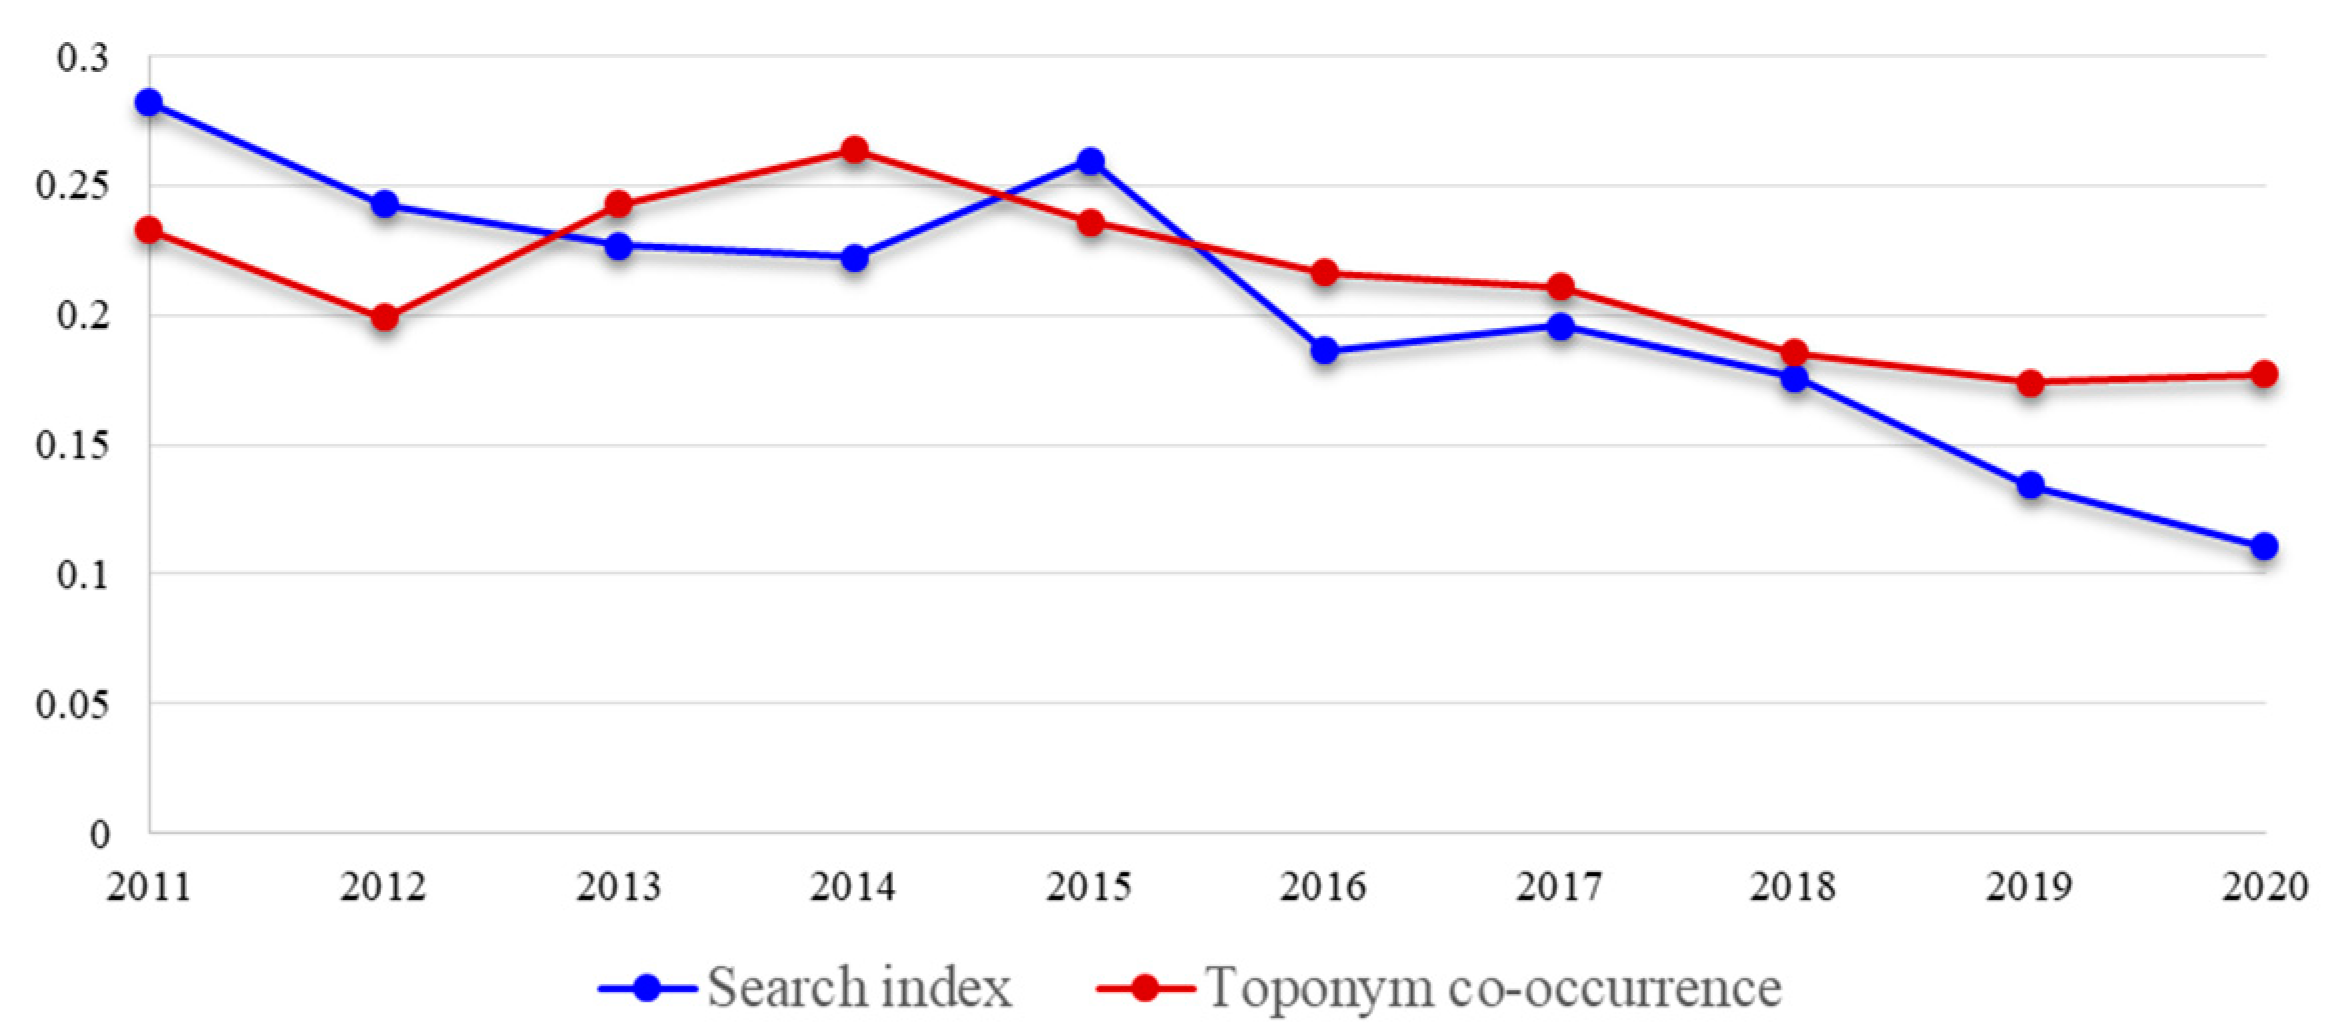
3.1.2. Verifying Distance Decay Effect
3.2. Spatial Interaction Mapping of Geographic Entities
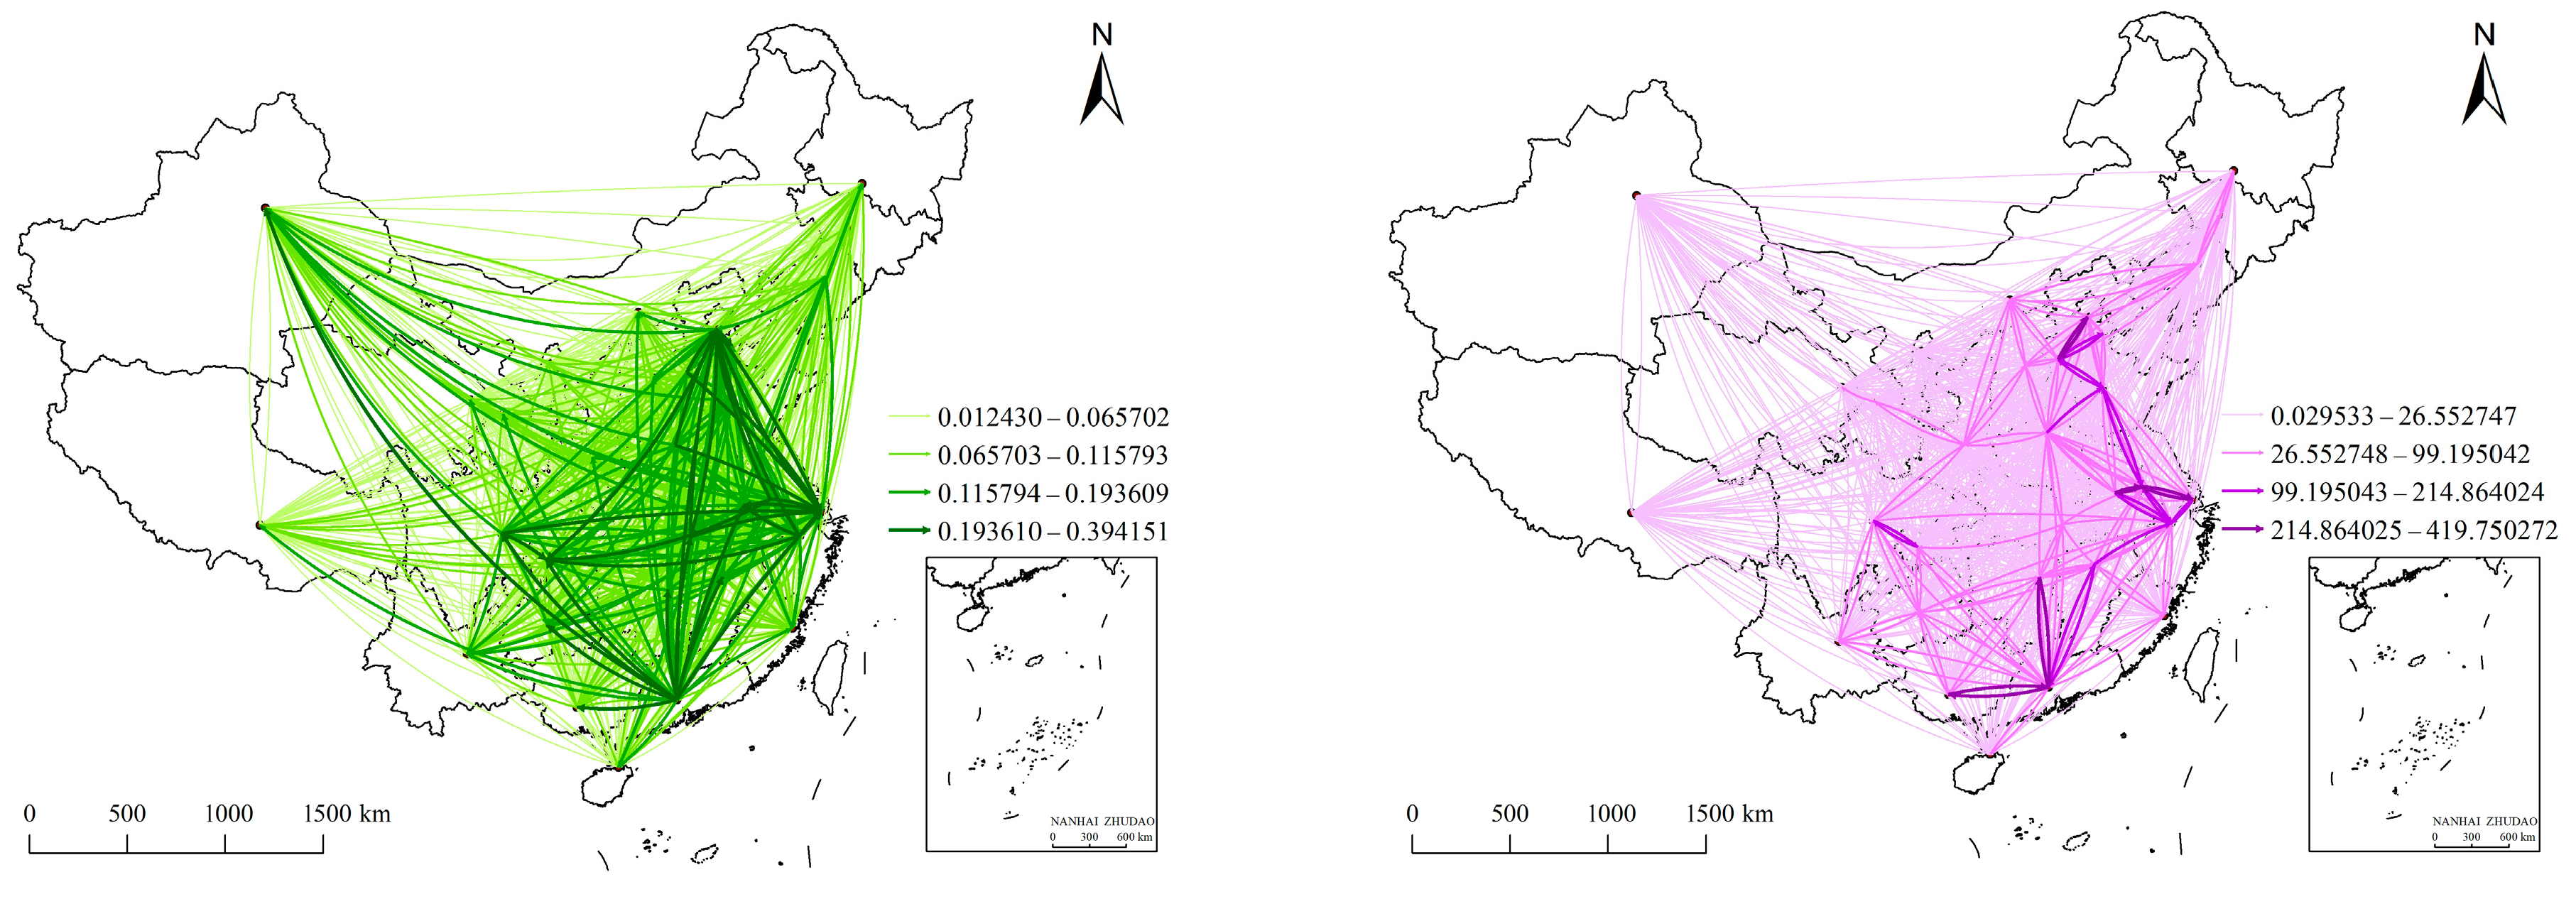
3.2.1. Spatial Interaction Networks of Toponym Co-Occurrence and Search Index
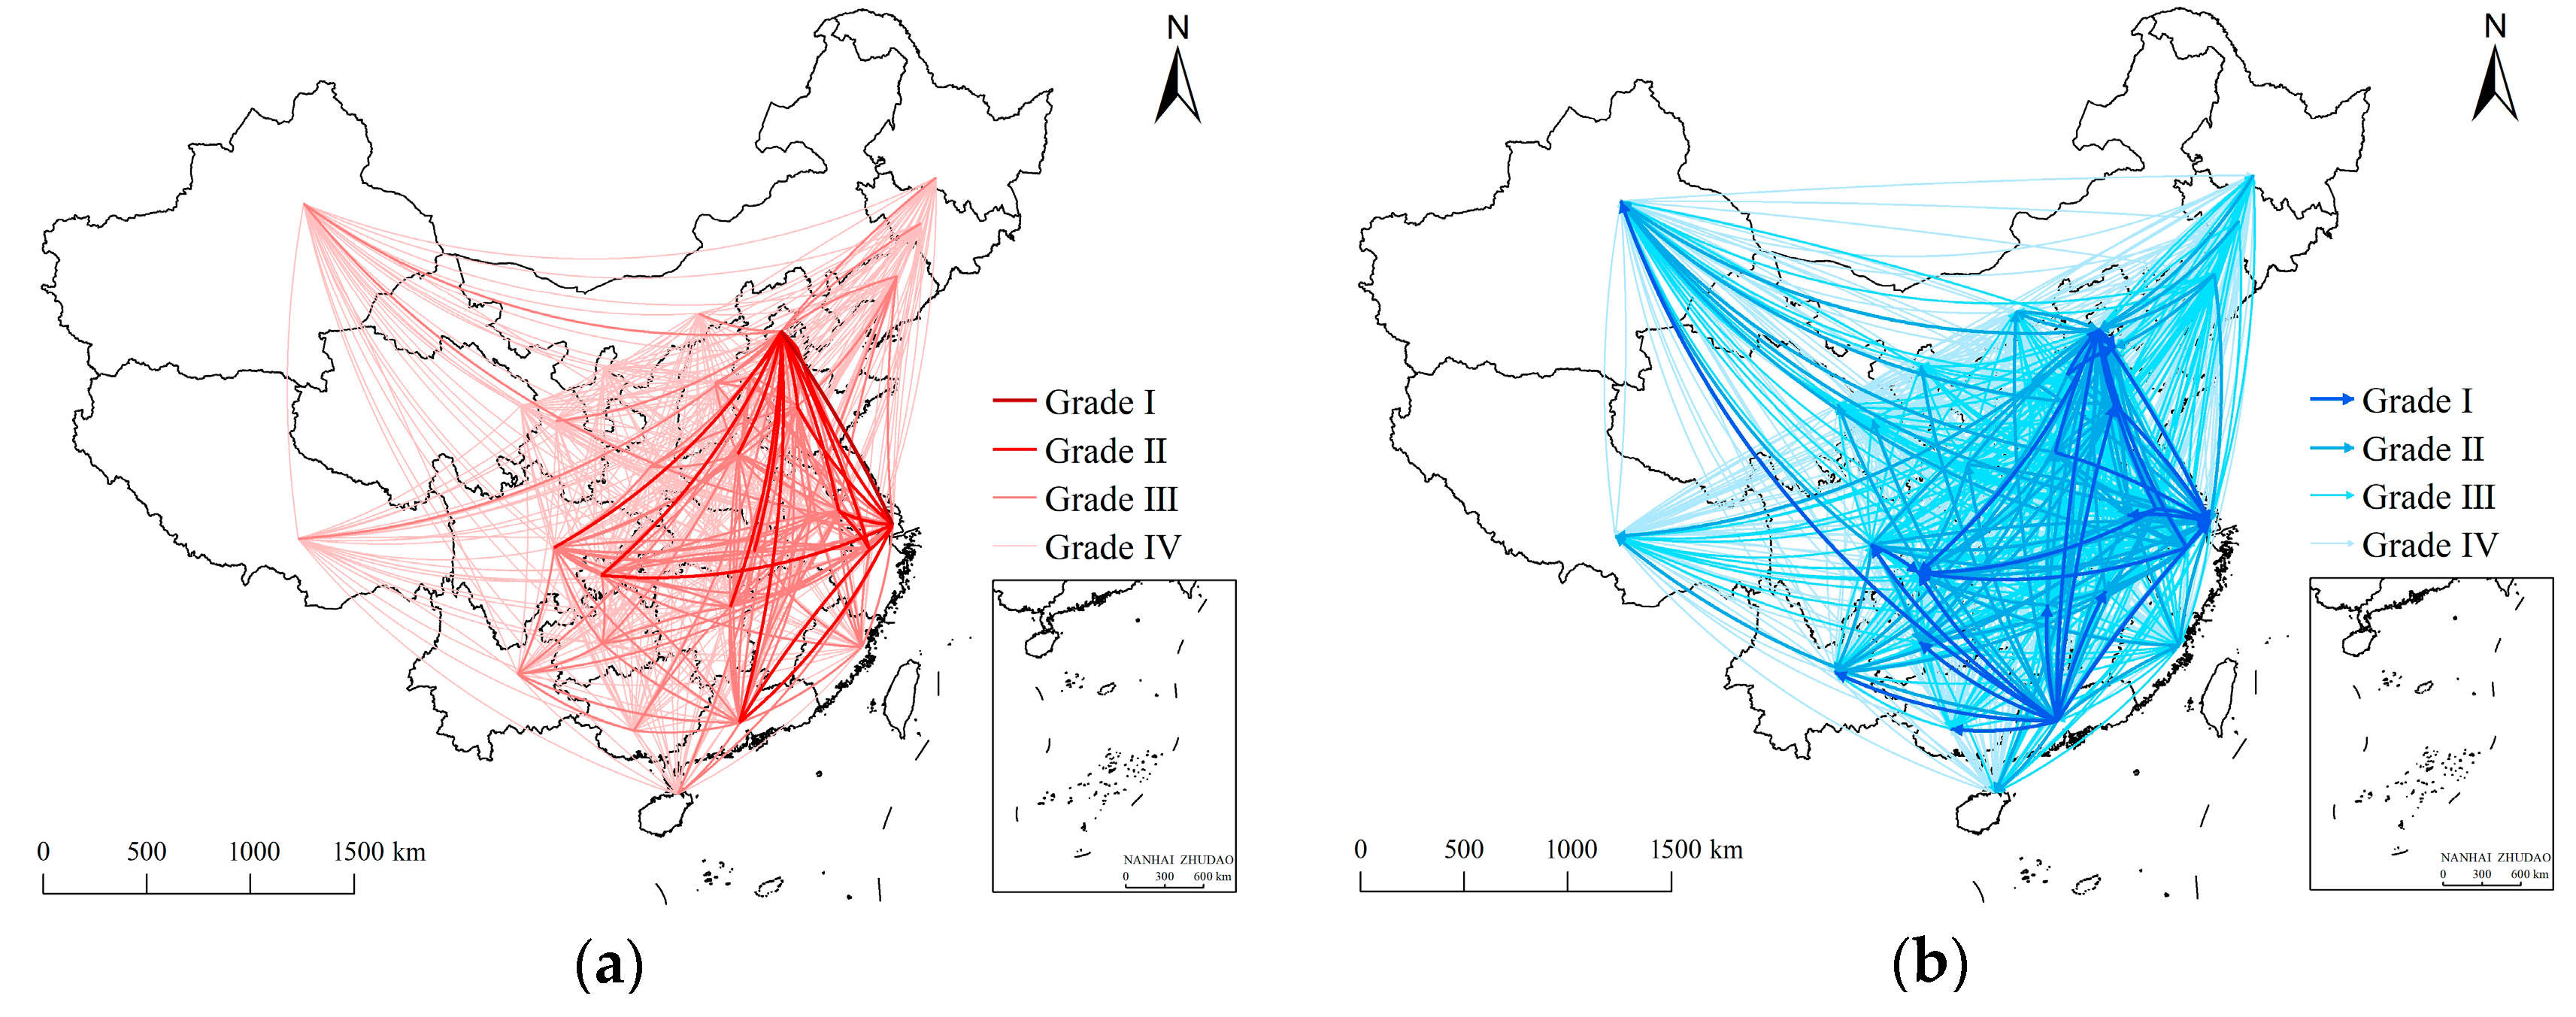
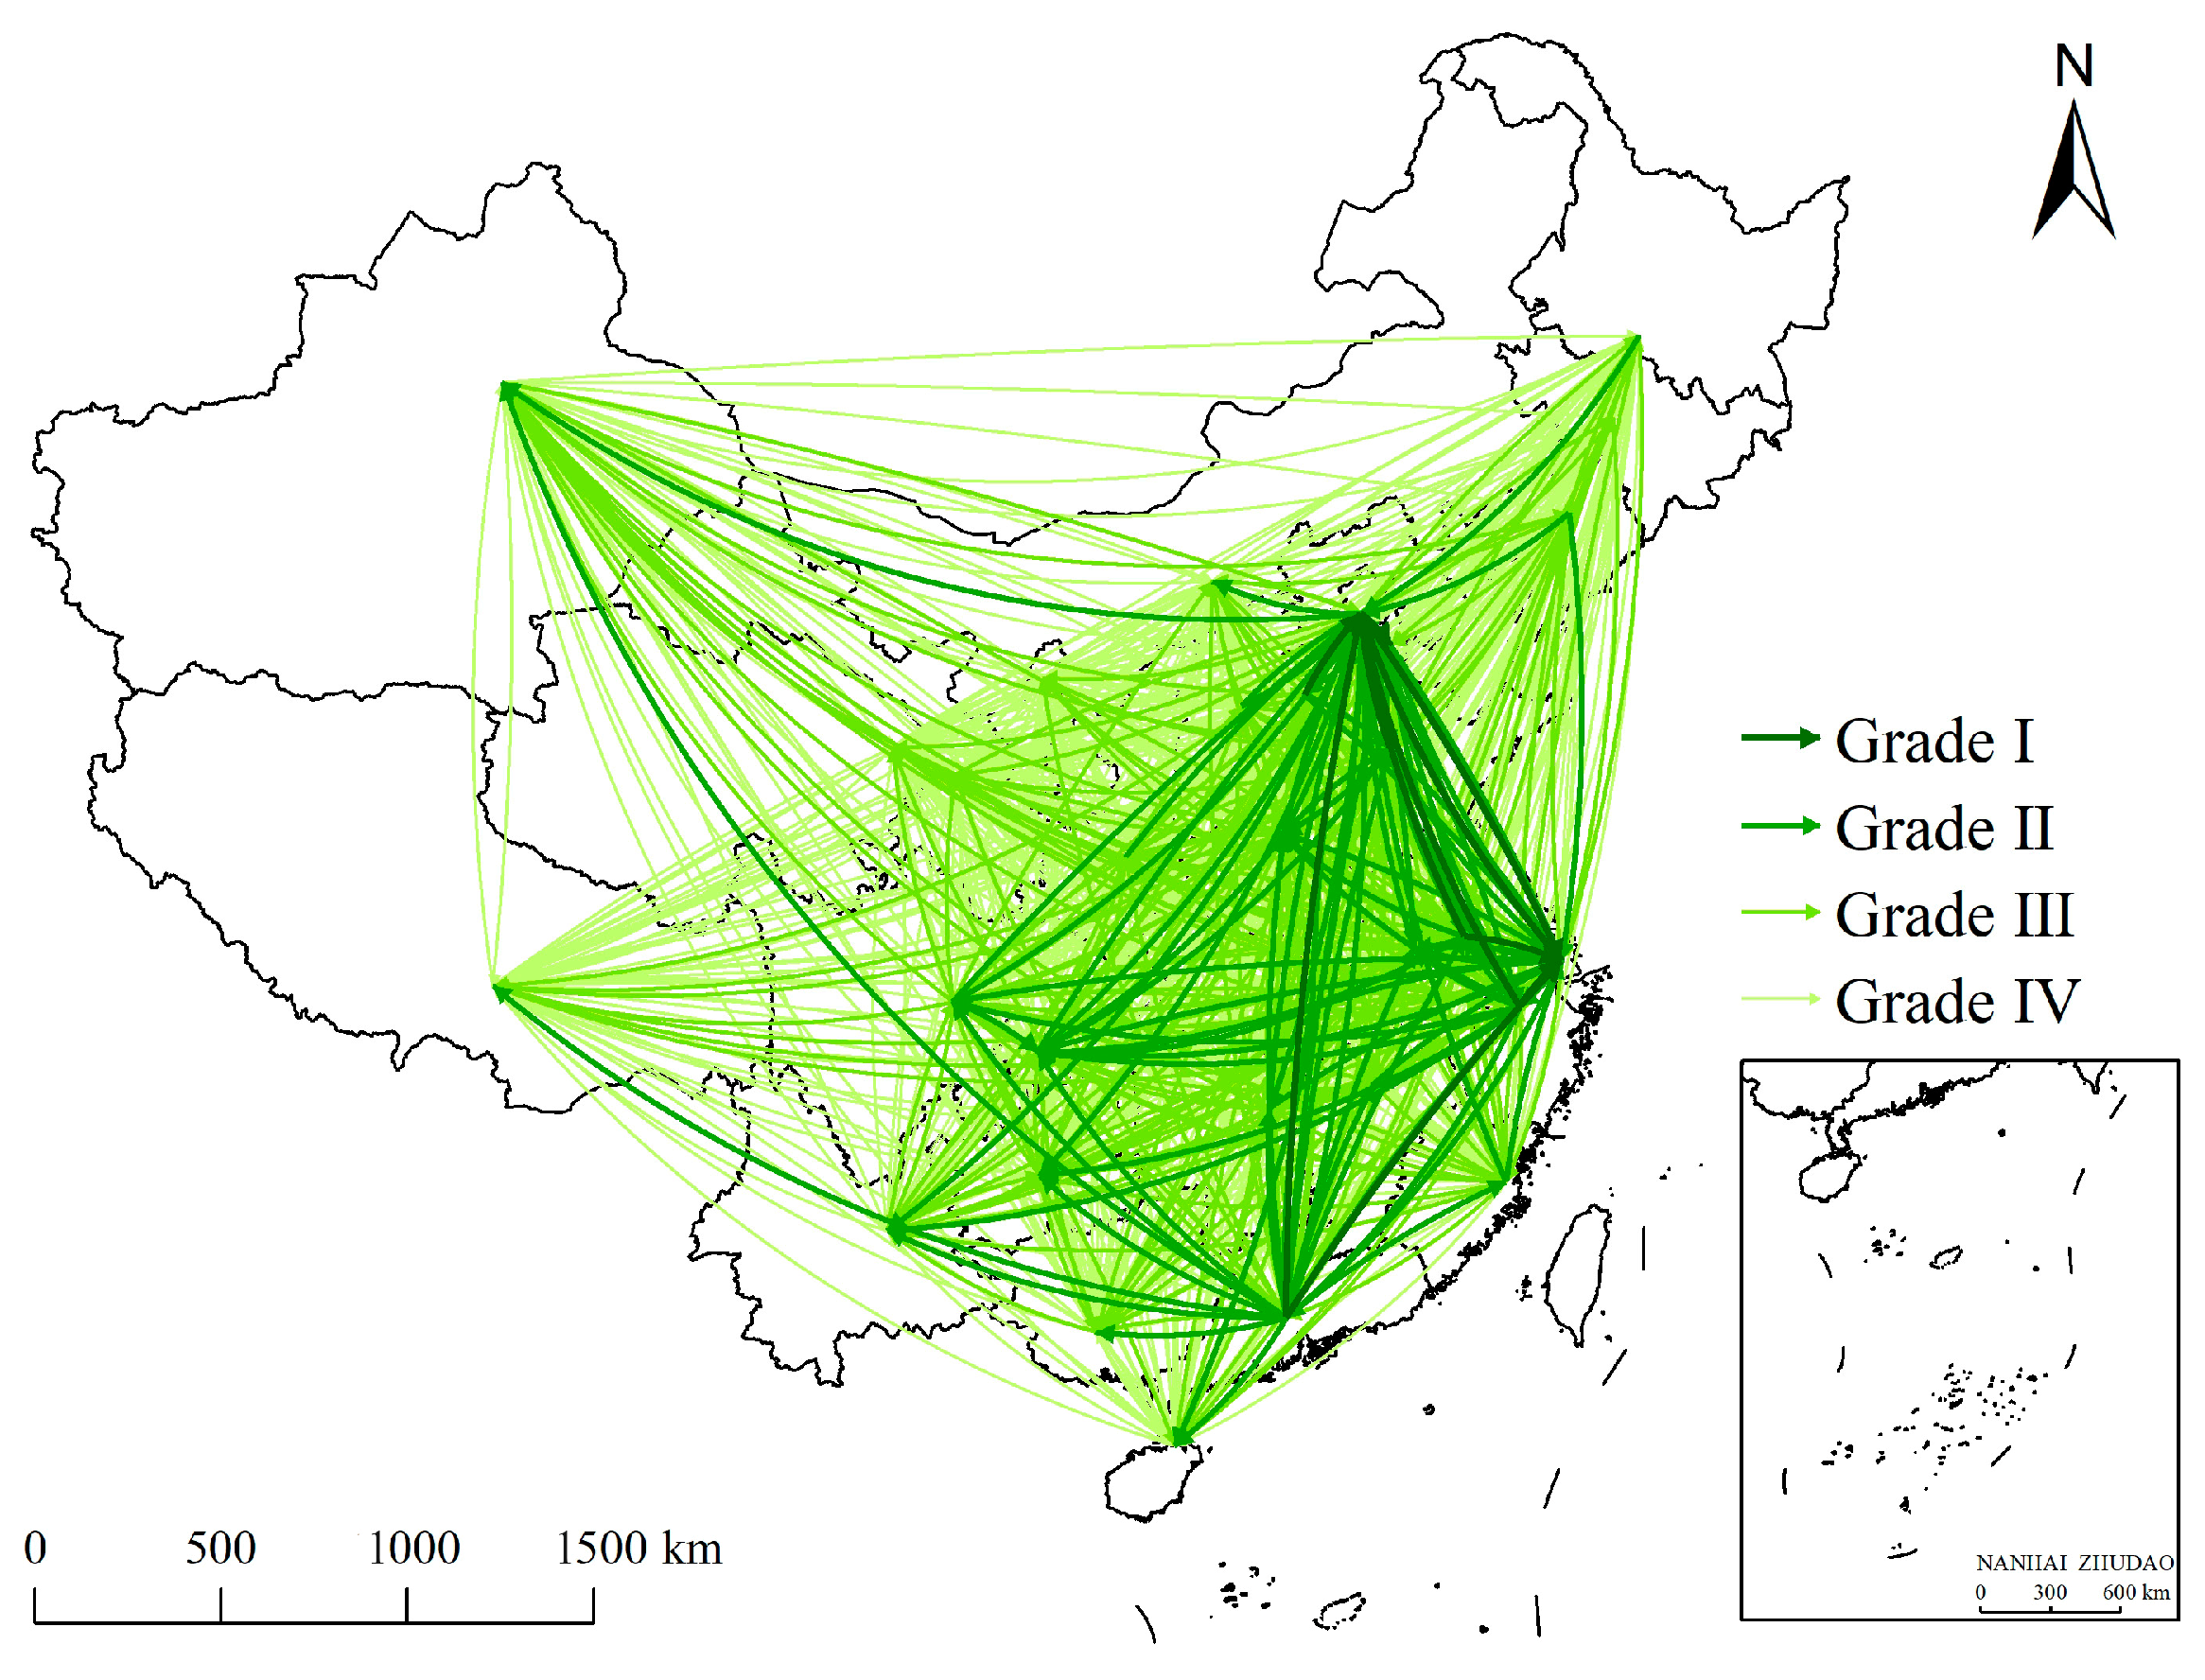
3.2.2. Patterns of Interaction Network Based on Multivariate Information Flow
- Grade I. There are 11 province pairs, accounting for 1.18% of the total amount of interprovincial interaction. The interaction network in this grade is located in eastern China, forming a triangular primary network with Beijing, Shanghai, and Guangdong as the vertices. The network contains bidirectional interaction between Beijing and Shanghai, which shows the prominence of the interaction between the two cities in the spatial interaction of China. In addition, other edges in the network in this grade are also associated with these two cities. Except for the interaction from Beijing to Tianjin, all other interactions are directed from other provinces to Beijing and Shanghai. Since Beijing and Shanghai are, respectively, the political and economic centers of China, and the interactions are obviously distributed across regions, the influence of political and economic factors in this grade network is much greater than that of the distance factor.
- Grade II. There are 92 province pairs, accounting for 9.89% of the total amount of interprovincial interaction. The interaction network in this grade mainly distributes in the eastern and central regions of China and shows obvious cross-regional interaction. It forms an almost diamond-shaped network of interprovincial spatial interaction. The network includes 27 provinces in China. Beijing, Shanghai, Guangdong, and Chongqing have the closest interaction with other provinces, which is the main part of Grade Ⅱ. Among them, Guangdong has the most out-edges and the only in-edge. Combined with the interaction in grade I, although Guangdong has higher interaction strength, it fits the role of a generator in spatial interaction more; that is, its executive force is greater than its attraction.
- Grade III. There are 282 province pairs, accounting for 30.32% of the total amount of interprovincial interaction. The interaction network in this grade is concentrated in the eastern and central regions of China, with increased interaction in the western and northeastern regions, which jointly constitute the general network of interprovincial spatial interaction. The network in this grade covers all provinces in China and adds the interaction between adjacent provinces in which the spatial distance performs a major role. With the expansion of the network scale, the influence of the distance factor increases and is similar to the influence of political and economic factors in this grade.
- Grade IV. There are 545 province pairs, accounting for 58.60% of the total amount of interprovincial interaction. In this grade, the network contains the rest of the spatial interactions of provinces in China. Influenced by the territory of China, the network presents an almost trapezoidal spatial pattern. The network in this grade includes most of the province pairs, which have relatively weak interaction in all aspects of spatial distance, politics, and economy.
3.2.3. Centrality of Information Flow Network
3.2.4. Movement of Gravity Center of Spatial Interaction
3.3. Comparison between Networks of Information Flow and Population Mobility
4. Discussion
4.1. The Laws of Geography in the Information Space
4.2. Spatial Interaction Pattern Based on Information Flow
4.3. Meaning and Future Work
5. Conclusions
Author Contributions
Funding
Data Availability Statement
Acknowledgments
Conflicts of Interest
References
- Liu, Y.; Wang, F.; Kang, C.; Gao, Y.; Lu, Y. Analyzing relatedness by toponym co-occurrences on web pages. Trans. GIS 2014, 18, 89–107. [Google Scholar] [CrossRef]
- Chen, Y.; Zhang, X. Research on the address names census and database building. Bull. Surv. Mapp. 2015, 53, 103–107. [Google Scholar] [CrossRef]
- Hill, L.L. Georeferencing: The Geographic Associations of Information; MIT Press: Cambridge, MA, USA, 2006. [Google Scholar]
- Dai, J.; Xie, F.; Na, K. Research on Network Characteristics of Information Flow of Cities Along the Grand Canal Based on Baidu Index. Urban Dev. Stud. 2022, 29, 7–13. [Google Scholar]
- Liu, Q.; Zhan, Q.; Liu, W.; Yang, C. Research on the characteristics of urban network assocoation and spatial organization structure based on railway passenger flow in Hubei province. J. Geo-Inf. Sci. 2020, 22, 1008–1022. [Google Scholar] [CrossRef]
- Ye, X.; Gong, J.; Li, S. Analyzing asymmetric city connectivity by toponym on social media in China. Chin. Geogr. Sci. 2021, 31, 14–26. [Google Scholar] [CrossRef]
- Sheng, K.; Wang, Y.; Fan, J. Dynamics and mechanisms of the spatial structure of urban network in China: A study based on the corporate networks of top 500 public companies. Econ. Geogr. 2019, 39, 84–93. [Google Scholar] [CrossRef]
- Tu, J.; Luo, Y.; Zhang, Q.; Tang, S.; Wu, Y. Evolution of spatial pattern of economic linkages between cities since the 40th anniversary of reform and opening up. Econ. Geogr. 2019, 39, 1–11. [Google Scholar] [CrossRef]
- Zhi, L.; Li, R.; Fu, X.; Guo, F. Data mining method of hot-toponym and its co-occurrence in crowdsourcing text written by tourists. Sci. Surv. Mapp. 2016, 41, 144–151. [Google Scholar] [CrossRef]
- Zhong, X.; Gao, Y.; Wu, L. Extract core toponyms from web page text based on link analysis. J. Geo-Inf. Sci. 2016, 18, 435–442. [Google Scholar]
- Wang, X.; Zhang, R.; Zhang, Y. Toponym resolution based on geo-relevance and D-S theory. Acta Sci. Nat. Univ. Pekin. 2017, 53, 344–352. [Google Scholar] [CrossRef]
- Wu, J.; Feng, Z.; Zhang, X.; Xu, Y.; Peng, J. Delineating urban hinterland boundaries in the Pearl River Delta: An approach integrating toponym co-occurrence with field strength model. Cities 2020, 96, 102457. [Google Scholar] [CrossRef]
- Lin, J.; Li, X. Simulating urban growth in a metropolitan area based on weighted urban flows by using web search engine. Int. J. Geogr. Inf. Sci. 2015, 29, 1721–1736. [Google Scholar] [CrossRef]
- Hu, Y.; Ye, X.; Shaw, S.-L. Extracting and analyzing semantic relatedness between cities using news articles. Int. J. Geogr. Inf. Sci. 2017, 31, 2427–2451. [Google Scholar] [CrossRef]
- Meijers, E.; Peris, A. Using toponym co-occurrences to measure relationships between places: Review, application and evaluation. Int. J. Urban Sci. 2019, 23, 246–268. [Google Scholar] [CrossRef]
- Zhong, X.; Liu, J.; Gao, Y.; Wu, L. Analysis of co-occurrence toponyms in web pages based on complex networks. Phys. Stat. Mech. Its Appl. 2017, 466, 462–475. [Google Scholar] [CrossRef]
- Hu, D.; Li, R.; Meng, Y.; Wu, H. China’s urban network from the perspective of toponym co⁃occurrences in the news. Geomat. Inf. Sci. Wuhan Univ. 2020, 45, 281–288. [Google Scholar] [CrossRef]
- Zhang, W.; Thill, J.-C. Mesoscale Structures in World City Networks. Ann. Am. Assoc. Geogr. 2019, 109, 887–908. [Google Scholar] [CrossRef]
- Han, J.; Ming, Q.; Shi, P.; Luo, D. The structural characteristics and influencing factors of tourism information flow network in China based on Baidu index. J. Shaanxi Norm. Univ. Sci. Ed. 2021, 49, 43–53. [Google Scholar] [CrossRef]
- Liu, Y.; Liao, W. Spatial Characteristics of the Tourism Flows in China: A Study Based on the Baidu Index. ISPRS Int. J. Geo-Inf. 2021, 10, 378. [Google Scholar] [CrossRef]
- Huang, X.; Sun, B.; Zhang, T. The influence of geographical distance on the dissemination of internet information in the internet. Acta Geogr. Sin. 2020, 75, 722–735. [Google Scholar]
- Xu, Y.; Lu, L.; Zhao, H. Dynamic Evolution and Spatial Differences of Network Attention in Wuzhen Scenic Area. Econ. Geogr. 2020, 40, 200–210. [Google Scholar] [CrossRef]
- Zong, H.; Hao, L.; Dai, J. Study of Urban Network Structure in Chengdu-Chongqing Economic Circle Based on Baidu lndex. J. Southwest Univ. Sci. Ed. 2022, 44, 36–45. [Google Scholar] [CrossRef]
- Guo, H.; Zhang, W.; Du, H.; Kang, C.; Liu, Y. Understanding China’s urban system evolution from web search index data. EPJ Data Sci. 2022, 11, 20. [Google Scholar] [CrossRef]
- Wei, S.; Pan, J. Resilience of Urban Network Structure in China: The Perspective of Disruption. ISPRS Int. J. Geo-Inf. 2021, 10, 796. [Google Scholar] [CrossRef]
- Yu, Y.; Song, Z.; Shi, K. Network Pattern of Inter-Provincial lnformation Connection and Its Dynamic Mechanism in China:Based on Baidu lndex. Econ. Geogr. 2019, 39, 147–155. [Google Scholar] [CrossRef]
- Wang, N.; Chen, R.; Zhao, Y.; Zhong, S. The information space and the Balkans phenomenon of the Chinese provinces. Econ. Geogr. 2016, 36, 17–24. [Google Scholar] [CrossRef]
- Chen, Y.; Li, K.; Zhou, Q.; Zhang, Y. Can Population Mobility Make Cities More Resilient? Evidence from the Analysis of Baidu Migration Big Data in China. Int. J. Environ. Res. Public Health 2022, 20, 36. [Google Scholar] [CrossRef]
- Liu, Y.; Gong, L.; Tong, Q. Quantifying the Distance Effect in Spatial Interactions. Acta Sci. Nat. Univ. Pekin. 2014, 50, 526–534. [Google Scholar] [CrossRef]
- Wang, H.; Zhang, B.; Liu, Y.; Liu, Y.; Xu, S.; Zhao, Y.; Chen, Y.; Hong, S. Urban expansion patterns and their driving forces based on the center of gravity-GTWR model: A case study of the Beijing-Tianjin-Hebei urban agglomeration. J. Geogr. Sci. 2020, 30, 297–318. [Google Scholar] [CrossRef]
- Zhou, R.; Liu, G.; Zhang, Y. Sustainability evaluation and spatial heterogeneity of urban agglomerations: A China case study. Discov. Sustain. 2021, 2, 1. [Google Scholar] [CrossRef]
- Liu, Y.; Yao, X.; Gong, Y.; Kang, C.; Shi, X.; Wang, F.; Wang, J.; Zhang, Y.; Zhao, P.; Zhu, D.; et al. Analytical methods and applications of spatial interactions in the era of big data. Acta Geogr. Sin. 2020, 75, 1523–1538. [Google Scholar]
- Tobler, W.R. A computer movie simulating urban growth in the detroit region. Econ. Geogr. 1970, 46, 234–240. [Google Scholar] [CrossRef]
- Goodchild, M.F. GIScience, Geography, Form, and Process. Ann. Assoc. Am. Geogr. 2004, 94, 709–714. [Google Scholar]
- Chen, M.; Liu, W.; Yeerken, W.; Gong, Y. The impact of the Belt and Road Initiative on the pattern of the development of urbanization in China. Mt. Res. 2016, 34, 637–644. [Google Scholar] [CrossRef]
- Zhao, Z. How the west area of China is not far away: To accelerate the process of China’s westward economic development. West Forum 2019, 29, 64–70. [Google Scholar] [CrossRef]
- Liang, L.; Xian, Y.; Chen, M. Evolution Trend and Influencing Factors of Regional Population and Economy Gravity Center in China Since the Reform and Opening-up. Econ. Geogr. 2022, 42, 93–103. [Google Scholar] [CrossRef]
- Wang, L.; Liu, H.; Liu, Q. China’s city network based on Tencent’s migration big data. Acta Geogr. Sin. 2021, 76, 853–869. [Google Scholar]
- Li, B.; Gao, S.; Liang, Y.; Kang, Y.; Prestby, T.; Gao, Y.; Xiao, R. Estimation of regional economic development indicator from transportation network analytics. Sci. Rep. 2020, 10, 2647. [Google Scholar] [CrossRef]
- Peng, H.; Du, Y.; Liu, Z.; Yi, J.; Kang, Y.; Fei, T. Uncovering patterns of ties among regions within metropolitan areas using data from mobile phones and online mass media. GeoJournal 2019, 84, 685–701. [Google Scholar] [CrossRef]
- Zhao, Z.; Wei, Y.; Yang, R.; Wang, S.; Zhu, Y. Gravity model coefficient calibration and error estimation: Based on Chinese interprovincial population flow. Acta Geogr. Sin. 2019, 74, 203–221. [Google Scholar] [CrossRef]
- Fan, J.; Wang, Y.; Liang, B. The evolution process and regulation of China’s regional development pattern. Acta Geogr. Sin. 2019, 74, 2437–2454. [Google Scholar] [CrossRef]
- Sheng, Y.; Yang, X. Spatial patterns and mechanisms of the floating population agglomeration among top three city clusters in China. Popul. Econ. 2021, 88–107. [Google Scholar]
- Zhang, W.; Yan, J.; Nie, G. Evolution of the pattern of China’s urban population flows and its proximate determinants. Chin. J. Popul. Sci. 2021, 35, 76–87. [Google Scholar]
- Wang, J.; Xu, J.; Xia, J. Study on the spatial correlation structure of China’s tourism economic and its effect: Based on social network analysis. Tour. Trib. 2017, 32, 15–26. [Google Scholar] [CrossRef]
- Zhao, Y.; Zhu, L.; Ma, B.; Xu, Y.; Jiang, B. Characteristics of inter-provincial network connection based on railway freight flow in China, 1998-2016. Sci. Geogr. Sin. 2020, 40, 1671–1678. [Google Scholar] [CrossRef]
- Barabási, A.-L. Network Science; Cambridge University Press: Cambridge, UK, 2016. [Google Scholar]


| Time Period | Time Accuracy of Acquisition | Time Accuracy of Research | Sample Size per Unit of Time | Description | |
|---|---|---|---|---|---|
| Toponym co-occurrence | 2011 to 2020 | Year | Year | 31 × 31 | Represented by co-occurrence news volume, it reflects the connection strength between provinces in real-life events. |
| Search index | 2011 to 2020 | Day | Year | 31 × 31 | Calculated by weighting the search frequency of provinces, it reflects the interprovincial attention generated by internet user behavior. |
| Migration ratio | 2020 | Day | Year | 31 × 31 | Represented as the proportion of migration, it reflects the proportion of population migration from each province to other provinces. |
| Migration scale index | 2020 | Day | Year | 31 | It reflects the scale of population migration in each province. |
| Coordinates | 31 | Represented by the longitude and latitude of each provincial capital, it is used to calculate the gravity center of interaction and the Euclidean distance between provinces. |
| Spatial Correlation | ||
|---|---|---|
| The interaction strength of entity i is high, and the strength of its surrounding areas is high (H–H). | ||
| The interaction strength of entity i is high, but the strength of its surrounding areas is low (H–L). | ||
| The interaction strength of entity i is low, but the strength of its surrounding areas is high (L–H). | ||
| The interaction strength of entity i is low, and the strength of its surrounding areas is low (H–H). |
| Toponym Co-Occurrence | Search Index | ||||
|---|---|---|---|---|---|
| Province | Moran’s I | Z-Score | Province | Moran’s I | Z-Score |
| Hebei | 0.740711 | 7.642184 | Beijing | 0.808857 | 5.998074 |
| Anhui | 0.719599 | 5.449721 | Hebei | 0.785282 | 7.149060 |
| Shanxi | 0.681523 | 6.109955 | Tianjin | 0.765024 | 6.607754 |
| Jiangxi | 0.660554 | 4.982462 | Anhui | 0.759295 | 5.829506 |
| Shandong | 0.649321 | 5.597223 | Shanghai | 0.688321 | 5.241796 |
| Jiangsu | 0.644998 | 5.151514 | Shandong | 0.683801 | 5.430812 |
| Tianjin | 0.643374 | 6.270135 | Guangdong | 0.663948 | 5.055511 |
| Henan | 0.628473 | 5.221496 | Shanxi | 0.660656 | 5.696736 |
| Liaoning | 0.619655 | 5.357829 | Liaoning | 0.660091 | 5.490013 |
| Fujian | 0.615384 | 4.803019 | Zhejiang | 0.646384 | 5.280391 |
Disclaimer/Publisher’s Note: The statements, opinions and data contained in all publications are solely those of the individual author(s) and contributor(s) and not of MDPI and/or the editor(s). MDPI and/or the editor(s) disclaim responsibility for any injury to people or property resulting from any ideas, methods, instructions or products referred to in the content. |
© 2023 by the authors. Licensee MDPI, Basel, Switzerland. This article is an open access article distributed under the terms and conditions of the Creative Commons Attribution (CC BY) license (https://creativecommons.org/licenses/by/4.0/).
Share and Cite
Liu, L.; Li, H.; Pei, D.; Liu, S. Verification of Geographic Laws Hidden in Textual Space and Analysis of Spatial Interaction Patterns of Information Flow. ISPRS Int. J. Geo-Inf. 2023, 12, 217. https://doi.org/10.3390/ijgi12060217
Liu L, Li H, Pei D, Liu S. Verification of Geographic Laws Hidden in Textual Space and Analysis of Spatial Interaction Patterns of Information Flow. ISPRS International Journal of Geo-Information. 2023; 12(6):217. https://doi.org/10.3390/ijgi12060217
Chicago/Turabian StyleLiu, Lin, Hang Li, Dongmei Pei, and Shuai Liu. 2023. "Verification of Geographic Laws Hidden in Textual Space and Analysis of Spatial Interaction Patterns of Information Flow" ISPRS International Journal of Geo-Information 12, no. 6: 217. https://doi.org/10.3390/ijgi12060217