
HexTile: A Hexagonal DGGS-Based Map Tile Algorithm for Visualizing Big Remote Sensing Data in Spark


Abstract
:1. Introduction
2. Materials and Methods
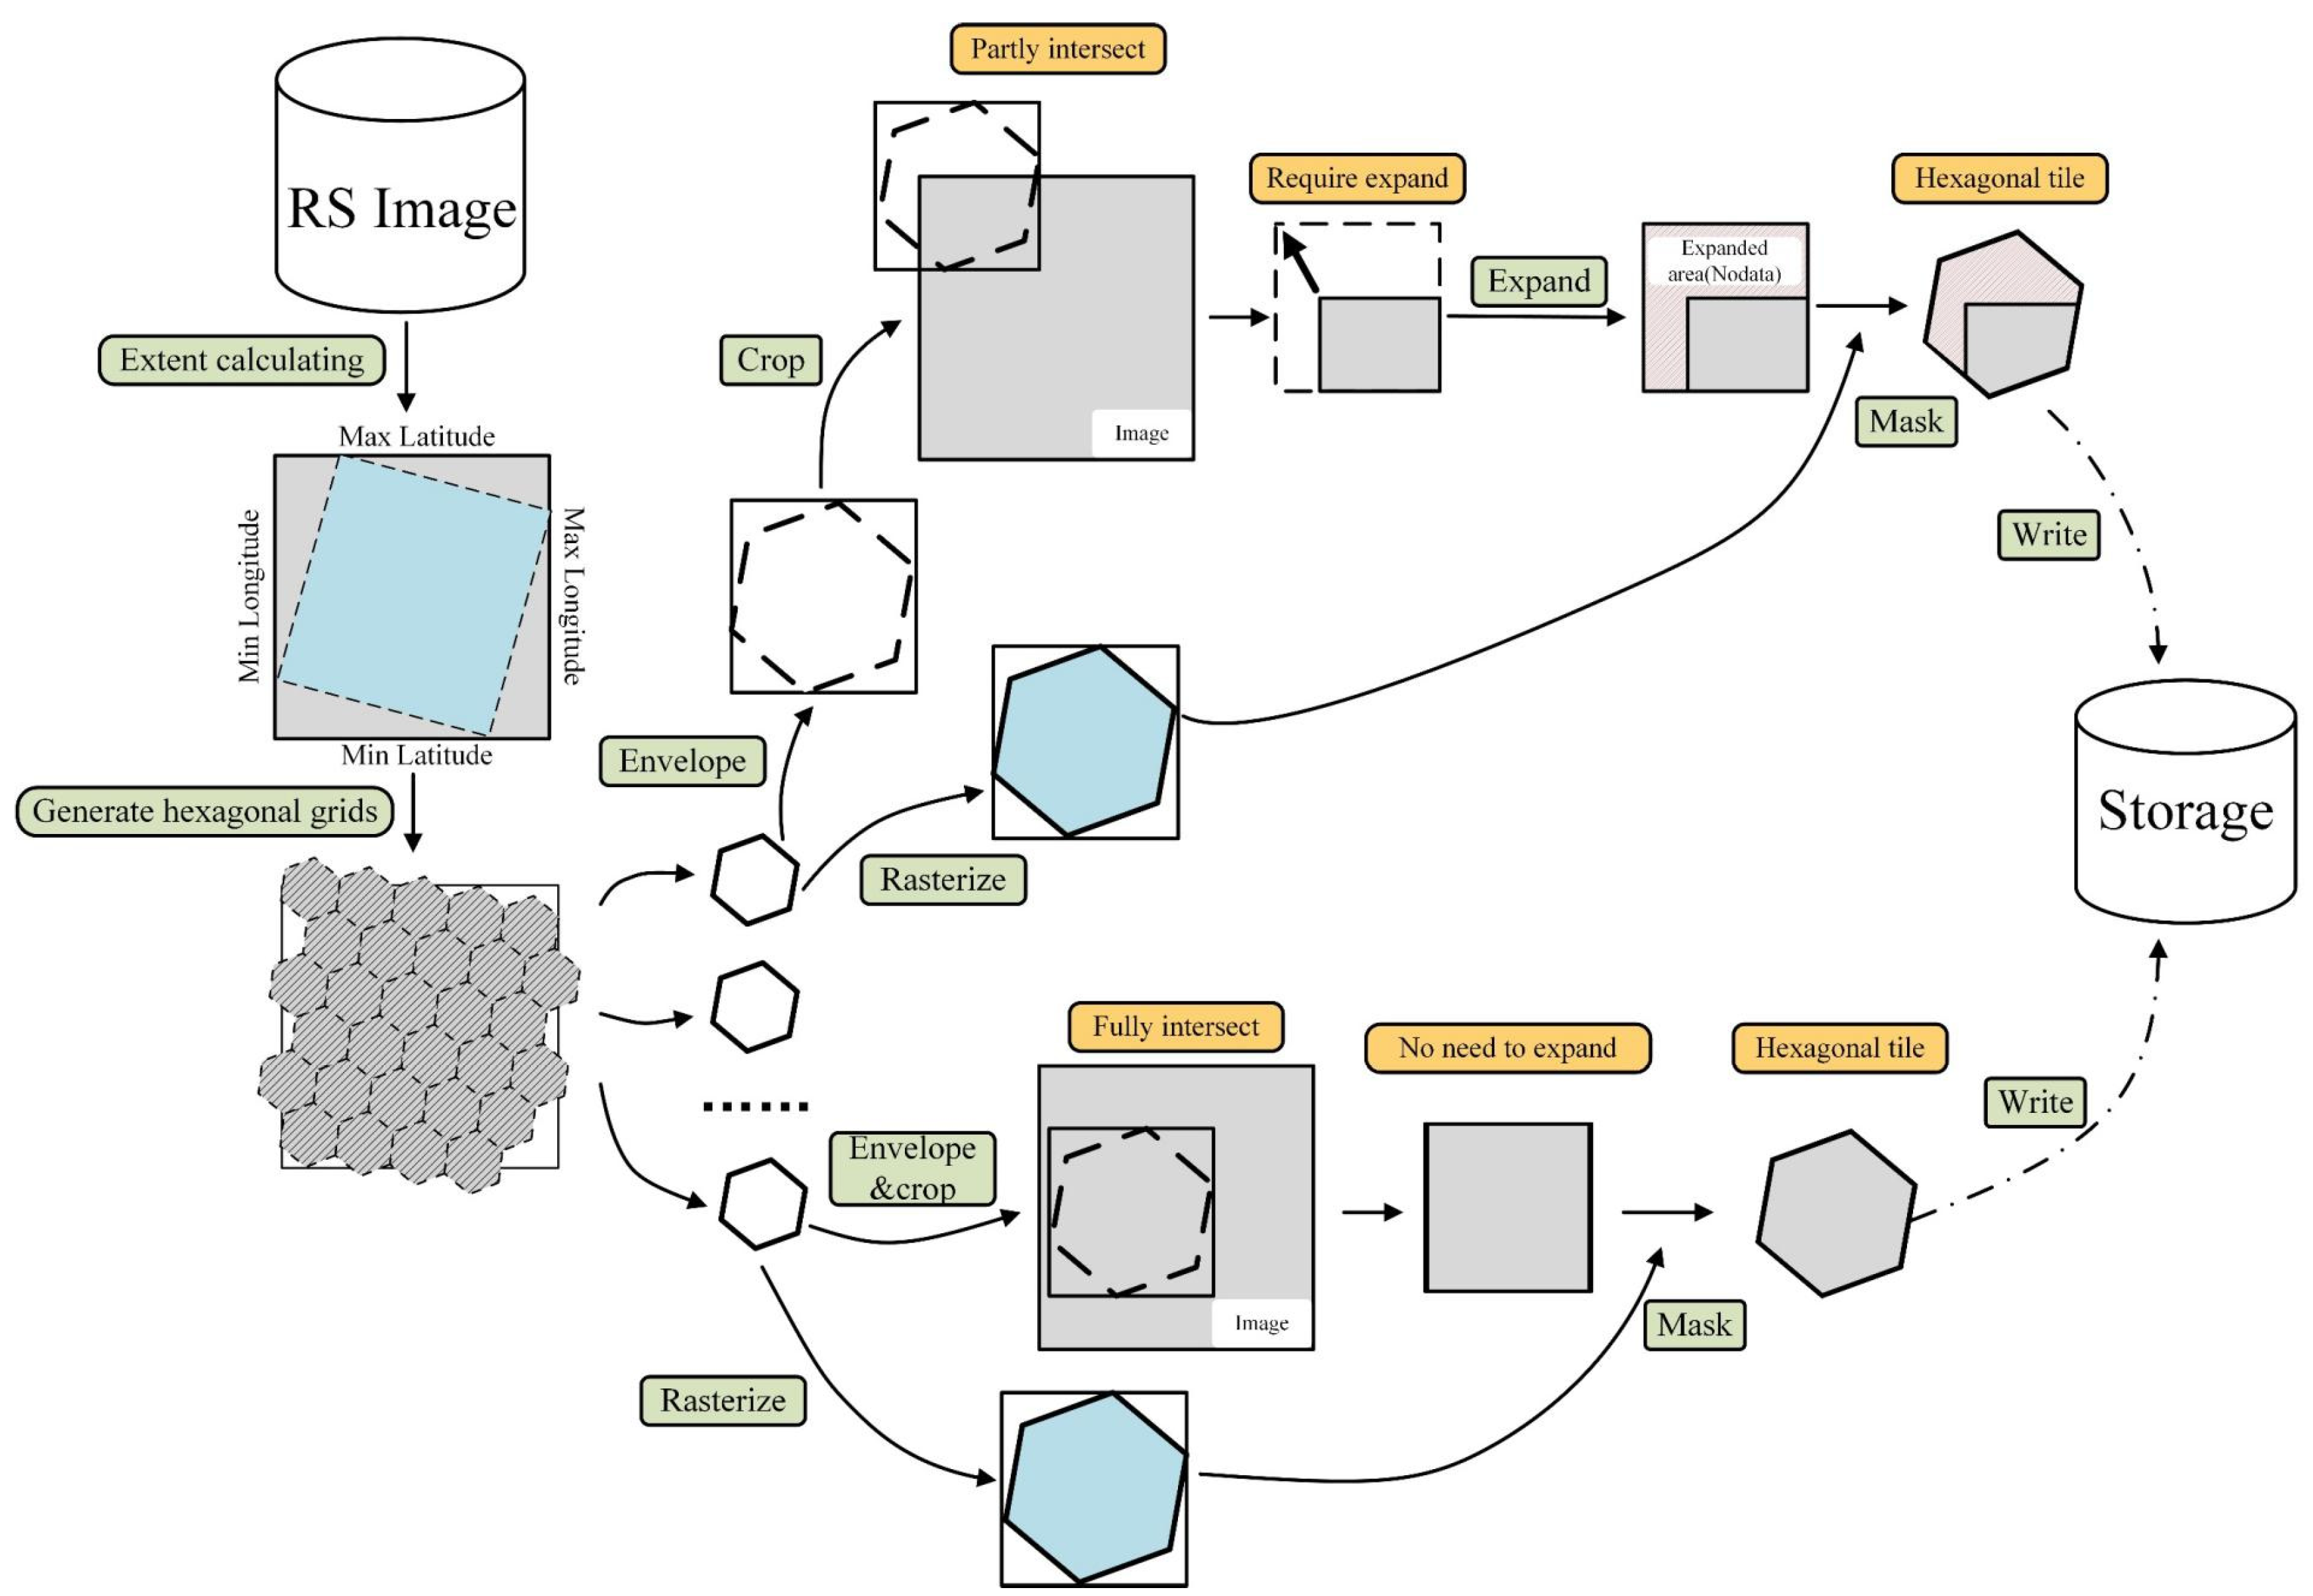
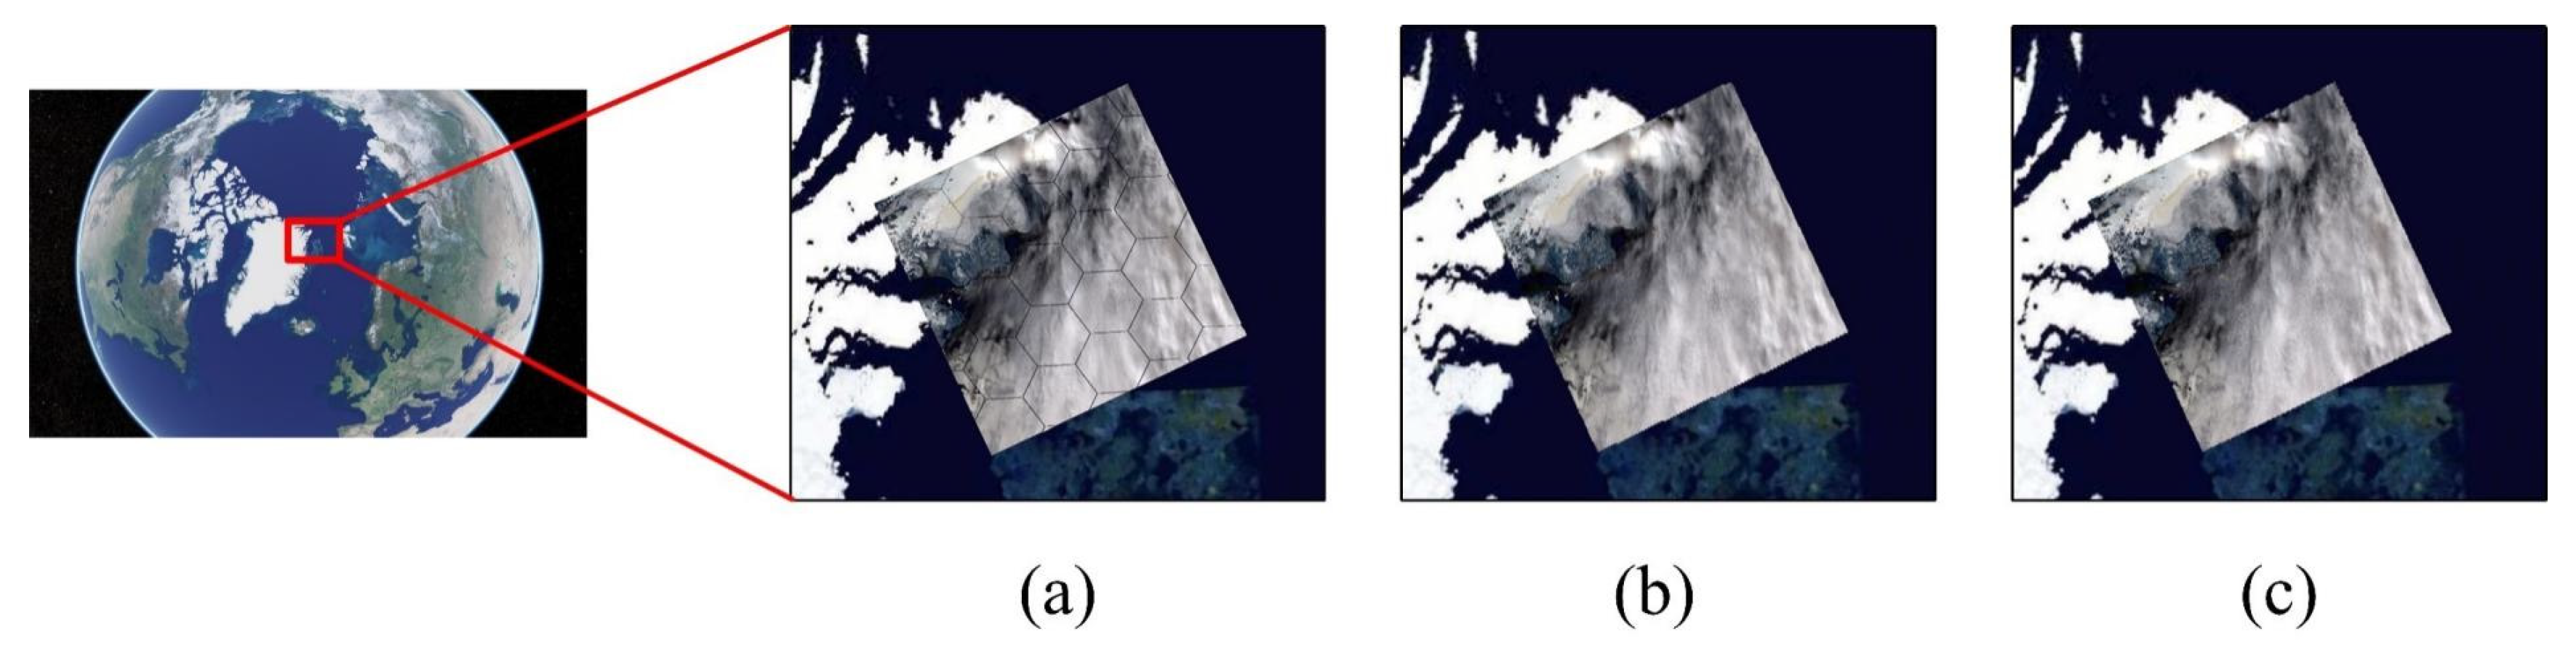
2.1. Hexagonal Slicing for Remote Sensing Data
| Algorithm 1: The pseudocode of remote sensing data hexagonal slicing |
| Input: Remote Sensing Image Output: hexagon Tiles 1. Calculate the extent of image. 2. Generate the list of hexagons covering the image according to the extent. 3. Loop for each hexagon. foreach hexagon in hexagon listdo 3.1 Calculate the extent of hexagon cells and crop the image with the extent. 3.2 Calculate the offset (Offsetx, Offsety) between the extent of cropped raster and hexagon raster. end 4. Merge the cropped raster images that from the same hexagon cells. 5. Mask the raster with hexagon cell and render into hexagon tile. |
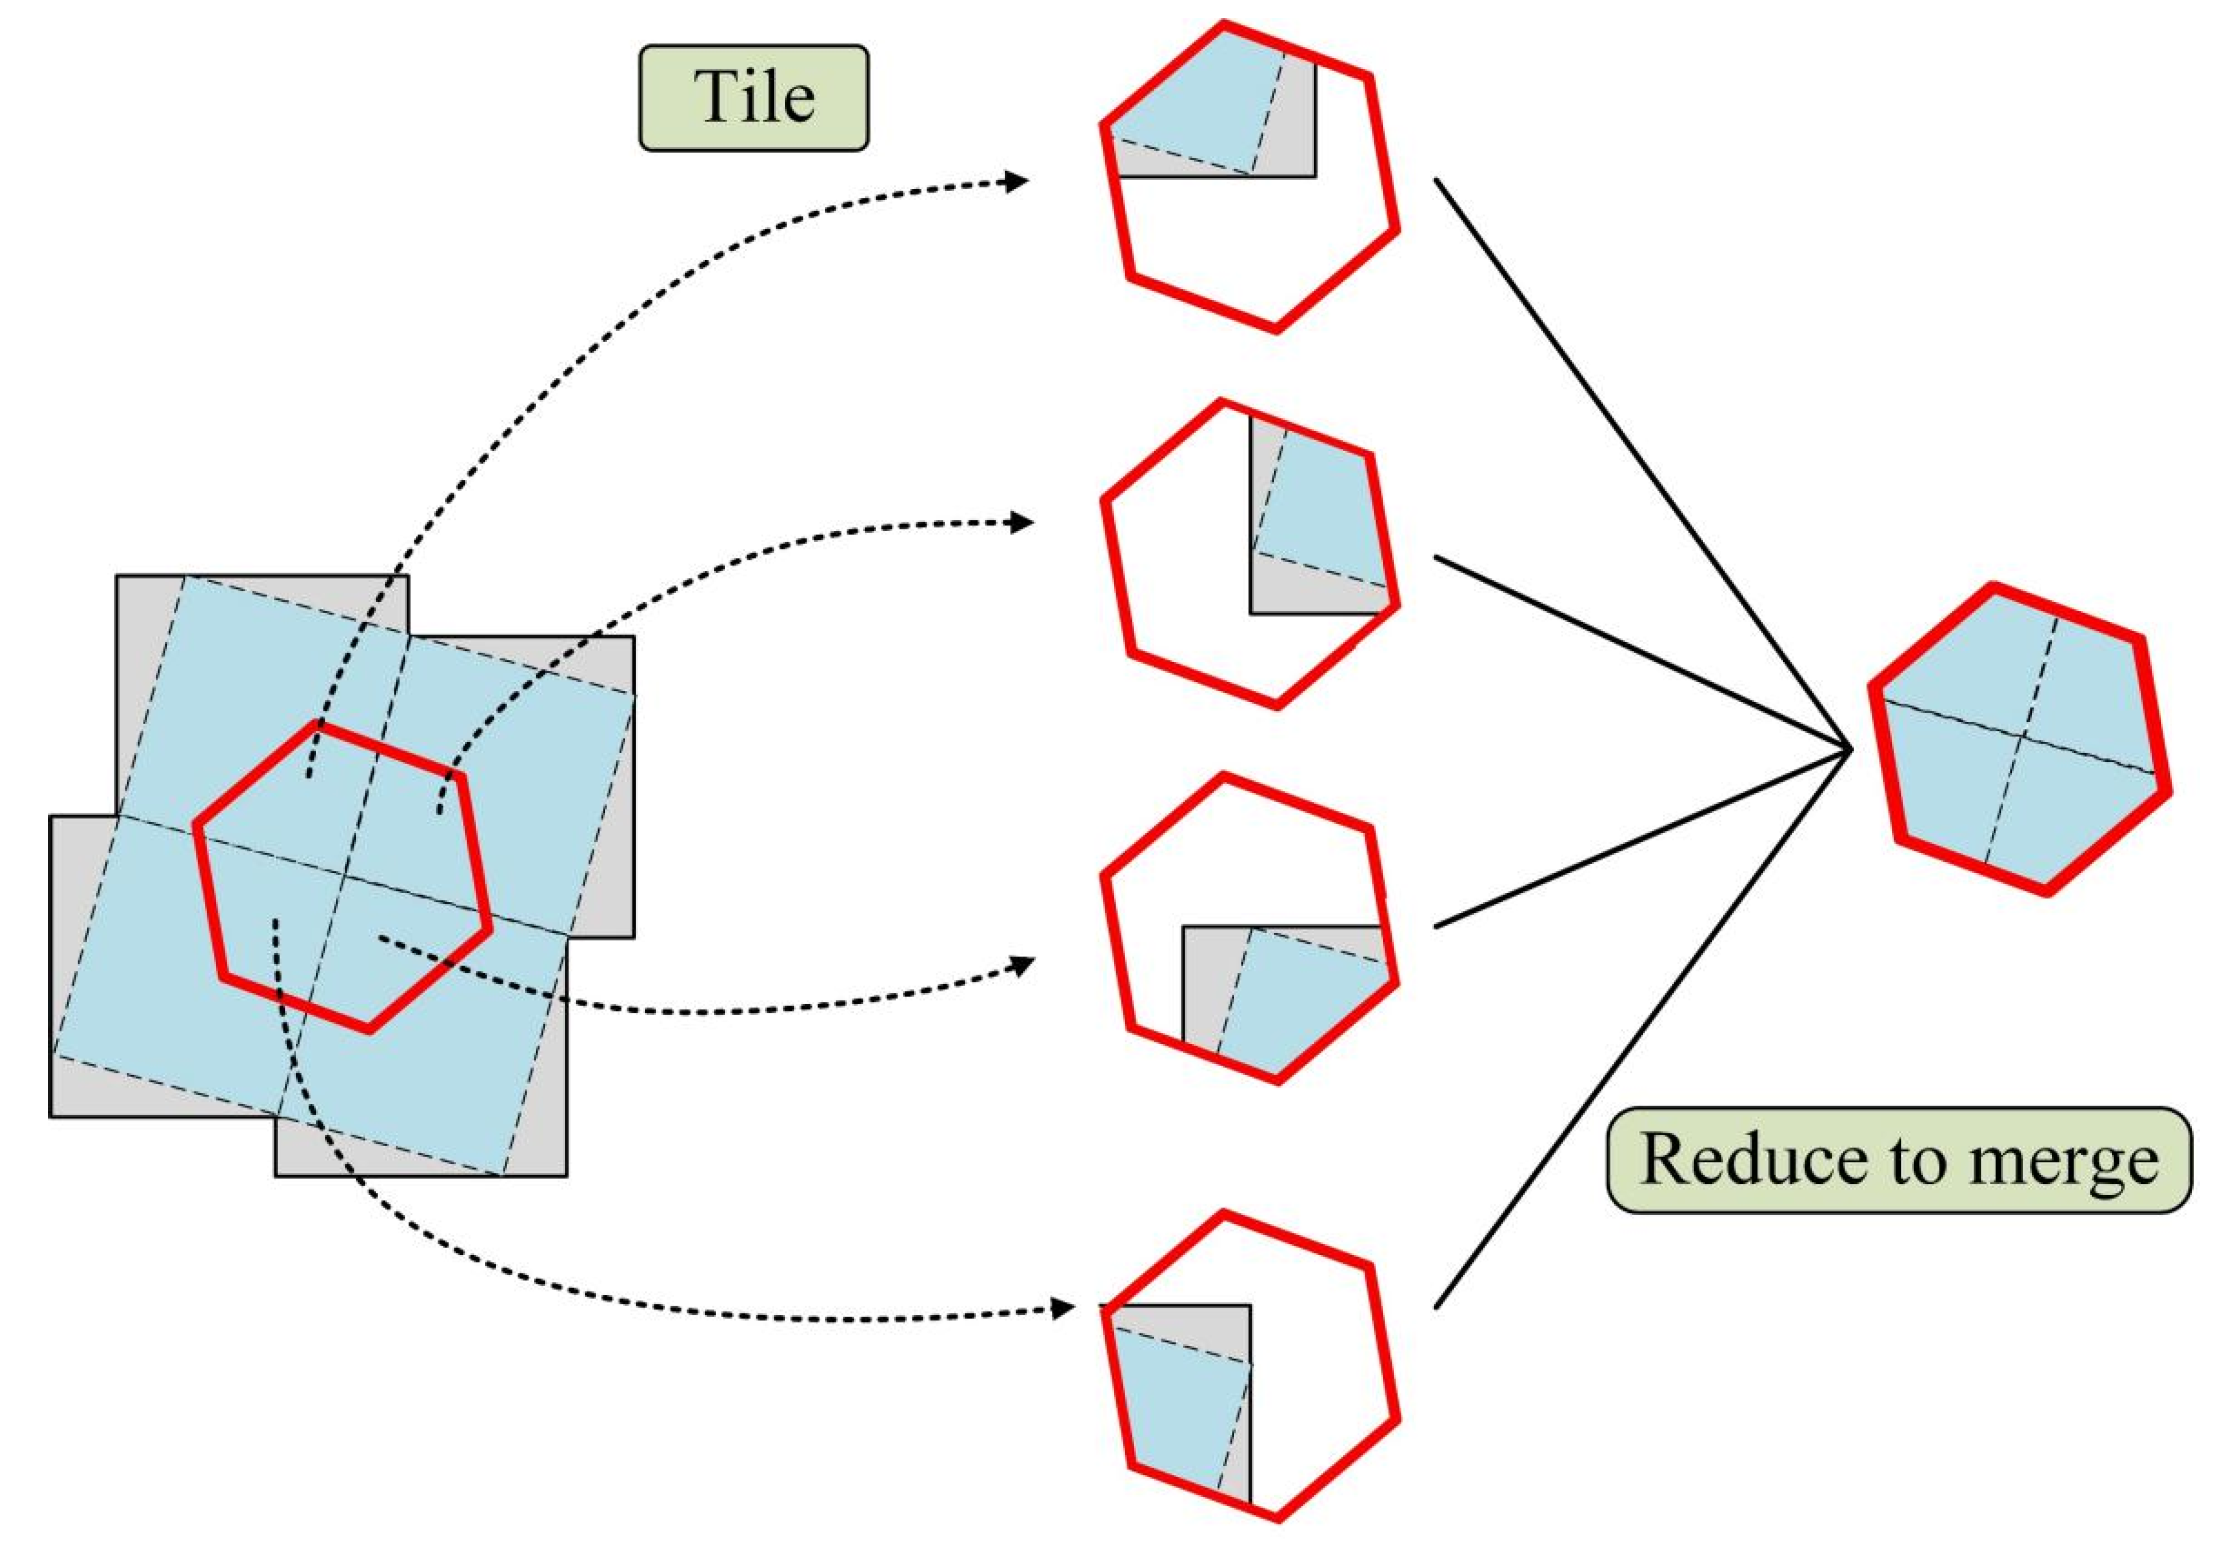
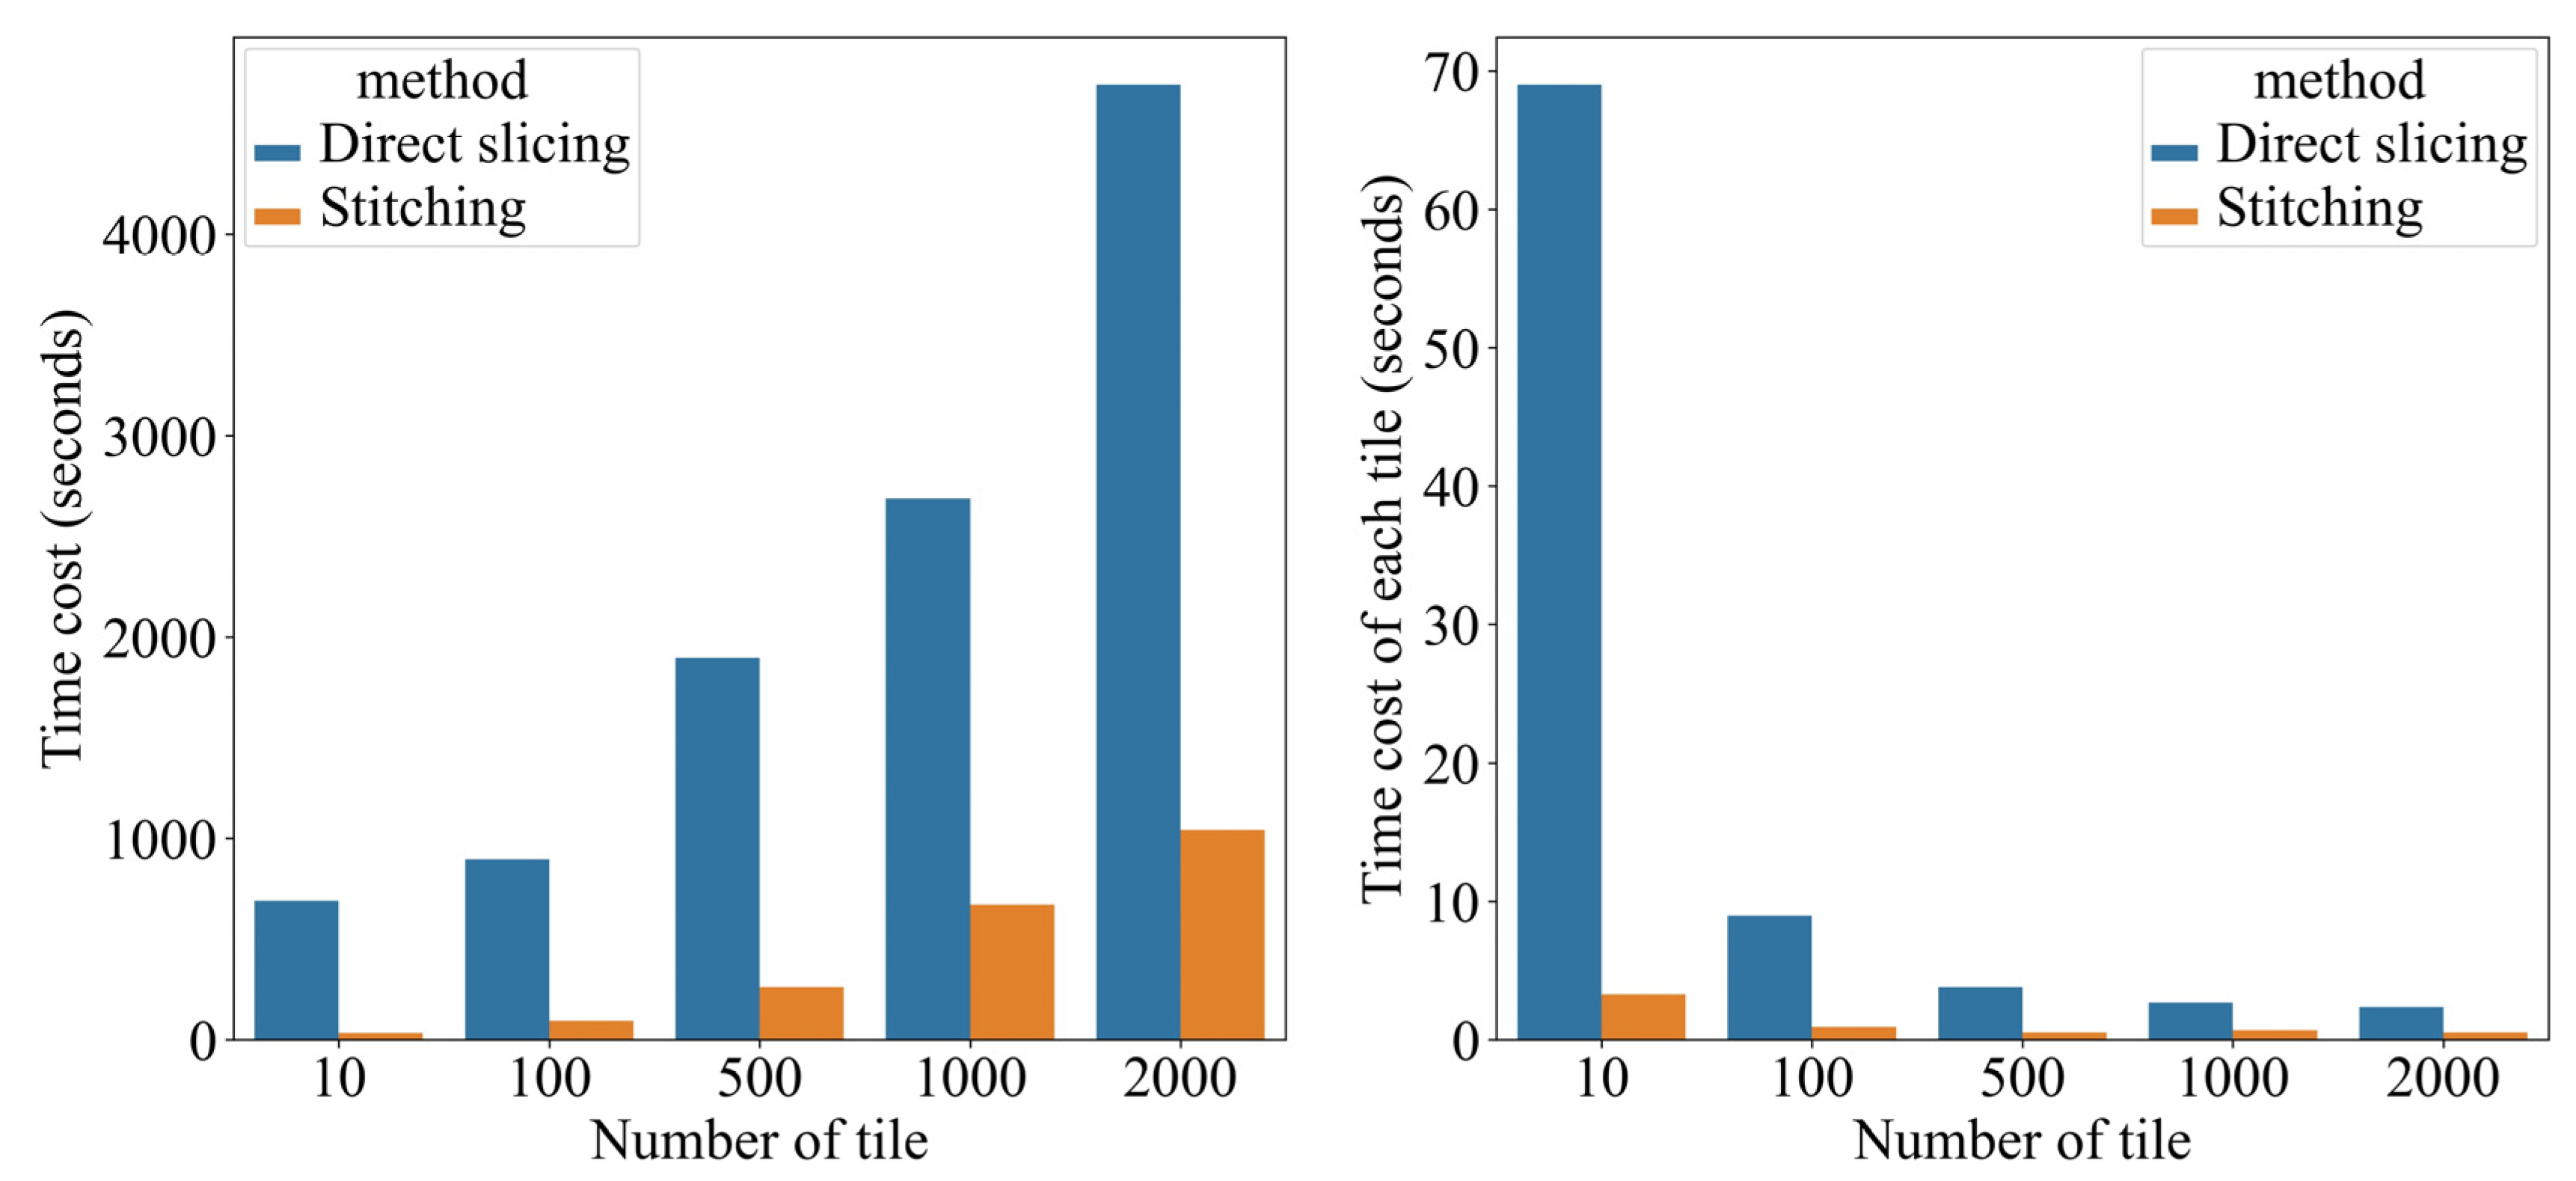
2.2. Hexagonal Merging for Boundary Fragments
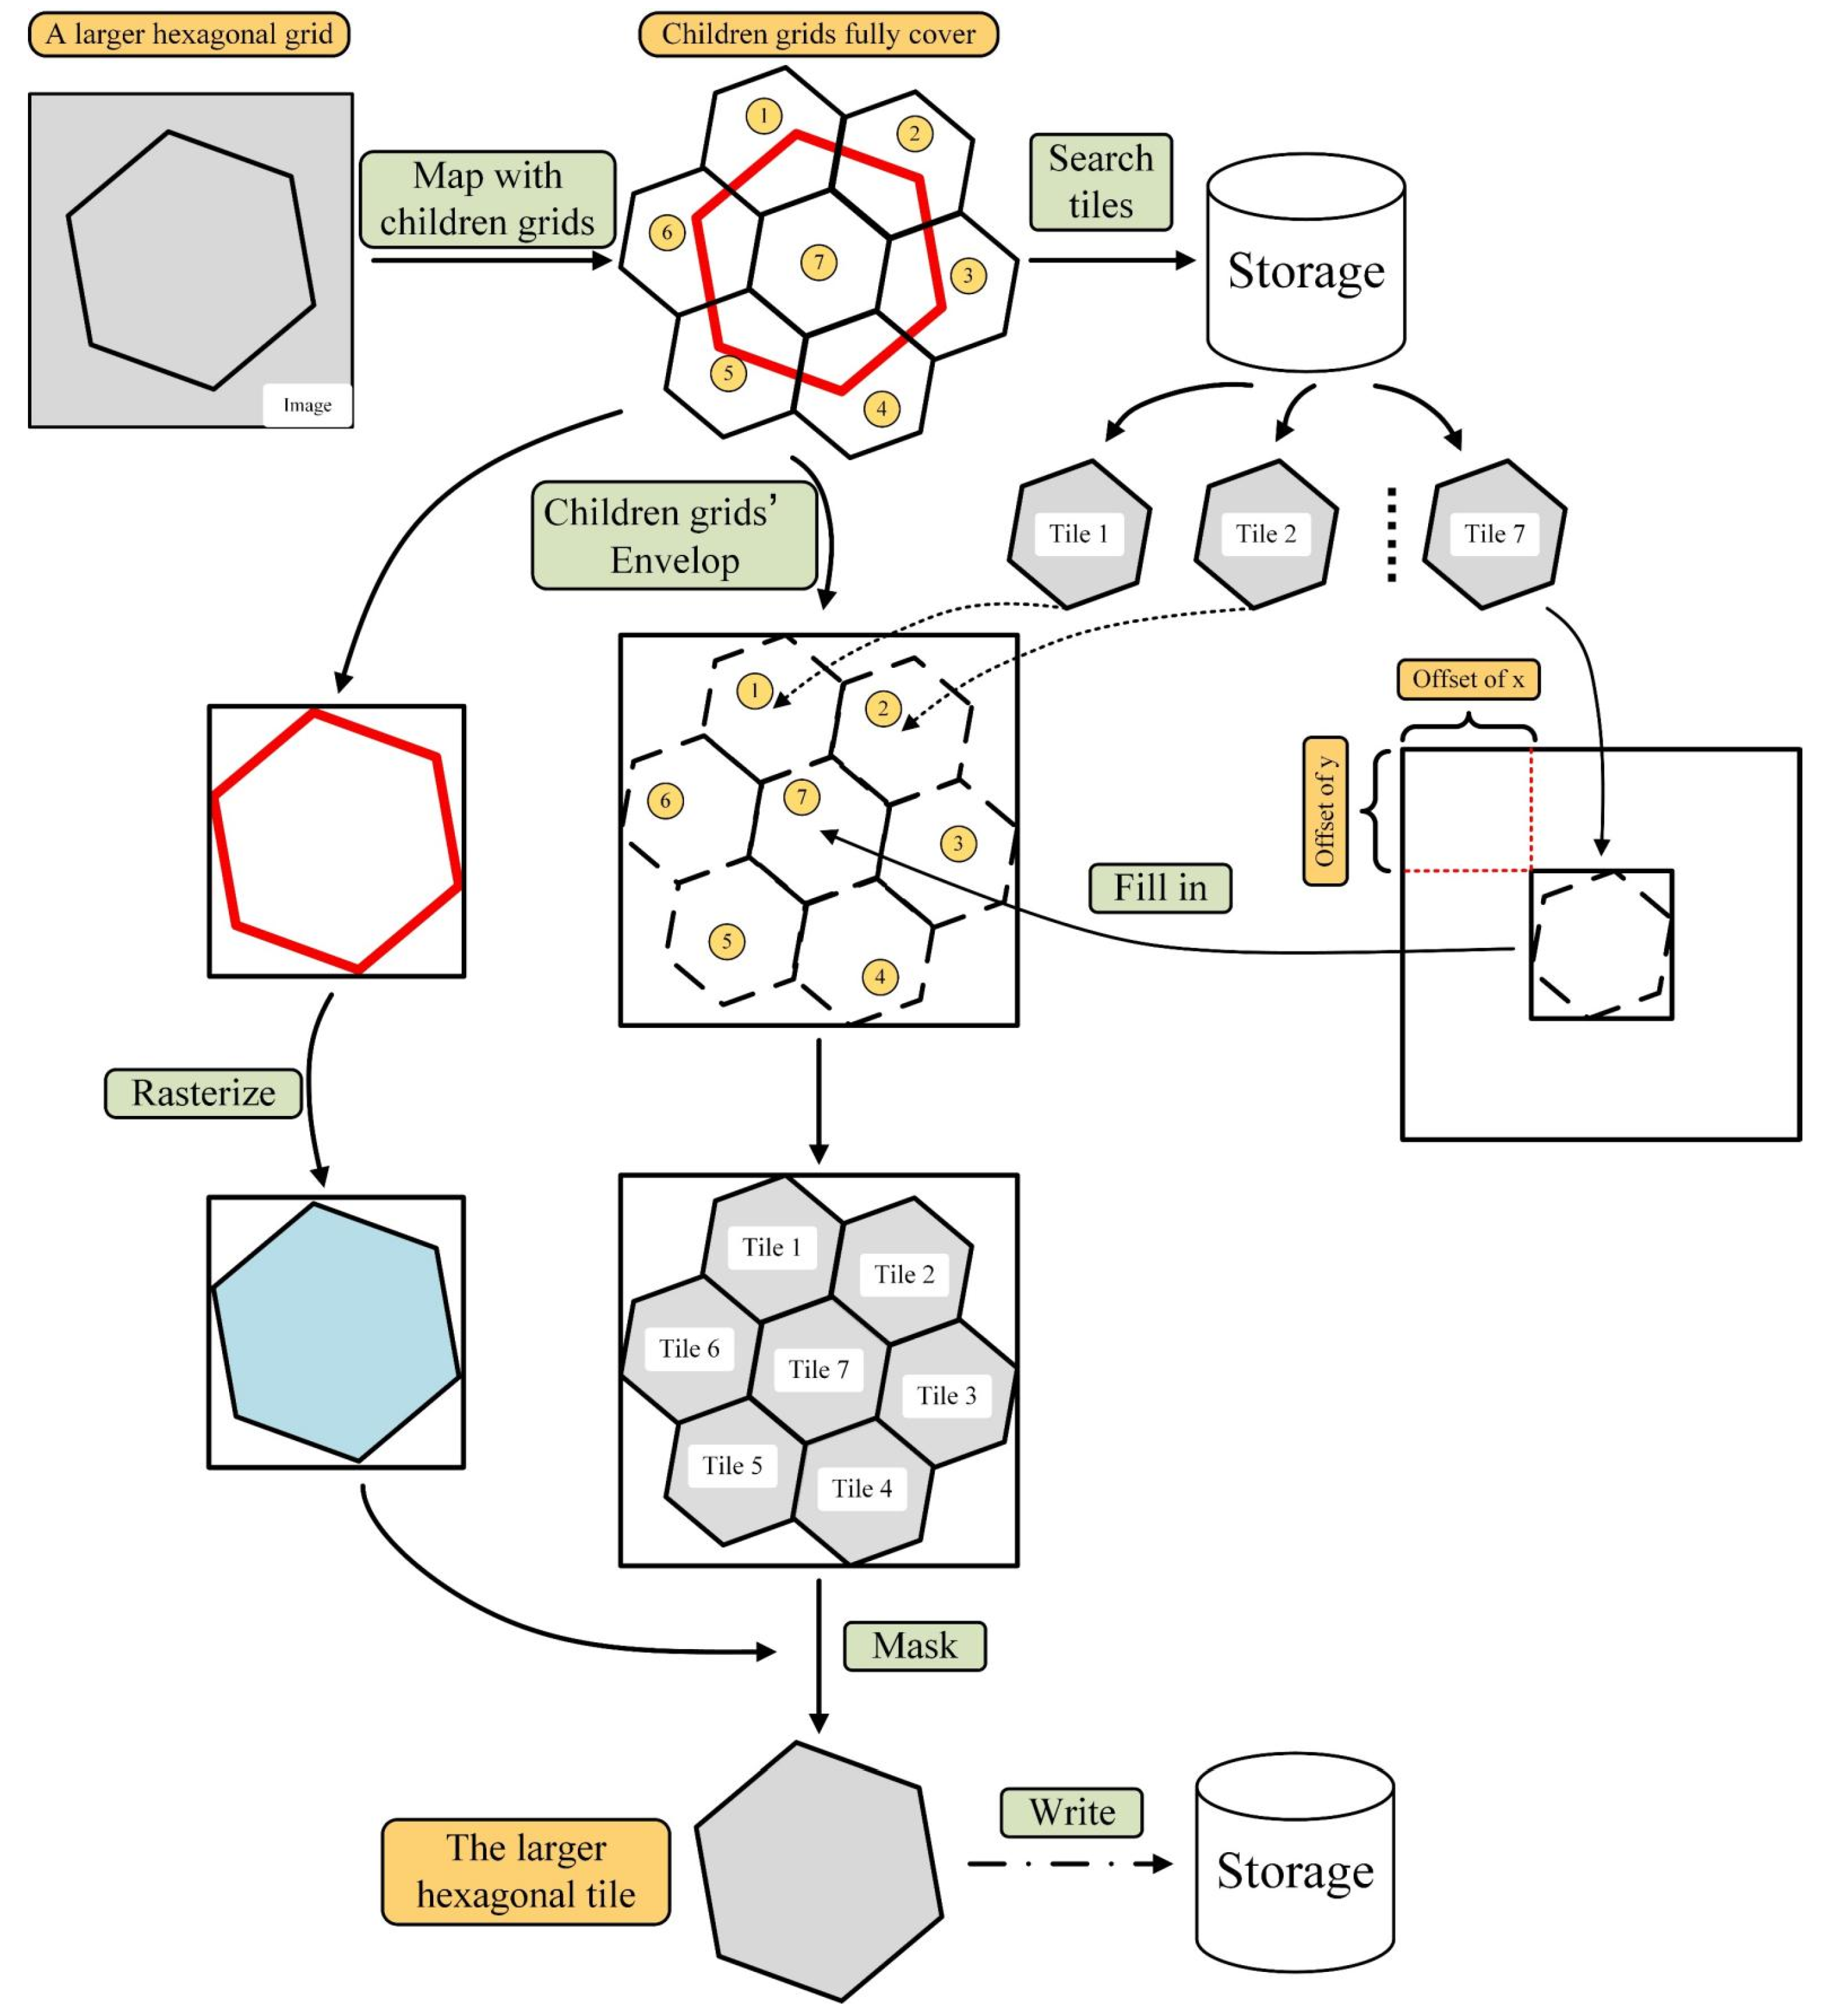
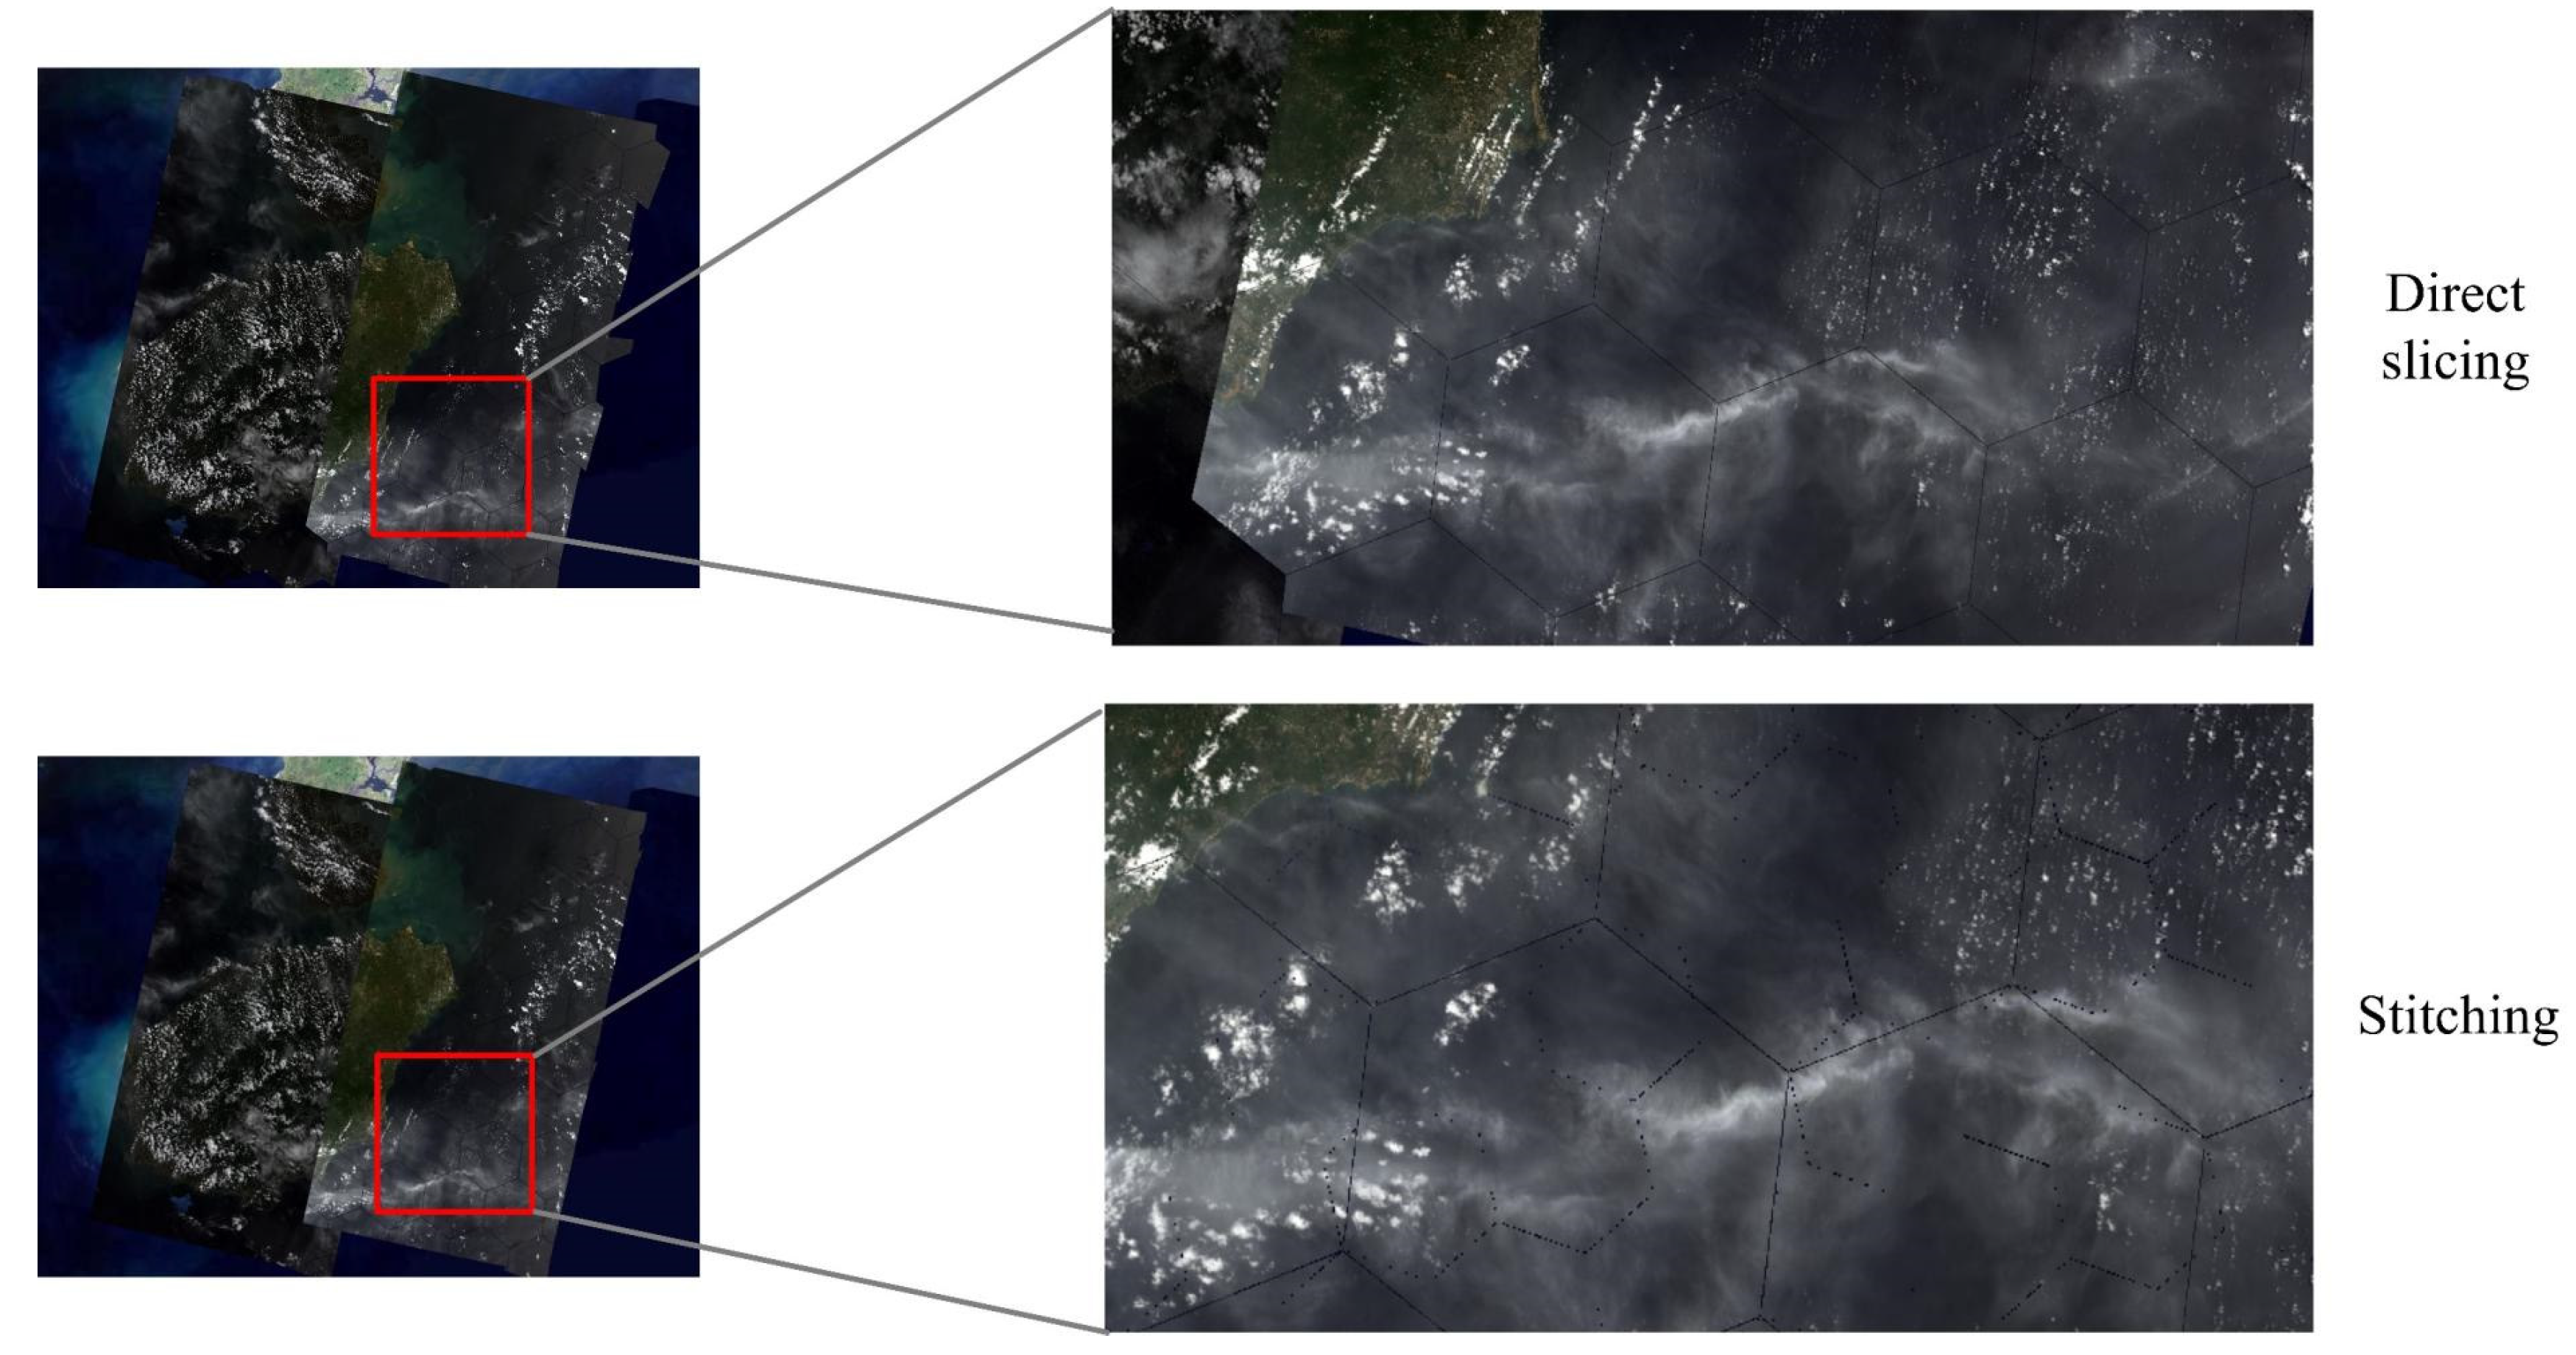
2.3. Hexagonal Stitching Based on Hierarchy
| Algorithm 2: The pseudocode of hexagonal stitching. |
| Input: hexagon grids at level k-1 and hexagon tiles at level k Output: hexagon tiles at level k-1 Calculate the child hexagon grids that fully cover the parent grid in level k. Map parent grids with the corresponding child grids. foreach child griddo 2.1 Read the corresponding tile. 2.2 Calculate the extent of child cells and its offset in the parent cell. end 4. Read the corresponding child tiles and stitch the tiles that have the same parent cell into a new raster. 5. Mask the stitched tiles with corresponding parent hexagon cells and render parent hexagon tiles. |
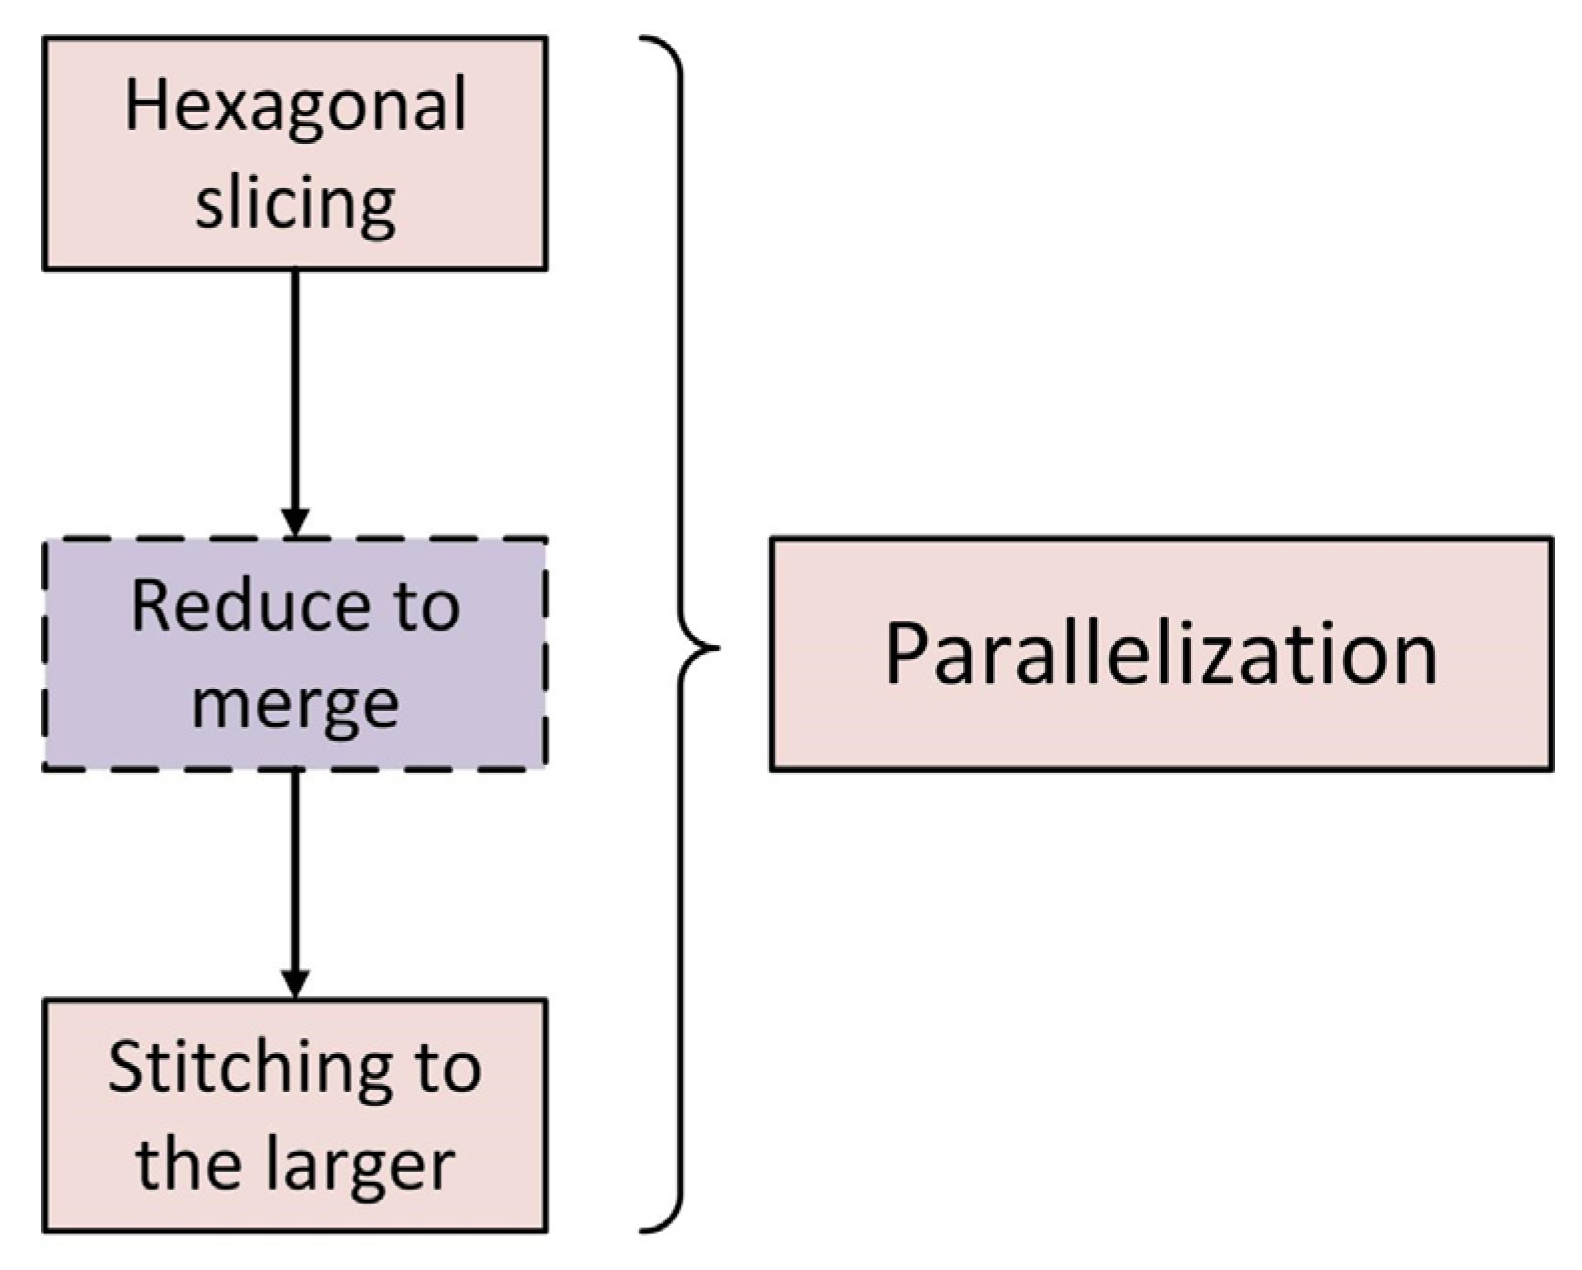
2.4. HexTile Parallelization in Spark
- (1)
- Slicing. Hexagon cells that cover the extent of each image at the basic level were calculated to match the key-value pair <hexagon, image>. Then, each image was cropped with the corresponding hexagon cells, and the offset of the cropped raster in the hexagon cell was computed. The two steps are executed in the function.
- (2)
- Merging. Additionally, one hexagon cell might partly intersect with several images, at most four, so the next step was to merge these raster images into one raster, which was implemented in the function. Finally, the raster images were masked with the hexagon cell and rendered into hexagon tiles in parallel.
- (3)
- Stitching. In the stitching part, child cells that fully cover their parent cells were firstly acquired, and the key-value pair was matched. Then the pair was flattened to a one-to-one pair using the flat Map function. In the next step, the spatial offset of each child cell in the parent cell was calculated to stitch these corresponding tiles in the correct position. The stitching process was operated in the function. Finally, each stitched tile was masked and rendered into hexagon tiles.
3. Results
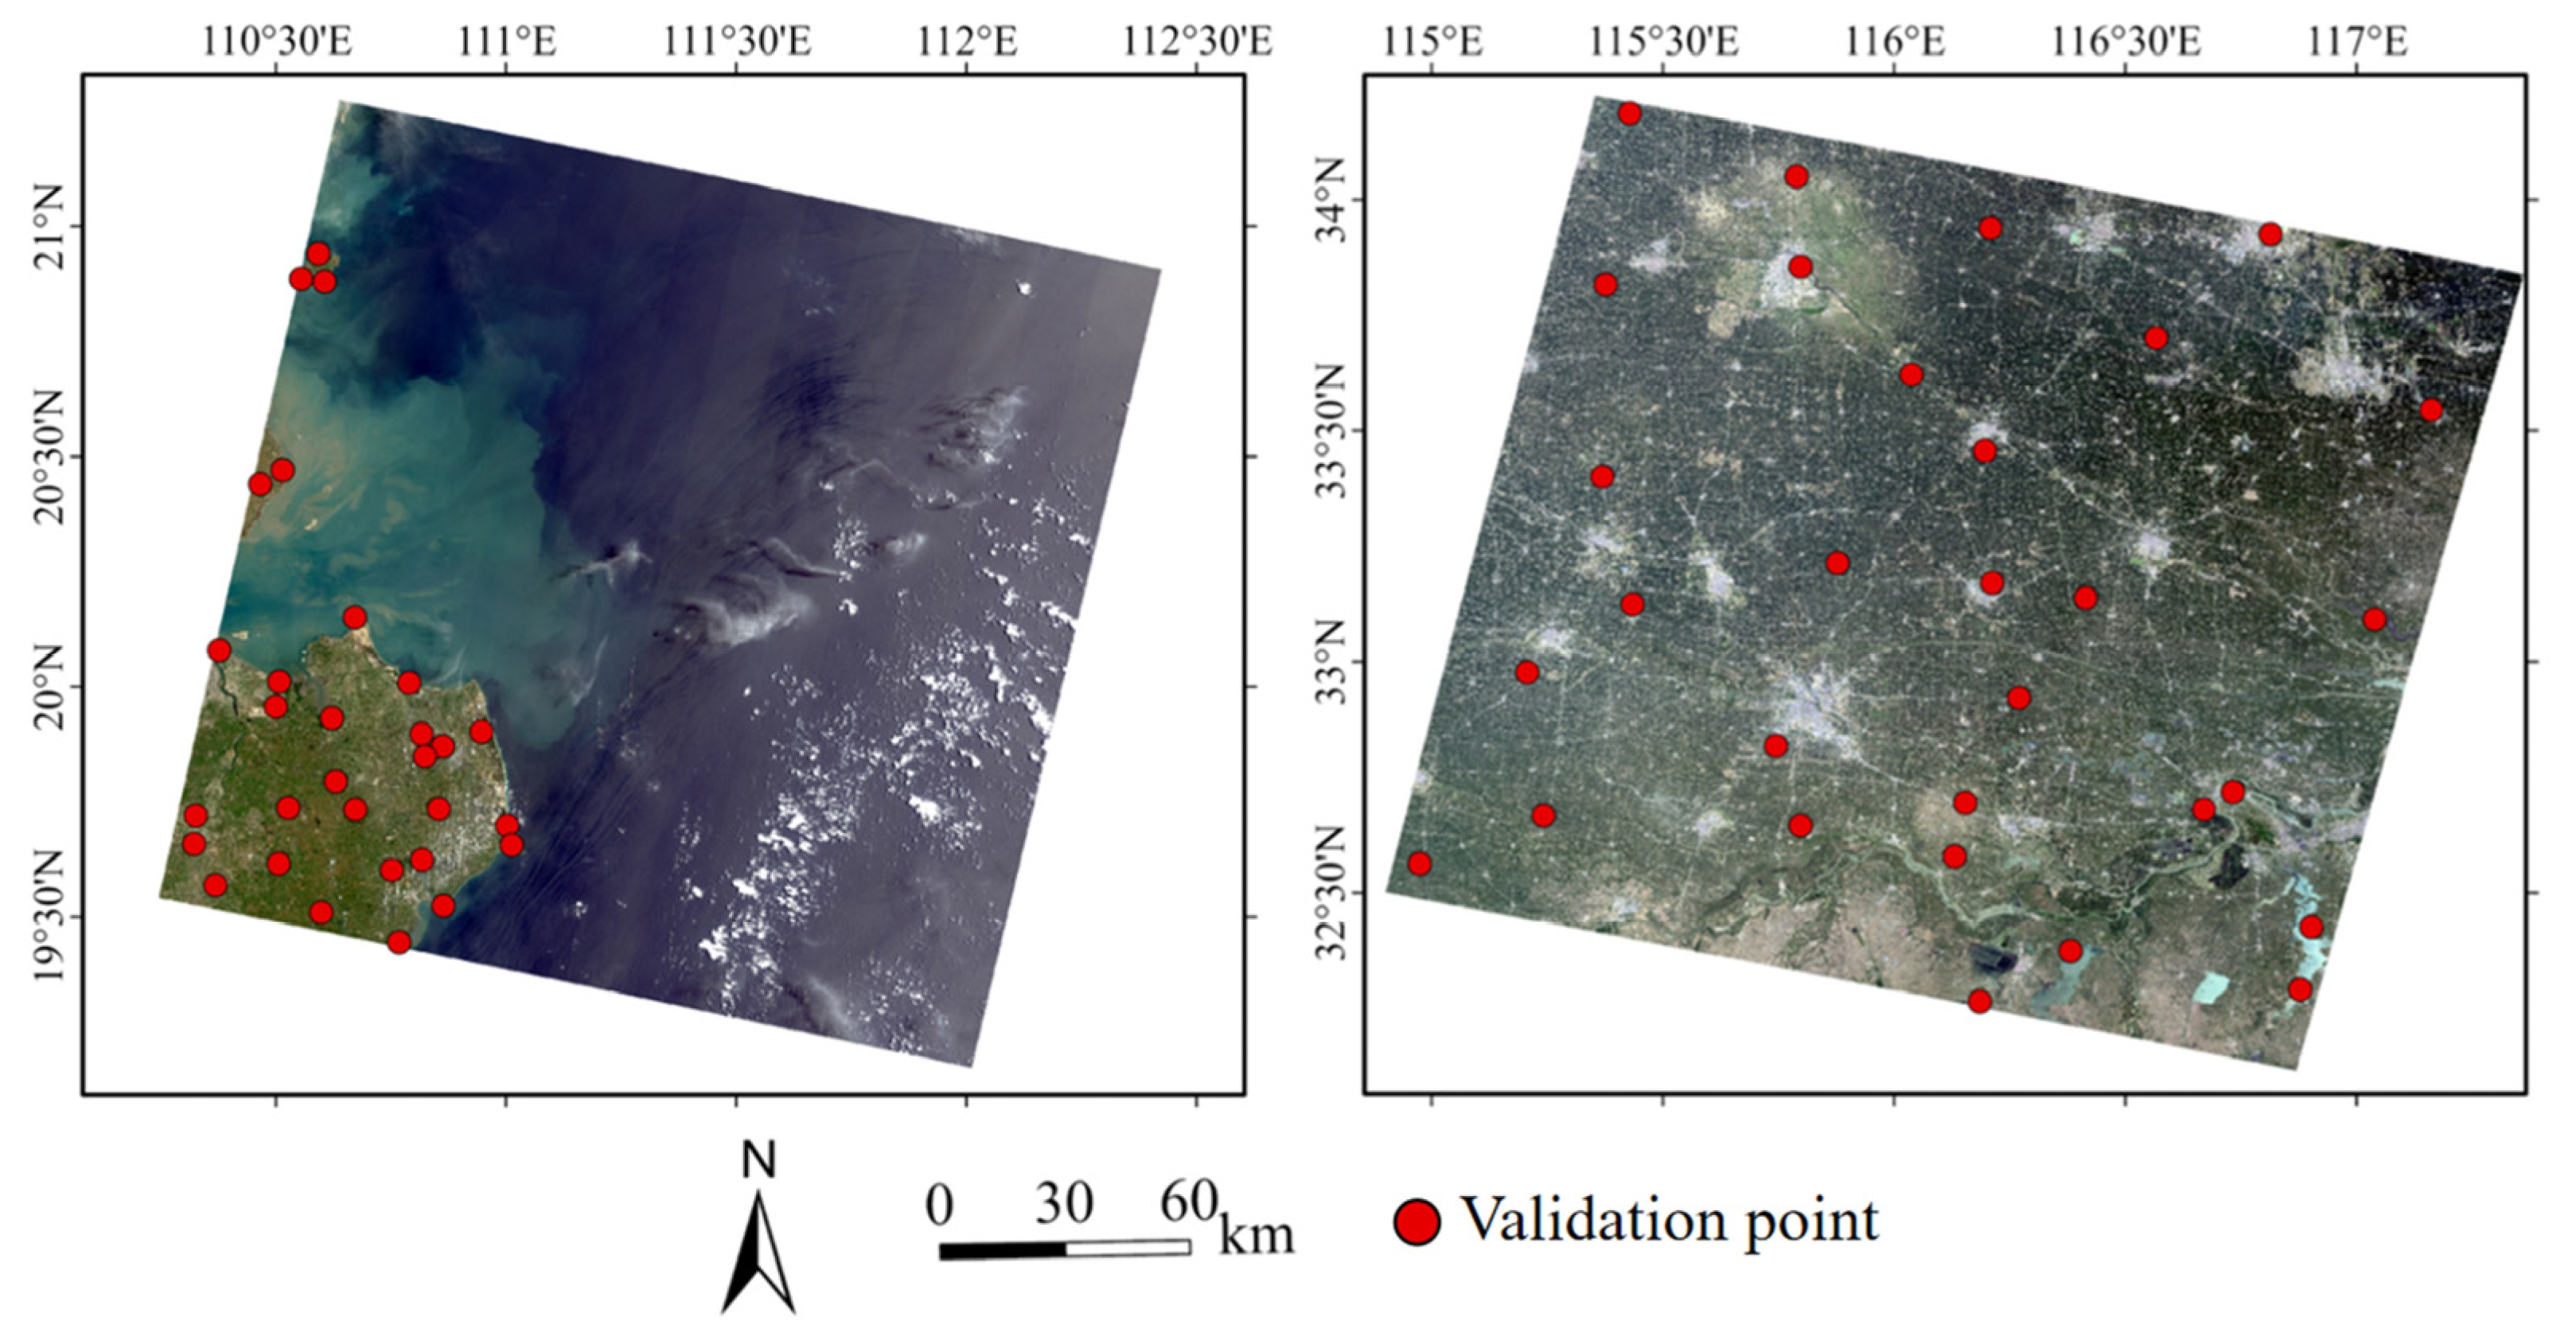
3.1. Experiment Environment and Datasets
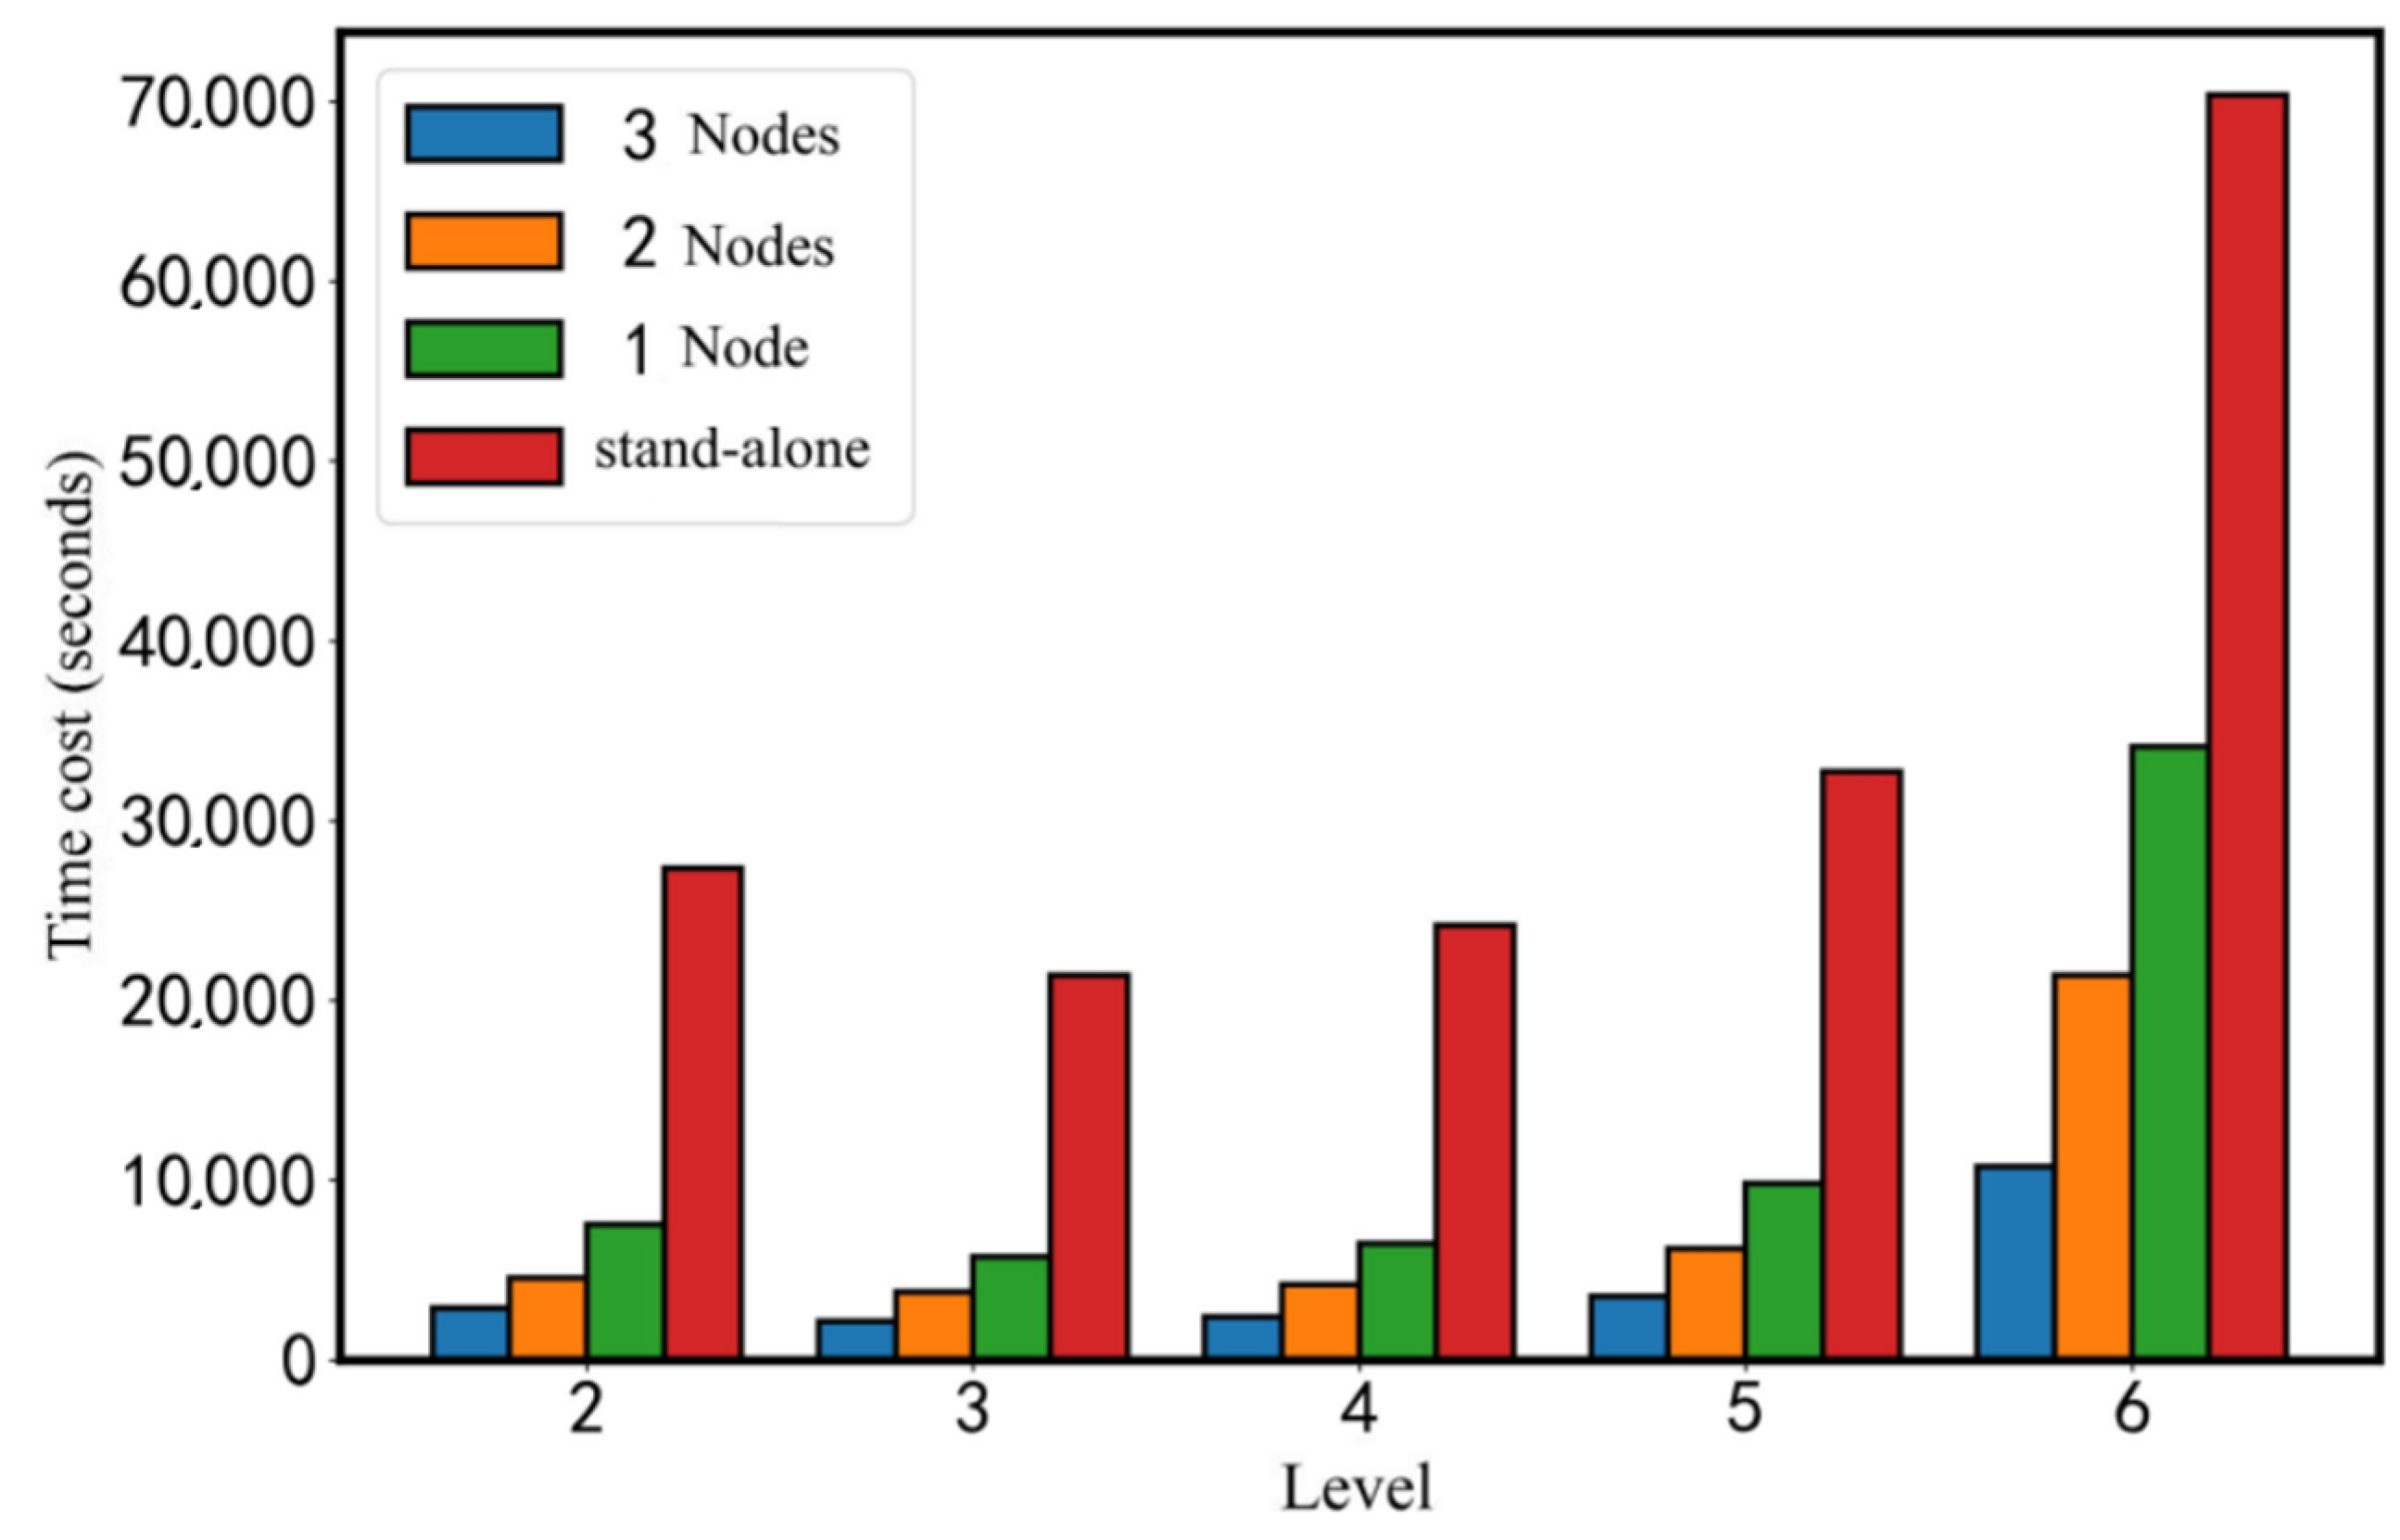
3.2. Performance of HexTile Algorithm
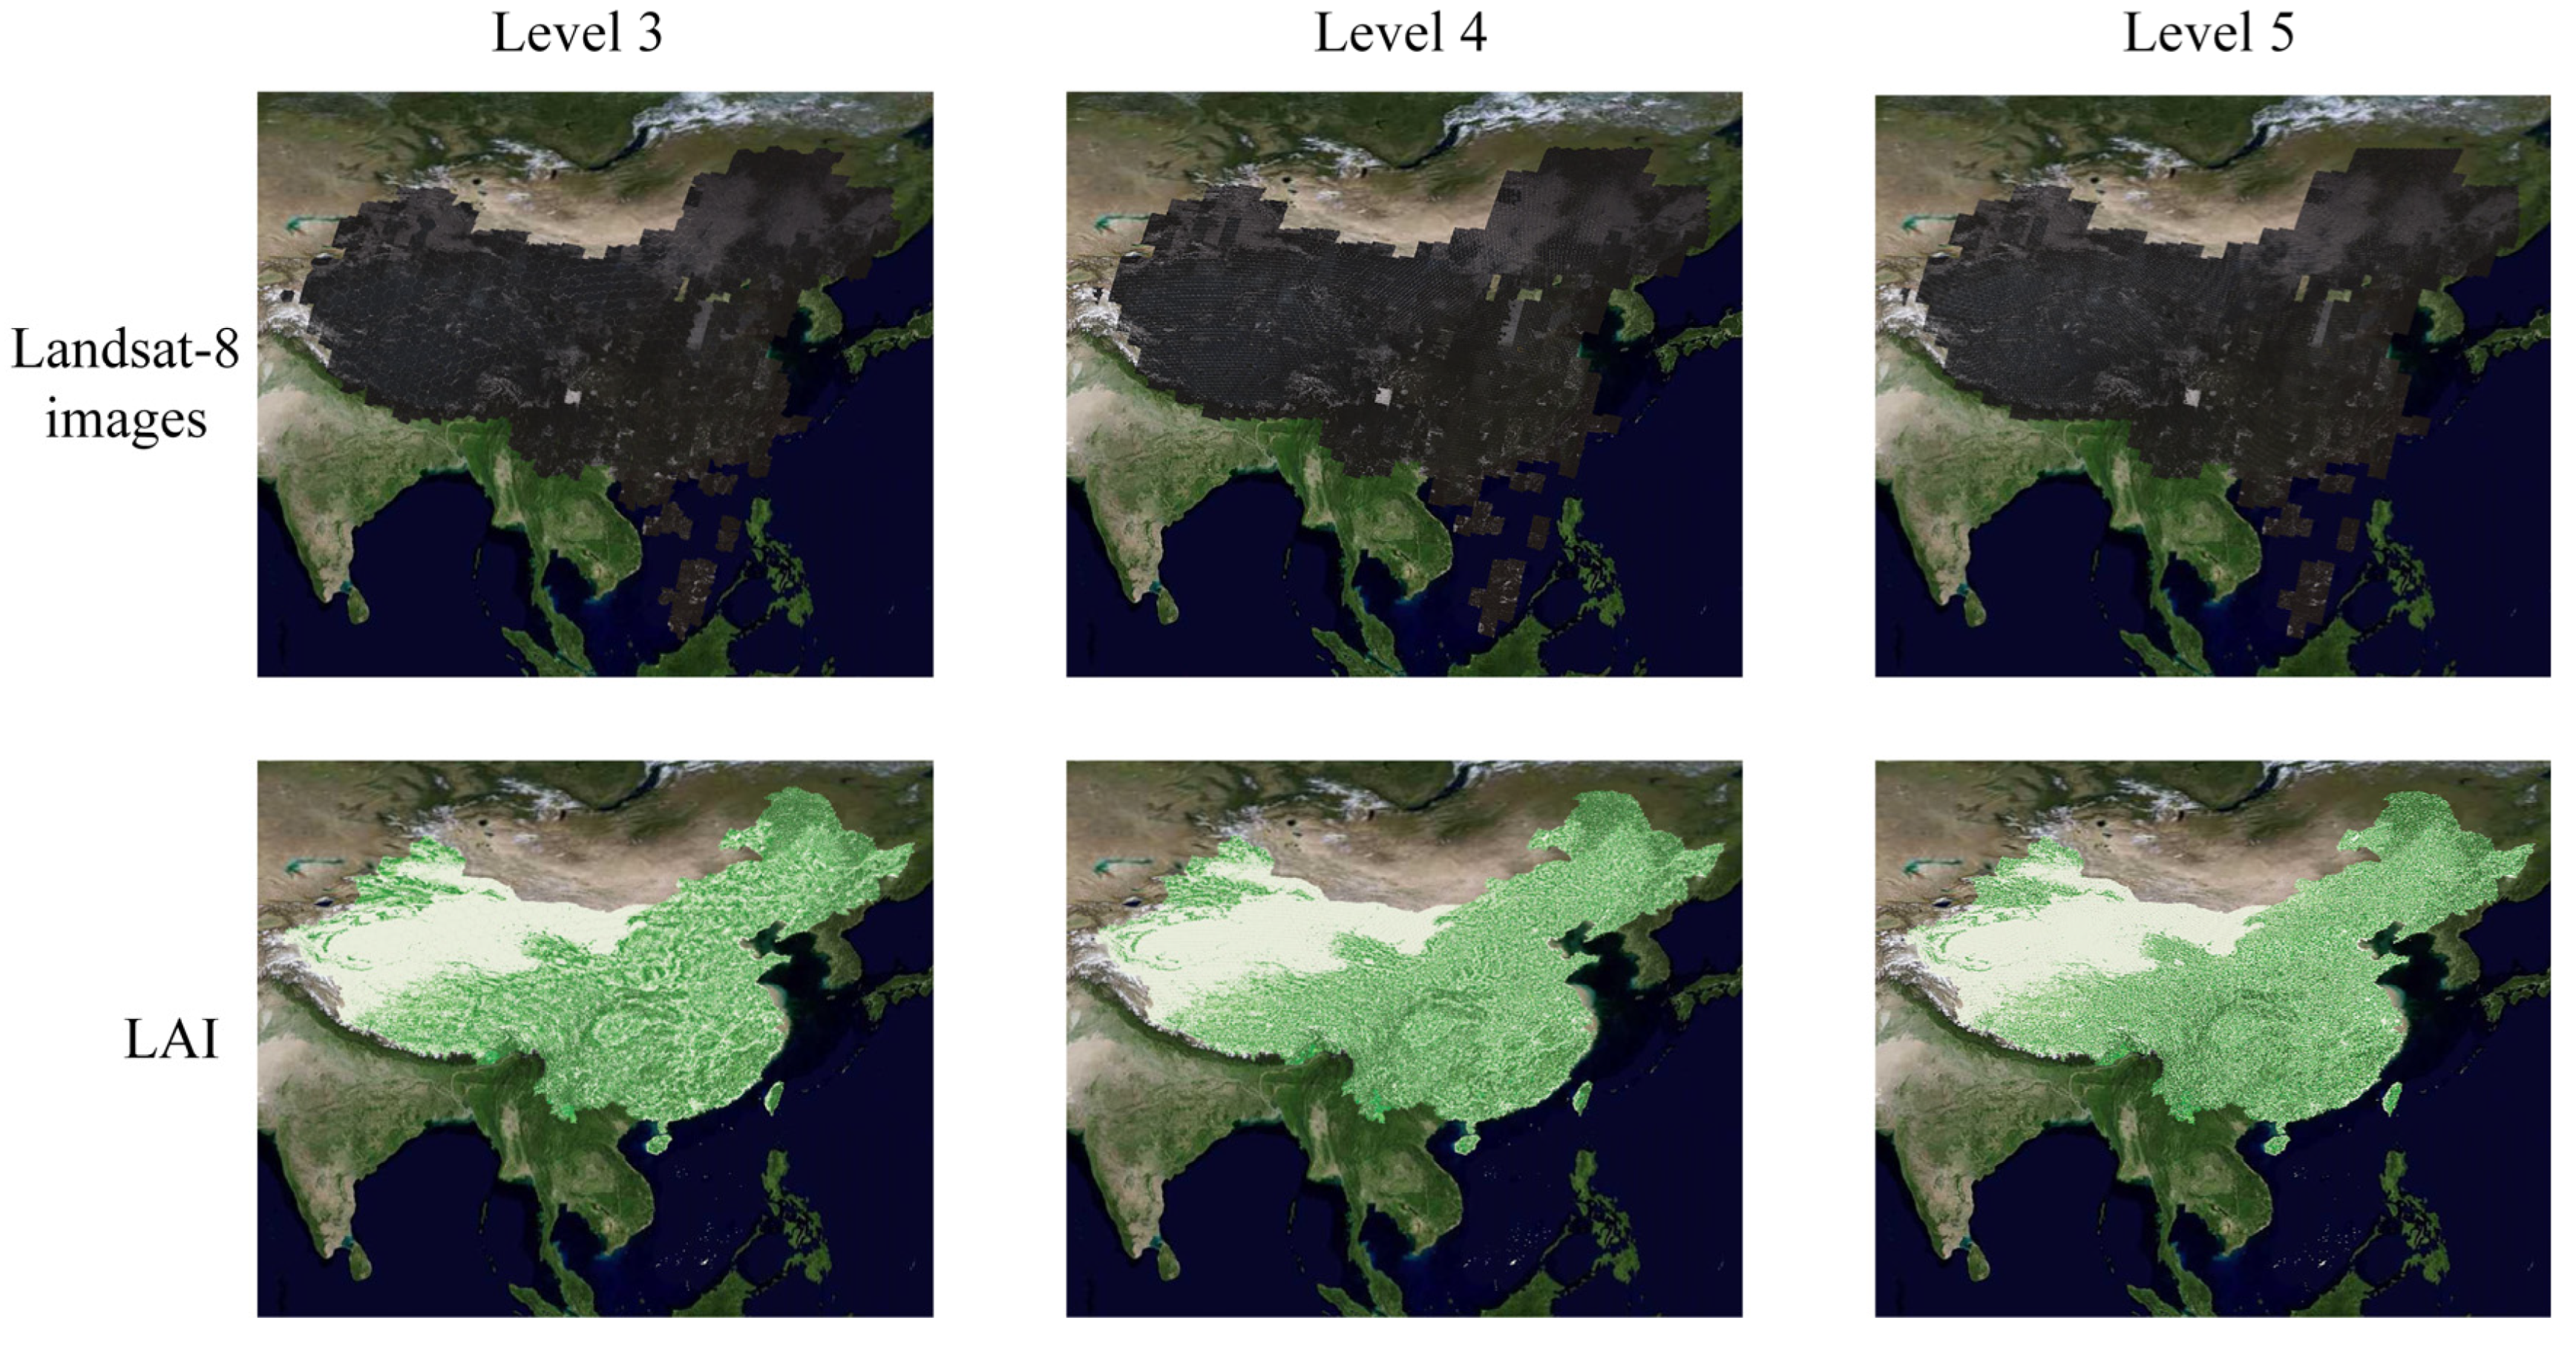
3.3. Accuracy Evaluation of Hexagonal Tiles
3.4. Visualization with WebGIS
4. Discussion
5. Conclusions
Author Contributions
Funding
Institutional Review Board Statement
Informed Consent Statement
Data Availability Statement
Acknowledgments
Conflicts of Interest
References
- Guo, N.; Xiong, W.; Wu, Q.; Jing, N. An Efficient Tile-Pyramids Building Method for Fast Visualization of Massive Geospatial Raster Datasets. Adv. Electr. Comput. Eng. 2016, 16, 3–8. [Google Scholar] [CrossRef]
- Sahr, K.; White, D.; Kimerling, A.J. Geodesic Discrete Global Grid Systems. Cartogr. Geogr. Inf. Sci. 2003, 30, 121–134. [Google Scholar] [CrossRef] [Green Version]
- Rawson, A.; Sabeur, Z.; Brito, M. Geospatial Data Analysis for Global Maritime Risk Assessment Using the Discrete Global Grid System. In Proceedings of the 2021 IEEE International Geoscience and Remote Sensing Symposium IGARSS, Brussels, Belgium, 11–16 July 2021; pp. 3904–3907. [Google Scholar]
- Hojati, M.; Robertson, C.; Roberts, S.; Chaudhuri, C. GIScience research challenges for realizing discrete global grid systems as a Digital Earth. Big Earth Data 2022, 6, 358–379. [Google Scholar] [CrossRef]
- Yao, X.; Li, G. Big spatial vector data management: A review. Big Earth Data 2018, 2, 108–129. [Google Scholar] [CrossRef]
- Zhao, X.S.; Bai, J.J. Hierarchical model of global discrete grids based on diamonds. J. China Univ. Min. Technol. 2007, 36, 397. [Google Scholar]
- Zhao, L.; Li, G.; Yao, X.; Ma, Y.; Cao, Q. An optimized hexagonal quadtree encoding and operation scheme for icosahedral hexagonal discrete global grid systems. Int. J. Digit. Earth 2022, 15, 975–1000. [Google Scholar] [CrossRef]
- Zhou, M.; Chen, J.; Gong, J. A pole-oriented discrete global grid system: Quaternary quadrangle mesh. Comput. Geosci. 2013, 61, 133–143. [Google Scholar] [CrossRef]
- Li, M.; McGrath, H.; Stefanakis, E. Geovisualization of Hydrological Flow in Hexagonal Grid Systems. Geographies 2022, 2, 227–244. [Google Scholar] [CrossRef]
- Li, M.; Stefanakis, E. Geospatial Operations of Discrete Global Grid Systems—A Comparison with Traditional GIS. J. Geovis. Spat. Anal. 2020, 4, 26. [Google Scholar] [CrossRef]
- Górski, K.M.; Hivon, E.; Banday, A.J.; Wandelt, B.D.; Hansen, F.K.; Reinecke, M.; Bartelmann, M. HEALPix: A Framework for High-Resolution Discretization and Fast Analysis of Data Distributed on the Sphere. Astrophys. J. 2005, 622, 759. [Google Scholar] [CrossRef]
- Gibb, R.G. The rHEALPix Discrete Global Grid System. IOP Conf. Ser. Earth Environ. Sci. 2016, 34, 012012. [Google Scholar] [CrossRef] [Green Version]
- Zhao, X.; Wang, L.; Wang, H.; Li, Y. Modeling methods and basic problems of discrete global grids. Geogr. Geo-Inf. Sci. 2012, 28, 29–34. [Google Scholar]
- Ma, Y.; Li, G.; Yao, X.; Cao, Q.; Zhao, L.; Wang, S.; Zhang, L. A Precision Evaluation Index System for Remote Sensing Data Sampling Based on Hexagonal Discrete Grids. ISPRS Int. J. Geo-Inf. 2021, 10, 194. [Google Scholar] [CrossRef]
- Robertson, C.; Chaudhuri, C.; Hojati, M.; Roberts, S.A. An integrated environmental analytics system (IDEAS) based on a DGGS. ISPRS J. Photogramm. Remote Sens. 2020, 162, 214–228. [Google Scholar] [CrossRef]
- Yan, S.; Yao, X.; Zhu, D.; Liu, D.; Zhang, L.; Yu, G.; Gao, B.; Yang, J.; Yun, W. Large-scale crop mapping from multi-source optical satellite imageries using machine learning with discrete grids. Int. J. Appl. Earth Obs. Geoinf. 2021, 103, 102485. [Google Scholar] [CrossRef]
- de Sousa, L.M.; Leitão, J.P. HexASCII: A file format for cartographical hexagonal rasters. Trans. GIS 2018, 22, 217–232. [Google Scholar] [CrossRef]
- Eldawy, A.; Mokbel, M.F. SpatialHadoop: A MapReduce framework for spatial data. In Proceedings of the 2015 IEEE 31st International Conference on Data Engineering, Seoul, Republic of Korea, 13–17 April 2015; pp. 1352–1363. [Google Scholar]
- Aji, A.; Wang, F.; Vo, H.; Lee, R.; Liu, Q.; Zhang, X.; Saltz, J. Hadoop-GIS: A High Performance Spatial Data Warehousing System over MapReduce. Proc. VLDB Endow. 2013, 6, 1009–1020. [Google Scholar] [CrossRef]
- Jia, Y.; Wu, J.; Sarwat, M. GeoSpark: A cluster computing framework for processing large-scale spatial data. In Proceedings of the 23rd SIGSPATIAL International Conference, Seattle, WA, USA, 3–6 November 2015; pp. 1–4. [Google Scholar]
- Eldawy, A.; Mokbel, M.F.; Jonathan, C. HadoopViz: A MapReduce framework for extensible visualization of big spatial data. In Proceedings of the 2016 IEEE 32nd International Conference on Data Engineering (ICDE), Helsinki, Finland, 16–20 May 2016; pp. 601–612. [Google Scholar]
- Yu, J.; Zhang, Z.; Sarwat, M. GeoSparkViz: A Scalable Geospatial Data Visualization Framework in the Apache Spark Ecosystem. In Proceedings of the 30th International Conference on Scientific and Statistical Database Management, Bozen-Bolzano, Italy, 9–11 July 2018; pp. 1–12. [Google Scholar]
- Wan, L.; Huang, Z.; Peng, X. An Effective NoSQL-Based Vector Map Tile Management Approach. ISPRS Int. J. Geo-Inf. 2016, 5, 215. [Google Scholar] [CrossRef] [Green Version]
- Tang, X.; Yao, X.; Liu, D.; Zhao, L.; Li, L.; Zhu, D.; Li, G. A Ceph-based storage strategy for big gridded remote sensing data. Big Earth Data 2022, 6, 323–339. [Google Scholar] [CrossRef]
- Yao, X.; Li, G.; Xia, J.; Ben, J.; Cao, Q.; Zhao, L.; Ma, Y.; Zhang, L.; Zhu, D. Enabling the Big Earth Observation Data via Cloud Computing and DGGS: Opportunities and Challenges. Remote Sens. 2019, 12, 62. [Google Scholar] [CrossRef] [Green Version]


| DGGS | Base Polyhedron | Shape of Polygon | URL |
|---|---|---|---|
| H3 | Icosahedron | Hexagon (aperture 7) | https://github.com/uber/h3 (accessed on 20 September 2021) |
| OpenEAGGR | Icosahedron | Triangle (aperture 4) Hexagon (aperture 3) | https://github.com/riskaware-ltd/open-eaggr (accessed on 20 September 2021) |
| DGGRID | Icosahedron | Triangle/diamond/Hexagon (aperture 3/4/mixed) | https://github.com/sahrk/DGGRID (accessed on 21 September 2021) |
| HEALPix | Rhombic-dodecahedron milliarcseconds | Curvilinear quadrilaterals | https://healpix.sourceforge.io/index.php(accessed on 21 September 2021) |
| rHEALPix | Cube | Square grid | http://atlas.gge.unb.ca/rHEALPix (accessed on 21 September 2021) |
| Geogrid | Icosahedron | Hexagon (aperture 3) | https://github.com/giscience/geogrid (accessed on 20 September 2021) |
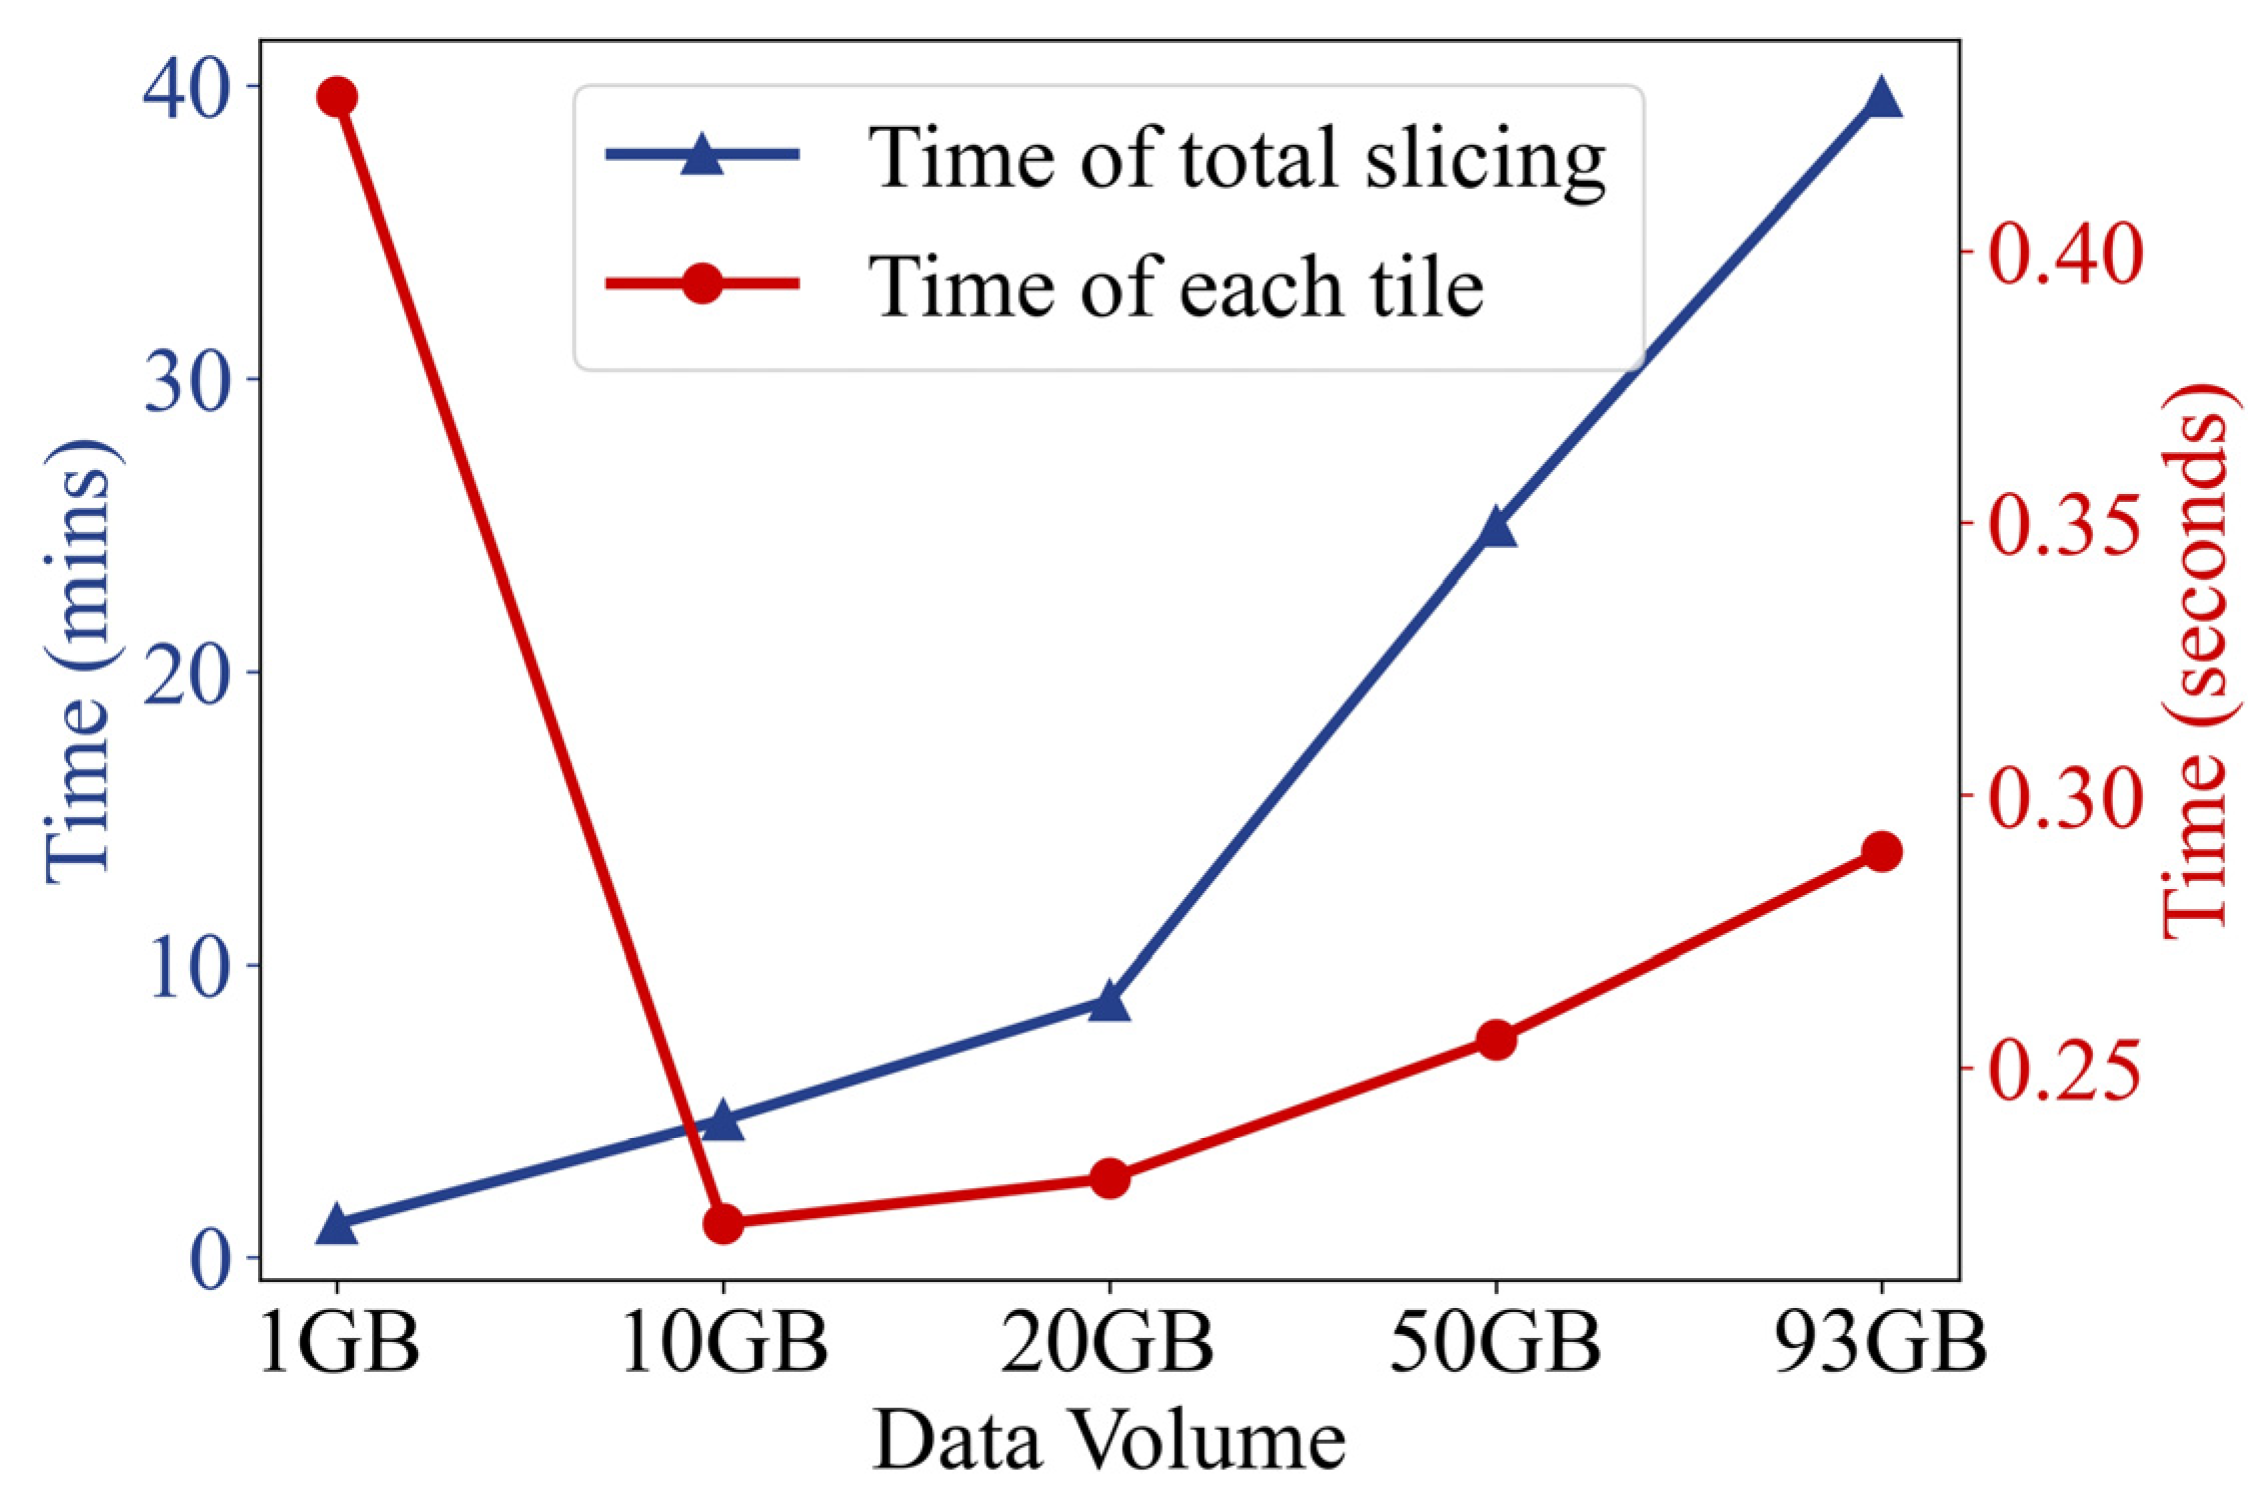
| Data Volume | Number of GeoTiffs | Number of Hexagon Tiles |
|---|---|---|
| 1 GB | 6 | 158 |
| 10 GB | 60 | 1270 |
| 20 GB | 120 | 2292 |
| 50 GB | 360 | 5870 |
| 93 GB | 553 | 8210 |
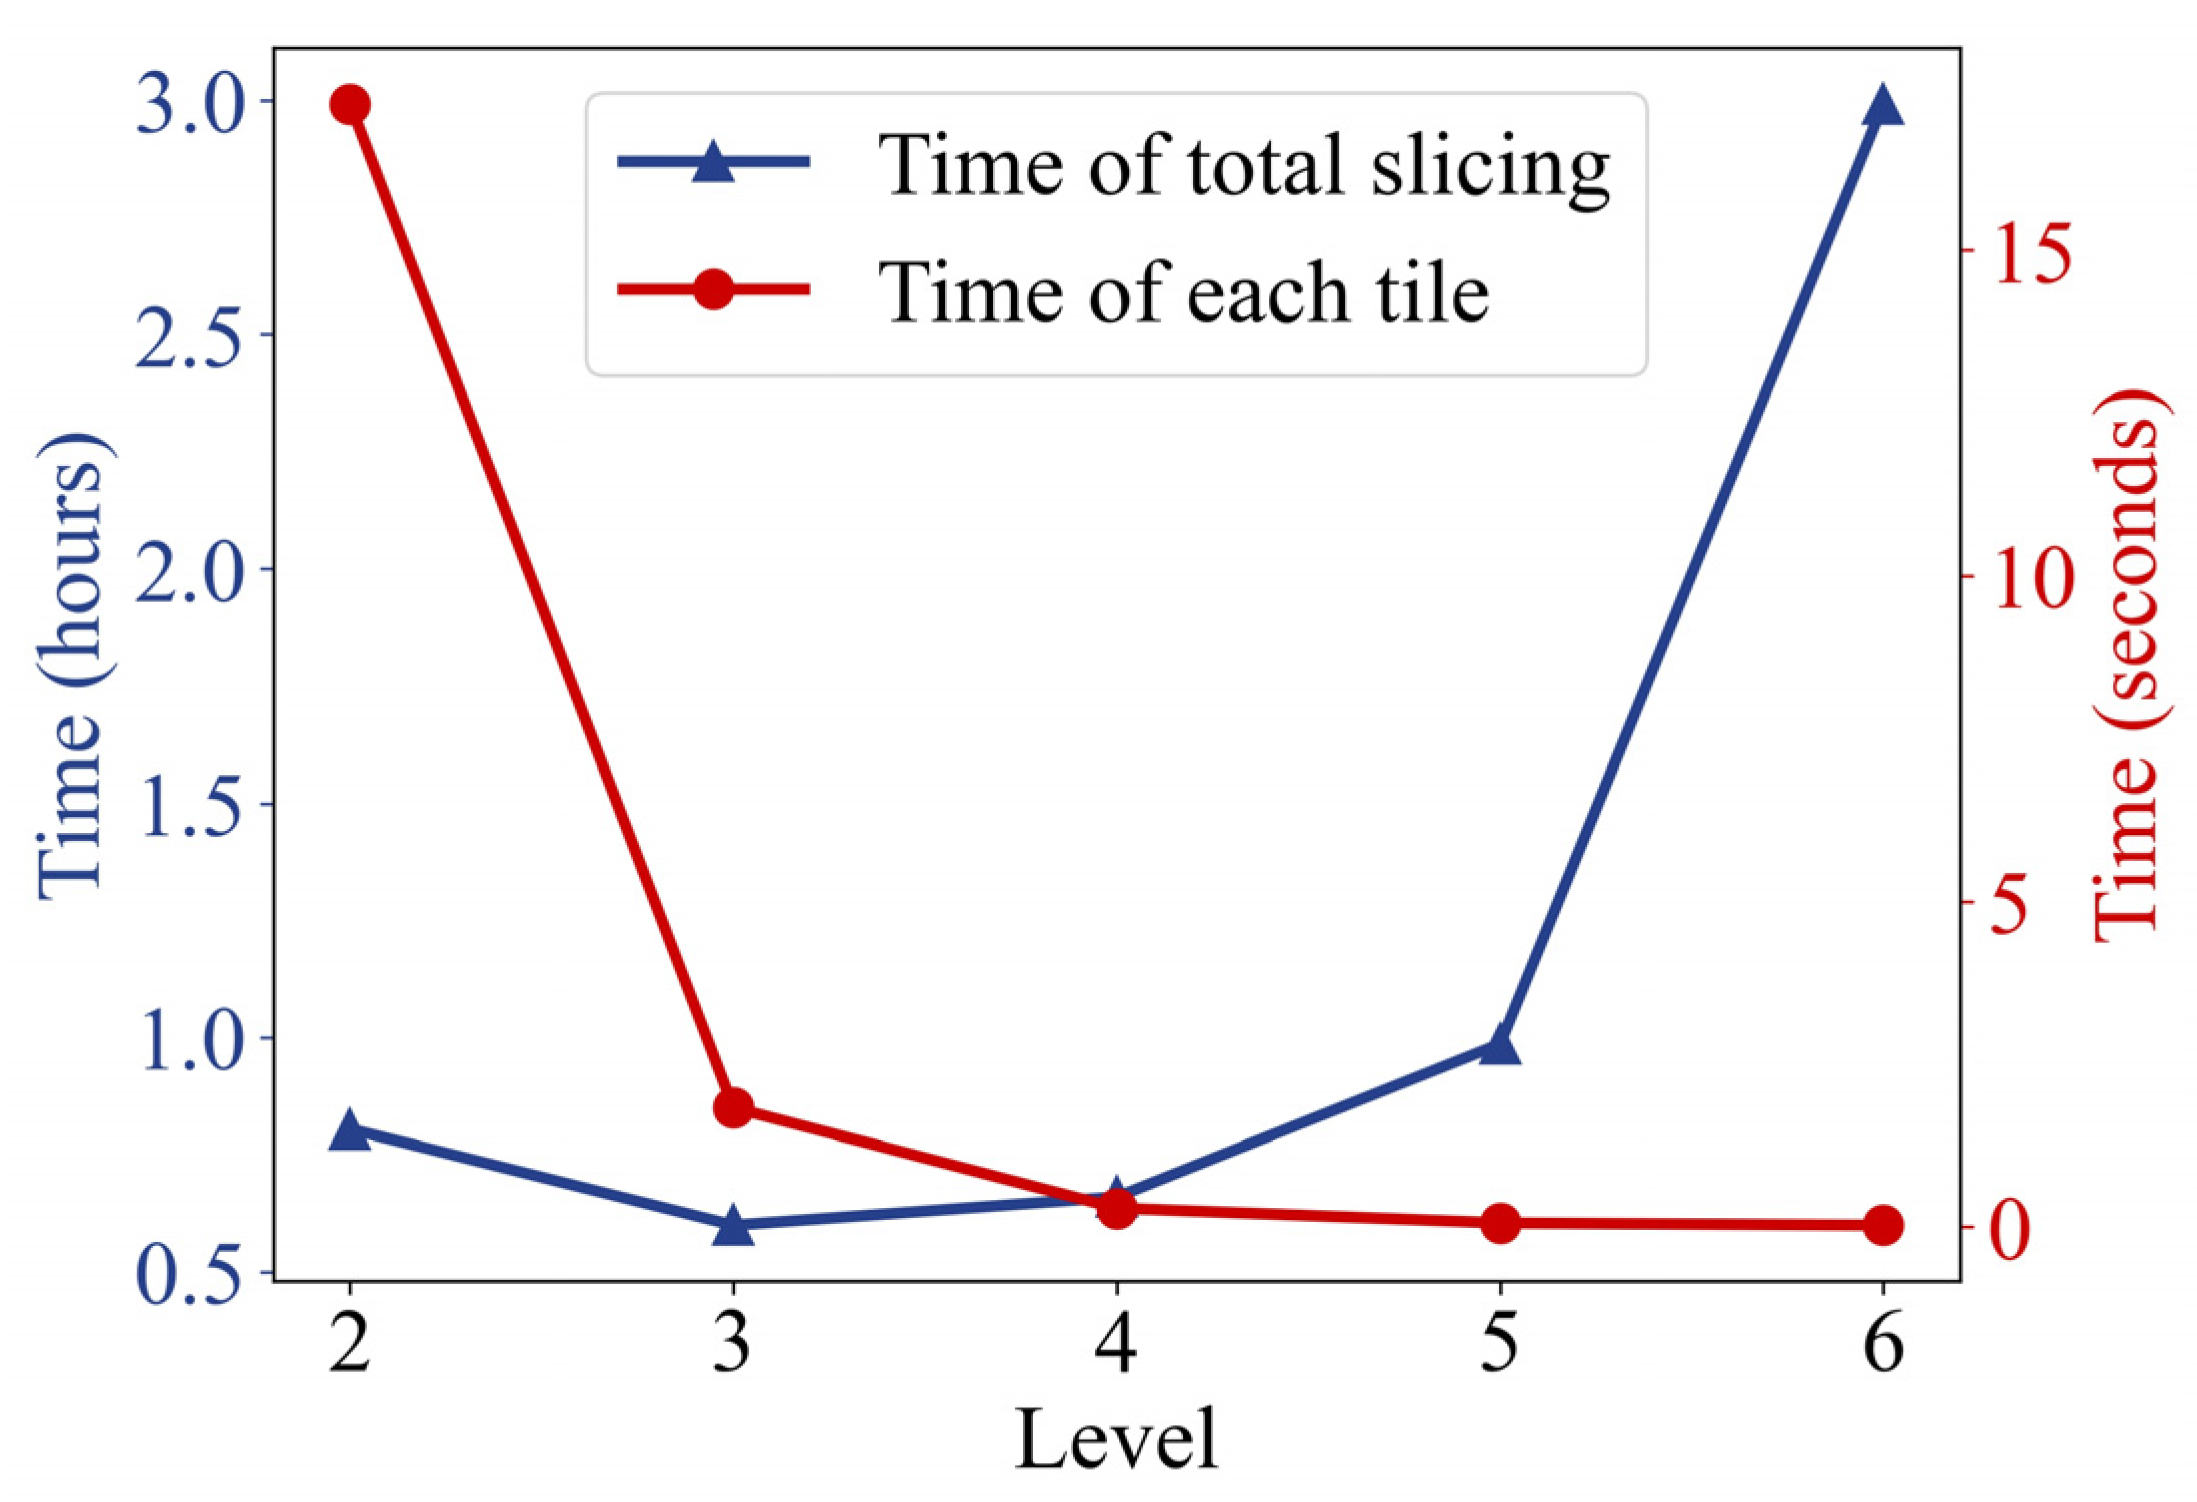
| Level | Number of Hexagon Tiles |
|---|---|
| L2 | 168 |
| L3 | 1183 |
| L4 | 8210 |
| L5 | 57,444 |
| L6 | 402,122 |
| Study Areas | Indices | DISI | RMSE | ||||
|---|---|---|---|---|---|---|---|
| Levels | 4 | 5 | 6 | 4 | 5 | 6 | |
| (a) | Slice | 0.0347 | 0.0299 | 0.0157 | 2.0324 | 2.6402 | 0 |
| Merge | 1.1422 | 1.2268 | 1.1238 | 6.8613 | 6.3547 | 5.8274 | |
| (b) | Slice | 0.0849 | 0.0228 | 0.0101 | 2.0717 | 1.8140 | 0 |
| Merge | 1.2670 | 1.1699 | 1.0892 | 7.2619 | 6.6685 | 3.9679 | |
Disclaimer/Publisher’s Note: The statements, opinions and data contained in all publications are solely those of the individual author(s) and contributor(s) and not of MDPI and/or the editor(s). MDPI and/or the editor(s) disclaim responsibility for any injury to people or property resulting from any ideas, methods, instructions or products referred to in the content. |
© 2023 by the authors. Licensee MDPI, Basel, Switzerland. This article is an open access article distributed under the terms and conditions of the Creative Commons Attribution (CC BY) license (https://creativecommons.org/licenses/by/4.0/).
Share and Cite
Yao, X.; Yu, G.; Li, G.; Yan, S.; Zhao, L.; Zhu, D. HexTile: A Hexagonal DGGS-Based Map Tile Algorithm for Visualizing Big Remote Sensing Data in Spark. ISPRS Int. J. Geo-Inf. 2023, 12, 89. https://doi.org/10.3390/ijgi12030089
Yao X, Yu G, Li G, Yan S, Zhao L, Zhu D. HexTile: A Hexagonal DGGS-Based Map Tile Algorithm for Visualizing Big Remote Sensing Data in Spark. ISPRS International Journal of Geo-Information. 2023; 12(3):89. https://doi.org/10.3390/ijgi12030089
Chicago/Turabian StyleYao, Xiaochuang, Guojiang Yu, Guoqing Li, Shuai Yan, Long Zhao, and Dehai Zhu. 2023. "HexTile: A Hexagonal DGGS-Based Map Tile Algorithm for Visualizing Big Remote Sensing Data in Spark" ISPRS International Journal of Geo-Information 12, no. 3: 89. https://doi.org/10.3390/ijgi12030089