Article

Analysis of the Spatial Distribution and Associated Factors of the Transmission Locations of COVID-19 in the First Four Waves in Hong Kong

1
Department of Land Surveying and Geo-Informatics, The Hong Kong Polytechnic University, Hong Kong 999077, China
2
State Key Laboratory of Information Engineering in Surveying, Mapping and Remote Sensing (LIESMARS), Wuhan University, Wuhan 430079, China
*
Author to whom correspondence should be addressed.
ISPRS Int. J. Geo-Inf. 2023, 12(3), 111; https://doi.org/10.3390/ijgi12030111
Submission received: 4 November 2022 / Revised: 27 February 2023 / Accepted: 2 March 2023 / Published: 6 March 2023

Abstract

:
Understanding the space–time pattern of the transmission locations of COVID-19, as well as the relationship between the pattern, socioeconomic status, and environmental factors, is important for pandemic prevention. Most existing research mainly analyzes the locations resided in or visited by COVID-19 cases, while few studies have been undertaken on the space–time pattern of the locations at which the transmissions took place and its associated influencing factors. To fill this gap, this study focuses on the space–time distribution patterns of COVID-19 transmission locations and the association between such patterns and urban factors. With Hong Kong as the study area, transmission chains of the four waves of COVID-19 outbreak in Hong Kong during the time period of January 2020 to June 2021 were reconstructed from the collected case information, and then the locations of COVID-19 transmission were inferred from the transmission chains. Statistically significant clusters of COVID-19 transmission locations at the level of tertiary planning units (TPUs) were detected and compared among different waves of COVID-19 outbreak. The high-risk areas and the associated influencing factors of different waves were also investigated. The results indicate that COVID-19 transmission began with the Hong Kong Island, further moved northward towards the New Territories, and finally shifted to the south Hong Kong Island, and the transmission population shows a difference between residential locations and non-residential locations. The research results can provide health authorities and policy-makers with useful information for pandemic prevention, as well as serve as a guide to the public in the avoidance of activities and places with a high risk of contagion.

1. Introduction

The COVID-19 pandemic has spread to more than 200 countries/regions, which is greatly affecting people’s lives around the world [1]. As a pandemic caused by a coronavirus, the spread of COVID-19 has proven to be highly related to the urban environment [2]. Consequently, understanding the space–time distribution of COVID-19 transmission locations, especially in highly populated cities with complex environments, is of great importance to pandemic prevention.
Currently, scholarly works on the clustering of COVID-19 mainly include the detection of clusters of COVID-19 cases and the analysis of factors affecting such clustering. In exploring the detection of clusters of COVID-19 cases, descriptive statistical analysis, spatial autocorrelation analysis, and space–time scanning statistics were identified as the most commonly used methods. According to different research scales, analyses can relate to countries, provinces, and cities. Several studies show that the spatial clustering of epidemic distributions exhibits different characteristics at different scales, which is worthy of further study. For instance, a study [3] revealed that China’s provincial-level epidemics have a significant degree of spatial correlation; K. Y. Lai et al. [4] also investigated the distribution of COVID-19 hot spots in various cities in China; a study by Xiong et al. [5] posited that cases in Hubei Province were clustered in cities such as Wuhan and Xiaogan; and Desjardins et al. [6], in their study, also used SaTScan to detect COVID-19 clusters at the county and city level in the United States.
The activities of people and the locations visited during the pandemic are affected by socio-demographic and environmental characteristics. This, by implication, makes certain places or locations prone to higher risk as they are associated with certain characteristics [7]. In an attempt to observe the impact of socio-demographic and built environment characteristics on the spatial pattern of the spread of COVID-19 in Hong Kong, many scholarly works have used the case tracking data released by the Hong Kong government [8,9]. Similarly, Mollalo et al. [10] found that factors such as median household income, income inequality, the proportion of nurse practitioners, and the proportion of black women in counties and cities of United States have a higher explanatory power for the incidence of COVID-19; Pourghasemi et al.’s [11] study also revealed that the distribution of bus stations, bakeries, hospitals, and mosques in various provinces of Iran is closely related to the spread of the epidemic; lastly, other studies have also shown the inhibitory effect of community prevention and control measures on virus infection [12]. In addition, it has been found that the impact of environmental factors on the spread of COVID-19 in Hong Kong is non-stationary in time [13]. This confirms the findings of other researchers that the spatial distribution of the first wave of COVID-19 is different from that of the second wave [14,15], and that the association between the built environment and socio-demographic characteristics and the spread of COVID-19 may be different for successive COVID-19 waves [2,8].
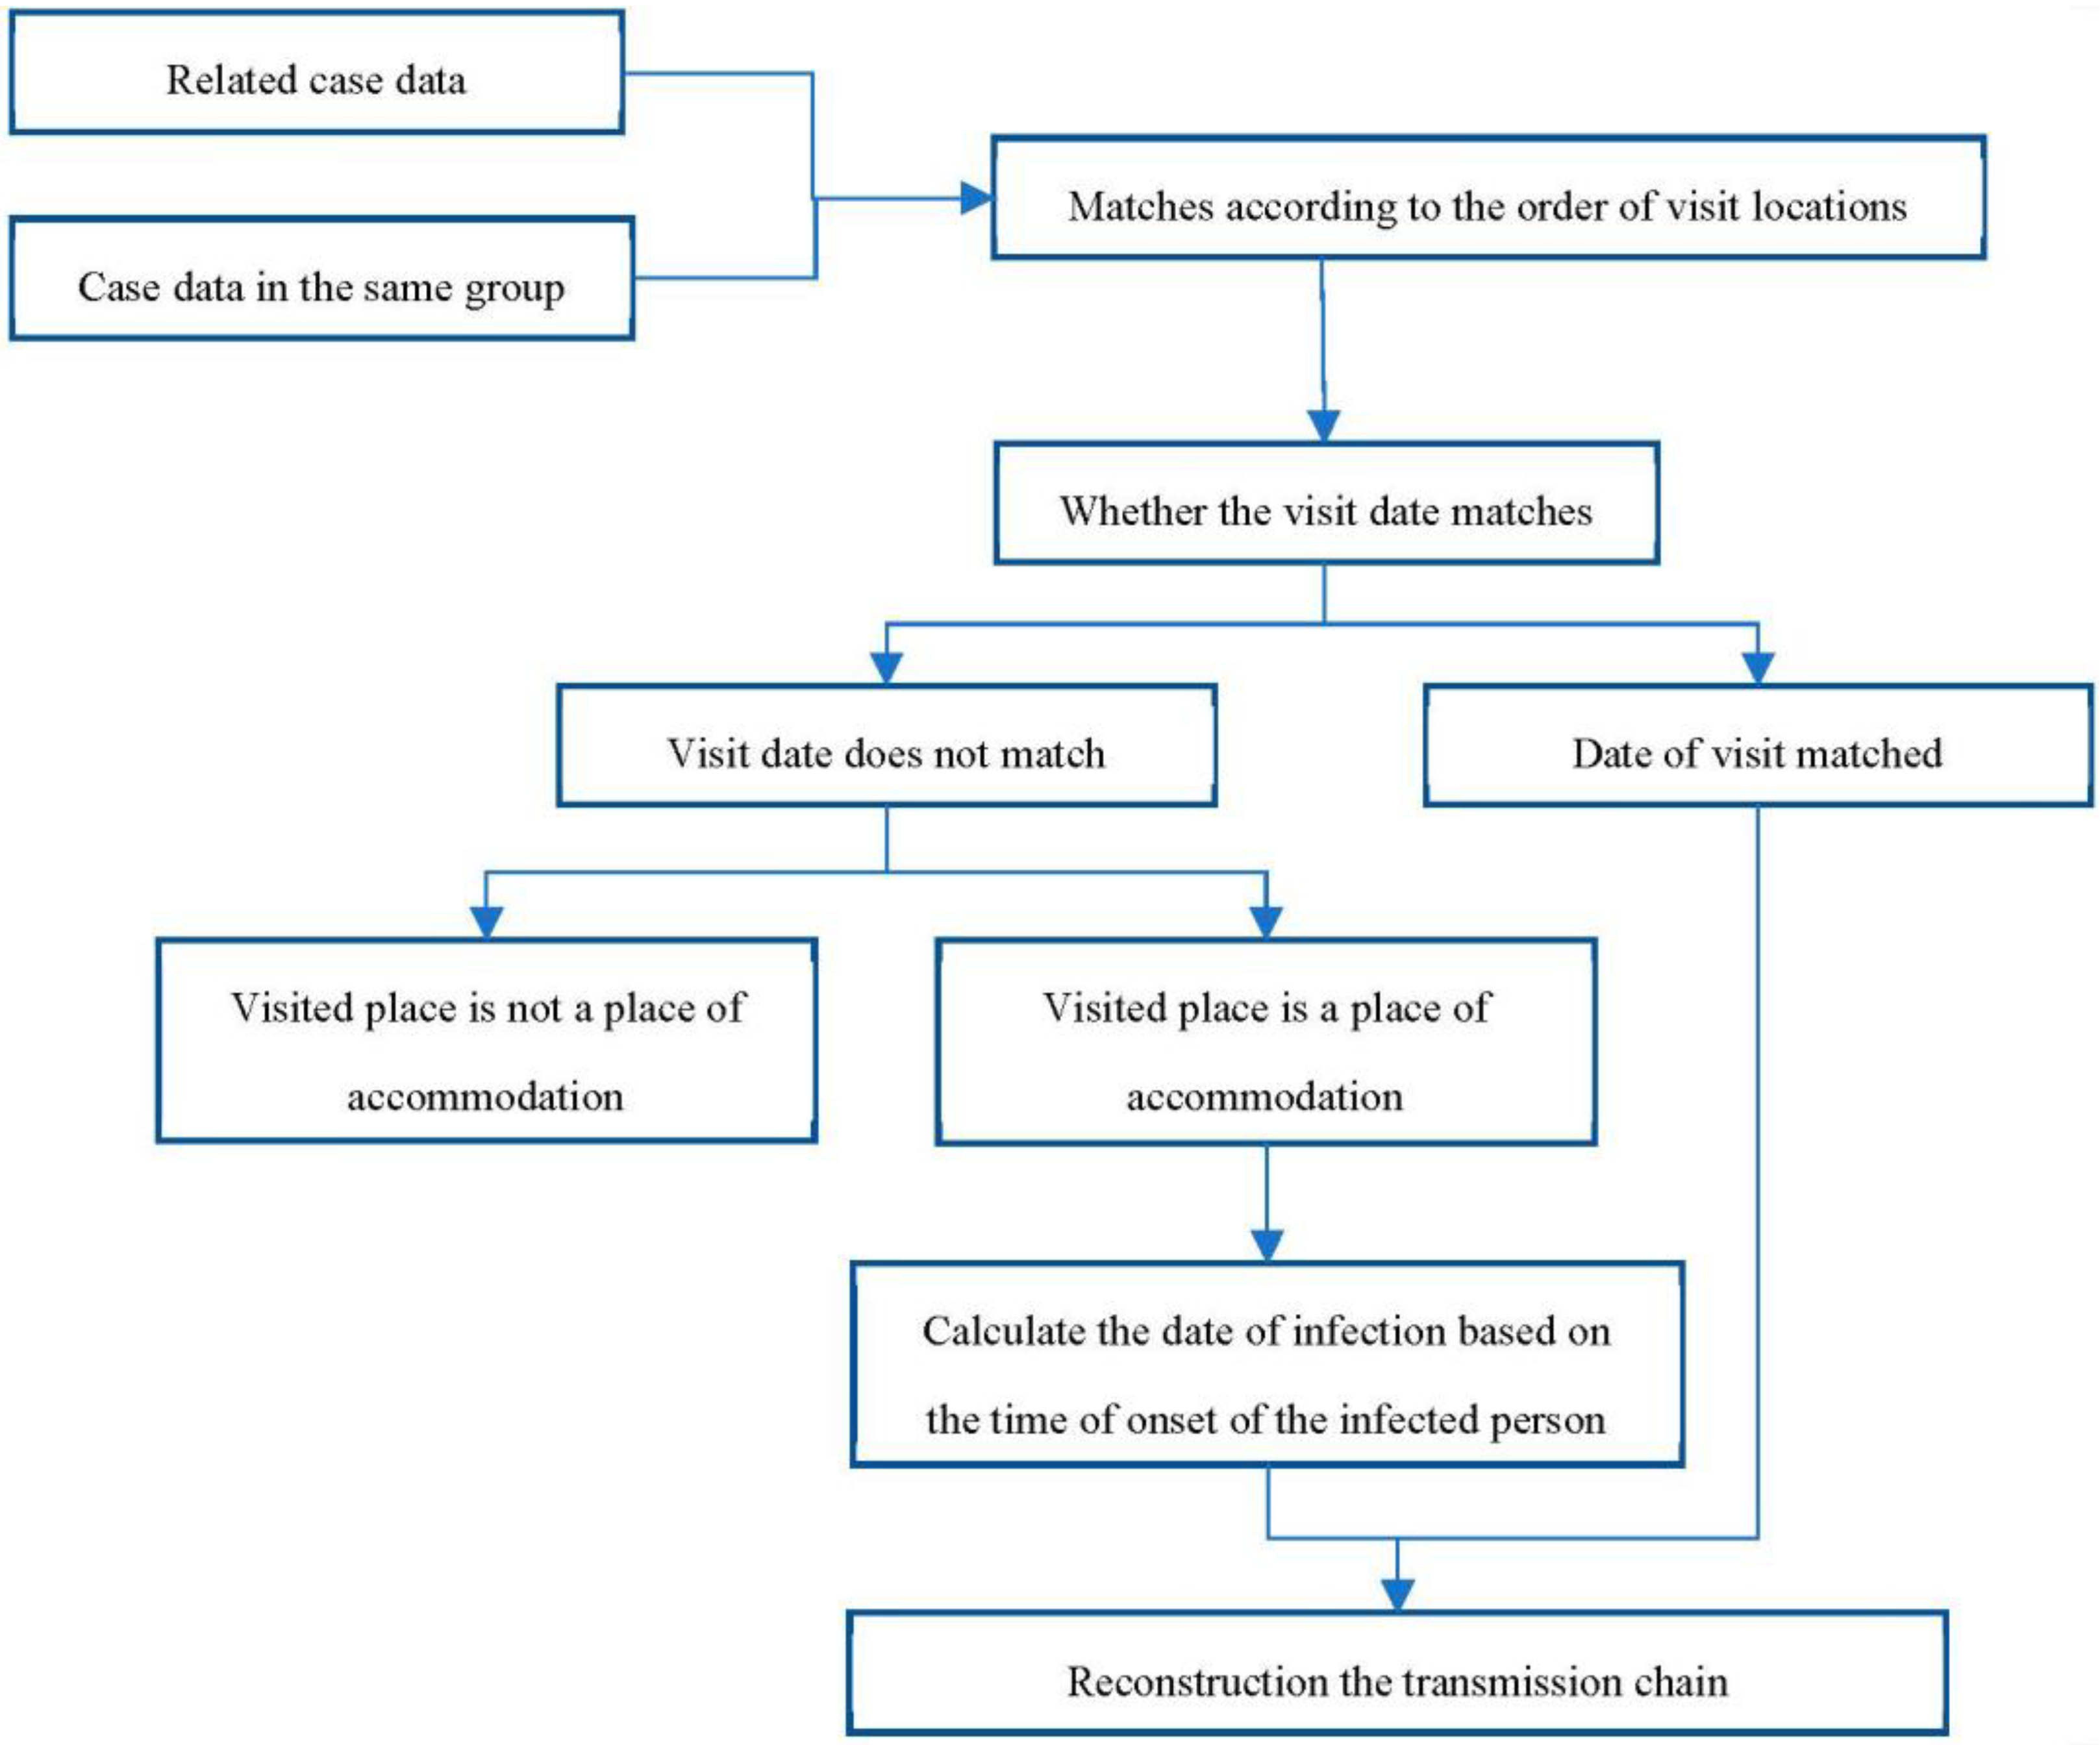
In the above studies on the space–time distribution of COVID-19 and the affecting factors, the distribution of COVID-19 has been represented by locations resided in or visited by COVID-19 cases, but not the transmission locations, that is, the locations where the infectors transmitted the virus to the now carriers. By reconstructing the transmission chains of COVID-19 and inferring the actual times and locations of the infections, more accurate space–time characteristics of COVID-19 transmission can be obtained. There have been studies on the information collected through enhanced on-site investigations (such as contact tracing) that can directly determine the transmission chain [16,17,18]. It is more common to infer the transmission chain by defining the probability of each epidemiological link, which depends on the space and time intervals between infections [19,20,21,22]. So far, few scholarly works have used the reconstructed transmission chain to prove the clustering and super-transmission potential of COVID-19 [23]. Another study also determined the effectiveness of Singapore’s epidemic prevention measures based on the transmission chains of COVID-19, highlighting the importance of social distancing and the detection of positive cases [24].
At this stage, the research on transmission chains plays a more important role in the analysis of the spatial distribution and associated factors of COVID-19 transmission. In addition, there are also some other indoor and outdoor localization and contact tracking approaches to help acquire potential transmission locations and reconstruct the transmission chain [25,26,27]. The factors that influence the model of the transmission chain have been investigated by researchers and they found that there are different relevant demographic and environmental characteristics leading to the varying results. Seong et al. [28] compared the second and third waves of COVID-19 in South Korea during the time period between August 2020 and January 2021, and found that the transmission chains between different waves have significant differences; that is, the local transmission during the third wave is lower than during the second wave, and is more affected by personal contact transmission and other unknown routes. Yang et al. [29] collected contact tracing data in a municipality in Hubei province under one wave of COVID-19, and date of infection and infector–infectee pairs were acquired from the travel record in Wuhan and relationship with ensured cases. The final results indicate that the transmission chains are not significantly different among different sex and age groups. Lokuge [30] developed a novel approach for detecting potential transmission chains in the local communities and hospital cases; fever, cough, and ARI testing are adopted as the influencing factors for model prediction and estimation, which can provide an effective policy reference for pandemic prevention. Malheiro et al. [31] explored the effectiveness of daily contact tracing and quarantine towards the COVID-19 transmission chain. Intervention and control groups were conducted respectively for effectiveness comparison, and they found that public health measures can reduce the time between symptom onset and prevent the fast spread in the transmission chain to some degree.
However, these previous studies still suffer from the following limitations:
(1)
Most studies on the space–time distribution of COVID-19 and the affecting factors focus on the residential locations or visited locations of the confirmed cases. Few studies, however, have investigated the patterns of those specific locations at which the transmission actually occurred, though these locations are rather more directly related to the pandemic prevention;
(2)
Arguably, there is no research that has revealed time and space patterns of COVID-19 transmission locations. Consequently, the contributions of spatial patterns of COVID-19 transmission locations and socio-economic/environmental factors to COVID-19 transmission remain under-explored.
To address these limitations, this study presents Hong Kong as an area for case study to explore the space–time pattern of COVID-19 transmission and its associated urban factors, in terms of the actual transmission location inferred from transmission chains. Location matching, based on collected case information, was performed to determine the specific location of the spread of COVID-19 that was used to reconstruct the epidemic transmission chain. In this work, benefitting from the continuous social restriction policy applied by the Hong Kong government, the number of COVID-19 cases under the first four waves maintains a relatively stable level, thus it is significant to explore the COVID-19 transmission features under the social restriction policy, which can be helpful for government decision-making. It was revealed that the aggregations of COVID-19 transmission sites were weak in the early stage of the pandemic, increased significantly in the middle stage, and maintained a high level in the later stage of the pandemic. The study also found some differences in the space–time patterns of different waves and different locations. According to the analysis, these differences in the spread of the pandemic were caused by social inequalities and the groups who were susceptible at different stages of the pandemic were different. In addition, the locations of COVID-19 transmission clusters in different stages were analyzed and the relevant influencing factors in high-risk areas were investigated in different infection waves to provide decision makers with key pandemic prevention information.

2. Data Preparation and Methods

2.1. Research Area and Data

This study selected Hong Kong as the research area. As of mid-2021, the provisional population of Hong Kong is 7,394,700, of which 7,330,500 are permanent residents and 64,200 are temporary residents. However, Hong Kong’s residential area is only 79 square kilometers, making it a very densely populated city. The total land area of Hong Kong is 1106.34 square kilometers, which can be divided into 291 tertiary planning units (TPU). These TPUs are delineated by the Hong Kong Government Planning Department for urban planning. TPU is taken as the basic unit for this research in Figure 1a.
The COVID-19 case data used in this study were published by the Hong Kong Special Administrative Region government. Case data were collected from four waves of the pandemic during the period 2020 to 2021. The first and second waves occurred from 22 January 2020 to 22 June 2020, and the third wave was from 23 June 2020 to 22 November 2020. The fourth wave occurred from 23 November 2020 to 11 June 2021. With reference to the stage of the epidemic, the four waves were divided into three stages, hereinafter collectively referred to as stages I, II, and III. Under these time periods, stage I contains the first wave and second wave, stage II indicates the third wave, and stage III represents the fourth wave. The three different stages also indicate the different degrees of COVID-19 outbreak: stage I includes the first and second waves, representing a relatively slight spread, better than that of stages II and III. Among the collected records, there were 1209 confirmed cases in stage I, 4307 confirmed cases in stage II, and 6248 confirmed cases in stage III. Information about each case in the dataset includes its group (a group is defined as two or more confirmed infections that have reported close contact), age, gender, confirmation date, onset date, case type (as this article studies the locations of the transmission of COVID-19 in Hong Kong, this article only analyzes cases where the locations of transmission occurred in Hong Kong), the residential locations of the cases, the buildings or places visited by the confirmed cases in the past 14 days, and the activities of the patients in these places. The original confirmed COVID-19 cases and their location data are all provided by the Hong Kong Special Administrative Region government on their website. For the final dataset, this paper firstly collects the daily cases under different waves from the government website <https://www.coronavirus.gov.hk/sim/index.html accessed on 1 September 2021> and uses the proposed COVID-19 transmission chain reconstruction algorithm to acquire the transmission locations to generate our final dataset for clustering and influencing factor analysis. The demographic and socio-environmental statistics used in this study were published by the Hong Kong Census and Statistics Department. The statistical data included median monthly income, population density, building density, density of roads and transport facilities, private residential density, public residential density, commercial/business and office density, government, density of institutional and community facilities, open space and recreation density, and density of woodland and grassland. The description of data acquisition and the whole analysis process is shown in Figure 1b,c, which describes the weekly case statistics results among different waves.
Figure 1c also shows the weekly statistics of the number of confirmed cases during the four different waves, as well as the statistics of the number of transmissions with transmission chain information obtained according to preprocessing. During this period, there were 11,842 confirmed cases and, after preprocessing, 2417 cases that could build transmission chains were obtained. The results showed that the changing trend of the transmission chain data was consistent with the changing trend of confirmed cases. It shows that the collected transmission data are still representative of the time, that is, the sampling in different stages of the case is relatively uniform. The time in the transmission chain data is the time when a case was infected with COVID-19, not the time of diagnosis, so the trend change of the line chart is slightly earlier than that of the histogram of all cases.

2.2. Research Methods

2.2.1. Reconstruction of the COVID-19 Transmission Chain for Hong Kong

The case data were first preprocessed to identify the locations of COVID-19 transmission and then used to reconstruct the chain of COVID-19 transmission. The flowchart of data preprocessing is shown in Figure 2. Some cases in the dataset indicated some relatedness through the association between close contacts and their infected family members. The locations and dates of visits by these related cases in the same group were then matched (see Section 2.1) to determine the COVID-19 transmission locations. All data were manually checked after the matching process. Finally, these COVID-19 transmission locations were divided into two categories based on case activities: residential location transmission and non-residential location transmission. During the study period, 2417 transmission sites with determinable transmission locations and dates were obtained in total, of which 1286 were residents and 1131 were non-residents. Figure 3a–c show the transmission chains of the four waves of COVID-19 under stage I, stage Ⅱ, and stage Ⅲ, respectively.

2.2.2. Analysis of the Clustering Changes and Hot Spots of COVID-19 Transmission Locations

To analyze the spatial patterns of the transmissions locations, the nearest neighbour ratios (NNRs) [25] and Global Moran Index [26] were used as measures of the aggregation characteristics of different waves and different transmission locations.
Based on the spatial distances between these transmission locations, the nearest neighbour ratio (Equation (1)) was used to identify clusters of transmission. An NNR less than 1 indicates that the locations of transmission tend to be clustered, while an NNR greater than 1 indicates that the locations of transmission tend to be more discrete. The closer the NNR value to 1, the greater the probability of randomness.
N N R = i d i / N 0.5 / N / A
where d i is the distance from a certain confirmed case I to its nearest transmission location, N is the total number of transmission locations, and A is the area of the entire region.
For the transmission locations at the TPU scale, the Global Moran Index (Equation (2)) was selected to identify their spatial autocorrelation. The value of Moran’s I index reflects the degree of similarity of observations in spatial neighbours. The value range is [−1, 1]. The larger the absolute value, the stronger the correlation, whereas the high values cluster around high values, and the low values gather around low values.
I = n i j w i j i j w i j x i x ¯ x j x ¯ i ( x i x ¯ ) 2
where x i and x j are the cumulative number of transmissions of different TPU units; x ¯ is the average value of the cumulative number of transmissions of different TPU units; n is the number of TPU units; and w i j is the weighting of the space between TPU units I and j used to measure the proximity relationship between spatial units.
For the analysis of spatial clustering of pandemic hot spots, the local Getis-Ord Gi* index (Getis and Ord, 2010) (Equation (3)) was used to identify the COVID-19 transmission location hot spots on the TPU scale. The basic principle was to calculate the sum of the elements adjacent to a certain element within a specified range and compare that to the sum of all elements when analyzing the local spatial aggregation characteristics of the element. If the Gi* value is positive and large, it means that the spatial unit i is a high-value aggregation unit; otherwise, it is a low-value aggregation unit.
G i * = j w i j x j x ¯ j w i j j x j 2 n x ¯ 2 n j w i j 2 j w i j 2 n 1
where w i j is the space weighting between street units i and j. The space weight used is the same as that used to calculate Moran’s I index.

2.2.3. Space–Time Scan Statistics Based on the Location of COVID-19 Transmission

Space–time scan statistics have been widely used in epidemiological cluster analysis to perform the geographic monitoring of diseases; detect increases in the number of cases and test whether this is caused by random mutation; and detect whether a certain area is clustered, thereby accurately locating gathering areas. In this study, the space–time scanning statistics (STSS) of the SaTScan™ software package was used to detect significant space–time clusters and analyze the space–time distribution patterns of COVID-19 transmission locations in Hong Kong. Scanning statistical analysis is performed at the TPU level to examine and analyze the association between COVID-19 transmission locations and socio-environmental characteristics. In addition, each cluster, as well as the relative risk value (RR, Equation (4)) of the TPU within the cluster, are calculated.
R R = n / e N n / N e
where RR is the relative risk of a TPU; n and N are the total numbers of COVID-19 transmissions in the cluster and the entire study area, respectively; and e is the expected number of COVID-19 transmissions in the cluster. When the relative risk value is greater than 1, it means that the cluster has a higher risk of spreading COVID-19 compared with locations outside the cluster.
As for the location of transmission in residential areas, it follows the null hypothesis, which states that the expected number of locations where COVID-19 transmission occurred follows the Poisson distribution of population dispersion in each TPU. The alternative hypothesis is that the number of COVID-19 transmission locations observed in the area should exceed the expected number in the original hypothesis [6]. For the transmission of COVID-19 in non-residential locations, the null hypothesis is that the number of transmission locations should follow the discrete Poisson distribution of the building numbers in the TPU.

2.2.4. Correlation between Spatial Context and COVID-19 Infection Location

By comparing the detected characteristics of the clustered TPU and the characteristics of the TPU outside the cluster, the statistical significance of the difference between the cluster group and the non-cluster group TPU characteristics is further explored. To test for statistical significance, the distributions of selected features in the two groups were checked. The results show that all the features do not conform to the normal distribution. Thus, the box plot can be used to determine the significance of the difference between the clustering unit and the non-clustering unit of each feature. If the difference is significant, there is sufficient evidence that the feature is related to the risk of COVID-19 transmission.
A binary logistic regression model, which is multivariate [27], was used to examine the correlation between the COVID-19 transmission locations and socio-demographic characteristics and the environment in different waves. As the variance inflation factor (VIF) values of these influencing factors in the regression analysis are all less than 10, the issue of multicollinearity can be ignored [28]. Logistic regression of control analysis was performed in the model, where residential transmissions and non-residential transmissions were used as the treatment group, and all TPU information was used as the control targets. The independent variables of each model were selected from environmental and socio-demographic characteristics, including 11 influencing factors: population density, building density, the density of roads and transportation facilities, the density of private residential land, density of public residential land, the density of open space and leisure land, density of commercial land, woodland density, grass density, and median household income.
In addition, we use the non-parametric Mann–Whitney U test to determine the significance of the difference of the extracted 11 influencing factors in residential location and non-residential location under different transmission stages between clustered TPUs and non-clustered TPUs, and we have strong evidence that the feature is associated with a higher risk of occurrence and transmission of COVID-19 when the calculated asymptotic two-tailed significance (p-value) is close to the set threshold p-value = 0.05.

3. Results

In this work, public data acquired from four waves of COVID-19 outbreak in Hong Kong during the time period of January 2020 to June 2021 are applied for results analysis. Firstly, we explore the clustering characteristics and hotspot distribution and movements among different transmission stages. Secondly, we analyze the space–time clusters of COVID-19 transmission locations among residents and non-residents, respectively, among different transmission stages. Finally, we compare relevant demographic and environmental characteristics and their corresponding effects.

3.1. The Clustering Characteristics and Hotspot Distribution of COVID-19 Transmission Locations

For the study period, the NNR index in different COVID-19 waves of residential and non-residential transmission locations in Hong Kong is shown in Table 1.
The NNR index of the COVID-19 transmission locations are all significant at the 0.001 level and show stage characteristics in different waves. Non-residential transmissions for all stages are smaller than the residential transmissions, indicating that non-residential locations have stronger aggregations of infections, while residential location infection clustering is relatively weak. In stage I, residential transmissions show the weakest aggregations. COVID-19 transmission occurred in the residence, showing a marked increase in aggregation from stage I to stage II, and the aggregation of stage III is maintained at high levels, although slightly lower than that of stage II. As for the transmission of non-residential locations, the aggregation is strong from stage I, with each successive stage having a stronger clustering trend.
In the study period, the Moran’s I index of different stages and the contact locations are shown in Table 2.
As shown in Table 2, the Moran’s I index of residential transmission in stage I is relatively small. Subsequently, stage II shows a trend of rapid aggregation of the locations of COVID-19 transmission and, for stage III, the spatial autocorrelation declines slightly, and the Moran index of the residential locations shows the same trend as the NNR index. For the transmission of COVID-19 in non-residential areas, the Moran’s I index is basically the same in the first stage as the transmission of residential locations, and gradually increased in stages II and III, which shows the same change as the NNR index. The results show that the clustering of COVID-19 transmission locations in residential areas is stronger than that in non-residential areas, and the clustering of COVID-19 stage I was relatively weak. Subsequently, the concentration of transmission locations in stage II of the pandemic increase significantly and remained at a high level in stage III of the pandemic.
Figure 4 shows the hot spots of the spread in different stages and locations. Hotspot (high value) areas that passed the significance test (p < 0.05) were identified.
In the stage I of the pandemic, the hotspots of transmission locations in residential areas were mainly located in the southeast of Hong Kong Island, described in Figure 4a, while the hotspots in non-residential areas were also located in Kowloon and the western part of Hong Kong Island, described in Figure 4d. In stage II, the hotspot areas of transmissions moved north to Kowloon and parts of the New Territories, described in Figure 4b. In addition, Hong Kong Island even became a cold spot area, with a lower Gi* index. In this stage, the distribution of hotspots for non-residential locations is similar to that of the residential locations described in Figure 4e. In stage III, the hotspots spreading in residential areas were mostly located in Kowloon and the New Territories, described in Figure 4c, while the hotspots of transmission in non-residential locations again moved back to Hong Kong Island, described in Figure 4f. The difference in the spatial distributions of hotspots of COVID-19 transmissions between residential and non-residential locations illustrates different influencing factors and internal mechanisms of the two modes of transmission. At the same time, the obvious differences between the different stages of the pandemic also suggest that it may be that either the places where COVID-19 transmission took place are different in one way or another or the people who are susceptible may also be different.

3.2. Space–Time Clusters of COVID-19 Transmission Locations

To determine the appropriate spatial and temporal windows for space–time statistics, different space–time window tests were conducted on the data that occurred in residential and non-residential transmission locations. As a rule of thumb, we selected 1%, 2%, and 3% of the risk population as the spatial window, and either 30% or 50% of the study period as the temporal window for testing. For non-residential transmissions, when using 2% of the population as the spatial window during the study period, some discontinuous areas separated by Victoria Harbour were included in a cluster. Therefore, it is believed that the spatial window of 2% of the population is too large. For the time window, the time length of all detected clusters was within 30% of the study period. Therefore, for TPU non-residential locations propagation, 1% of the population was selected as the spatial window and 30% of the research period as the time window. In the same way, for residential transmission locations, 2% of the population and 30% of the study period were selected as the space and time windows, respectively. In addition, the detected clusters included at least two transmission locations and lasted for at least 2 days to avoid the detection of too small clusters.

3.2.1. Space–Time Clusters of COVID-19 Transmission in Residential Locations

Table 3 and Figure 5 show the characteristics and spatial distribution of the space-time clusters of COVID-19 stage I located in residential locations.
In COVID-19 stage I, most of the residential clusters were located in Kowloon and Hong Kong Island, with a total of five clusters. The relative risk values for these clusters ranged from 38.35 to 210.91. The cluster with the highest relative risk was located near Lan Kwai Fong, which occurred between 17 March and 22 March. Including the cases of the bar band and the Lan Kwai Fong group, the mode of transmission is that of family members being infected by the bar band with subsequent spread to their families. There was one cluster in Kowloon with five TPUs in total, with a relative risk of 45.43, including a bar band group and a karaoke group. There was only one cluster with a relative risk of 234.02 located in the New Territories. This was in Lek Yuen Village, where a cluster infection occurred in Luk Chuen House.
The characteristics and spatial distribution of stage II COVID-19 transmission clusters in residential areas are shown in Table 4 and Figure 6. A total of 27 clusters were detected, but only 16 clusters with higher risks were reported.
In this stage of the pandemic, most of the detected clusters were located in Kowloon and the New Territories. Whiles only one cluster was located on Hong Kong Island, eight clusters with eight TPUs were found in the New Territories. The relative risks ranged from 21.93 to 258.38, of which cluster 14 with the highest risk occurred at Wai Tau Tsuen, where the outbreak was caused by a case from this cluster that had visited Mui Wo Staycation and returned to Wai Tau Tsuen, resulting in multiple infections. The remaining six clusters, including a total of 14 TPUs, were in the Kowloon area, with a relative risk of 14.69 to 100.94. The cluster with the highest risk value in the Kowloon area was cluster 16, with a relative risk of 173.11, which includes the dormitories of the Lai King Disciplined Services Quarters and cases of bars and bands.
Table 5 and Figure 7 show the spatial distribution and the space–time clusters of transmission locations in residential areas detected in stage III. A total of 35 clusters were detected in this stage, but only 20 significant clusters with relatively high risks were reported.
In stage III, most clusters in residential locations were still located in Kowloon and the New Territories. There were only three clusters containing nine TPUs in Hong Kong Island, of which the highest risk value was 463.37. Located in the Fong Shue Chuen Day Activity Centre and Hostel Tung Wah Group of Hospitals, these facilities provide family-style residential services for adults with intellectual disabilities. A total of nine clusters were detected in the New Territories, including 18 TPUs, with relative risk ranging from 5.39 to 256.24. Among these clusters, cluster 9 with the highest risk occurred in Ji Hing Wai near Kam Tin. The remaining eight clusters, including 20 TPUs, were in Kowloon. The cluster with the highest risk value here was cluster 16, with a relative risk value of 125.37.

3.2.2. Space–Time Clusters of COVID-19 Transmission in Non-Residential Locations

Stage I of the pandemic’s transmission in non-residential locations, as presented in Figure 8 and Table 6, has eight clusters.
The results show that, in stage I of non-residential COVID-19 transmission, there were eight important clusters, and the detected clusters were mainly distributed within entertainment venues or commercial centers in the higher-income areas. The area with the highest relative risk value on Hong Kong Island was located near North Point. Two infection clusters occurred in this area from 25 January to 8 February. Cluster 1 was located near Wan Chai, a gathering place for entertainment and dining venues, where there had been multiple outbreaks. The highest relative risk was cluster 3, from 25 January to 26 January—a cluster of family transmissions occurred in this area. There was only one cluster located in the New Territories, due to a wedding banquet group at the Hong Kong Discovery Bay Hotel, with a relative risk of 381.70.
Stage II of the pandemic’s transmission in non-residential locations, as shown in Table 7 and Figure 9, has a total of 17 clusters. Only the 13 significant clusters are reported.
In stage II of non-residential COVID-19 transmission, the clusters were concentrated in the Kowloon area. There was only one cluster with a relative risk of 52.19 on Hong Kong Island. The pandemic broke out from this area within the period of 7 July to 4 August, including many who had been in the foreign domestic helpers’ dormitory in the Jian’an Commercial Building. There were eight clusters including 25 TPUs located in Kowloon. Among them, cluster 4 had the highest relative risk value, in an office building in the Kwun Tong area where 13 transmissions occurred between 16 July and 21. The cluster located in the New Territories that had the highest relative risk value of 256.67 is cluster 3, with 19 transmissions occurring between 5 and 21 July in a restaurant near Tuen Mun Central Plaza, where many service personnel and diners became infected.
Stage III of the pandemic’s transmission in non-residential locations is depicted in Table 8 and Figure 10, where only those 15 clusters with higher relative risks and more risk groups are reported.
Compared with stage II, stage III of COVID-19′s transmission in non-residential areas showed a significant increase in cluster locations on Hong Kong Island. A total of five clusters containing 14 TPUs were found on Hong Kong Island, of which the highest risk area was near Wan Chai. There was an outbreak due to singing and dancing groups in this area from 7 November to 24 November. There were six clusters including 15 TPUs located in Kowloon, with cluster 3 having the highest relative risk value at the Golden Era Plaza, which also belonged to a song and dance group. This cluster had 63 cases of transmission from 13 November to 25 November. There were five clusters in the New Territories, including six TPUs in total, of which cluster 7 had the highest relative risk. Transmissions were witnessed breaking out at a construction site of Wheelock Properties in Tseung Kwan O’s LOHAS Park. The results showed that this wave of transmission was concentrated in bars and clubs, and the proportion of restaurants remained at a high level. There was also an increase in the number of transmissions in fitness centrals and construction sites. We provide the overall evolution of different stages classified by residential and non-residential locations in Figure 11.

3.2.3. Relevant Demographic and Environmental Characteristics of the Transmission Locations of COVID-19

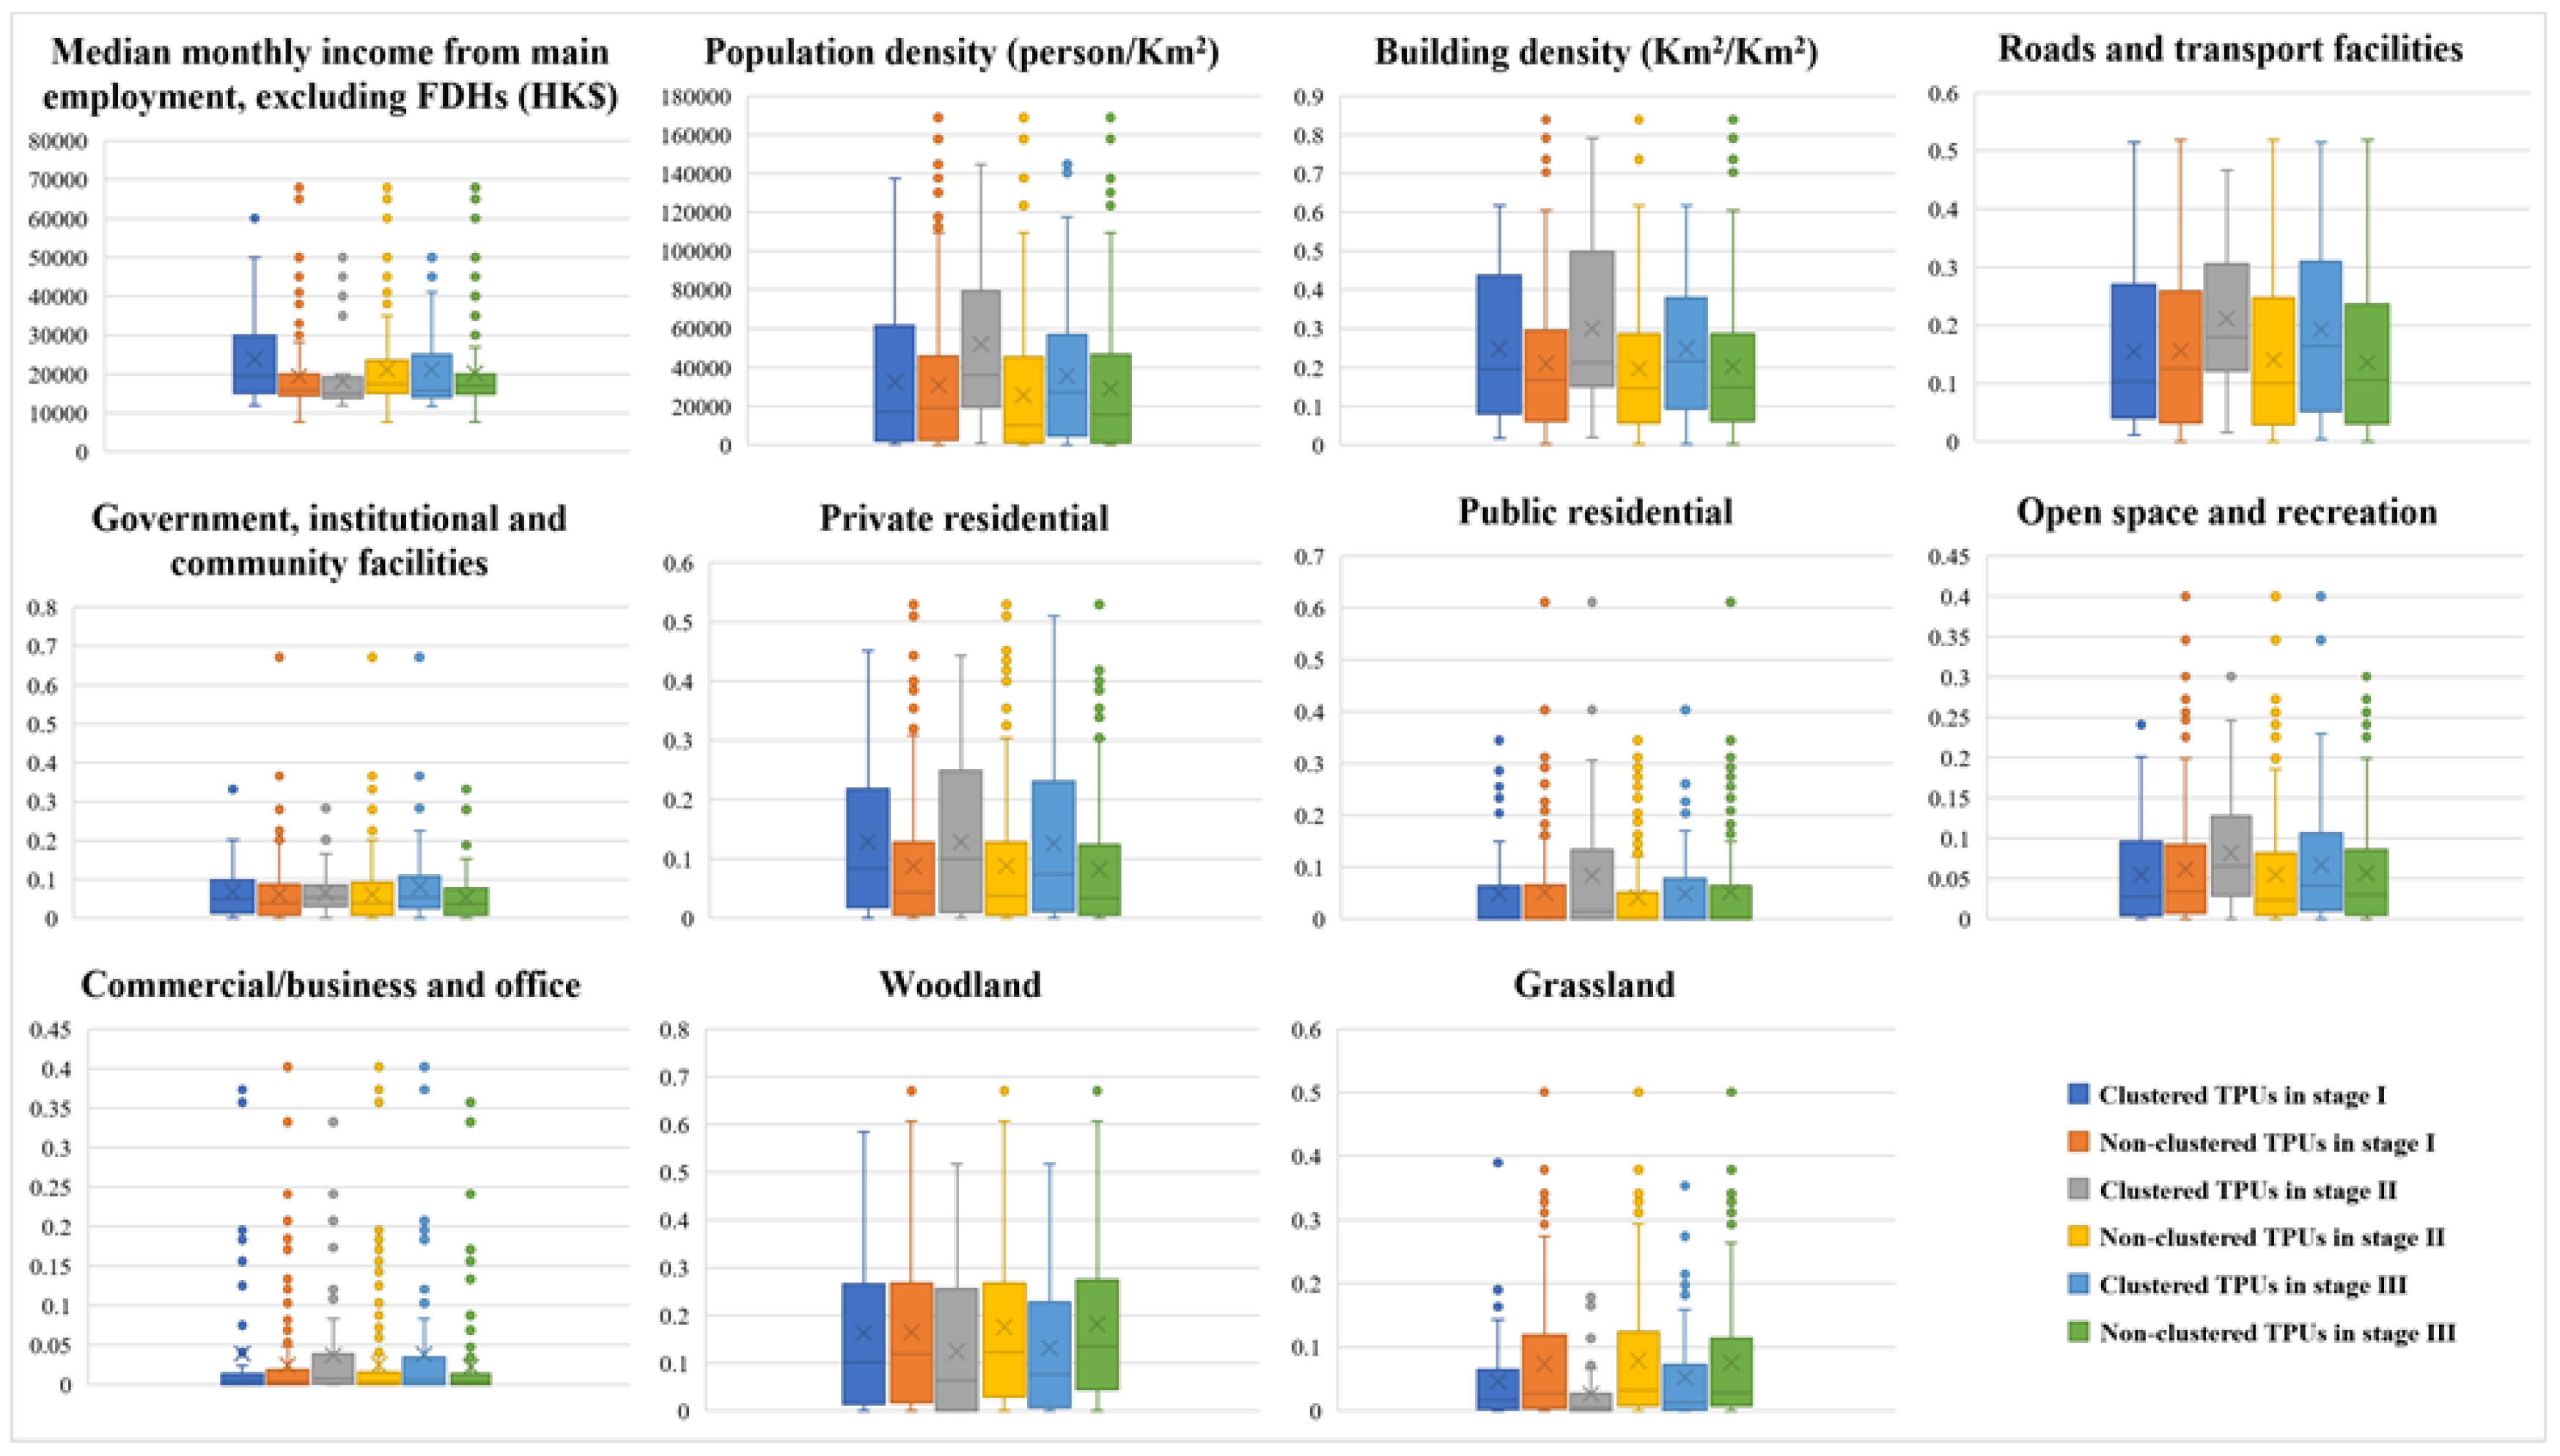
Based on the results of the four-wave COVID-19 space–time scan statistics, the possible influencing factors of clusters of different transmission locations were analyzed. Eleven influencing factors were considered, including population density, building density, density of roads and transportation facilities, density of private residential land, density of public residential land, density of open space and leisure land, density of commercial land, woodland density, grass density, and median household income.
Figure 12 and Figure 13 present the comparative results of the different characteristics applying to the cluster units and the non-cluster units in relation to COVID-19 transmission as affected by residential locations and non-residential location. The box plot shows the feature distributions of both cluster and non-cluster locations. In addition, a Mann–Whitney test is applied to reveal the relationship between the cluster units and the non-cluster units under different stages, and the calculated parameters are compared in Table 9 and Table 10, respectively. Besides, “p-value” is performed as asymptotic two-tailed significance of the Mann–Whitney test to describe the difference between clustered TPUs and non-clustered TPUs under different stages, because, the larger the number of samples, the more accurately the asymptotic approximation indicates the value.
It can be found from Figure 12 and Figure 13 that, during stage I of COVID-19 transmission, median household income was significantly higher in clustered TPUs than in non-clustered TPUs for both residential and non-residential locations, but this was reversed during the middle and late stages of the pandemic. These findings indicate that, in the early stage of the pandemic, COVID-19 clusters occurred primarily in wealthy communities, while the middle and late stages may have had more outbreaks in low-income communities. Besides, the population density of clustered TPUs in the pre-epidemic period of residence was lower than that of non-clustered TPUs, but the population density of clustered TPUs was, however, higher than that of non-clustered TPUs in stages II and III. This suggests that confirmed cases in stage I occurred in areas of higher socio-economic status and lower population density compared with the other two stages. In the Mann–Whitney test, the asymptotic two-tailed significance, namely p-value, proves significant differences under most kinds of features at different stages of residential location and non-residential location, and these features also prove different degrees of relationships according to the comparison between the magnitude of p-value with a standard value of 0.05.
In terms of environmental factors, residential-based COVID-19 cluster transmission in stage I of the pandemic occurred in ‘rich’ areas with a high density of private residential land, but lower densities of buildings, public residential land, land devoted to transportation needs, and land for rest and recreation. This suggests that the places where the imported cases lived at the beginning of the outbreak were private residential areas with low building density, low levels of accessibility, and low public transport provision. This is likely because, at the beginning of the pandemic, the virus began to spread among the families of people who worked or studied overseas and returned to Hong Kong, most of whom were likely to have a high socio-economic status.
The TPU clusters in stage II and III spread occurred among residential sites of higher building density, commercial density, density of roads and transport facilities, and open space and recreation density. Compared with stage I, TPU clusters in stages II and III have higher accessibility and higher density of open space and recreational space. Although cluster units in stages II and III were associated with higher private residential land density, they included a higher percentage of public residential density areas. This may be because these clusters are a mix of public and private residential areas that include nursing homes, among others. The government provides residential facilities for low-income families, indicating that most communities affected in stage II and III have a lower economic status than those affected in stage I.
The characteristics of the COVID-19 TPU cluster detected in non-residential locations are similar to those in residential areas, except for stage I. In stage I, non-residential TPU cluster transmissions possessed higher densities of commercial land, rest and recreation facilities, and transportation land density. In the case of non-residential transmissions, infection sites were more concentrated in offices and other commercial areas in the wealthier areas, which also means that stage II of the pandemic marked a change in the type of location dominating COVID-19 transmissions. There was no significant difference between stage II and stage III in transmissions with regards to residential and non-residential locations. Table 11 shows the odds ratio (OR) values of significant socio-demographic and environmental factors obtained by binary logistic regression.
The results showed that the transmission of COVID-19 is quite dissimilar in different locations and waves. The transmission was mainly influenced by the density of private and public residential areas in stage I. However, there was no significant correlation between COVID-19 transmission and private residential density in the other two stages of the pandemic. This is in line with the conjecture above, that transmission within residential locations occurring in the early stage is concentrated in wealthier areas, whereas COVID-19 transmission within residential areas occurring in stages II and III took place primarily in low-income communities with higher population densities and high public housing.
The transmission of COVID-19 in non-residential locations bears no significant correlation with population density, but has a significant positive correlation with building density. COVID-19 transmission locations were significantly and positively correlated with commercial land density in the early stage and not significantly correlated in the latter two stages. This confirmed the transmission of the first and second waves among non-residential COVID-19 hotspots in business center office buildings and other office locations. In addition, non-residential transmission may have also occurred more easily in government facilities, rest and recreation facilities, and areas with higher road network densities. In the case of stages II and III, non-residential transmissions were significantly negatively correlated with income.

4. Discussion

During this study, COVID-19 transmission chains in Hong Kong were reconstructed based on information on confirmed cases, in order to ascertain the spatial distributions of the infection cluster locations of the first four waves of COVID-19 and the related influencing factors. Different from existing research works that focus on the analysis of locations where the COVID-19 cases were found, in this work, the transmission locations relating to the four waves were divided into residential transmission locations and non-residential locations in order to analyze the differences in spatial infection agglomeration and the factors influencing those transmission locations for the different infection stages.
Firstly, from the perspective of time, COVID-19 transmission locations were weakly clustered at the beginning of the pandemic, but clustering increased significantly during stage II, and maintained a high level in the later stages of the pandemic. The reason for this phenomenon is that, in the early stage of the pandemic in Hong Kong, many relatively scattered foreign cases were imported according to government website “chp.gov.hk”, causing local outbreaks and short-distance transmission within households and streets, resulting in more and more concentrated cases. In the middle and late stages of the pandemic, various prevention and control measures slowed the surge of cases, but the transmission of the pandemic had mainly occurred in specific sites, so the aggregations of cases remained at a high level. In addition, in stages II and III of the pandemic, local cases were the main sources of infection spread. Among these, the proportion of cases transmitted within families increased first and then decreased. Benefitting from the continuous social restriction policy applied by the Hong Kong government, the number of COVID-19 cases under first four waves maintained a relatively stable level, which has been verified by previous literature [29], and the predominant modes of transmission at each stage of the pandemic were found to be different according to the result provided by this study.
Secondly, from a spatial perspective, Hong Kong’s COVID-19 transmission locations during stage I of residential hotspots were concentrated in the relatively low-density and affluent areas of Hong Kong Island. In the second stage, the hotspots moved northward, whiles the spreading hotspots of residential locations were greater than those of non-residential locations and took up a larger proportion in the New Territories. The results also showed that the types of transmission sites have increased, and outbreaks have occurred among disadvantaged groups such as nursing homes and welfare institutions for the disabled. The proportion of transmissions in restaurants and shopping malls increased significantly in this stage, and explosive transmission occurred in multiple restaurants. The transmission hotspots of stage III shifted to the south again, especially in non-residential locations, on Hong Kong Island. Shown here were spatial and temporal heterogeneity at different stages of the epidemic, which may be due to the different infected populations in the different phases of the epidemic.
From the factors affecting the transmission of COVID-19, the results of the study indicated that, in stage I of COVID-19, transmission at residential locations occurred in private residential areas with higher income, lower building density, and poorer levels of accessibility. In contrast, the spread of COVID-19 in stage II at residential areas was concentrated in locations with lower income and higher density of public residences, such as social welfare institutions and schools, most of which relate to low-income communities and vulnerable groups. The hotspots and factors influencing the spread in stage III residential locations were very similar to those of stage II.
In much the same way, the distributions of transmission in non-residential locations in all COVID-19 stages were highly associated with building density. That is, transmissions were more likely to occur in places with higher building density. For non-residential transmissions in stage I, the impact of commercial land density showed a stronger influence. These transmission locations were mainly located in commercial centers and other office spaces in relatively affluent areas with higher building density, higher density of commercial/businesses and offices, more public transportation, and better greening. It is speculated that more stringent infection prevention measures implemented in areas with a high density of commercial centers and office buildings at the beginning of the outbreak could have effectively curbed the spread of the pandemic.
In stages II and III of the epidemic, transmissions in non-residential areas were mainly located in places with higher building density and higher levels of traffic access. During stage II, the risk of transmission from commercial buildings and restaurants was much higher owing to intervention fatigue and policy relaxation, accounting for approximately 56% of all transmissions occurring in non-residential locations during this phase. In the early stages of stage III, owing to the premature relaxation of gathering restrictions and the opening of entertainment venues, many outbreak clusters occurred in such places as dance halls and gymnasia. Therefore, the COVID-19 transmission in stage III was mostly located in areas with a high density of government facilities and rest and recreation facilities. Thus, priority of a pandemic prevention policy should be given to the provision of resources and preventive measures with those underlined characteristics. The main fourth wave route of transmission was via singing and dancing groups, as these cases were infected while participating in activities at singing and dancing venues or entertainment venues, and then infected their family members or other contacts.
At this stage, most existing research mainly analyzes the locations resided in or visited by COVID-19 cases, or the relationship between COVID-19 risk and corresponding environment features and government policies. The related works, such as [2,3,4,5,6], all focus on the cluster features of detected cases’ locations or related environmental factors, while [7,8,9,10,11,12,29] explore more influence factors that affect the risk level of clusters such as government intervention, income level, personal habits, community environment, and so on. Furthermore, the works of [30,31,32,33] reveal the community and individual responses to COVID-19, and the responses when receiving COVID-19 vaccines. For large-scaled analysis, the work of [34] recognizes vulnerable areas under COVID-19 infection using a set of determinants and risk factors for predicting the risk level of different cities for decision-making. The work of [35] explores the relationship between social factors and risk level of individuals, including ethnicity, social disadvantage, age, gender, and occupation, and the work of [36] assesses modifying effects of demographic factors on COVID-19 testing status and outcomes in a large, diverse single health system cohort.
Among previous literature works, few studies have been undertaken on the space–time pattern of the locations where the transmissions took place and its associated influencing factors, which is explored as the main contribution of this work. Benefitting from the continuous social restriction policy applied by the Hong Kong government, the number of COVID-19 cases under the first four waves maintained a relatively stable level, thus it is significant to explore the COVID-19 transmission features under social restriction policy, which can be helpful for government decision-making.
The limitations of our study include the following. All of the data from social demographics and environmental factors considered were collected at a fixed time because of the unavailability of data on space–time dynamics. Secondly, as the factors affecting the transmission of the pandemic are very complex, this study only used the existing dataset to construct a system of factors affecting the pandemic, but took no account of some other factors, such as occupation and household characteristics. Other possible relevant indicators were ignored. Although this study did not consider all potentially relevant factors, a useful identification method was provided based on detailed transmission locations in determining the temporal and spatial distribution characteristics and the impact of different factors on the transmission of COVID-19.

5. Conclusions

The results of this study have several policy implications. Firstly, as there are no studies related to the specific location of COVID-19 transmission to date, this study reconstructs the transmission chain of the four COVID-19 outbreaks in Hong Kong by identifying the specific location and timing of COVID-19 transmissions. The study also assists policy makers in implementing more stringent mitigation measures at different times of the epidemic based on trends, such as advising people to work from home or avoid areas that may have a higher risk of transmission in the early stages of the pandemic. Secondly, the spatial and temporal patterns of COVID-19 transmission in different locations under the social restriction policy applied by the Hong Kong government were analyzed by identifying changes in the clustering of transmission locations in Hong Kong and identifying high-risk areas based on the distribution of COVID-19 transmission locations in the past. This study also revealed that the groups infected during different stages of the pandemic may differ, with the spread of COVID-19 more likely to occur in more affluent areas at the beginning of the outbreak compared with other stages. The factors that influence the spread of the epidemic also vary across stages and locations of transmission, and these characteristics may inform future pandemic control.

Author Contributions

Conceptualization, Daping Yang and Yue Yu; methodology, Daping Yang and Yue Yu; software, Daping Yang; formal analysis, Daping Yang; investigation, Daping Yang; resources, Yue Yu; writing—original draft preparation, Daping Yang; writing—review and editing, Yue Yu; project administration, Wenzhong Shi, Ruizhi Chen and Liang Chen; funding acquisition, Wenzhong Shi, Ruizhi Chen and Liang Chen; Daping Yang and Yue Yu contributed equally to this work. All authors have read and agreed to the published version of the manuscript.

Funding

The State Bureau of Surveying and Mapping, China (1-ZVE8), National Key R&D Program of China (2019YFB2103102), Hong Kong Research Grants Council (T22-505/19-N), and The Hong Kong Polytechnic University (1-ZVN6).

Data Availability Statement

Not applicable.

Acknowledgments

This work was supported by the Otto Poon Charitable Foundation Smart Cities Research Institute, Hong Kong Polytechnic University (Work Program: CD03).

Conflicts of Interest

The authors declare that they have no competing interests.

References

  1. World Health Organization. Coronavirus Disease (COVID-19) Situation Report; World Health Organization: Geneva, Switzerland, 2020. [Google Scholar]
  2. Kan, Z.; Kwan, M.-P.; Wong, M.S.; Huang, J.; Liu, D. Identifying the space-time patterns of COVID-19 risk and their associations with different built environment features in Hong Kong. Sci. Total. Environ. 2021, 772, 145379. [Google Scholar] [CrossRef] [PubMed]
  3. Kang, D.; Choi, H.; Kim, J.-H.; Choi, J. Spatial epidemic dynamics of the COVID-19 outbreak in China. Int. J. Infect. Dis. 2020, 94, 96–102. [Google Scholar] [CrossRef] [PubMed]
  4. Lai, K.Y.; Webster, C.; Kumari, S.; Sarkar, C. The nature of cities and the COVID-19 pandemic. Curr. Opin. Environ. Sustain. 2020, 46, 27–31. [Google Scholar] [CrossRef] [PubMed]
  5. Xiong, Y.; Wang, Y.; Chen, F.; Zhu, M. Spatial Statistics and Influencing Factors of the COVID-19 Epidemic at Both Prefecture and County Levels in Hubei Province, China. Int. J. Environ. Res. Public Heal. 2020, 17, 3903. [Google Scholar] [CrossRef] [PubMed]
  6. Desjardins, M.; Hohl, A.; Delmelle, E. Rapid surveillance of COVID-19 in the United States using a prospective space-time scan statistic: Detecting and evaluating emerging clusters. Appl. Geogr. 2020, 118, 102202. [Google Scholar] [CrossRef]
  7. Hutch, D.J.; Bouye, K.E.; Skillen, E.; Lee, C.; Whitehead, L.; Rashid, J.R. Potential Strategies to Eliminate Built Environment Disparities for Disadvantaged and Vulnerable Communities. Am. J. Public Heal. 2011, 101, 587–595. [Google Scholar] [CrossRef]
  8. Kan, Z.; Kwan, M.P.; Huang, J.; Wong, M.S.; Liu, D. Comparing the space-time patterns of high-risk areas in different waves of COVID-19 in Hong Kong. Trans. GIS 2021, 25, 2982–3001. [Google Scholar] [CrossRef]
  9. Kwok, C.Y.T.; Wong, M.S.; Chan, K.L.; Kwan, M.-P.; Nichol, J.E.; Liu, C.H.; Wong, J.Y.H.; Wai, A.K.C.; Chan, L.W.C.; Xu, Y.; et al. Spatial analysis of the impact of urban geometry and socio-demographic characteristics on COVID-19, a study in Hong Kong. Sci. Total Environ. 2021, 764, 144455. [Google Scholar] [CrossRef]
  10. Mollalo, A.; Vahedi, B.; Rivera, K.M. GIS-based spatial modeling of COVID-19 incidence rate in the continental United States. Sci. Total. Environ. 2020, 728, 138884. [Google Scholar] [CrossRef]
  11. Pourghasemi, H.R.; Pouyan, S.; Heidari, B.; Farajzadeh, Z.; Shamsi, S.R.F.; Babaei, S.; Khosravi, R.; Etemadi, M.; Ghanbarian, G.; Farhadi, A.; et al. Spatial modeling, risk mapping, change detection, and outbreak trend analysis of coronavirus (COVID-19) in Iran (days between 19 February and 14 June 2020). Int. J. Infect. Dis. 2020, 98, 90–108. [Google Scholar] [CrossRef]
  12. Lai, S.; Ruktanonchai, N.W.; Zhou, L.; Prosper, O.; Luo, W.; Floyd, J.R.; Wesolowski, A.; Santillana, M.; Zhang, C.; Du, X.; et al. Effect of non-pharmaceutical interventions to contain COVID-19 in China. Nature 2020, 585, 410–413. [Google Scholar] [CrossRef]
  13. Kwan, M.-P. The stationarity bias in research on the environmental determinants of health. Heal. Place 2021, 70, 102609. [Google Scholar] [CrossRef]
  14. Golinelli, D.; Lenzi, J.; Adja, K.Y.C.; Reno, C.; Sanmarchi, F.; Fantini, M.P.; Gibertoni, D. Small-scale spatial analysis shows the specular distribution of excess mortality between the first and second wave of the COVID-19 pandemic in Italy. Public Health 2021, 194, 182–184. [Google Scholar] [CrossRef]
  15. Shim, E.; Tariq, A.; Chowell, G. Spatial variability in reproduction number and doubling time across two waves of the COVID-19 pandemic in South Korea, February to July, 2020. Int. J. Infect. Dis. 2020, 102, 1–9. [Google Scholar] [CrossRef]
  16. Ajelli, M.; Parlamento, S.; Bome, D.; Kebbi, A.; Atzori, A.; Frasson, C.; Putoto, G.; Carraro, D.; Merler, S. The 2014 Ebola virus disease outbreak in Pujehun, Sierra Leone: Epidemiology and impact of interventions. BMC Med. 2015, 13, 281. [Google Scholar] [CrossRef] [Green Version]
  17. Faye, O.; Boëlle, P.-Y.; Heleze, E.; Faye, O.; Loucoubar, C.; Magassouba, N.; Soropogui, B.; Keita, S.; Gakou, T.; Bah, E.H.I.; et al. Chains of transmission and control of Ebola virus disease in Conakry, Guinea, in 2014: An observational study. Lancet Infect. Dis. 2015, 15, 320–326. [Google Scholar] [CrossRef] [Green Version]
  18. Stoddard, S.T.; Forshey, B.M.; Morrison, A.C.; Paz-Soldan, V.A.; Vazquez-Prokopec, G.M.; Astete, H.; Reiner, R.C.; Vilcarromero, S.; Elder, J.P.; Halsey, E.S.; et al. House-to-house human movement drives dengue virus transmission. Proc. Natl. Acad. Sci. USA 2013, 110, 994–999. [Google Scholar] [CrossRef] [Green Version]
  19. Guzzetta, G.; Marques-Toledo, C.A.; Rosà, R.; Teixeira, M.; Merler, S. Quantifying the spatial spread of dengue in a non-endemic Brazilian metropolis via transmission chain reconstruction. Nat. Commun. 2018, 9, 2837. [Google Scholar] [CrossRef] [Green Version]
  20. Jombart, T.; Cori, A.; Didelot, X.; Cauchemez, S.; Fraser, C.; Ferguson, N. Bayesian Reconstruction of Disease Outbreaks by Combining Epidemiologic and Genomic Data. PLoS Comput. Biol. 2014, 10, e1003457. [Google Scholar] [CrossRef]
  21. Mollentze, N.; Nel, L.H.; Townsend, S.; le Roux, K.; Hampson, K.; Haydon, D.T.; Soubeyrand, S. A Bayesian approach for inferring the dynamics of partially observed endemic infectious diseases from space-time-genetic data. Proc. R. Soc. B Biol. Sci. 2014, 281, 20133251. [Google Scholar] [CrossRef] [Green Version]
  22. Morelli, M.J.; Thébaud, G.; Chadœuf, J.; King, D.P.; Haydon, D.T.; Soubeyrand, S. A Bayesian inference framework to reconstruct transmission trees using epidemiological and genetic data. PLoS Comput. Biol. 2012, 8, e1002768. [Google Scholar] [CrossRef] [PubMed] [Green Version]
  23. Adam, D.C.; Wu, P.; Wong, J.Y.; Lau, E.H.; Tsang, T.K.; Cauchemez, S.; Leung, G.M.; Cowling, B.J. Clustering and superspreading potential of SARS-CoV-2 infections in Hong Kong. Nat. Med. 2020, 26, 1714–1719. [Google Scholar] [CrossRef] [PubMed]
  24. Tariq, A.; Lee, Y.; Roosa, K.; Blumberg, S.; Yan, P.; Ma, S.; Chowell, G. Real-time monitoring the transmission potential of COVID-19 in Singapore, March 2020. BMC Med. 2020, 18, 1–14. [Google Scholar] [CrossRef] [PubMed]
  25. Yu, Z.; Zhu, X.; Liu, X.; Wei, T.; Yuan, H.-Y.; Xu, Y.; Zhu, R.; He, H.; Wang, H.; Wong, M.; et al. Reopening International Borders without Quarantine: Contact Tracing Integrated Policy against COVID-19. Int. J. Environ. Res. Public Health 2021, 18, 7494. [Google Scholar] [CrossRef] [PubMed]
  26. Yu, Y.; Chen, R.; Chen, L.; Li, W.; Wu, Y.; Zhou, H. H-WPS: Hybrid wireless positioning system using an enhanced wi-fi FTM/RSSI/MEMS sensors integration approach. IEEE Internet Things J. 2021, 9, 11827–11842. [Google Scholar] [CrossRef]
  27. Ahmed, N.; Michelin, R.A.; Xue, W.; Ruj, S.; Malaney, R.; Kanhere, S.S.; Seneviratne, A.; Hu, W.; Janicke, H.; Jha, S.K. A Survey of COVID-19 Contact Tracing Apps. IEEE Access 2020, 8, 134577–134601. [Google Scholar] [CrossRef]
  28. Seong, H.; Hyun, H.J.; Yun, J.G.; Noh, J.Y.; Cheong, H.J.; Kim, W.J.; Song, J.Y. Comparison of the second and third waves of the COVID-19 pandemic in South Korea: Importance of early public health intervention. Int. J. Infect. Dis. 2021, 104, 742–745. [Google Scholar] [CrossRef]
  29. Yang, L.; Dai, J.; Zhao, J.; Wang, Y.; Deng, P.; Wang, J. Estimation of incubation period and serial interval of COVID-19: Analysis of 178 cases and 131 transmission chains in Hubei province, China. Epidemiol. Infect. 2020, 148, e117. [Google Scholar] [CrossRef]
  30. Lokuge, K.; Banks, E.; Davis, S.; Roberts, L.; Street, T.; O’Donovan, D.; Caleo, G.; Glass, K. Exit strategies: Optimizing feasible surveillance for detection, elimination, and ongoing prevention of COVID-19 community transmission. BMC Med. 2021, 19, 1–14. [Google Scholar] [CrossRef]
  31. Malheiro, R.; Figueiredo, A.L.; Magalhães, J.P.; Teixeira, P.; Moita, I.; Moutinho, M.C.; Mansilha, R.B.; Gonçalves, L.M.; Ferreira, E. Effectiveness of contact tracing and quarantine on reducing COVID-19 transmission: A retrospective cohort study. Public Health 2020, 189, 54–59. [Google Scholar] [CrossRef]
  32. Wang, J. Spatial Analysis; Science Press: Beijing, China, 2006; pp. 55–56. [Google Scholar]
  33. Getis, A.; Ord, J.K. The analysis of spatial association by use of distance statistics. In Perspectives on Spatial Data Analysis; Springer: Berlin/Heidelberg, Germany, 2010; pp. 127–145. [Google Scholar]
  34. Wright, R.E. Logistic regression. In Reading and Understanding Multivariate Statistics; American Psychological Association: Washington, DC, USA, 1995; pp. 217–244. [Google Scholar]
  35. Castro, R.R.; Santos, R.S.C.; Sousa, G.J.B.; Pinheiro, Y.T.; Martins, R.R.I.M.; Pereira, M.L.D.; Silva, R.A.R. Spatial dynamics of the COVID-19 pandemic in Brazil. Epidemiol. Infect. 2021, 149, e60. [Google Scholar] [CrossRef]
  36. Liu, Y.; Shi, W.; Zhang, A.; Zhu, X. The effectiveness of the restricted policy on specific venues in Hong Kong: A spatial point pattern view. Geospat. Health 2022, 17, 1130. [Google Scholar] [CrossRef]
Figure 1. (a) TPU scale map of hong kong in the study area. (b) Data acquisition and analysis process. (c) Weekly case statistics among different waves.
Ijgi 12 00111 g001aIjgi 12 00111 g001b
Figure 2. Flowchart of COVID-19 transmission chain reconstruction.
Ijgi 12 00111 g002
Figure 3. Visualization of the transmission chain of different stages. (a) Transmission chain in Stage I; (b) Transmission chain in Stage Ⅱ; (c) Transmission chain in Stage Ⅲ.
Ijgi 12 00111 g003
Figure 4. Spatial hotspot detection of COVID-19 incidence based on Getis-Ord Gi* statistics: (a) the hotspots in stage I of residential locations; (b) the hotspots in stage II of residential locations; (c) the hotspots in stage III of residential locations; (d) the hotspots in stage I of non-residential locations; (e) the hotspots in stage II of non-residential locations; (f) the hotspots in stage III of non-residential locations.
Ijgi 12 00111 g004
Figure 5. Space–time cluster distribution in stage I at residential locations (In which number 1, 2, 4, 5 indicate the most significant clusters).
Ijgi 12 00111 g005
Figure 6. Space–time cluster distribution in Stage II at residential locations (In which number 1, 4, 12, 14, 16 indicate the most significant clusters).
Ijgi 12 00111 g006
Figure 7. Space–time cluster distribution in stage III at residential locations (In which number 1, 9, 20 indicate the most significant clusters).
Ijgi 12 00111 g007
Figure 8. Space–time cluster distribution in stage I at non-residential locations (In which number 1, 3, 5 indicate the most significant clusters).
Ijgi 12 00111 g008
Figure 9. Space–time cluster distribution in stage II at non-residential locations (In which number 3, 4, 6, 9, 12 indicate the most significant clusters).
Ijgi 12 00111 g009
Figure 10. Space–time cluster distribution in stage III at non-residential locations (In which number 2, 3, 7 indicate the most significant clusters).
Ijgi 12 00111 g010
Figure 11. Space–time clusters’ evolution of different stages and locations.
Ijgi 12 00111 g011
Figure 12. Features’ distribution of clustered TPUs and non-clustered TPUs of COVID-19 transmission in residential locations at different stages of the pandemic in Hong Kong.
Ijgi 12 00111 g012
Figure 13. Features’ distribution of clustered TPUs and non-clustered TPUs of COVID-19 transmission in non-residential locations at different stages of the pandemic in Hong Kong.
Ijgi 12 00111 g013
Table 1. The NNR index of the transmission locations of COVID-19 in different waves (RI stands for residential location transmission in stage I, RII stands for residential location transmission in stage II, RIII stands for residential location transmission in stage III, NRI stands for non-residential location transmission in stage I, NRII stands for non-residential location transmission in stage II, and NRIII stands for non-residential location transmission in stage III).
Name of VariableR IR IIR IIINR INR IINR III
Average distance observed869.7490 m149.6688 m131.2052 m201.6234 m116.0415 m57.3838 m
Expected average distance1783.0137 m743.0114 m606.4645 m1335.8216 m983.4025 m659.4559 m
Nearest neighbor ratio value0.48780.20140.21630.15090.11800.0870
z score−9.1397−34.1948−41.1117−20.2226−28.5353−44.0476
p-value0.00000.00000.00000.00000.00000.0000
Table 2. The Moran’s I index of the transmission locations of COVID-19 in different waves.
Name of VariableR IR IIR IIINR INR IINR III
Moran’s I0.06290.18820.11450.06160.07320.0984
Variance0.00090.00090.00090.00070.00080.0009
z score2.20036.32363.88692.45842.68203.4497
p-value0.02780.00000.00010.01400.00730.0006
Table 3. Space–time clusters in stage I of COVID-19 transmission in residential locations in Hong Kong.
ClusterDuration (Days)p-ValueObservedExpectedRelative Risk
120/5/2020–29/5/20200.00080.04234.02
229/2/2020–31/3/20200.000120.3638.35
317/3/2020–2/4/20200.00060.1445.53
417/3/2020–22/3/20200.00040.04117.17
514/2/2020–27/3/20200.02030.01210.91
Table 4. Space–time clusters in stage II of COVID-19 transmission in residential locations in Hong Kong.
ClusterDuration (Days)p-ValueObservedExpectedRelative Risk
114/7/2020–24/7/20200.000260.4069.36
228/6/2020–23/7/20200.000301.1128.56
36/7/2020–11/8/20200.000281.4720.11
419/8/2020–23/8/20200.000150.14107.53
52/10/2020–3/10/20200.000120.11106.89
62/7/2020–4/7/20200.000100.1196.07
73/7/2020–16/7/20200.000140.9814.69
815/7/2020–18/7/20200.00070.1067.79
912/7/2020–19/7/20200.000100.5119.87
105/8/2020–10/8/20200.00080.3523.02
1115/7/2020–19/7/20200.01070.3221.93
123/8/2020–4/8/20200.01040.04100.94
1313/7/2020–16/7/20200.02050.1241.47
1426/10/2020–27/10/20200.02030.01258.38
1513/7/2020–16/7/20200.05050.1632.12
1612/7/2020–13/7/20200.05030.02173.11
Table 5. Space–time clusters in stage III of COVID-19 transmission in residential locations in Hong Kong.
ClusterDuration (Days)p-ValueObservedExpectedRelative Risk
125/11/2020–26/11/20200.000370.08463.37
29/12/2020–15/1/20210.000330.9038.13
327/11/2020–10/12/20200.000180.4640.35
45/12/2020–4/1/20210.000211.2017.97
517/11/2020–15/12/20200.000201.6912.13
610/11/2020–11/12/20200.000140.6521.82
717/11/2020–7/12/20200.000120.4129.83
816/11/2020–24/11/20200.000130.5524.12
922/12/2020–26/12/20200.00060.02265.24
104/1/2021–11/1/20210.000110.4524.90
1123/11/2020–22/12/20200.000120.8913.69
1221/11/2020–21/1/20210.000234.375.39
1321/11/2020–17/1/20210.00090.4321.00
1416/11/2020–11/12/20200.000151.848.30
1531/3/2021–8/4/20210.00050.0685.39
162/12/2020–3/12/20200.00060.1443.19
1726/11/2020–13/12/20200.000111.0011.19
189/12/2020–21/12/20200.000100.8012.59
1930/11/2020–9/12/20200.01040.03125.37
2021/11/2020–22/11/20200.02040.0589.03
Table 6. Space–time clusters in stage I of COVID-19 transmission in non-residential locations in Hong Kong.
ClusterDuration (Days)p-ValueObservedExpectedRelative Risk
14/3/2020–2/4/20200.000520.28277.09
26/3/2020–31/3/20200.000410.11498.54
325/1/2020–26/1/20200.000100.003385.75
425/1/2020–8/2/20200.000120.03431.81
514/3/2020–16/3/20200.00070.02381.70
613/3/2020–23/3/20200.00080.1087.12
712/3/2020–28/3/20200.00060.05125.82
810/3/2020–14/3/20200.00040.01348.10
Table 7. Space–time clusters in stage II of COVID-19 transmission in non-residential locations in Hong Kong.
ClusterDuration (Days)p-ValueObservedExpectedRelative Risk
126/6/2020–12/7/20200.000670.26341.98
28/7/2020–29/7/20200.000470.17332.06
35/7/2020–21/7/20200.000190.08256.67
416/7/2020–21/7/20200.000130.02687.55
58/7/2020–1/8/20200.000140.1978.40
66/7/2020–23/7/20200.00090.1562.14
78/7/2020–15/7/20200.00080.1650.80
83/7/2020–9/7/20200.00070.1163.88
98/8/2020–28/8/20200.00080.2533.46
107/7/2020–4/8/20200.00060.1252.19
1113/7/2020–20/7/20200.01030.01261.40
1224/8/2020–2/9/20200.02050.1437.61
1326/7/2020–23/8/20200.03050.1435.56
Table 8. Space–time clusters in stage III of COVID-19 transmission in non-residential locations in Hong Kong.
ClusterDuration (Days)p-ValueObservedExpectedRelative Risk
12/3/2021–11/3/20210.000920.091176.67
213/11/2020–25/11/20200.000630.051495.68
37/11/2020–24/11/20200.000450.041217.18
413/11/2020–25/11/20200.000480.17307.81
528/11/2020–7/1/20210.000470.29174.89
68/11/2020–5/12/20200.000550.8075.19
722/11/2020–1/12/20200.000310.04740.22
815/2/2021–25/2/20210.000290.04792.04
914/11/2020–11/12/20200.000350.8443.91
1017/11/2020–23/11/20200.000150.08183.11
119/11/2020–6/12/20200.000240.7632.83
1213/11/2020–1/12/20200.000170.3944.68
1325/1–/2020–28/11/20200.00090.04239.95
1421/1/2021–25/1/20210.00090.1279.28
1528/12/2020–8/1/20210.00070.1070.01
Table 9. Features’ distribution at different stages of residential location (“p-value” is performed as asymptotic two-tailed significance of the Mann–Whitney test).
Parameters/FeaturesMedian Monthly Income from Main Employment, Excluding FDHsPopulation DensityBuilding DensityRoads and Transport FacilitiesGovernment, Institutional, and Com-munity FacilitiesPrivate ResidentialPublic ResidentialOpen Space and RecreationCommercial/Business and OfficeWoodlandGrassland
CI (Mean)25,107.220,285.90.1470.0930.0530.0970.0300.0430.0040.2050.066
NI (Mean)19,853.432,712.20.2280.1640.0630.0970.0520.0620.0310.1590.068
CII (Mean)16,603.745,017.40.2690.1880.0580.1060.1010.0820.0420.1080.047
NII (Mean)21,024.929,274.20.2110.1510.0630.0960.0420.0570.0260.1730.070
CIII (Mean)22,11936,801.20.2770.2050.0790.1290.0630.0890.0360.1360.034
NIII (Mean)20,075.729,947.40.2040.1440.0580.0890.0470.0530.0260.1710.075
CI (SD)14,462.434,539.80.1390.0980.0710.1220.0660.0640.0070.1800.086
NI (SD)9356.136,874.40.1870.1330.0750.1180.0940.0720.0670.1630.092
CII (SD)6465.845,301.10.2070.1380.0590.1360.1490.0750.0850.1210.074
NII (SD)10,50835,047.20.1790.1300.0770.1150.0770.0710.0600.1690.093
CIII (SD)11,836.833,619.50.1670.1240.0710.1190.0980.0900.0740.1640.049
NIII (SD)9747.837,424.40.1850.1310.0750.1160.0890.0640.0610.1650.097
CI (Median)20,0002635.20.0860.0590.0370.0330.00020.01680.00110.13630.0304
NI (Median)16,00020,770.70.1940.1410.0440.0510.00130.03580.00440.10030.0231
CII (Median)15,00028,544.60.2010.1580.0480.0280.03320.09230.00850.07470.0054
NII (Median)17,50015,702.80.1660.1120.0430.0510.0010.03010.0040.12050.0273
CIII (Median)17,00031,921.40.2570.1810.0550.1140.00160.07720.00770.08010.0138
NIII (Median)16,00014,565.40.1490.1060.0370.0390.00110.02840.00340.12050.0272
CI- NI (p-values)0.0390.0420.040.0270.0750.0040.0290.0820.0180.1390.423
CII- NII (p-values)0.0030.0620.1570.1370.0280.5230.0690.2420.7960.0670.066
CIII- NIII (p-values)0.0680.0190.0030.0020.0110.0070.3940.0040.1240.1210.028
Table 10. Features’ distribution at different stages of non-residential location (“p-value” is performed as asymptotic two-tailed significance of the Mann–Whitney test).
Parameters/FeaturesMedian Monthly Income from Main Employment, Excluding FDHsPopulation DensityBuilding DensityRoads and Transport FacilitiesGovernment, Institutional, and Com-munity FacilitiesPrivate ResidentialPublic ResidentialOpen Space and RecreationCommercial/Business and OfficeWoodlandGrassland
CI (Mean)19,786.541,211.40.4460.2870.0750.1330.0300.1090.1310.0650.029
NI (Mean)17,434.230,234.70.1950.1420.0610.0930.0520.0550.0170.1750.071
CII (Mean)17,98058,160.80.3840.2710.0680.1230.0870.0820.0770.0870.025
NII (Mean)20,85727,043.70.1920.1380.0610.0930.0440.0560.0200.1760.074
CIII (Mean)20,383.256,329.60.3580.2370.0750.1570.0790.0930.0650.1270.023
NIII (Mean)20,487.125,319.30.1850.1370.0590.0830.0430.0520.0190.1730.078
CI (SD)9517.535,719.60.2050.1230.0620.1230.0750.0990.1200.1380.079
NI (SD)10,271.636,791.10.1650.1250.0760.1170.0930.0660.0430.1640.092
CII (SD)9050.548,953.40.2110.1390.0600.1430.1340.0650.1160.1390.042
NII (SD)10,31732,662.10.1650.1210.0770.1130.0820.0720.0470.1660.095
CIII (SD)11,181.241,098.50.2000.1360.0510.1370.1290.0910.1040.1670.042
NIII (SD)9966.533,081.50.1630.1230.0790.1080.0780.0640.0460.1640.097
CI (Median)17,75036,552.60.4770.3290.0530.11700.0910.1040.00230.002
NI (Median)16,00016,848.30.1540.1090.0420.0490.0020.0290.0030.1280.027
CII (Median)15,00043,262.60.4120.2780.0540.0540.0060.0650.0120.0070.0003
NII (Median)17,00013,538.40.1520.1060.0420.0490.0010.0270.0030.1210.027
CIII (Median)15,00046,473.60.2980.2360.0590.1280.0080.0650.0180.0150.004
NIII (Median)17,00010,162.20.1350.1060.0370.0390.0010.0270.0030.1190.032
CI- NI (p-values)0.0420.0580.0010.010.0180.1490.0460.0030.0010.010.001
CII- NII (p-values)0.0130.0010.0010.010.1820.310.0050.0050.010.0010.001
CIII- NIII (p-values)0.0260.0010.010.010.0020.0010.1620.0010.010.0110.001
Table 11. Significant influencing factors’ OR values from the logistic regression analysis.
Influencing FactorsR IR IIR IIINR INR IINR III
Median income——0.0630.686——0.6770.652
Population density——1.6181.745——————
Building density——————8.0842.1936.927
Private residential1.514————————0.601
Public residential1.5101.7651.468——1.978——
Commercial/business and office——————5.630————
Government, institutional, and community facilities——————1.864——1.463
Open space and recreation——————2.319——1.358
Roads and transport facilities————1.344——1.5172.449
Woodland density————1.4562.6021.3662.064
Grassland density——————5.327——2.584
Land use diversity——1.6871.4782.050——1.391
Disclaimer/Publisher’s Note: The statements, opinions and data contained in all publications are solely those of the individual author(s) and contributor(s) and not of MDPI and/or the editor(s). MDPI and/or the editor(s) disclaim responsibility for any injury to people or property resulting from any ideas, methods, instructions or products referred to in the content.

