Article

Crowd Density Estimation and Mapping Method Based on Surveillance Video and GIS

School of Geographic Sciences, Xinyang Normal University, Xinyang 464000, China
*
Author to whom correspondence should be addressed.
ISPRS Int. J. Geo-Inf. 2023, 12(2), 56; https://doi.org/10.3390/ijgi12020056
Submission received: 2 December 2022 / Revised: 30 January 2023 / Accepted: 6 February 2023 / Published: 8 February 2023

Abstract

:
Aiming at the problem that the existing crowd counting methods cannot achieve accurate crowd counting and map visualization in a large scene, a crowd density estimation and mapping method based on surveillance video and GIS (CDEM-M) is proposed. Firstly, a crowd semantic segmentation model (CSSM) and a crowd denoising model (CDM) suitable for high-altitude scenarios are constructed by transfer learning. Then, based on the homography matrix between the video and remote sensing image, the crowd areas in the video are projected to the map space. Finally, according to the distance from the crowd target to the camera, the camera inclination, and the area of the crowd polygon in the geographic space, a BP neural network for the crowd density estimation is constructed. The results show the following: (1) The test accuracy of the CSSM was 96.70%, and the classification accuracy of the CDM was 86.29%, which can achieve a high-precision crowd extraction in large scenes. (2) The BP neural network for the crowd density estimation was constructed, with an average error of 1.2 and a mean square error of 4.5. Compared to the density map method, the MAE and RMSE of the CDEM-M are reduced by 89.9 and 85.1, respectively, which is more suitable for a high-altitude camera. (3) The crowd polygons were filled with the corresponding number of points, and the symbol was a human icon. The crowd mapping and visual expression were realized. The CDEM-M can be used for crowd supervision in stations, shopping malls, and sports venues.

1. Introduction

With the acceleration of urbanization, fights and stampedes caused by crowd gathering have occurred from time to time in large shopping malls, stations, entertainment places, etc., which bring great difficulties to urban security and management. At present, intelligent video surveillance technology is one of the most commonly used technical means in crowd supervision [1,2]. Surveillance video can record real-time and long-term active images of targets in the scene. Based on artificial intelligence technology, it can automatically obtain object behavior characteristics, such as the object type and trajectory [3], crowd flow [4], and vehicle category [5], which greatly reduces security costs and improves security efficiency [6].
Research on crowd counting and density estimation mainly includes three categories: frame difference regression [7,8], texture regression [9,10,11,12], and deep learning [13,14]. Among them, the crowd density estimation method based on deep learning is the current main trend. These related methods have the strong feature extraction ability, which avoids the shortage of artificially designed features in traditional machine learning, and its accuracy has been greatly improved [15,16]. However, among the current crowd density estimation methods, the head label is mainly used, which emphasizes the features of the human head in the crowd and weakens other features of the crowd. In a high-altitude scene, people who are far away from the camera have fewer head features, or even cannot see their head information at all, which makes the model unable to count accurately. At the same time, in the observation mode of the existing pane view, each camera is independent and difficult to cooperate. It is difficult to obtain the position, moving the direction and distribution mode of the crowd in the geographical space, which leads security personnel to spend a lot of time on a comprehensive analysis [17].
Under this background, this paper proposes the CDEM-M based on deep learning and GIS technology. Compared with the pane view in video surveillance, GIS provides a unified map visualization interface, and all objects can be managed in one view, namely the map view. In terms of crowd feature extraction, the CDEM-M can extract accurate crowd areas through semantic segmentation. Compared with the deep learning method that only marks the head, it makes full use of the overall features of the crowd and is very suitable for monitoring scenes with fuzzy head features. The CDEM-M includes four aspects, namely crowd information extraction, geographic mapping, number estimation, and map visualization.
The structure of this paper is as follows: Section 2 provides an overview of the literature. Section 3 describes the processing flow and related technical details of the CDEM-M. In Section 4, the crowd density estimation method and map visualization effect are discussed and analyzed according to the experimental results. Section 5 summarizes the main conclusions and discusses the planned future work.

2. Related Work

The security work of crowds in complex scenes has always been of concern. Aiming at the low precision of crowd counting in dense scenes and the difficulty of map visualization, this paper combines a video surveillance system with a geographic information system and proposes a new method, namely the CDEM-M. In this section, we introduce the related works from three aspects: crowd density estimation, semantic segmentation, and the integration of video and GIS.

2.1. Crowd Density Estimation

The mainstream method of crowd counting is to use the knowledge of computer vision to count the crowd number in each frame. On the whole, the crowd counting methods based on computer vision are divided into two categories: the traditional methods and the deep learning methods. The traditional methods mainly include the crowd counting method based on detection, regression, and a density map. The detection methods mainly use sliding windows to segment an image and then use specific detectors to extract features to achieve crowd counting [18,19,20]. The regression methods mainly extract multiple features of the foreground area from the image, then select an appropriate regression model for training, and finally predict the overall crowd number in the test dataset [21,22]. The density map method is to first generate the crowd density map and then count the pixel values [23,24]. The traditional methods for feature design and extraction mostly depend on manual work and are only applicable to simple scenes. The counting effect is not ideal in partial occlusion, foreground perspective multi-scale scenes. In recent years, due to the strong advantages of a CNN and an FCN in extracting and learning image features, some methods based on deep learning have achieved good results. For example, the spatial fully convolutional network (SFCN+) takes ResNet101 as the backbone, adding a spatial encoder and a regression layer, which can encode the global context information and directly regression the density map [25]. According to different network structures, the crowd counting model based on deep learning can be divided into a multi-column network and a single-column network [26]. A multi-column network refers to multi-scale information with different columns corresponding to different receptive fields. Common models are CrowdNet [27], MCNN [28], and CP-CNN [29]. Although the research of the multi-column network has made great progress, its large number of parameters and the overfitting of training often lead to poor real-time counting. To this end, researchers have proposed the single-column network. Common models include SANet [30], CSRNet [31], and SaCNN [32]. Compared with the multi-column network, the single-column network does not pay attention to more details, and it is easy to ignore the influence of background noise. In the case of a dense crowd, the counting effect of this method is still not ideal. The existing crowd density estimation methods are severely restricted by the perspective, background, and other factors. Especially in high-density scenes, the head features of people at a distance are weak, which makes it difficult to identify people with a density estimation method based on the head label. Therefore, in order to improve the accuracy of crowd detection, we choose to label the overall information of the crowd in the image. According to the perspective characteristics of “near large and far small”, the position and orientation between the crowd and camera are obtained, which can improve the crowd counting accuracy and generalization performance.

2.2. Semantic Segmentation

As a typical computer vision problem, semantic segmentation takes an image as the input data and assigns a category label to each pixel [33,34]. Traditional semantic segmentation methods mainly interpret the target category information through the texture, edge, spectrum, and geometry [35]. Since the FCN [36] for image semantic segmentation was proposed, semantic segmentation technology based on deep learning has gradually emerged. In recent years, a series of semantic segmentation models evolved from the FCN, such as U-Net [37], PSPNet [38], SegNet [39], and DeepLab series networks, and have achieved good classification results. The DeepLab series network can effectively solve the problem of spatial resolution decreasing about downsampling and are commonly used pixel-by-pixel classification models. At present, the DeepLab series network includes four models: DeepLabv1 [40], DeepLabv2 [41], DeepLabv3 [42], and DeepLabv3+ [43]. Among them, the DeepLabv3+ model uses the improved version of the Xception model as the basic network. It takes the DeepLabv3 model as the encoder and then introduces the Decoder module. Through the cascade processing of the output features, more position information in the low-level features is finally obtained, which has the advantages of high segmentation precision, a fast running speed, etc. Therefore, based on the DeepLabv3+ model, this paper constructs a crowd semantic segmentation model suitable for high-altitude and high-density scenes.

2.3. Integration of Video and GIS
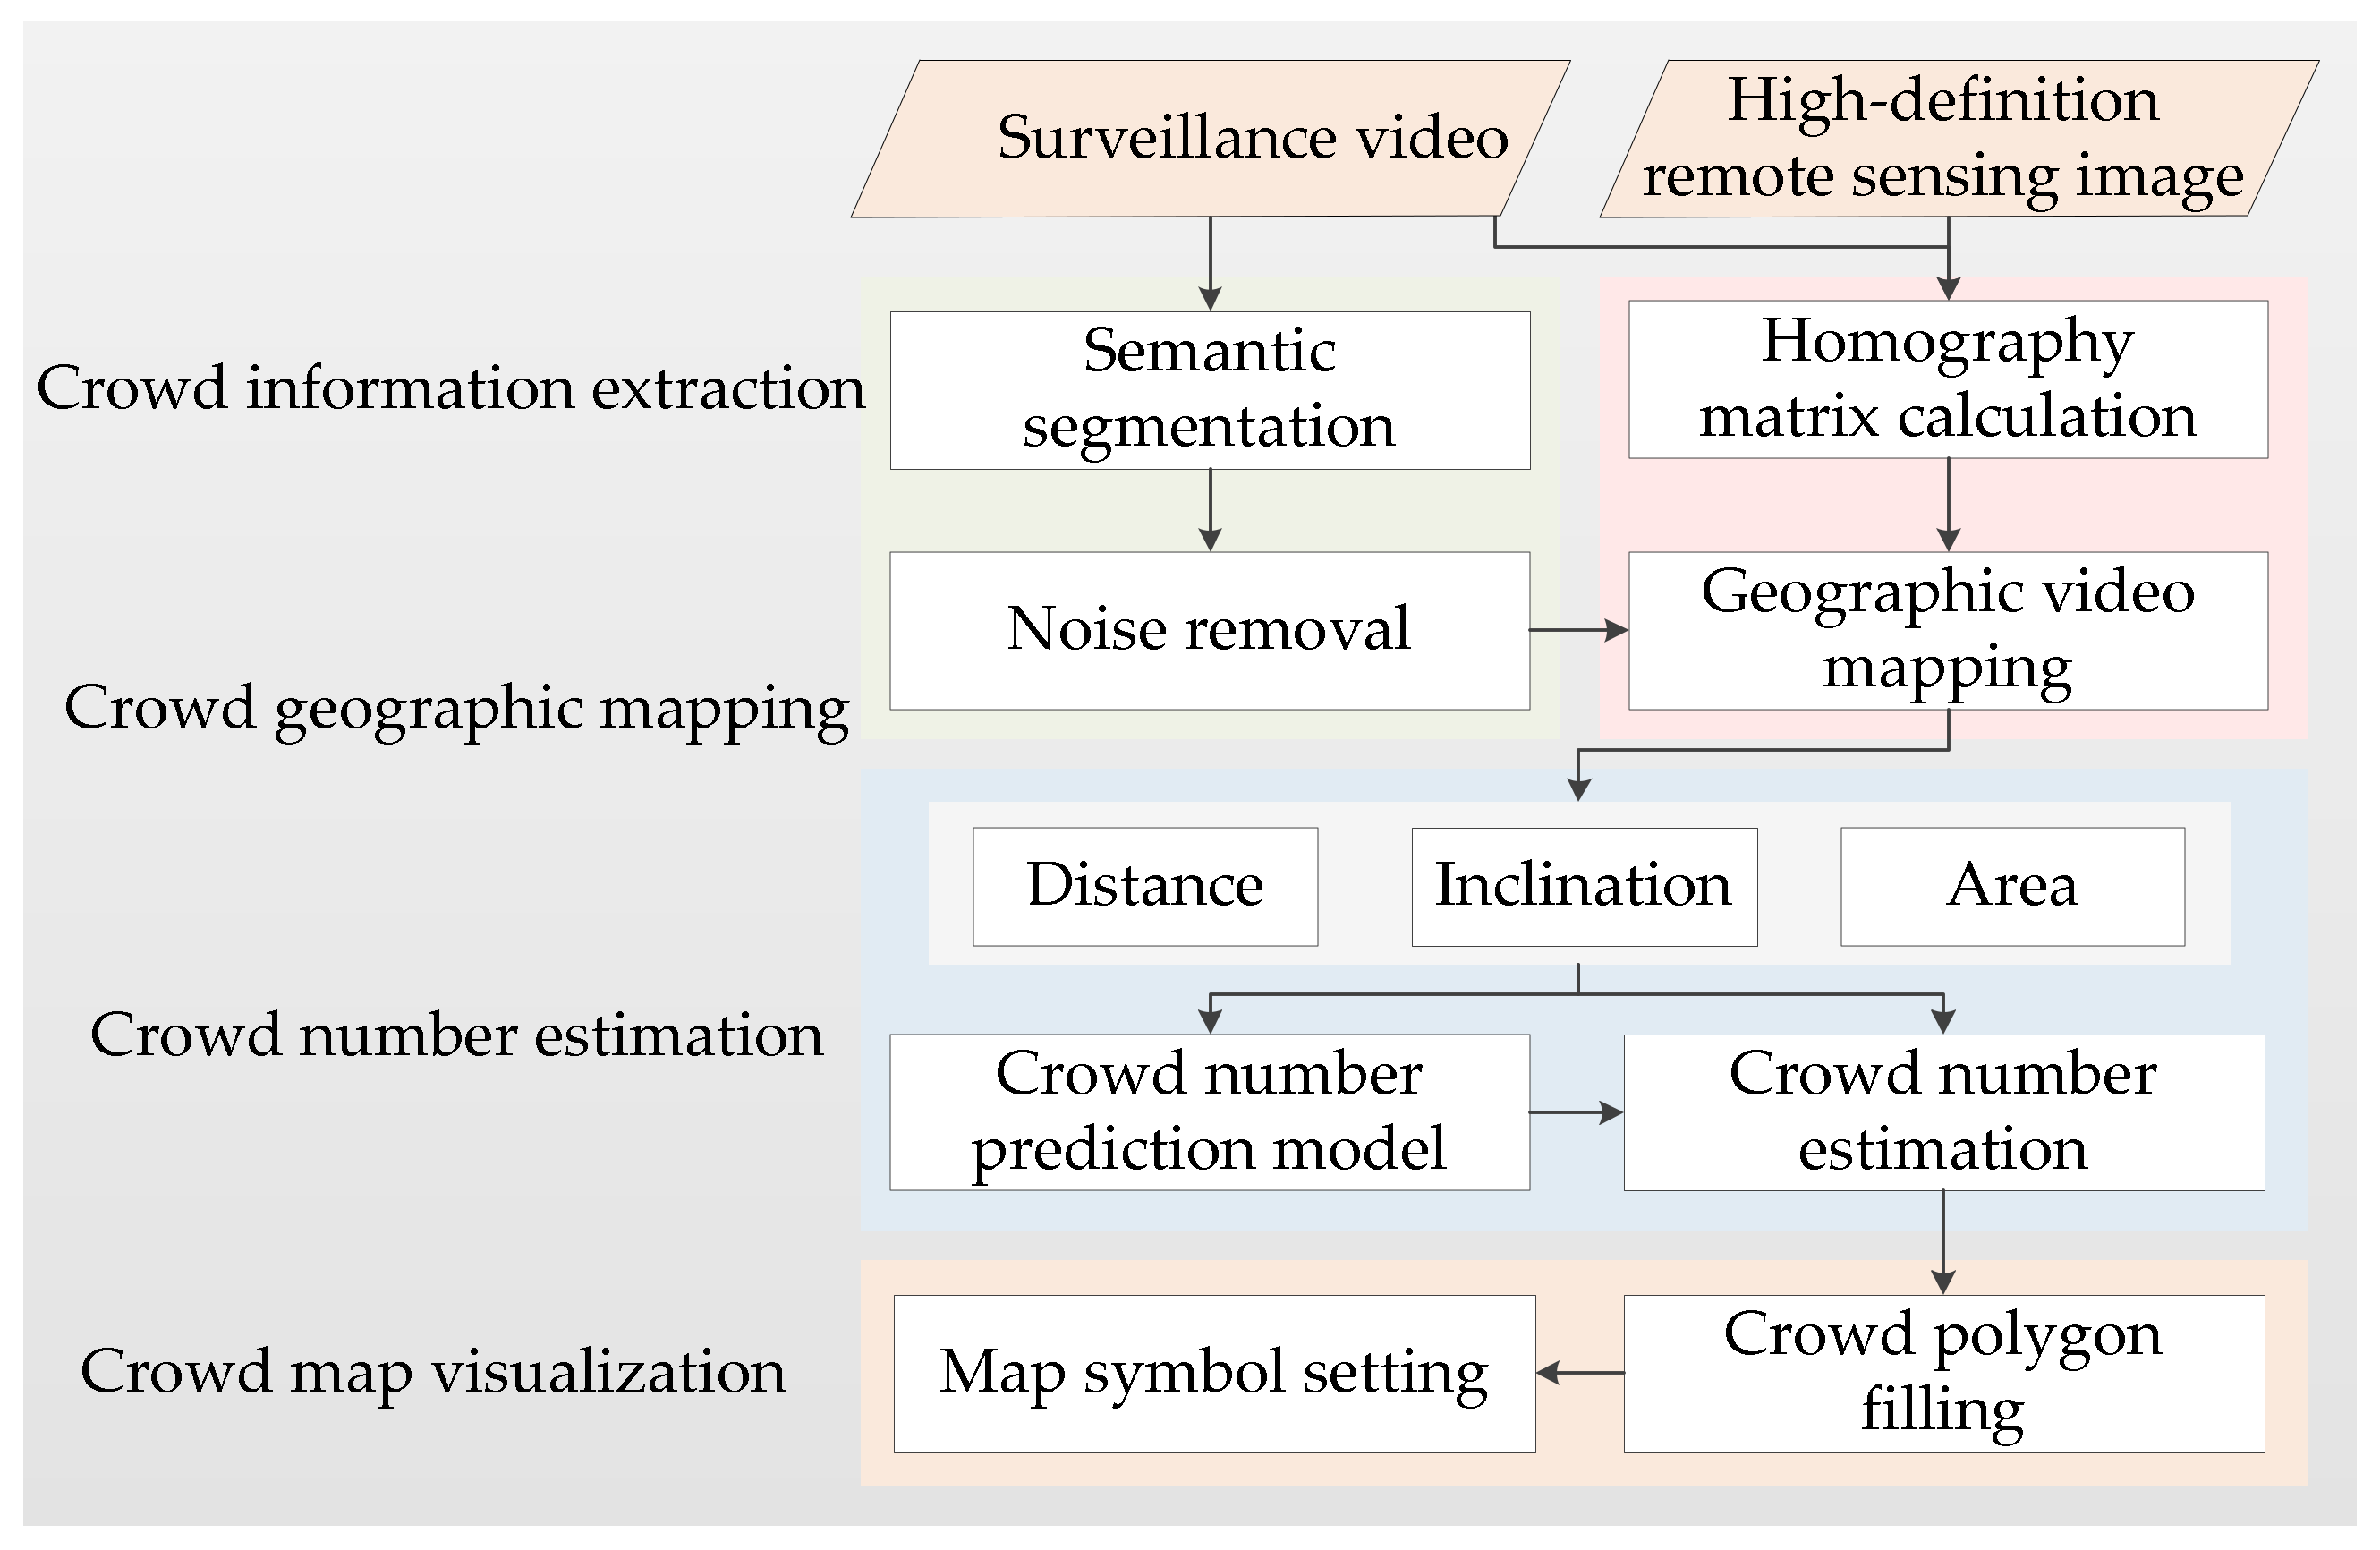
In the video surveillance network, cameras are scattered, independent, and difficult to cooperate. It is unable to provide the distribution, orientation, and size information of crowd targets from a unified view, which makes the spatio-temporal analysis of emergencies more difficult [44,45,46]. GIS has a clear spatial reference, which mainly presents spatio-temporal information in the form of two-dimensional or three-dimensional maps, and can achieve the unified positioning, view, and comprehensive analysis of the objects. The integration of video and GIS, namely VideoGIS, can enhance and expand the original semantic information of video data. It will contribute to the real-time supervision, comprehensive research, and judgment of a crowd in large scenes and improve the efficiency of security work [47]. At present, VideoGIS mainly involves two fields: computer vision (CV) and GIS. In the field of CV, artificial intelligence technology represented by deep learning has developed rapidly. The accuracy of algorithms, such as object detection [48,49], object tracking [50,51], and semantic segmentation [52,53], has been greatly improved, and some achievements have been applied in security. In the field of GIS, a lot of research focuses on the mutual mapping between video and 2D/3D maps [54], the retrieval and playback of video through maps [55], the ReID of the objects in overlapping areas under the maps view [56], the video visualization enhancement [57], and the integration model of GIS and moving objects [58]. VideoGIS has great potential in navigation systems, public security, and other fields [59,60,61,62]. The crowd analysis and prediction based on VideoGIS can obtain the position and direction information from the map view, which cannot only reduce the influence of perspective imaging on crowd counting but also realize the map visualization.

3. Methodology

Based on real-time video frames and high-definition remote sensing image, this paper discusses the crowd counting and mapping methods from the view of GIS. The CDEM-M is mainly aimed at large crowd scene monitored by fixed cameras, including four major aspects of crowd information extraction, geographic mapping, number estimation, and map visualization, as shown in Figure 1. Crowd information extraction is based on the constructed crowd semantic segmentation model to extract the correct crowd semantic information from camera video. Crowd geographic mapping is the process of mapping the crowd semantic information in video frames to geographic space. Crowd number estimation first trains the crowd number prediction model according to the distance from the crowd target to the camera (distance), the camera inclination (inclination), and the area of crowd polygon after space mapping (area), and then estimates the crowd number in each frame. Crowd map visualization is to evenly fill the crowd polygon with the corresponding number of points. The symbol can be human icon.

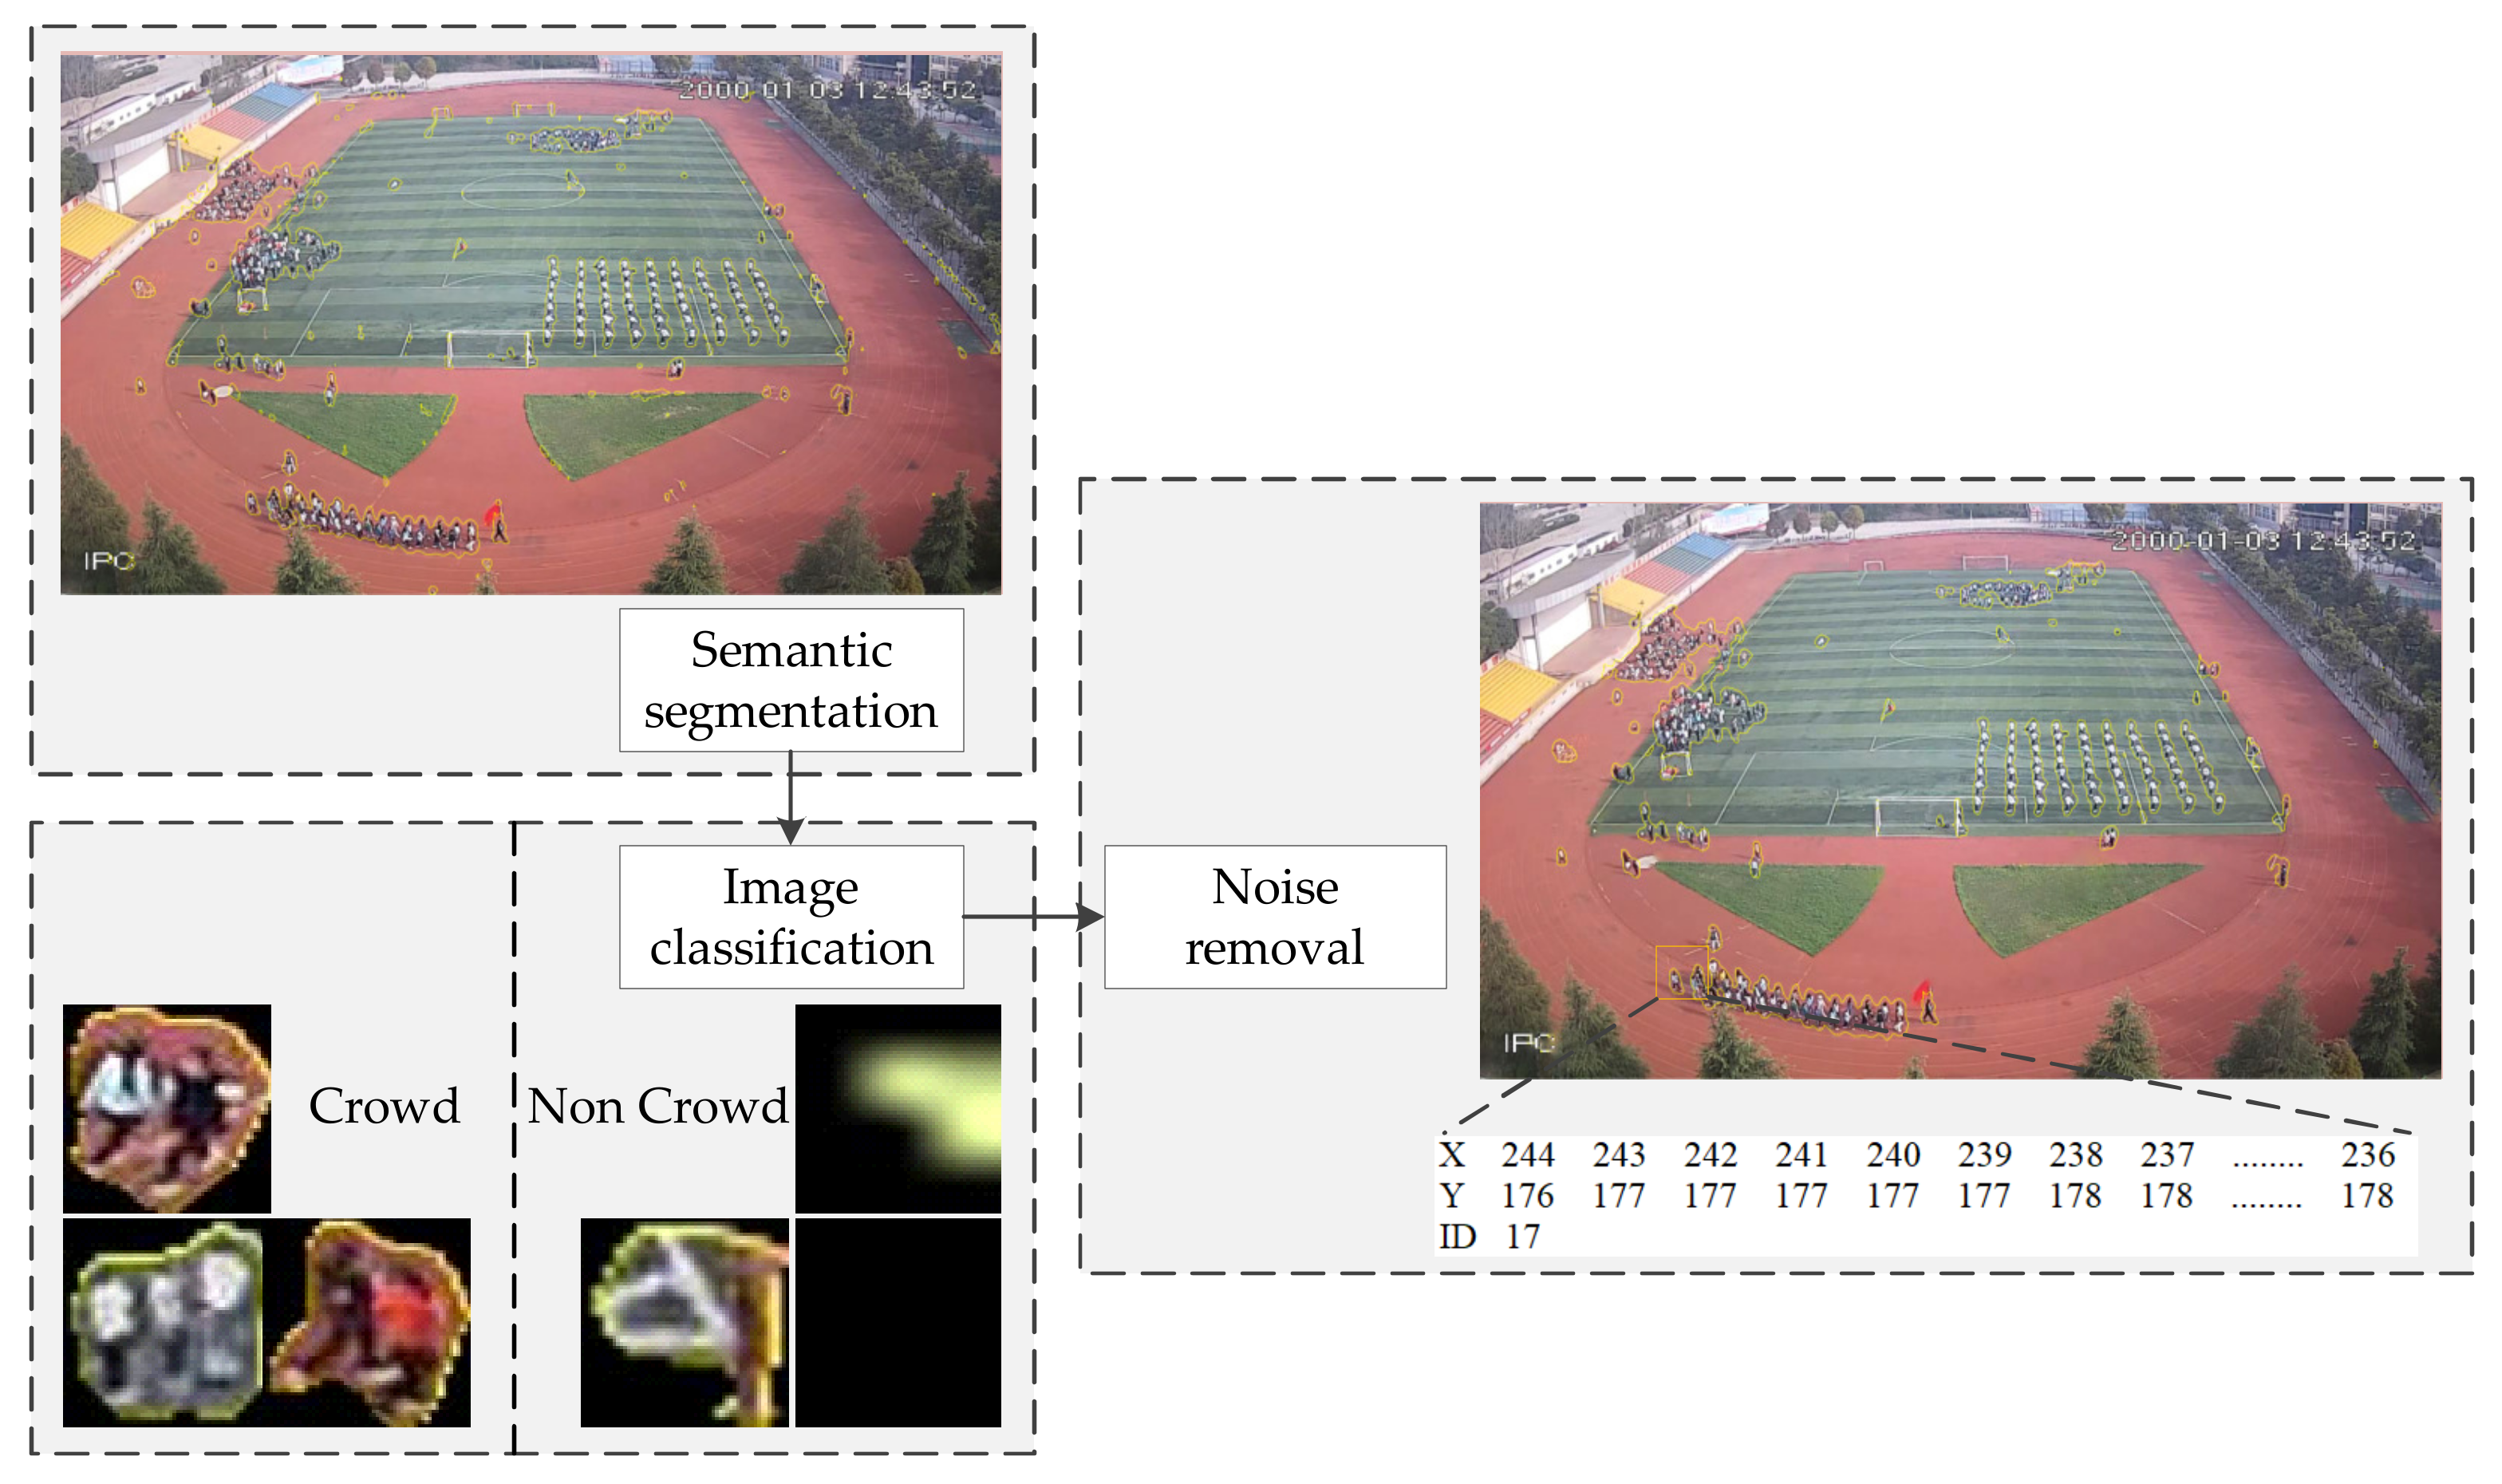
3.1. Crowd Information Extraction

Crowd information extraction can achieve high-precision extraction of crowd semantic information and mainly includes two parts: semantic segmentation and noise removal.

3.1.1. Semantic Segmentation

Deeplabv3+ model has the advantages of high segmentation accuracy and fast running speed, which can achieve end-to-end segmentation [63]. Based on Deeplabv3+ network model, this paper constructs a crowd semantic segmentation model suitable for large scenes. The specific process is as follows: Firstly, the crowd video frames are collected to make the semantic segmentation dataset; then, according to the semantic information of video frames, the object categories are determined, and the image semantic information is labeled; finally, both the original image and the annotated image are simultaneously input to the computer for image features, learning to construct a crowd semantic segmentation model (CSSM).

3.1.2. Noise Removal

The misclassification of semantic segmentation categories is a matter of great interest to scholars today, which often leads to low precision of object counting. In addition, it is not conducive to the analysis of target motion state and abnormal behavior in the scene. Therefore, in order to obtain more accurate crowd semantic information, this paper adopts image classification to remove the wrong polygon information in semantic segmentation image.
Image classification is to assign a category label to an image from a given classification set [64]. Based on convolution neural network, this paper constructs a crowd denoising model (CDM) suitable for large scenes through twice convolution, activation, and pooling operations. The CDM can remove the boundary information of misclassification in the process of semantic segmentation and achieve high-precision extraction of crowd information.

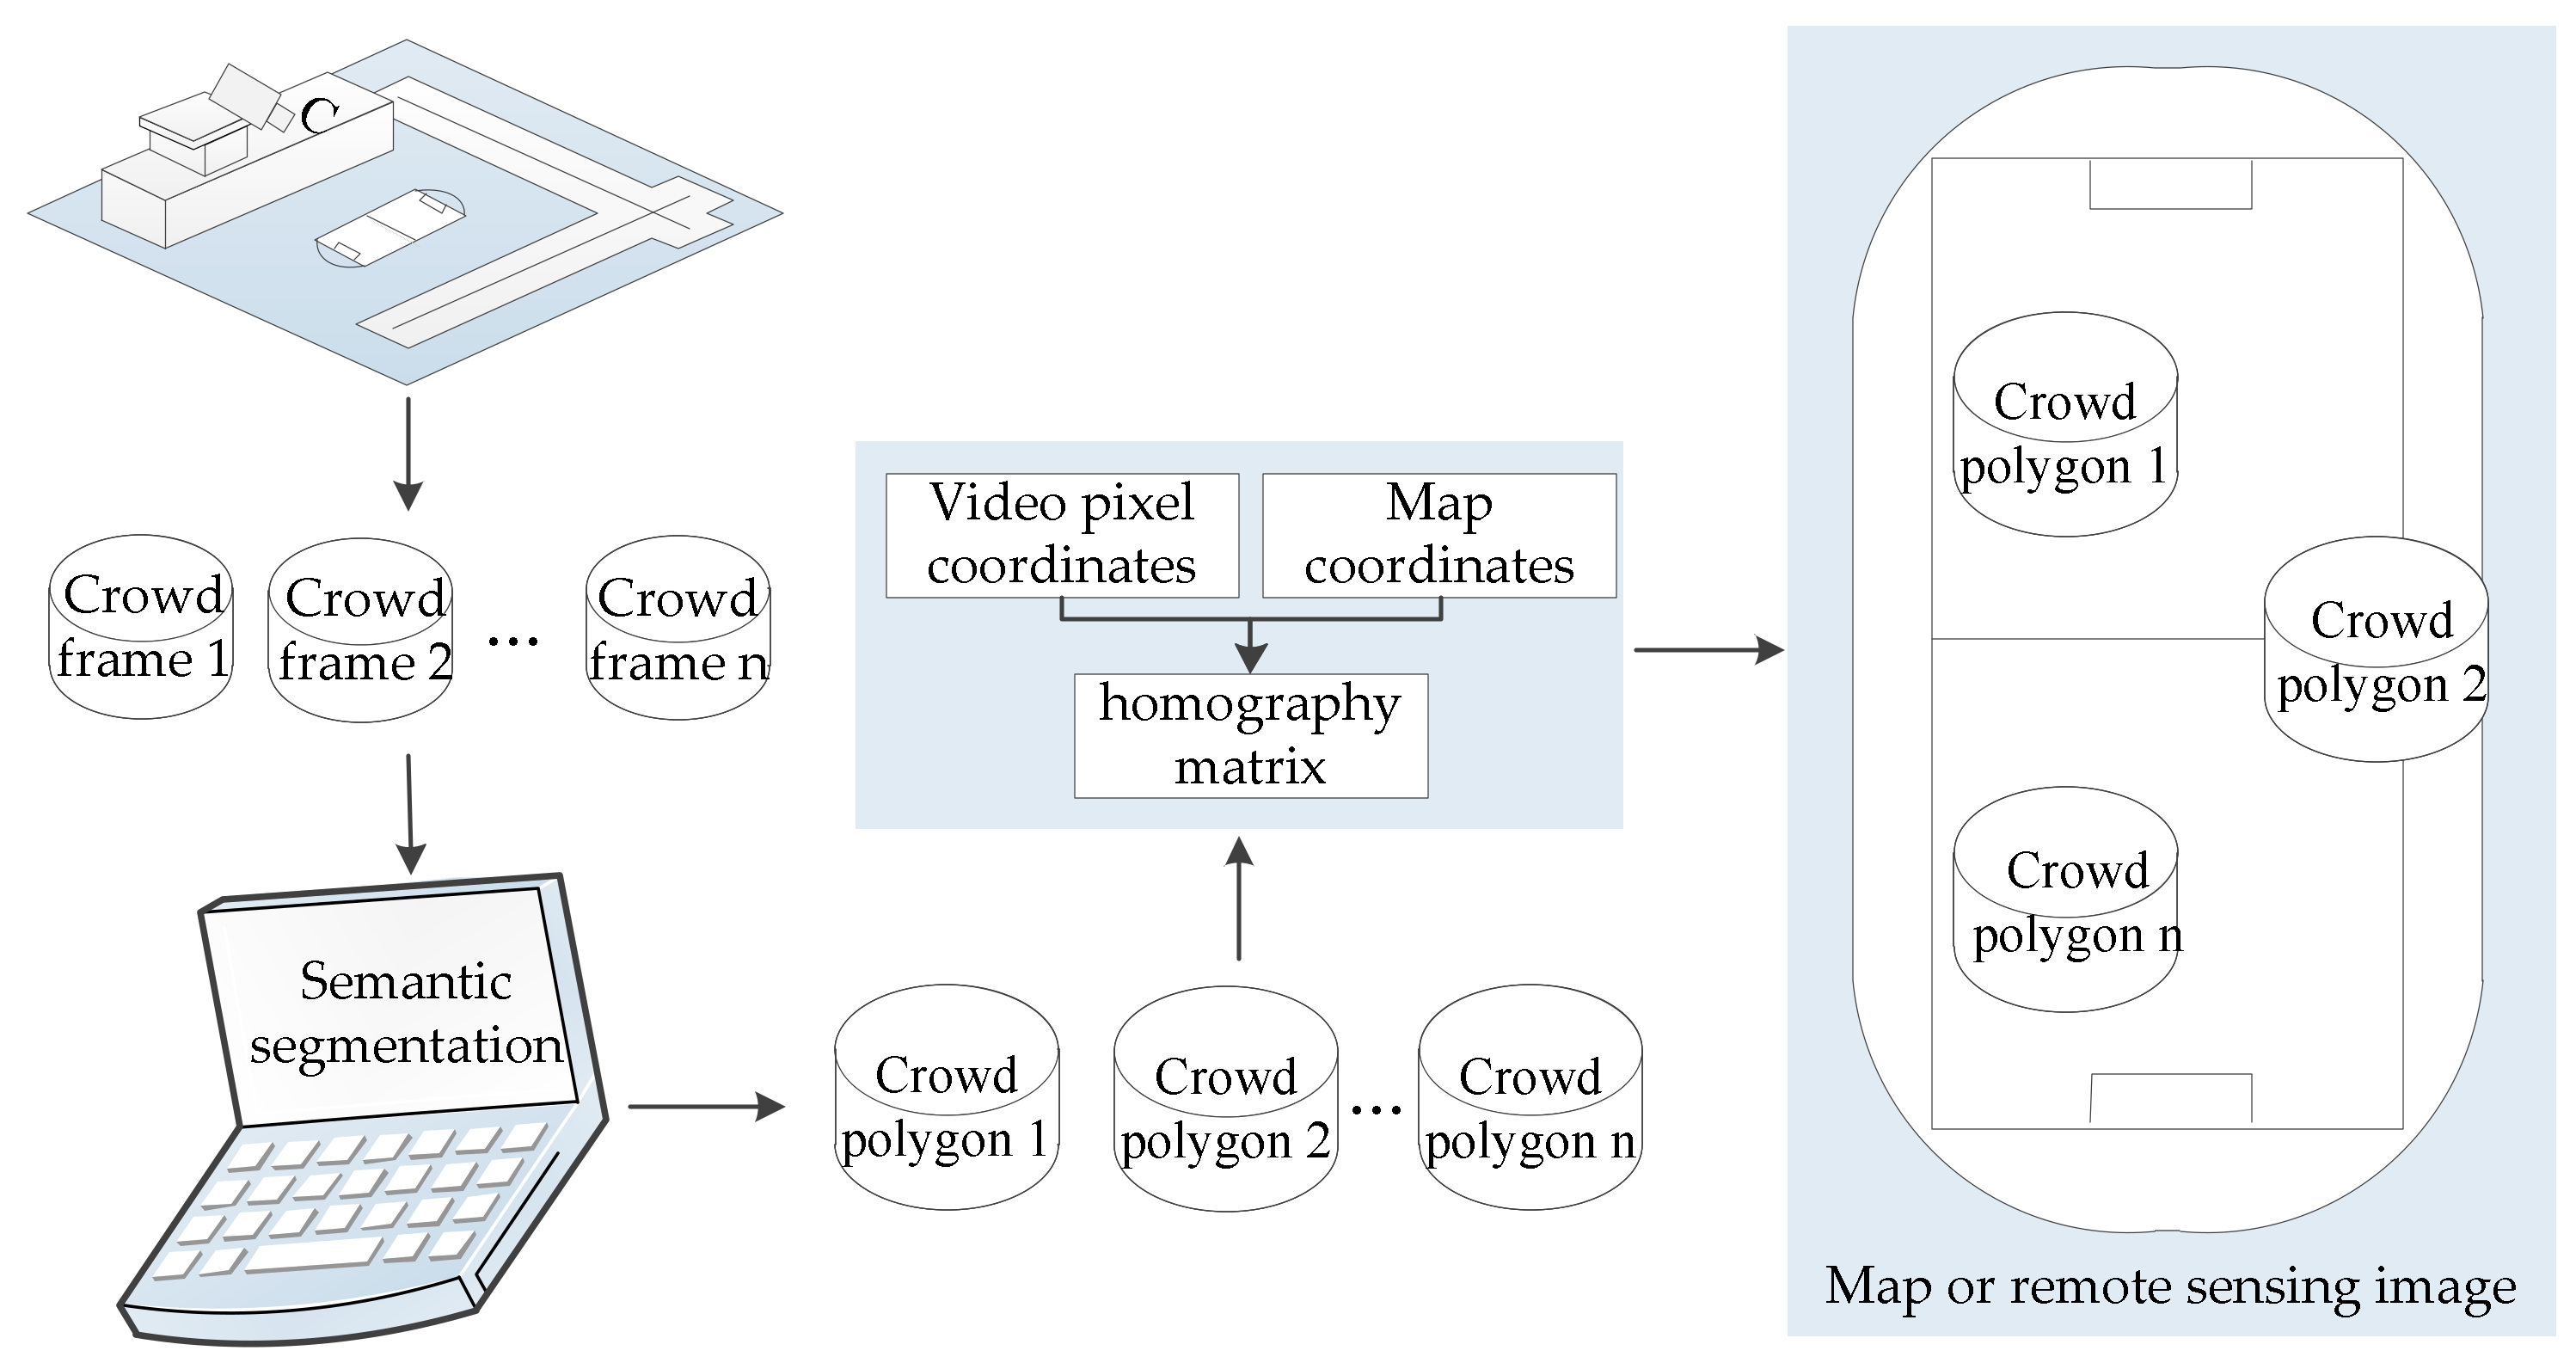
3.2. Crowd Geographic Mapping

Crowd geographic mapping mainly includes two aspects: homography matrix calculation and geographic video mapping.

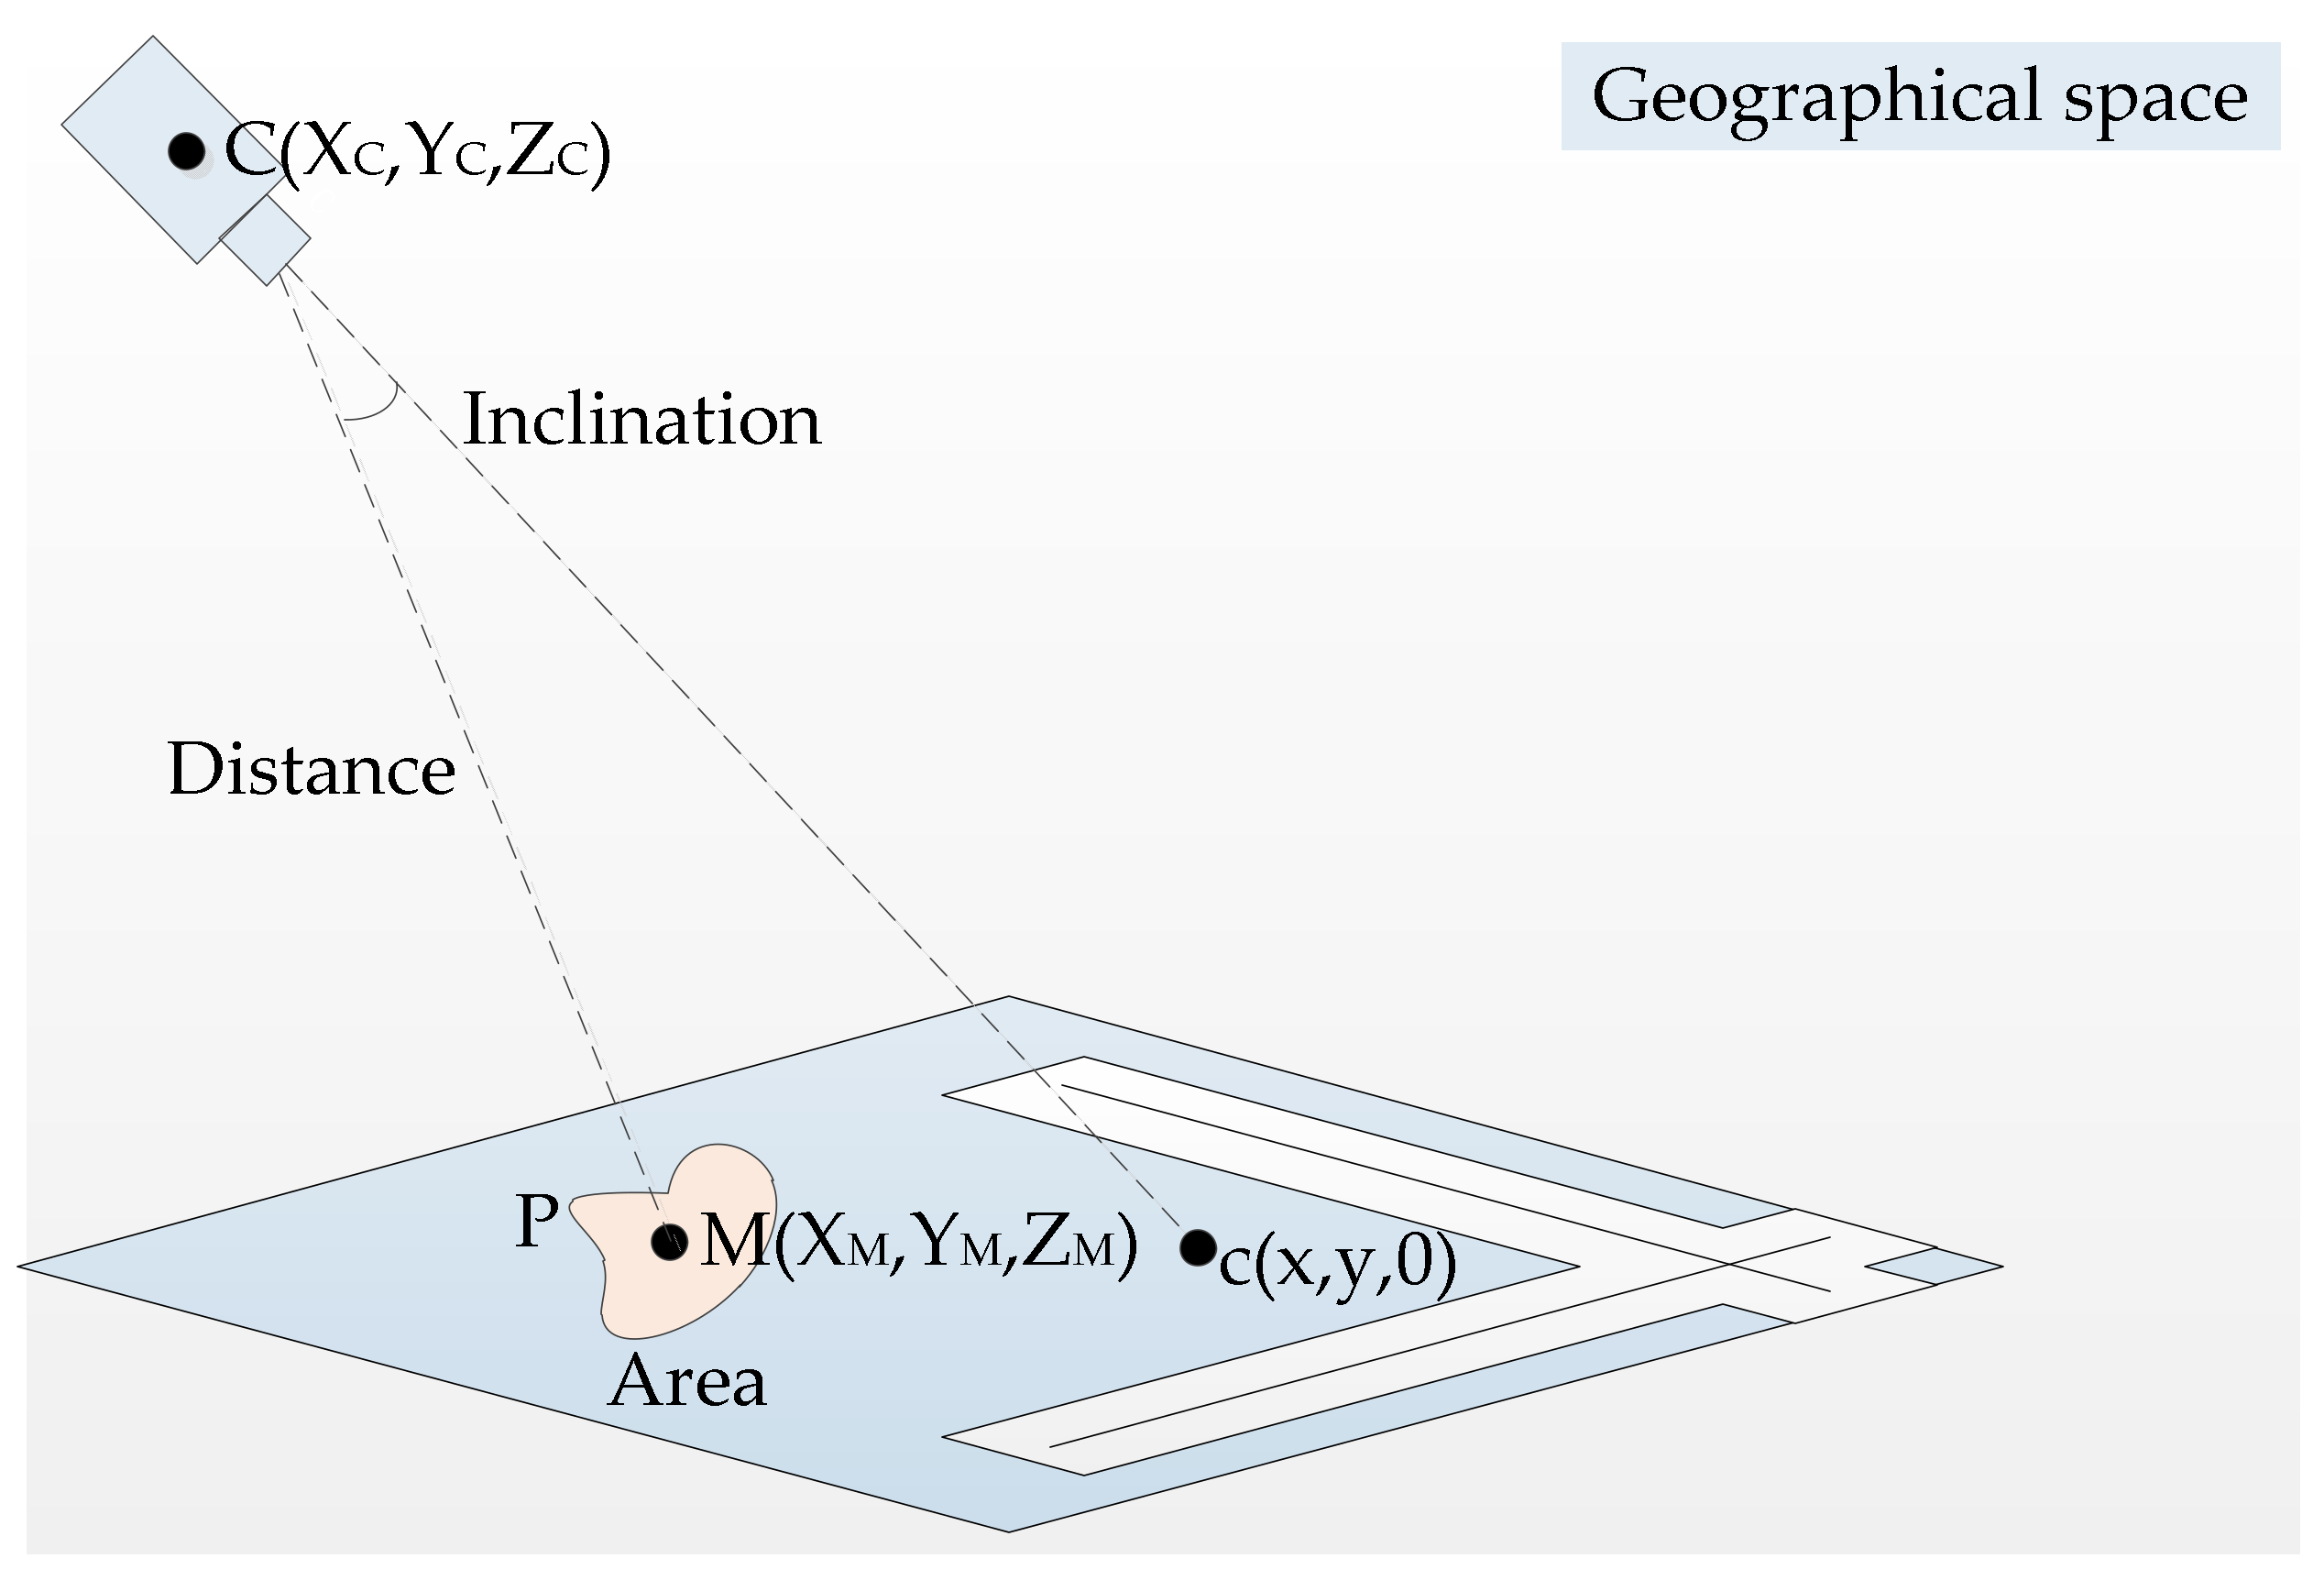
3.2.1. Homography Matrix Calculation

The mutual conversion between video image space and geographic space can be achieved through homography matrix [65]. This method requires that the area in the image and the corresponding area in the map or remote sensing image are flat, which is suitable for the mutual mapping between fixed cameras and 2D geospatial data, and can meet the requirements of the mutual mapping between video and geospatial data in a large range [66]. Therefore, the homography method is adopted in this paper. Four or more corresponding points between the video and corresponding remote sensing image or map are selected, respectively, and then the homography matrix of the camera is calculated. If the pixel coordinate of the video frame is set as P n ( X n , Y n ) , whose corresponding geographic coordinate is P n ( X n , Y n ) , the solution of homography matrix is shown in Equation (1).
[ X n Y n 1 ] = [ H 11 H 12 H 13 H 21 H 22 H 23 H 31 H 32 H 33 ]   [ X n Y n 1 ]
where Hij is a 3 × 3 matrix. By using Hij, the pixel coordinate can be converted into the corresponding geographic coordinate, and the opposite coordinate transformation can be realized through H i j 1 (Hij inverse matrix). If multiple cameras are deployed in a large scene, the corresponding homography matrix of each camera needs to be calculated separately.

3.2.2. Geographic Video Mapping

When the video sensor is imaging, the imaging accuracy of near and far objects is different, and the size of the object displayed in the video shows the rule of “near large, far small”. At the same time, the mutual occlusion between crowds in the video will also lead to low crowd counting accuracy. Therefore, in order to solve the above problems, this paper maps the geographic space of the crowd to obtain the polygon semantic information of each crowd.
Crowd space mapping refers to mapping the semantic information of crowd polygons in video image space to geographic space. Firstly, the real-time video frames of the crowd scene are extracted; then, the video frames are semantically segmented to extract the correct crowd semantic information, and the polygon pixel coordinates of each crowd in the video frames are obtained at the same time; according to the coordinates of surveillance videos and high-definition remote sensing image, the homography matrix of each camera is solved; finally, the pixel coordinates of video frames are converted into corresponding geographic coordinates and displayed in the GIS polygon layer based on the solved homography matrix. This method can realize the geographic space mapping of crowds in video. Figure 2 shows the technological process of crowd space mapping.

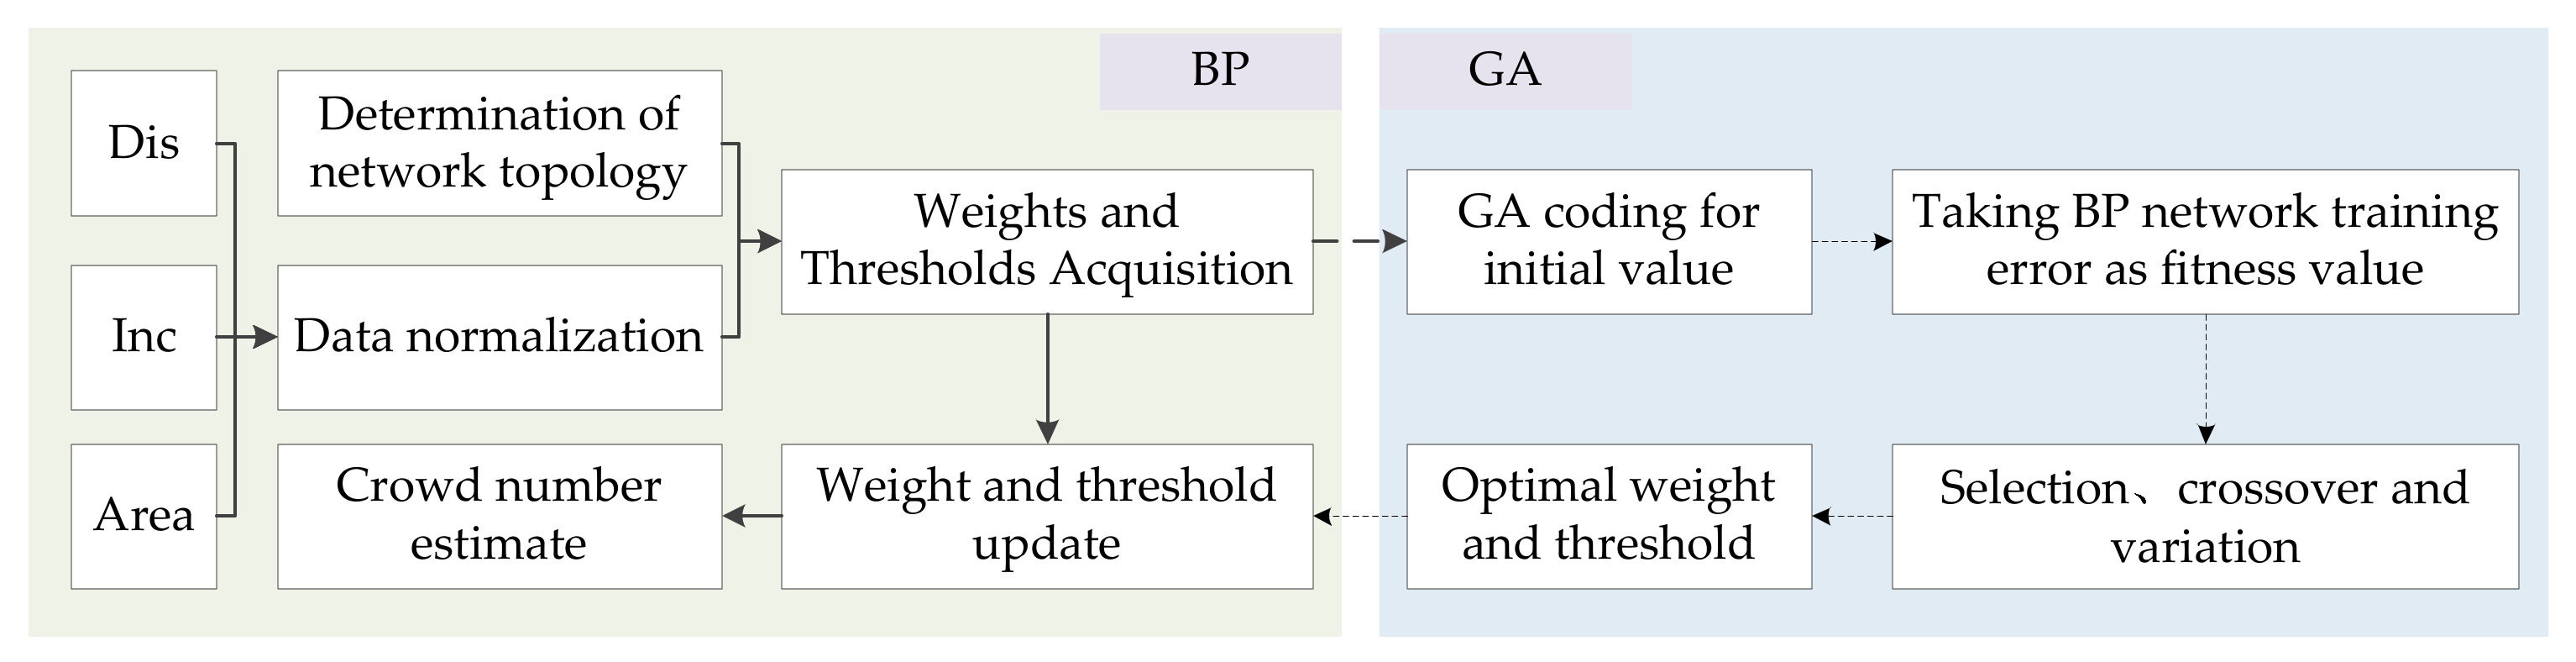
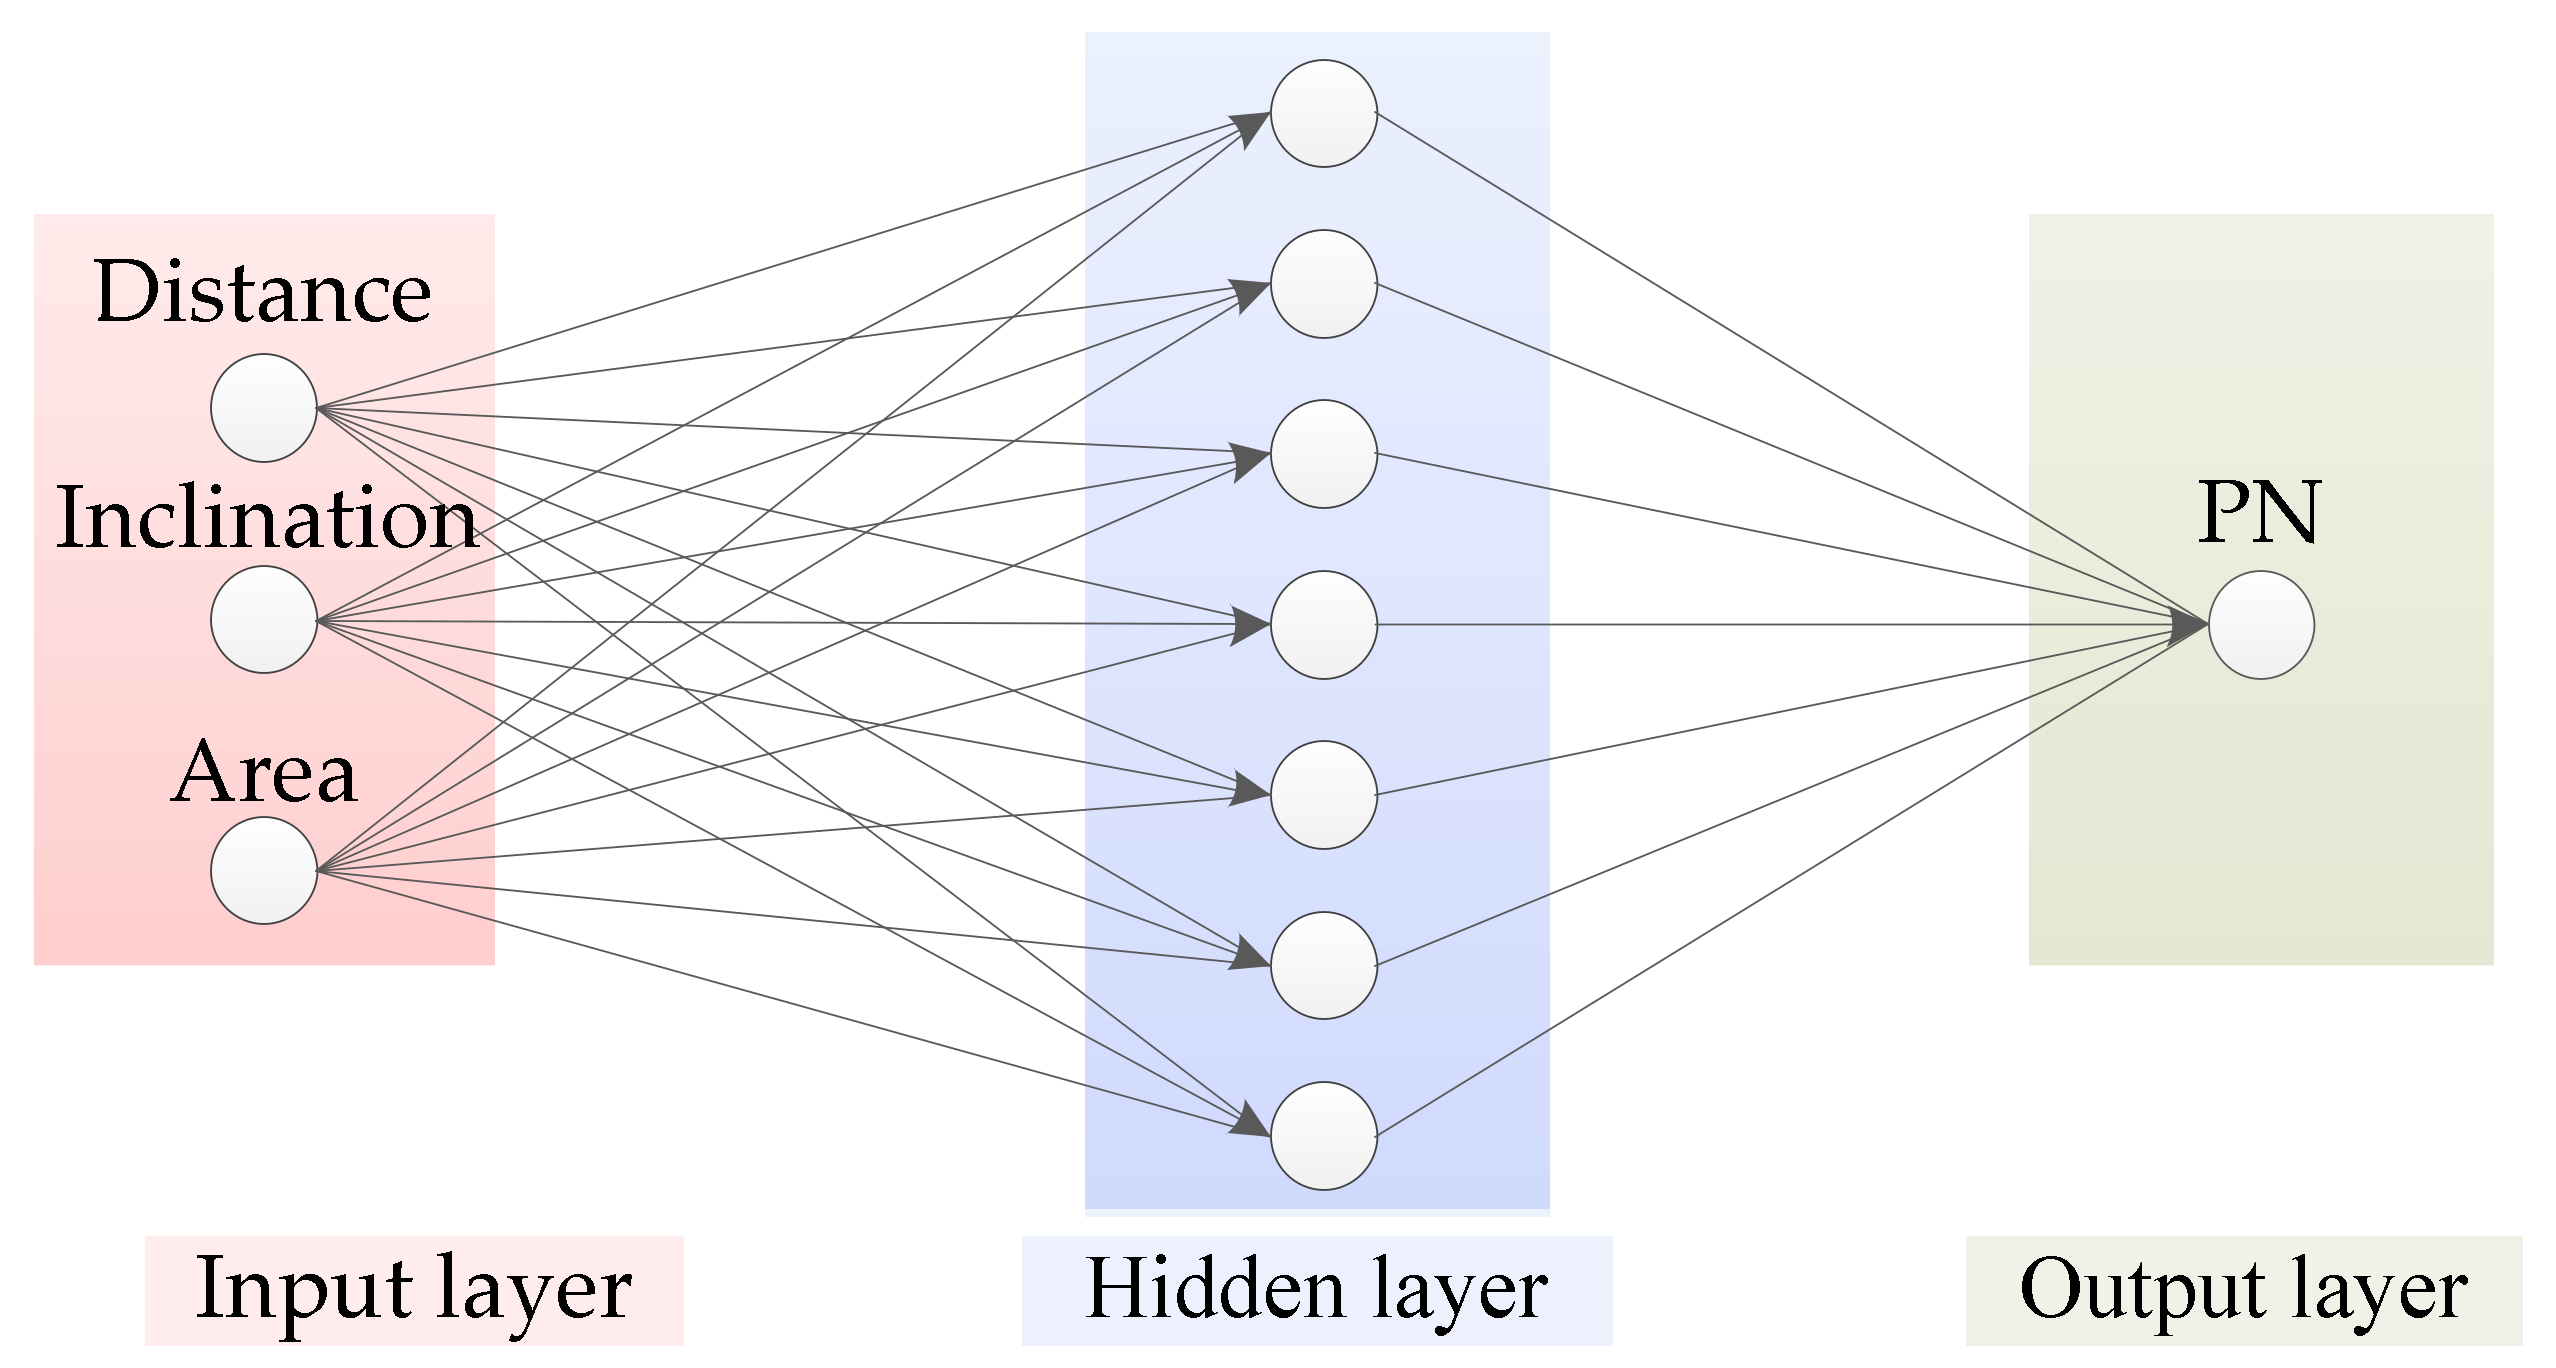
3.3. Crowd Number Estimation

Crowd number estimation mainly includes crowd number prediction model, model factor calculation and prediction.

3.3.1. Crowd Number Prediction Model

This paper constructs a crowd number prediction model (CNPM) suitable for large scenes. The specific steps are as follows: (1) Dataset collection. The dataset is mainly composed of four types of data, which are the distance from the crowd target to the camera (distance), the camera inclination (inclination), the area of crowd polygon after geographic mapping (area), and real number of people (PN). (2) Training the CNPM. Based on the above four parameters, this paper constructs a back propagation (BP) neural network for crowd density estimation. BP neural network is an error back propagation neural network, which includes input layer, hidden layer, and output layer. Each layer consists of a certain number of neurons, which has excellent nonlinear fitting ability. However, BP neural network converges slowly. It is easy to fall into the local minimum and the prediction results are extremely unstable [67]. Genetic algorithm (GA) has a strong global optimization capability. It is very important to optimize the weights and thresholds of BP neural network by using GA [68]. Therefore, this paper takes the distance, the inclination, and the area as the input layer of the model, and the number of people as the output layer. GA is used to encode the weights of the BP neural network so as to obtain the optimal combination of weights and thresholds; thus, a high-precision crowd prediction model is established. Figure 3 shows the construction process of the CNPM, and Figure 4 shows the structure of the CNPM.

3.3.2. Model Factor Calculation and Prediction

For large scene surveillance videos, the crowd geographic mapping cannot only display the crowd distribution from the map view but also obtain the model factors of the crowd count in real time. Figure 5 is a schematic diagram of three model factors of a crowd polygon.
Distance: The distance between the coordinates of the center point of the crowd target polygon M ( X M , Y M , Z M ) and the camera center point C ( X C , Y C , Z C ) in geographical space, as shown in Equation (2).
D i s t a n c e = ( X C X M ) 2 + ( Y C Y M ) 2 + ( Z C Z M ) 2
Inclination: Assuming that point c ( x , y , 0 ) is the coordinate of the intersection point between the main optical axis and the ground. Inclination is the angle between M C and C c , as shown in Equations (3) and (4).
cos ( M C , C c ) = ( X c X M ) ( x X c ) + ( Y c Y M ) ( y Y c ) + ( Z c Z M ) ( Z c ) ( X C X M ) 2 + ( Y C Y M ) 2 + ( Z C Z M ) 2   ( x X C ) 2 + ( y Y C ) 2 + ( Z C ) 2
I n c l i n a t i o n = cos 1 ( M C , C c )
Area: The crowd polygon is mapped to the geographical space, and the area of each crowd polygon can be calculated.
Based on the CNPM, the PN of each polygon in each frame can be obtained by taking the above three model factors as inputs. Figure 5 shows a certain crowd polygon P, with distance of 88.84 m, inclination of 68.89°, and area of 56.34 m2. Through the calculation of the CNPM, the PN of this polygon is 20.

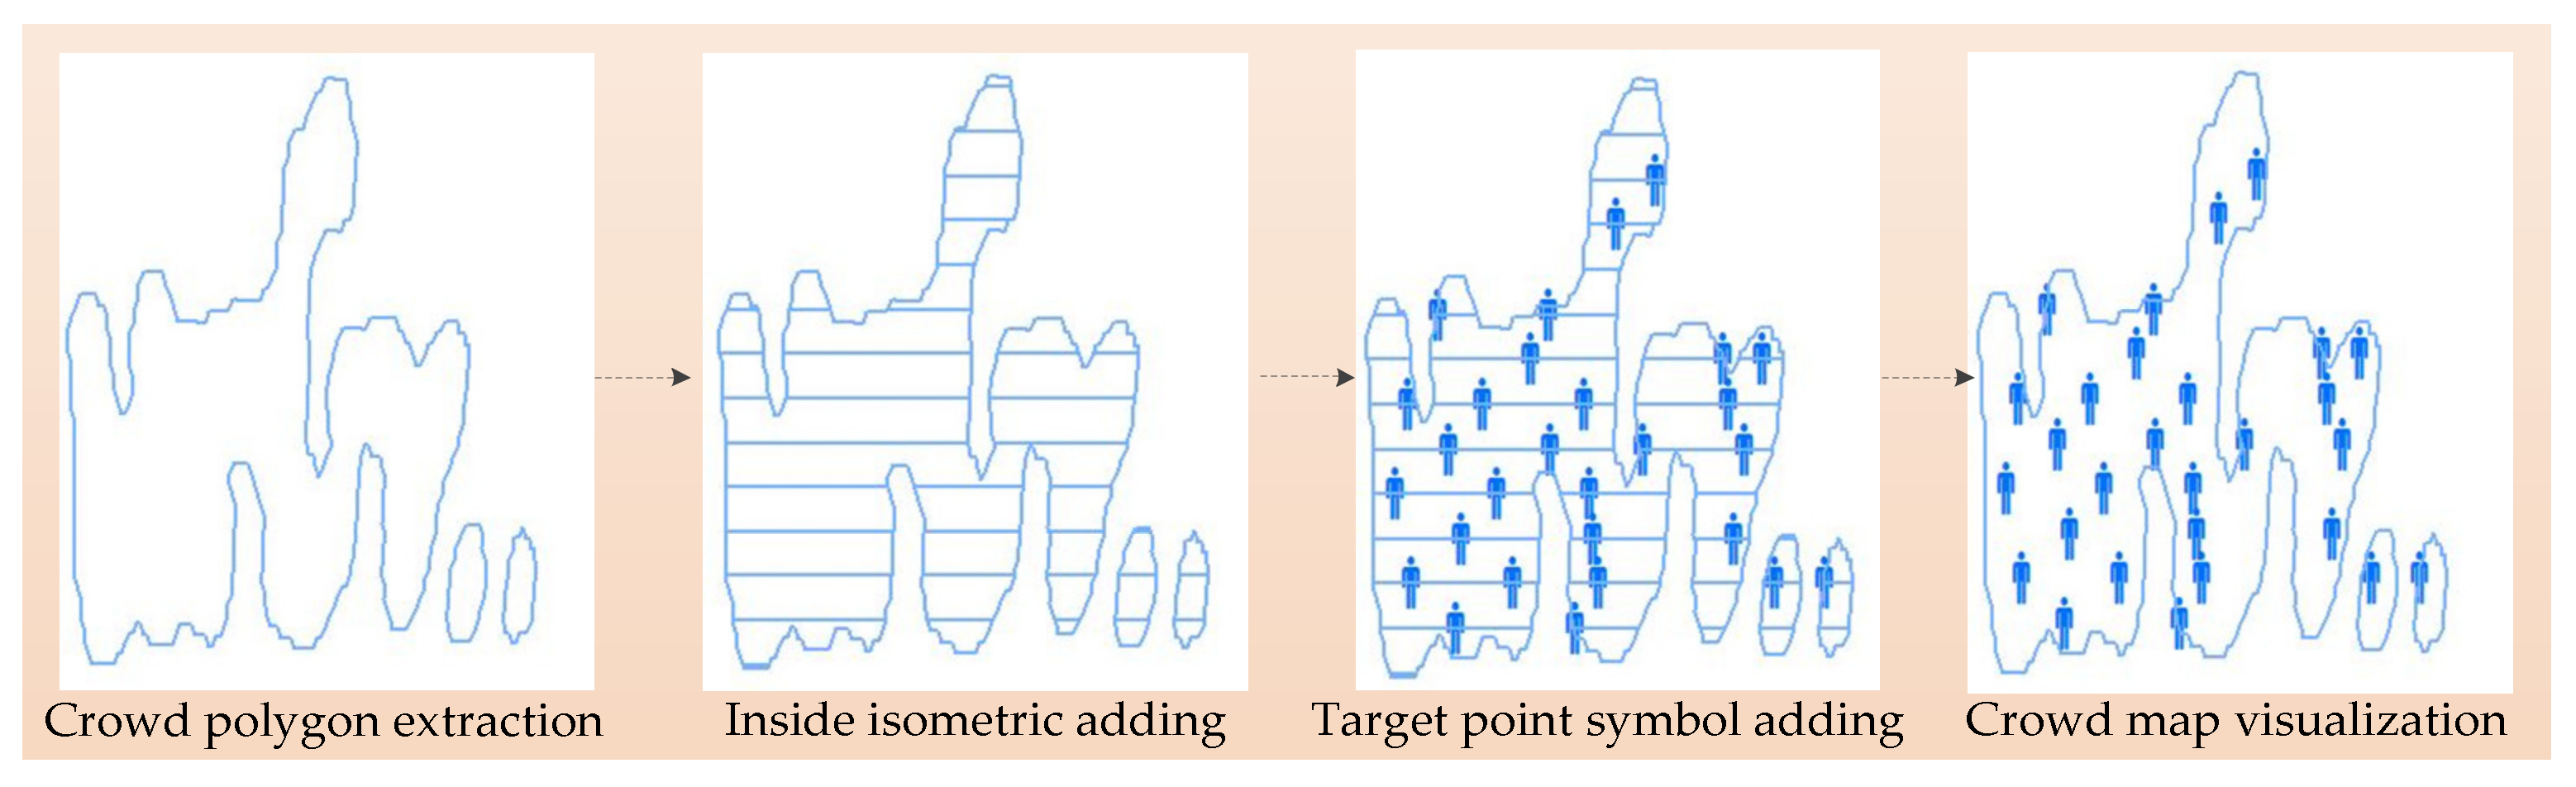
3.4. Crowd Map Visualization

Crowd map visualization mainly includes crowd polygon filling and map symbol setting.
Crowd polygon filling is to determine the number of points in the corresponding polygon according to the crowd estimated number. It mainly includes the following three steps: Firstly, we add equidistant lines in the crowd polygon and combine them into a whole to obtain its total length (L); then, according to the PN and L of the polygon, the position of each point can be calculated.
Map is the main form of geographic information visualization, and symbolic design is a key factor of map visualization. Different types of map symbols can reflect different spatial geometric characteristics of geographical things. Map symbol setting, that is, according to the position of each point within the crowd polygon, fills the designed crowd symbols. In this paper, the people symbols are produced based on the image creation symbol library. Figure 6 shows the map visualization of a crowd polygon. The process starts with the position of the polygon outline after mapping and obtains the coordinate of a point at each L/r distance, which fills the entire polygon area for visualization. Through this method, the static and dynamic crowd in video surveillance can be visualized.

4. Experiments and Results

4.1. Experimental Environment and Data

The experimental environment of this paper is as follows: GPU RTX 2080 Ti, CPU i9-9820X, memory 32 G. A school playground was selected as the experimental area, and a high-definition camera was deployed at a height of about 33 m. The experimental scene is shown in Figure 7. In the experimental area, 5000 images at different times and in different motions were collected. Among them, 2000 frames were used as segmentation dataset to train the CSSM; 1000 frames were used as classification dataset to train the CDM; 2000 frames were used for training and testing the CNPM. Based on MATLAB 2019b, VS 2012 and ArcGIS 10.2, this paper carried out relevant experiments.

4.2. Experimental Analysis

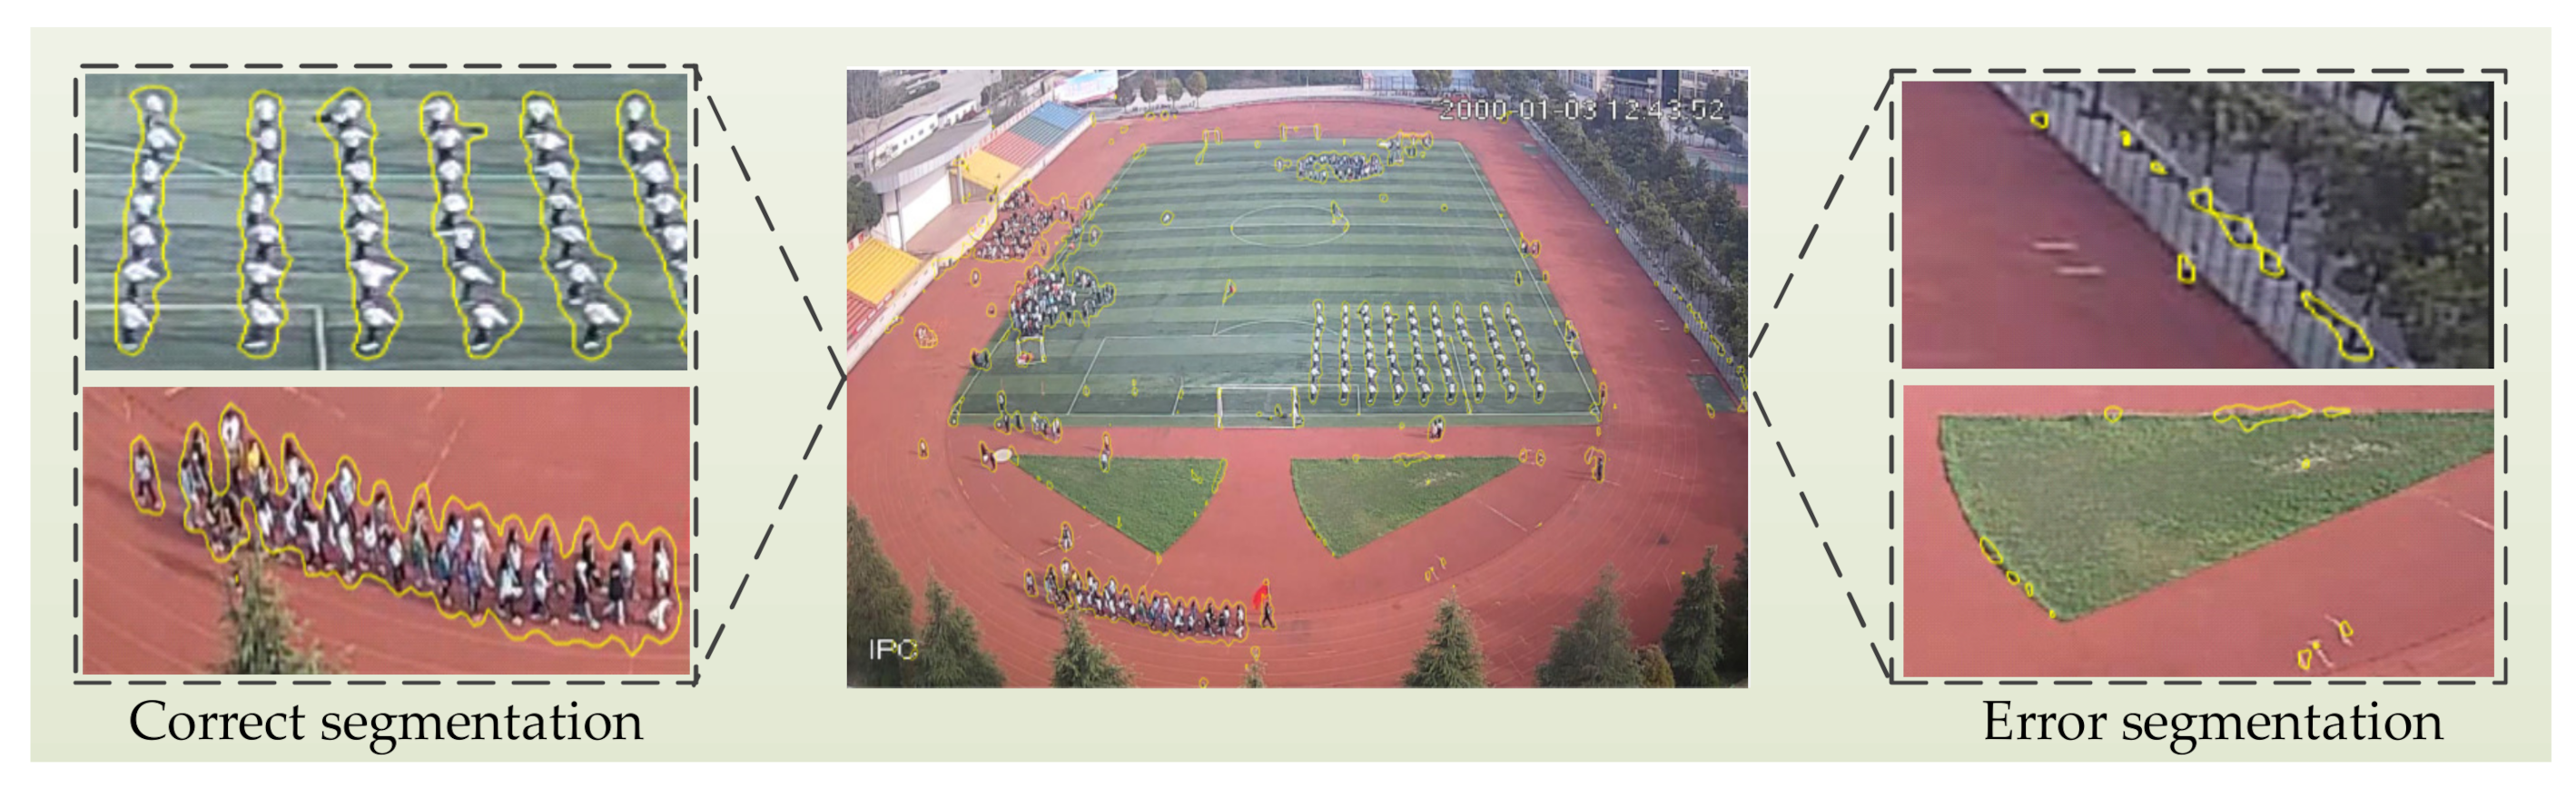
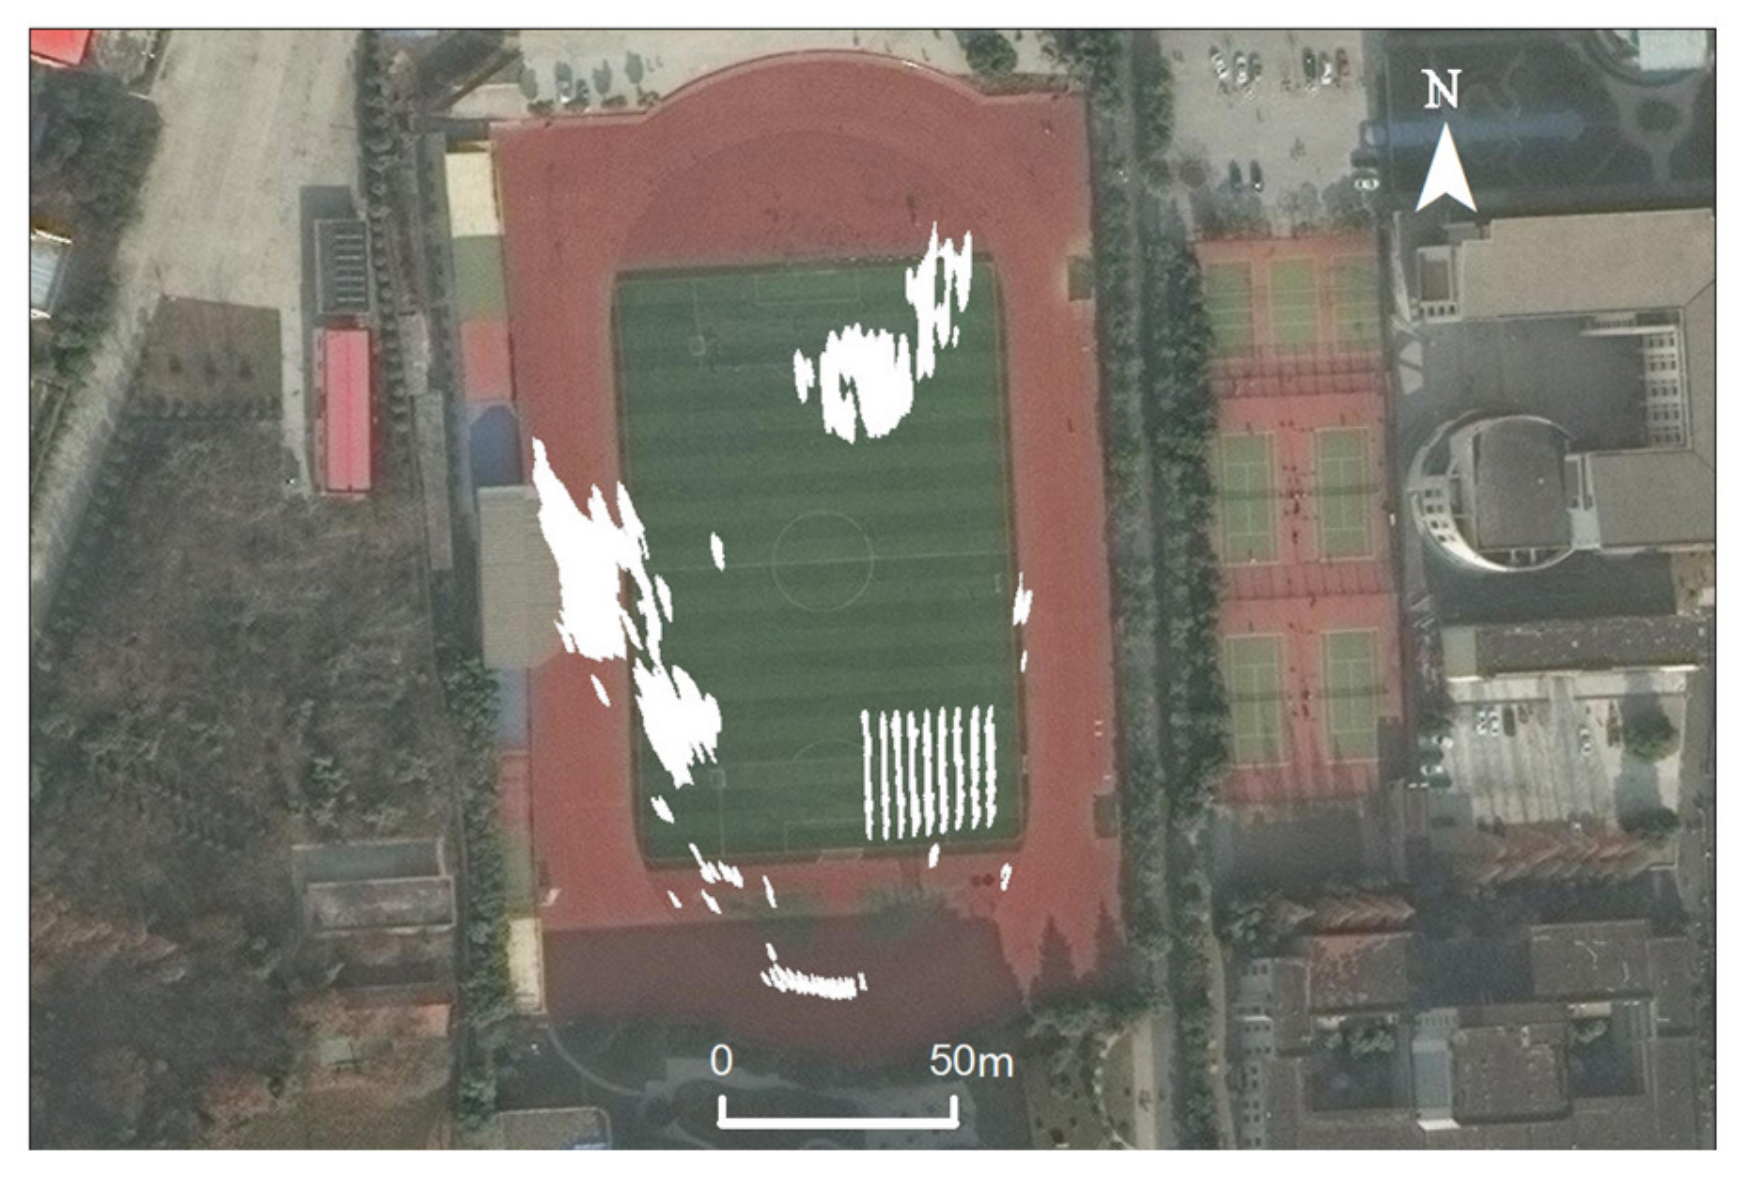
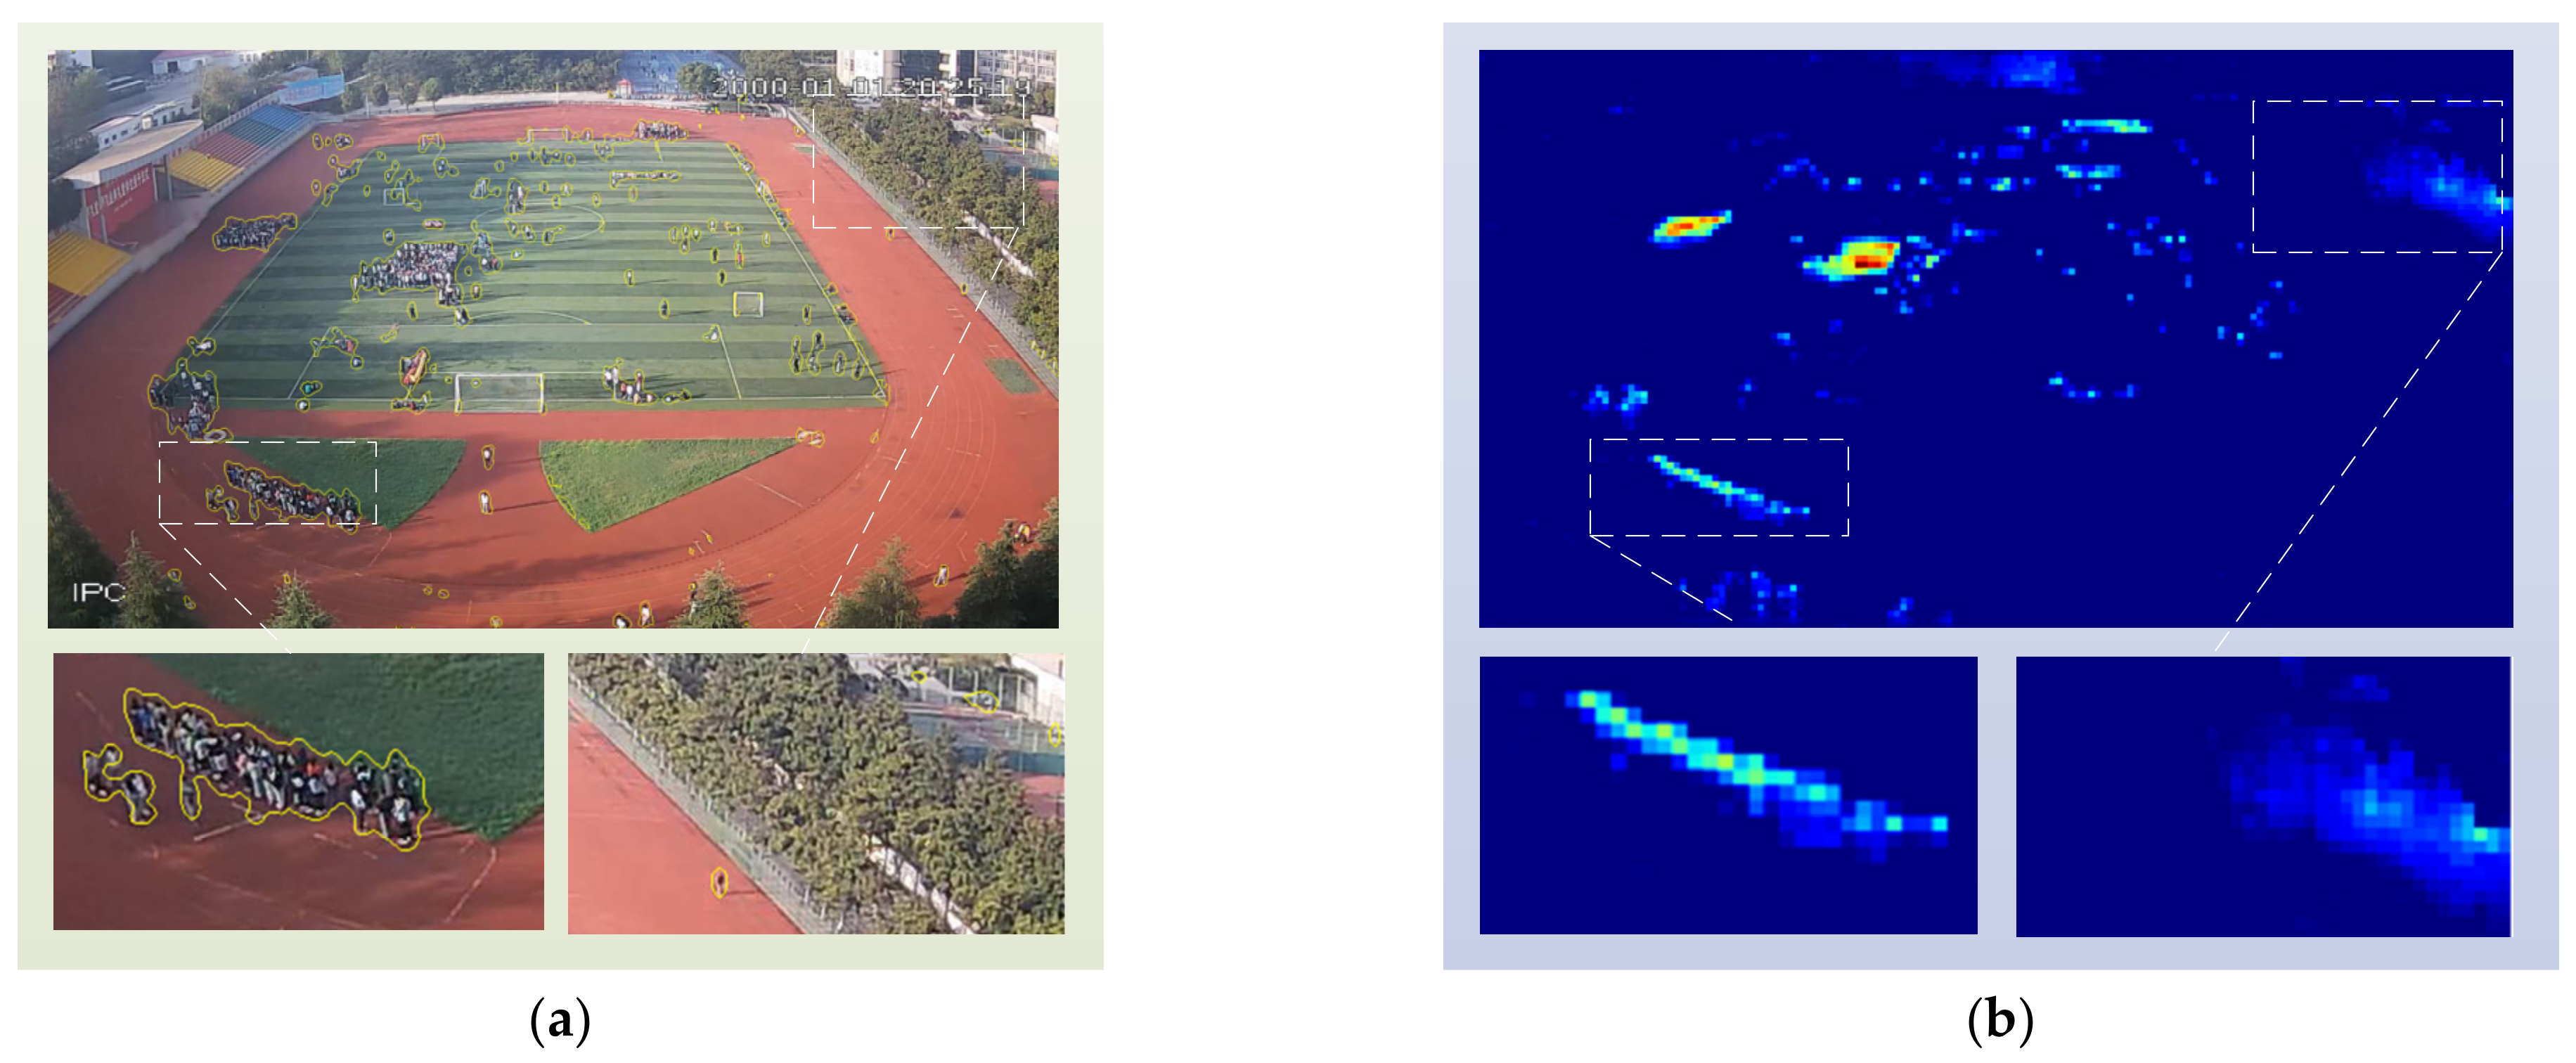
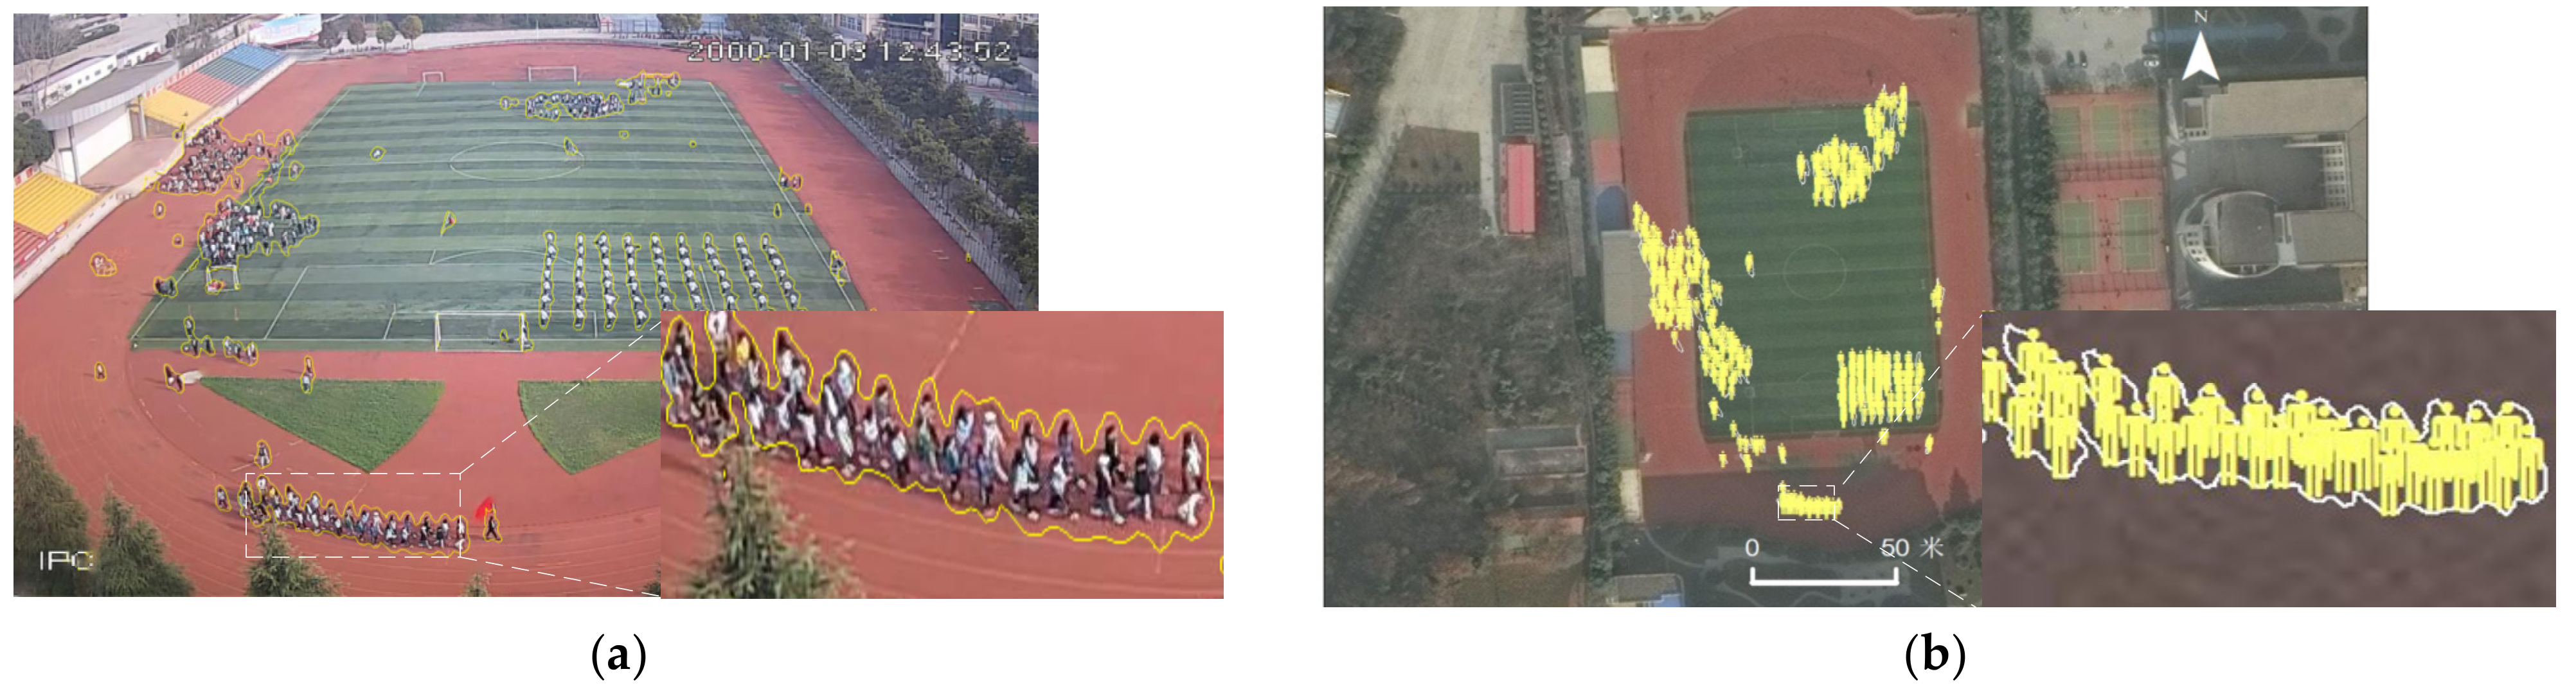
4.2.1. Crowd Extraction and Geographic Mapping

(1) Crowd Extraction
The crowd counting scene generally faces the problem of a huge density change, and the computer will also have misjudgment when executing the semantic segmentation command, which makes it impossible to achieve a completely correct segmentation effect. Therefore, this paper proposes a method combining the semantic segmentation and image classification to improve the accuracy of the crowd semantic information extraction.
In this paper, 2000 frames of crowd images were divided into the training set and test set at a ratio of 3:2. Then, according to the semantic information, two categories of people and background in the video frame were labeled. Based on this, the crowd semantic segmentation model (CSSM) was constructed. The training duration of the CSSM was about 15 min, and the accuracy of the test set was 96.70%. According to the CSSM, the real-time segmentation of crowds can be realized, and the semantic information of each crowd polygon can be obtained. Figure 8 shows the effect of the crowd semantic segmentation in this paper. It can be seen that this method has a good segmentation effect on the crowd areas for the high-altitude large scene. However, the CSSM still has some shortcomings. For example, the football frame and playground edge facilities are prone to wrong classification.
Therefore, in order to improve the accuracy of the crowd semantic segmentation and extraction, this paper designed a crowd denoising model (CDM) to remove the wrong semantic information. In this paper, 1000 frames of sample images were collected for the semantic segmentation of the crowd, and the semantic information of each crowd polygon was extracted. Then, the CDM was trained by learning the two datasets of the people and the background. The crowd denoising results are shown in Figure 9. In the experiment, this paper collected 2013 crowd polygons to test the CDM accuracy, of which 1737 were correctly classified, with an accuracy rate of 86.29%.
(2) Geographic Mapping
In this paper, 14 pairs of points were selected from video frames and a high-precision remote sensing image, respectively. Then, according to the coordinates of the selected points, the camera homography matrix was calculated to realize the transformation from the video frame image coordinates to geographical coordinates. Finally, based on the solved homography matrix, each crowd polygon in the video was mapped to the geographic space. The crowd geographic mapping effect is shown in Figure 10.

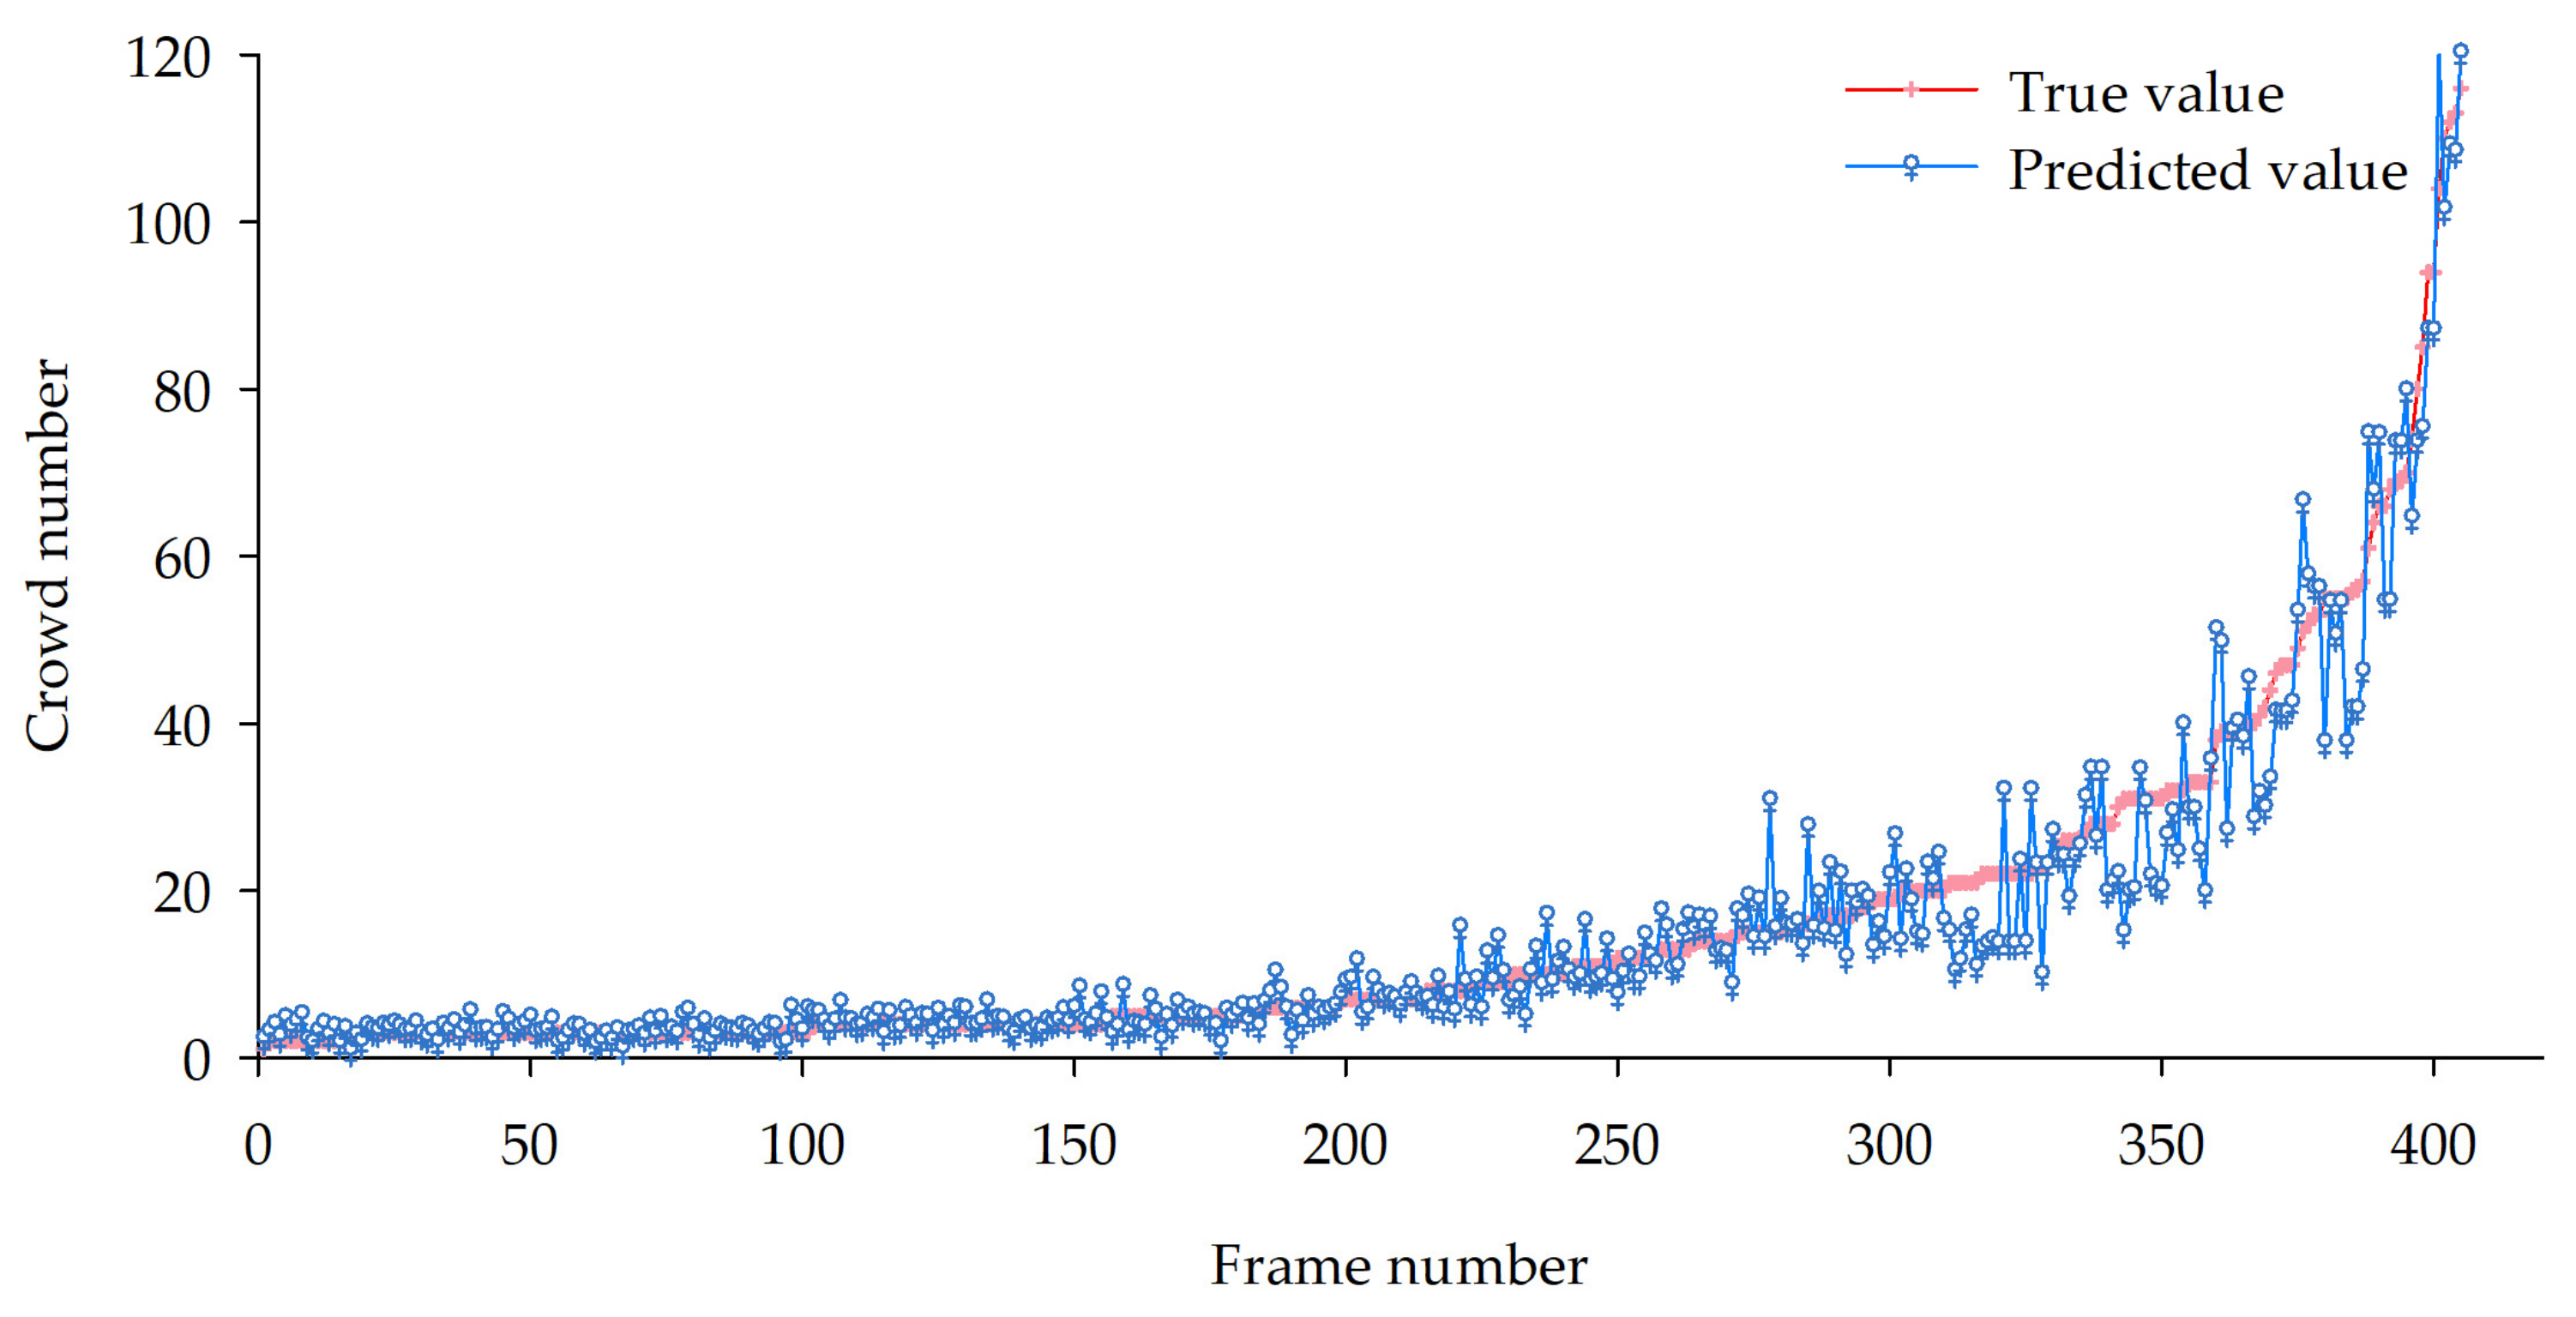
4.2.2. Crowd Number Estimation

(1) Crowd Number Prediction Model
Based on 3000 crowd polygons in the sample, this paper calculated the distance, inclination, and area of each crowd polygon. Then, with the three types of factors as the input parameters of the model and the real number of people as the output parameters, a prediction model dataset was constructed. In addition, the dataset was divided into a training set and test set according to the ratio of 4:1. Finally, based on the GA-BP network, the crowd number prediction model (CNPM) was constructed.
(2) Crowd Number Estimation
In the experiment, the typical frames were selected for the crowd number estimation. The specific steps were as follows: Firstly, the semantic segmentation and noise removal were performed on the video frames to extract the semantic information of the crowd polygons. Then, the crowd polygon was mapped to the geographic space according to the homography matrix. Finally, based on the CNPM, the number of people in each crowd area was estimated by the distance, inclination, and area. We obtained 400 crowd polygons in the experimental area, and Figure 11 shows the comparison between the true value and the predicted value. On the whole, the predicted value is closer to the true value. The average error is 1.2, and the mean square error is 4.5, which has a good estimation effect. In addition, the prediction accuracy is higher when there are more crowd targets but lower when there are more individual targets. On an individual level, some polygons (such as narrow and long polygons) have low or high predictive values. The reason is that the feature is caused by the perspective imaging of the camera. The closer the crowd polygon is to the camera, the smaller the degree of crowd mapping distortion, and conversely, the distortion is larger when the crowd is mapped from a distance. In addition, if the crowd density is high in the scene, especially in the area where people block each other seriously, the true value will also be affected by subjective factors.
(3) Algorithm Comparison and Analysis
Among the current numerous counting methods, the SFCN+ algorithm takes Resnet-101 as the backbone and generates a crowd density map by training the personnel’s head features to achieve the statistics of the number of people in the image and show a strong density regression ability in the crowd scene [69]. Based on typical video frames with a high density in the experimental area, this paper used the CDEM-M and the SFCN+ algorithm for comparison. The crowd detection effect is shown in Figure 12.
In this paper, the performance of different methods was evaluated using the most common counting evaluation indicators in crowd counting research, namely the mean absolute error (MAE) and root mean square error (RMSE), as shown in Equations (5) and (6).
M A E = 1 N 1 N | Y i Y i |
R M S E = 1 N 1 N | Y i Y i | 2
where N is the number of images in the test set, Y i is the actual number of people in a picture, and Y i is the estimated number of people in this picture. Generally, the MAE reflects the accuracy of the crowd counting, and the smaller the value is, the higher the accuracy of the algorithm is. The RMSE is used to evaluate the robustness of the crowd number estimation, and the smaller the value, the better the algorithm performance.
In the experiment, this paper selected 500 frames of different categories in the scene and tested them based on the CDEM-M and the SFCN+ algorithm. The precision comparison of the two algorithms is shown in Table 1. The MAE and RMSE of the CDEM-M are reduced by 89.9 and 85.1, respectively, indicating that the CDEM-M can improve the accuracy of the crowd counting results and have certain advantages.
Table 2 shows the crowd number estimation in the CDEM-M and SFCN+ algorithm. Obviously, the SFCN+ algorithm is difficult to recognize the personnel head feature. This may easily lead to the problems of missing individual detection in the area near the camera, fewer crowd counts in the area far away, and the wrong classification of some objects (such as trees) in the whole image. However, the CDEM-M used the CSSM to recognize the entire personnel feature and removed the crowd noise based on the CDM. It effectively avoids the difficulty in the head feature recognition of the SFCN+ algorithm, especially in the area where the head texture is not clear and people block each other. In addition, the crowd number is estimated by the three factors of the distance, the inclination, and the area, which effectively reduces the impact of the difference in the imaging accuracy between near and far objects on the crowd estimation. Therefore, the SFCN+ algorithm is suitable for small scenes with clear personnel head texture, while the CDEM-M is more applicable in high-altitude and high-density scenes.

4.2.3. Crowd Map Visualization

In order to intuitively express the spatial distribution state of the crowd in the map, this paper displayed the mapped crowd polygon area in the GIS polygon layer and filled the crowd polygon with the corresponding number of points. Figure 13a shows the crowd polygon after the semantic segmentation of an image, and Figure 13b shows the visualization effect of its crowd map. The experimental results show that the CDEM-M can accurately map the crowd in large scenes to the geographic space and realize the map visualization of the crowd. The CDEM-M not only provides a new decision-making method for the crowd supervision of large-scale activities, stations, shopping malls, and sports venues but also solves the problem that the crowd is difficult to visualize, which has a certain practical value.

5. Conclusions and Discussion

For large and complex crowd scenes, the CDEM-M has advantages in remote object extraction and visualization. Through the theoretical analysis and experimental verification, this paper draws the following main conclusions: (1) Based on the Deeplabv3+ network model, the CSSM was constructed. Its test accuracy was up to 96.70%, which can achieve high-precision crowd segmentation in surveillance videos; the classification accuracy of the CDM based on a convolutional neural network was 86.29%. Through the combination of the CSSM and the CDM, it can achieve a high-precision extraction of a crowd in large scenes and reach the practical application level. (2) Based on the points selected from video frames and a remote sensing image, this paper calculated the camera’s high-precision homography matrix; then, the crowd semantic information was mapped to the geographic space. (3) The CNPM was constructed based on the BP neural network. The average error was 1.2, and the mean square error was 4.5. By inputting the distance, inclination, and area of each crowd polygon in the real-time video frames, the crowd number can be estimated. Compared with the SFCN+ algorithm based on the density map estimation, it was found that the SFCN+ algorithm makes it difficult to identify the personnel head features in high-altitude and high-density large scenes. In this paper, the whole personnel feature was identified based on the semantic segmentation. Even in areas where the personnel texture features were not clear and people blocked each other seriously, the personnel information can be accurately identified. (4) The crowd map visualization was realized by filling the crowd polygon with the corresponding number of points. The experiment shows that the CDEM-M based on the distance, inclination, and area is more applicable in large, crowded scenes.
The CDEM-M can be used for a crowd flow analysis in commercial areas and crowd supervision in large-scale activities and sports venues, and it has an important application value in the field of intelligent security. However, the CDEM-M has several shortcomings: (1) In future research, we will pay more attention to the mixed scene of individuals and groups and discuss the research mode of “object detection for near individual and semantic segmentation for far crowd”. (2) The crowd geographic mapping is approximate, and the perspective imaging of a narrow and long crowd polygon is deformed greatly. Therefore, the following research needs to pay attention to the geometric relationship among the mapping deviation, crowd polygon shape, and distance threshold. (3) The CDEM-M is only suitable for crowd monitoring in high-altitude scenes and cannot meet the needs of crowd monitoring in close range. How to integrate traditional methods and make them more general is the focus of follow-up research.

Author Contributions

Conceptualization, Xingguo Zhang; Methodology, Xingguo Zhang and Yinping Sun; Software, Xingguo Zhang, Yinping Sun, and Qize Li; Data curation, Xiaodi Li and Xinyu Shi; Formal analysis, Yinping Sun; Investigation, Yinping Sun, Qize Li, Xiaodi Li, and Xinyu Shi; Writing—original draft, Yinping Sun; Writing—review and editing, Xingguo Zhang; Supervision, Xingguo Zhang; Project administration, Xingguo Zhang; Funding acquisition, Xingguo Zhang All authors have read and agreed to the published version of the manuscript.

Funding

This research was funded by the National Natural Science Foundation of China (NSFC) (NO. 41401436), the Natural Science Foundation of Henan Province (NO. 202300410345), and the Nanhu Scholars Program for Young Scholars of XYNU.

Institutional Review Board Statement

Not applicable.

Informed Consent Statement

Not applicable.

Data Availability Statement

Not applicable.

Acknowledgments

The authors appreciate the editors and reviewers for their comments, suggestions, and valuable time and efforts in reviewing this manuscript.

Conflicts of Interest

The authors declare no conflict of interest.

References

  1. Milosavljevic, A.; Dimitrijevic, A.; Rancic, D. GIS-augmented video surveillance. Int. J. Geogr. Inf. Sci. 2010, 24, 1415–1433. [Google Scholar] [CrossRef]
  2. Wang, T.; Qiao, M.N.; Deng, Y.J.; Zhou, Y.; Wang, H.; Lyu, Q.; Snoussi, H. Abnormal event detection based on analysis of movement information of video sequence. Optik 2018, 152, 50–60. [Google Scholar] [CrossRef]
  3. Xiong, Q.H.; Zhou, S.J.; Chen, Q.S. Abnormal driving behavior detection based on kernelization-sparse representation in video surveillance. Multimed. Tools Appl. 2022, 81, 4585–4601. [Google Scholar] [CrossRef]
  4. Hsueh, Y.L.; Lie, W.N.; Guo, G.Y. Human behavior recognition from multiview videos. Inf. Sci. 2020, 517, 275–296. [Google Scholar] [CrossRef]
  5. Zhang, Y.G.; Wang, J.; Yang, X. Real-time vehicle detection and tracking in video based on faster R-CNN. J. Phys. Conf. Ser. 2017, 887, 14–16. [Google Scholar] [CrossRef]
  6. Zhang, C.; Li, H.S.; Wang, X.; Yang, X.K. Cross-scene crowd counting via deep convolutional neural networks. In Proceedings of the 2015 IEEE Conference on Computer Vision and Pattern Recognition (CVPR), Boston, MA, USA, 7–12 June 2015; pp. 833–841. [Google Scholar] [CrossRef]
  7. Sengar, S.S.; Mukhopadhyay, S. Moving object detection based on frame difference and W4. SIViP 2017, 11, 1357–1364. [Google Scholar] [CrossRef]
  8. Idrees, H.; Saleemi, I.; Seibert, C.; Shah, M. Multi-source multi-scale counting in extremely dense crowd images. In Proceedings of the 2013 IEEE Conference on Computer Vision and Pattern Recognition, Portland, OR, USA, 23–28 June 2013; pp. 2547–2554. [Google Scholar] [CrossRef]
  9. Chan, A.B.; Vasconcelos, N. Bayesian Poisson regression for crowd counting. In Proceedings of the 2009 IEEE 12th International Conference on Computer Vision, Kyoto, Japan, 29 September–2 October 2009; pp. 545–551. [Google Scholar] [CrossRef]
  10. Paragios, N.; Ramesh, V. A MRF-based approach for real-time subway monitoring. In Proceedings of the 2001 IEEE Computer Society Conference on Computer Vision and Pattern Recognition, Kauai, HI, USA, 8–14 December 2001. [Google Scholar] [CrossRef]
  11. Chan, A.B.; Liang, Z.S.J.; Vasconcelos, N. Privacy preserving crowd monitoring: Counting people without people models or tracking. In Proceedings of the 2008 IEEE Conference on Computer Vision and Pattern Recognition, Anchorage, AK, USA, 23–28 June 2008; pp. 1–7. [Google Scholar] [CrossRef]
  12. McDonald, G.C. Ridge regression. WIREs Comp. Stats. 2009, 1, 93–100. [Google Scholar] [CrossRef]
  13. Zhang, W.H.; Liu, C. Research on human abnormal behavior detection based on deep learning. In Proceedings of the 2020 International Conference on Virtual Reality and Intelligent Systems (ICVRIS), Zhangjiajie, China, 18–19 July 2020; pp. 973–978. [Google Scholar] [CrossRef]
  14. Bai, H.Y.; Mao, J.G.; Chan, S.-H.G. A survey on deep learning-based single image crowd counting: Network design, loss function and supervisory signal. Neurocomputing 2022, 508, 1–18. [Google Scholar] [CrossRef]
  15. Zhao, Y.C.; Chen, B. WiCount: A deep learning approach for crowd counting using WiFi signals. In Proceedings of the 2017 IEEE International Symposium on Parallel and Distributed Processing with Applications and 2017 IEEE International Conference on Ubiquitous Computing and Communications (ISPA/IUCC), Guangzhou, China, 12–15 December 2017; pp. 967–974. [Google Scholar] [CrossRef]
  16. Liu, Y.B.; Jia, R.S.; Liu, Q.M.; Zhang, X.L.; Sun, H.M. Crowd counting method based on the self-attention residual network. Appl. Intell. 2021, 51, 427–440. [Google Scholar] [CrossRef]
  17. Pissinou, N.; Radev, I.; Makki, K. Spatio-temporal modeling in video and multimedia geographic information systems. GeoInformatica 2001, 5, 375–409. [Google Scholar] [CrossRef]
  18. Felzenszwalb, P.F.; Girshick, R.B.; McAllester, D.; Ramanan, D. Object detection with discriminatively trained part-based models. IEEE Trans. Pattern Anal. Mach. Intell. 2010, 32, 1627–1645. [Google Scholar] [CrossRef] [PubMed]
  19. Lin, S.F.; Chen, J.Y.; Chao, H.X. Estimation of number of people in crowded scenes using perspective transformation. IEEE Trans. Syst. Man Cybern. A Syst. Humans 2001, 31, 645–654. [Google Scholar] [CrossRef]
  20. Wu, B.; Nevatia, R. Detection and tracking of multiple, partially occluded humans by bayesian combination of edgelet based part detectors. Int. J. Comput. Vis. 2007, 75, 247–266. [Google Scholar] [CrossRef]
  21. Cho, S.Y.; Chow, T.W.S.; Leung, C.T. A neural-based crowd estimation by hybrid global learning algorithm. IEEE Trans. Syst. Man Cybern. B Cybern. 1999, 29, 535–541. [Google Scholar] [CrossRef]
  22. Wang, Y.; Zou, Y. Fast visual object counting via example-based density estimation. In Proceedings of the 2016 IEEE International Conference on Image Processing (ICIP), Phoenix, AZ, USA, 25–28 September 2016; pp. 3653–3657. [Google Scholar] [CrossRef]
  23. Pham, V.Q.; Kozakaya, T.; Yamaguchi, O.; Okada, R. Count Forest: Co-voting uncertain number of targets using random forest for crowd density estimation. In Proceedings of the 2015 IEEE International Conference on Computer Vision (ICCV), Santiago, Chile, 7–13 December 2015; pp. 3253–3261. [Google Scholar] [CrossRef]
  24. Saleh, S.A.M.; Suandi, S.A.; Ibrahim, H. Recent survey on crowd density estimation and counting for visual surveillance. Eng. Appl. Artif. Intell. 2015, 41, 103–114. [Google Scholar] [CrossRef]
  25. Wang, Q.; Gao, J.Y.; Lin, W.; Yuan, Y. Learning from synthetic data for crowd counting in the wild. In Proceedings of the 2019 IEEE/CVF Conference on Computer Vision and Pattern Recognition (CVPR), Long Beach, CA, USA, 15–20 June 2019; pp. 8198–8207. [Google Scholar] [CrossRef]
  26. Yu, C.Y.; Xu, Y.; Gou, L.S.; Nan, Z.F. Crowd counting based on single-column deep spatiotemporal convolutional neural network. Laser Optoelectron. Prog. 2021, 58, 143–151. [Google Scholar] [CrossRef]
  27. Boominathan, L.; Kruthiventi, S.S.S.; Babu, R.V. CrowdNet: A deep convolutional network for dense crowd counting. In Proceedings of the 24th ACM International Conference on Multimedia, Amsterdam, The Netherlands, 15–19 October 2016; pp. 640–644. [Google Scholar] [CrossRef]
  28. Zhang, Y.Y.; Zhou, D.S.; Chen, S.Q.; Gao, S.H.; Ma, Y. Single-image crowd counting via multi-column convolutional neural network. In Proceedings of the 2016 IEEE Conference on Computer Vision and Pattern Recognition (CVPR), Las Vegas, NV, USA, 27–30 June 2016; pp. 589–597. [Google Scholar] [CrossRef]
  29. Sindagi, V.A.; Patel, V.M. Generating high-quality crowd density maps using contextual pyramid CNNs. In Proceedings of the 2017 IEEE International Conference on Computer Vision (ICCV), Venice, Italy, 22–29 October 2017; pp. 1879–1888. [Google Scholar] [CrossRef]
  30. Cao, X.K.; Wang, Z.P.; Zhao, Y.Y.; Su, F. Scale aggregation network for accurate and efficient crowd counting. In Proceedings of the European Conference on Computer Vision, Munich, Germany, 8–14 September 2018; pp. 734–750. [Google Scholar] [CrossRef]
  31. Li, Y.H.; Zhang, X.F.; Chen, D.M. CSRnet: Dilated convolutional neural networks for understanding the highly congested scenes. In Proceedings of the 2018 IEEE/CVF Conference on Computer Vision and Pattern Recognition, Salt Lake City, UT, USA, 18–23 June 2018; pp. 1091–1100. [Google Scholar] [CrossRef]
  32. Zhang, L.; Shi, M.J.; Chen, Q.B. Crowd counting via Scale-Adaptive Convolutional Neural Network. In Proceedings of the 2018 IEEE Winter Conference on Applications of Computer Vision (WACV), Lake Tahoe, NV, USA, 12–15 March 2018; pp. 1113–1121. [Google Scholar] [CrossRef]
  33. Yu, H.S.; Yang, Z.G.; Tan, L.; Wang, Y.N.; Sun, W.; Sun, M.G.; Tang, Y.D. Methods and datasets on semantic segmentation: A review. Neurocomputing 2018, 304, 82–103. [Google Scholar] [CrossRef]
  34. Csurka, G.; Perronnin, F. An efficient approach to semantic segmentation. Int. J. Comput. Vis. 2011, 95, 198–212. [Google Scholar] [CrossRef]
  35. Guo, Y.M.; Liu, Y.; Georgiou, T.; Lew, M.S. A review of semantic segmentation using deep neural networks. Int. J. Multimed. Inf. Retr. 2018, 7, 87–93. [Google Scholar] [CrossRef]
  36. Shelhamer, E.; Long, J.; Darrell, T. Fully convolutional networks for semantic segmentation. IEEE Trans. Pattern Anal. Mach. Intell. 2017, 39, 640–651. [Google Scholar] [CrossRef]
  37. Ronneberger, O.; Fischer, P.; Brox, T. U-Net: Convolutional networks for biomedical image segmentation. In Proceedings of the Medical Image Computing and Computer-Assisted Intervention—MICCAI 2015, Munich, Germany, 5–9 October 2015; Volume 9351, pp. 234–241. [Google Scholar] [CrossRef]
  38. Zhao, H.S.; Shi, J.P.; Qi, X.J.; Wang, X.G.; Jia, J.Y. Pyramid scene parsing network. In Proceedings of the 2017 IEEE Conference on Computer Vision and Pattern Recognition (CVPR), Honolulu, HI, USA, 21–26 July 2017; pp. 2881–2890. [Google Scholar] [CrossRef]
  39. Badrinarayanan, V.; Kendall, A.; Cipolla, R. SegNet: A deep convolutional encoder-decoder architecture for scene segmentation. IEEE Trans. Pattern Anal. Mach. Intell. 2017, 39, 2481–2495. [Google Scholar] [CrossRef]
  40. Chen, L.C.; Papandreou, G.; Kokkinos, I.; Murphy, K.; Yuille, A.L. Semantic image segmentation with deep convolutional nets and fully connected CRFs. arXiv 2014. [Google Scholar] [CrossRef]
  41. Chen, L.C.; Papandreou, G.; Kokkinos, I.; Murphy, K.; Yuille, A.L. DeepLab: Semantic image segmentation with deep convolutional nets, atrous convolution, and fully connected CRFs. IEEE Trans. Pattern Anal. Mach. Intell. 2018, 40, 834–848. [Google Scholar] [CrossRef]
  42. Chen, L.C.; Papandreou, G.; Schroff, F.; Adam, H. Rethinking atrous convolution for semantic image segmentation. arXiv 2017, arXiv:1706.05587. [Google Scholar] [CrossRef]
  43. Chen, L.C.; Zhu, Y.K.; Papandreou, G.; Schroff, F.; Adam, H. Encoder-decoder with atrous separable convolution for semantic image segmentation. In Proceedings of the Computer Vision—ECCV 2018, Munich, Germany, 8–14 September 2018; pp. 833–851. [Google Scholar] [CrossRef]
  44. Sultani, W.; Chen, C.; Shah, M. Real-World anomaly detection in surveillance videos. In Proceedings of the 2018 IEEE/CVF Conference on Computer Vision and Pattern Recognition, Salt Lake City, UT, USA, 18–23 June 2018; pp. 6479–6488. [Google Scholar] [CrossRef]
  45. Day, Y.F.; Dagtas, S.; Iino, M.; Khokhar, A.; Ghafoor, A. Spatio-temporal modeling of video data for on-line object-oriented query processing. In Proceedings of the International Conference on Multimedia Computing and Systems, Washington, DC, USA, 15–18 May 1995; pp. 98–105. [Google Scholar] [CrossRef]
  46. Wu, C.; Zhu, Q.; Zhang, Y.T.; Du, Z.Q.; Zhou, Y.; Xie, X.; He, F. An adaptive organization method of GeoVideo data for spatio-temporal association analysis. ISPRS Ann. Photogramm. Remote Sens. Spatial Inf. Sci. 2015, 2, 29. [Google Scholar] [CrossRef]
  47. Lewis, P.; Fotheringham, S.; Winstanley, A. Spatial video and GIS. Int. J. Geogr. Inf. Sci. 2011, 25, 697–716. [Google Scholar] [CrossRef]
  48. Ren, S.Q.; He, K.M.; Girshick, R.; Sun, J. Faster R-CNN: Towards Real-Time Object Detection with Region Proposal Networks. IEEE Trans. Pattern Anal. Mach. Intell. 2015, 39, 1137–1149. [Google Scholar] [CrossRef]
  49. Redmon, J.; Farhadi, A. YOLO9000: Better, faster, stronger. Computer Vision and Pattern Recognition. In Proceedings of the 2017 IEEE Conference on Computer Vision and Pattern Recognition (CVPR), Honolulu, HI, USA, 21–26 July 2017; pp. 6517–6525. [Google Scholar] [CrossRef]
  50. Smeulders, A.W.M.; Chu, D.M.; Cucchiara, R.; Calderara, S.; Dehghan, A.; Shah, M. Visual tracking: An experimental survey. IEEE Trans. Pattern Anal. Mach. Intell. 2014, 36, 1442–1468. [Google Scholar] [CrossRef] [Green Version]
  51. Ross, D.A.; Lim, J.; Lin, R.S.; Yang, M.H. Incremental learning for robust visual tracking. Int. J. Comput. Vis. 2008, 77, 125–141. [Google Scholar] [CrossRef]
  52. Lawin, F.J.; Danelljan, M.; Tosteberg, P.; Bhat, G.; Khan, F.S.; Felsberg, M. Deep projective 3D semantic segmentation. In Proceedings of the Computer Analysis of Images and Patterns, Ystad, Sweden, 22–24 August 2017; pp. 95–107. [Google Scholar] [CrossRef]
  53. Hamin, S.; Kichun, J.; Jieun, C.; Youngrok, S.; Chansoo, K.; Kwangjin, H. A training dataset for semantic segmentation of urban point cloud map for intelligent vehicles. ISPRS J. Photogramm. Remote Sens. 2022, 187, 159–170. [Google Scholar] [CrossRef]
  54. Leow, W.K.; Chiang, C.C.; Hung, Y.P. Localization and mapping of surveillance cameras in city map. In Proceedings of the 16th International Conference on Multimedia 2008, Vancouver, BC, Canada, 26–31 October 2008; pp. 369–378. [Google Scholar] [CrossRef]
  55. Joo, I.H.; Hwang, T.H.; Choi, K.H. Generation of video metadata supporting video-GIS integration. ICIP 2004, 3, 1695–1698. [Google Scholar]
  56. Zhang, X.G.; Shi, X.Y.; Luo, X.Y.; Sun, Y.P.; Zhou, Y.D. Real-Time web map construction based on multiple cameras and GIS. ISPRS Int. J. Geo-Inf. 2021, 10, 803. [Google Scholar] [CrossRef]
  57. Hsu, S.; Samarasekera, S.; Kumar, R.; Sawhney, H.S. Pose estimation, model refinement, and enhanced visualization using video. In Proceedings of the IEEE Conference on Computer Vision and Pattern Recognition, Hilton Head, SC, USA, 15 June 2000; pp. 488–495. [Google Scholar] [CrossRef]
  58. Xie, Y.J.; Wang, M.Z.; Liu, X.J.; Wu, Y.G. Intergration of GIS and moving objects in surveillance video. ISPRS Int. J. Geo-Inf. 2017, 6, 94. [Google Scholar] [CrossRef]
  59. Dai, H.H.; Hu, B.; Cui, Q.; Zou, Z.Q. VideoGIS data retrieval based on multi-feature fusion. In Proceedings of the 2017 12th International Conference on Intelligent Systems and Knowledge Engineering (ISKE), Nanjing, China, 24–26 November 2017; pp. 1–9. [Google Scholar] [CrossRef]
  60. Chrysler, A.; Gunarso, R.; Puteri, T.; Warnars, H.L.H.S. A literature review of crowd-counting system on convolutional neural network. IOP Conf. Ser. Earth Environ. Sci. 2021, 729, 012029. [Google Scholar] [CrossRef]
  61. Li, B.; Huang, H.B.; Zhang, A.; Liu, P.W.; Liu, C. Approaches on crowd counting and density estimation: A review. Pattern Anal. Applic. 2021, 24, 853–874. [Google Scholar] [CrossRef]
  62. Ma, H.; Arslan Ay, S.; Zimmermann, R.; Kim, S.H. Large-scale geo-tagged video indexing and queries. Geoinformatica 2014, 18, 671–697. [Google Scholar] [CrossRef]
  63. Fu, H.; Fu, B.H.; Shi, P.H. An improved segmentation method for automatic mapping of cone karst from remote sensing data based on DeepLabV3+ model. Remote Sens. 2021, 13, 441. [Google Scholar] [CrossRef]
  64. Hassanzadeh, T.; Essam, D.; Sarker, R. EvoDCNN: An evolutionary deep convolutional neural network for image classification. Neurocomputing 2022, 488, 271–283. [Google Scholar] [CrossRef]
  65. Sankaranarayanan, K.; Davis, J.W. A fast linear registration framework for multi-camera GIS coordination. In Proceedings of the 2008 IEEE Fifth International Conference on Advanced Video and Signal Based Surveillance, Santa Fe, NM, USA, 1–3 September 2008; pp. 245–251. [Google Scholar] [CrossRef]
  66. Collins, R.T.; Lipton, A.J.; Fujiyoshi, H.; Kanade, T. Algorithms for cooperative multi-sensor surveillance. Proc. IEEE Inst. Electr. Electron. Eng. 2001, 89, 1456–1477. [Google Scholar] [CrossRef]
  67. Yue, C.W.; Li, N.T.; Hai, L.W. Inflation forecast based on BP neural network model. Adv. Mater. Res. 2014, 3326, 5536–5539. [Google Scholar] [CrossRef]
  68. Qiu, W.D.; Wen, G.J.; Liu, H.J. A Back-Propagation neural network model based on genetic algorithm for prediction of build-up rate in drilling process. Arab. J. Sci. Eng. 2022, 47, 11089–11099. [Google Scholar] [CrossRef]
  69. Wang, Q.; Gao, J.Y.; Lin, W.; Li, X.L. NWPU-Crowd: A largescale benchmark for crowd counting and localization. IEEE Trans. Pattern Anal. Mach. Intell. 2021, 43, 2141–2149. [Google Scholar] [CrossRef]
Figure 1. Flowchart of the CDEM-M.
Ijgi 12 00056 g001
Figure 2. Flowchart of crowd geographic mapping.
Ijgi 12 00056 g002
Figure 3. Flowchart of the CNPM.
Ijgi 12 00056 g003
Figure 4. The structure of the CNPM.
Ijgi 12 00056 g004
Figure 5. Schematic diagram of three model factors of a crowd polygon.
Ijgi 12 00056 g005
Figure 6. Schematic diagram of the crowd map visualization.
Ijgi 12 00056 g006
Figure 7. The 2D map of the experimental area.
Ijgi 12 00056 g007
Figure 8. Crowd semantic segmentation.
Ijgi 12 00056 g008
Figure 9. Crowd noise removal.
Ijgi 12 00056 g009
Figure 10. Crowd geographic mapping.
Ijgi 12 00056 g010
Figure 11. Chart of predicted value and true value of crowd counting.
Ijgi 12 00056 g011
Figure 12. Crowd detection results in dense scenes: (a) the CDEM-M; (b) the SFCN+ algorithm.
Ijgi 12 00056 g012
Figure 13. Crowd visualization: (a) crowd polygon; (b) crowd map visualization.
Ijgi 12 00056 g013
Table 1. Comparison of two algorithms.
AlgorithmMAERMSE
SFCN+126.9128.6
CDEM-M37.043.5
Table 2. Crowd number estimation of two algorithms.
FrameSFCN+CDEM-M
Ijgi 12 00056 i001
True value: 505
Ijgi 12 00056 i002
Predicted value: 312
Ijgi 12 00056 i003
Predicted value: 537
Ijgi 12 00056 i004
True value: 348
Ijgi 12 00056 i005
Predicted value: 242
Ijgi 12 00056 i006
Predicted value: 324
Ijgi 12 00056 i007
True value: 685
Ijgi 12 00056 i008
Predicted value: 362
Ijgi 12 00056 i009
Predicted value: 716
Ijgi 12 00056 i010
True value: 130
Ijgi 12 00056 i011
Predicted value: 57
Ijgi 12 00056 i012
Predicted value: 157
Disclaimer/Publisher’s Note: The statements, opinions and data contained in all publications are solely those of the individual author(s) and contributor(s) and not of MDPI and/or the editor(s). MDPI and/or the editor(s) disclaim responsibility for any injury to people or property resulting from any ideas, methods, instructions or products referred to in the content.

