1. Introduction
Since the end of the 20th century, there has been a considerable increase in social awareness of the essential role of sustainability in the maintenance and development of urban environments, creating a pressing need for detailed planning and long-term urban transformation and planning [
1]. Cities have established themselves as locations where future human development will undoubtedly be relevant [
2], leading to a continuous search for better spatial planning tools to assess the urban environment and achieve sustainable development goals [
3]. The sustainability of cities is increasingly present in the political agenda; the urban environment and its constituent aspects are undergoing a change in understanding [
4]. In the early 1960s, the far-reaching effect that urban planning had on society was already anticipated, while at the same time acting as an axis of support for urban sustainability policies [
5]. In this sense, sustainability is understood as a state in which the environmental, economic and social needs of future generations are not compromised [
6], so a sustainable city must take these three fundamental issues into account. In this way, sustainability seeks an urban balance between those spaces that are intended for urban functionality and organization, and those spaces oriented towards citizens [
7,
8].
The typology of cities at the European level [
9], and more specifically in Spain [
10,
11], is very particular, as they are cities with a defined historic center [
12], usually located in the center, accompanied by a diversity of fabrics on the periphery, normally developed since the 19th century. The successive urban development processes that cities have undergone over the last 50 years have been characterized by low compactness and, in some cases, low-density urbanization (centered on large housing units), sometimes without adequate accessibility to minimum social facilities [
13]. Notwithstanding the above, cities must be designed as a more livable place where sustainable urbanism drives the transformation of public space and ensures the quality of life and social cohesion of its inhabitants. At the same time, the elements that compose it must be configured towards a model that helps to strengthen the life of the city through the dynamism caused by new mobility flows, comfort variables and activities [
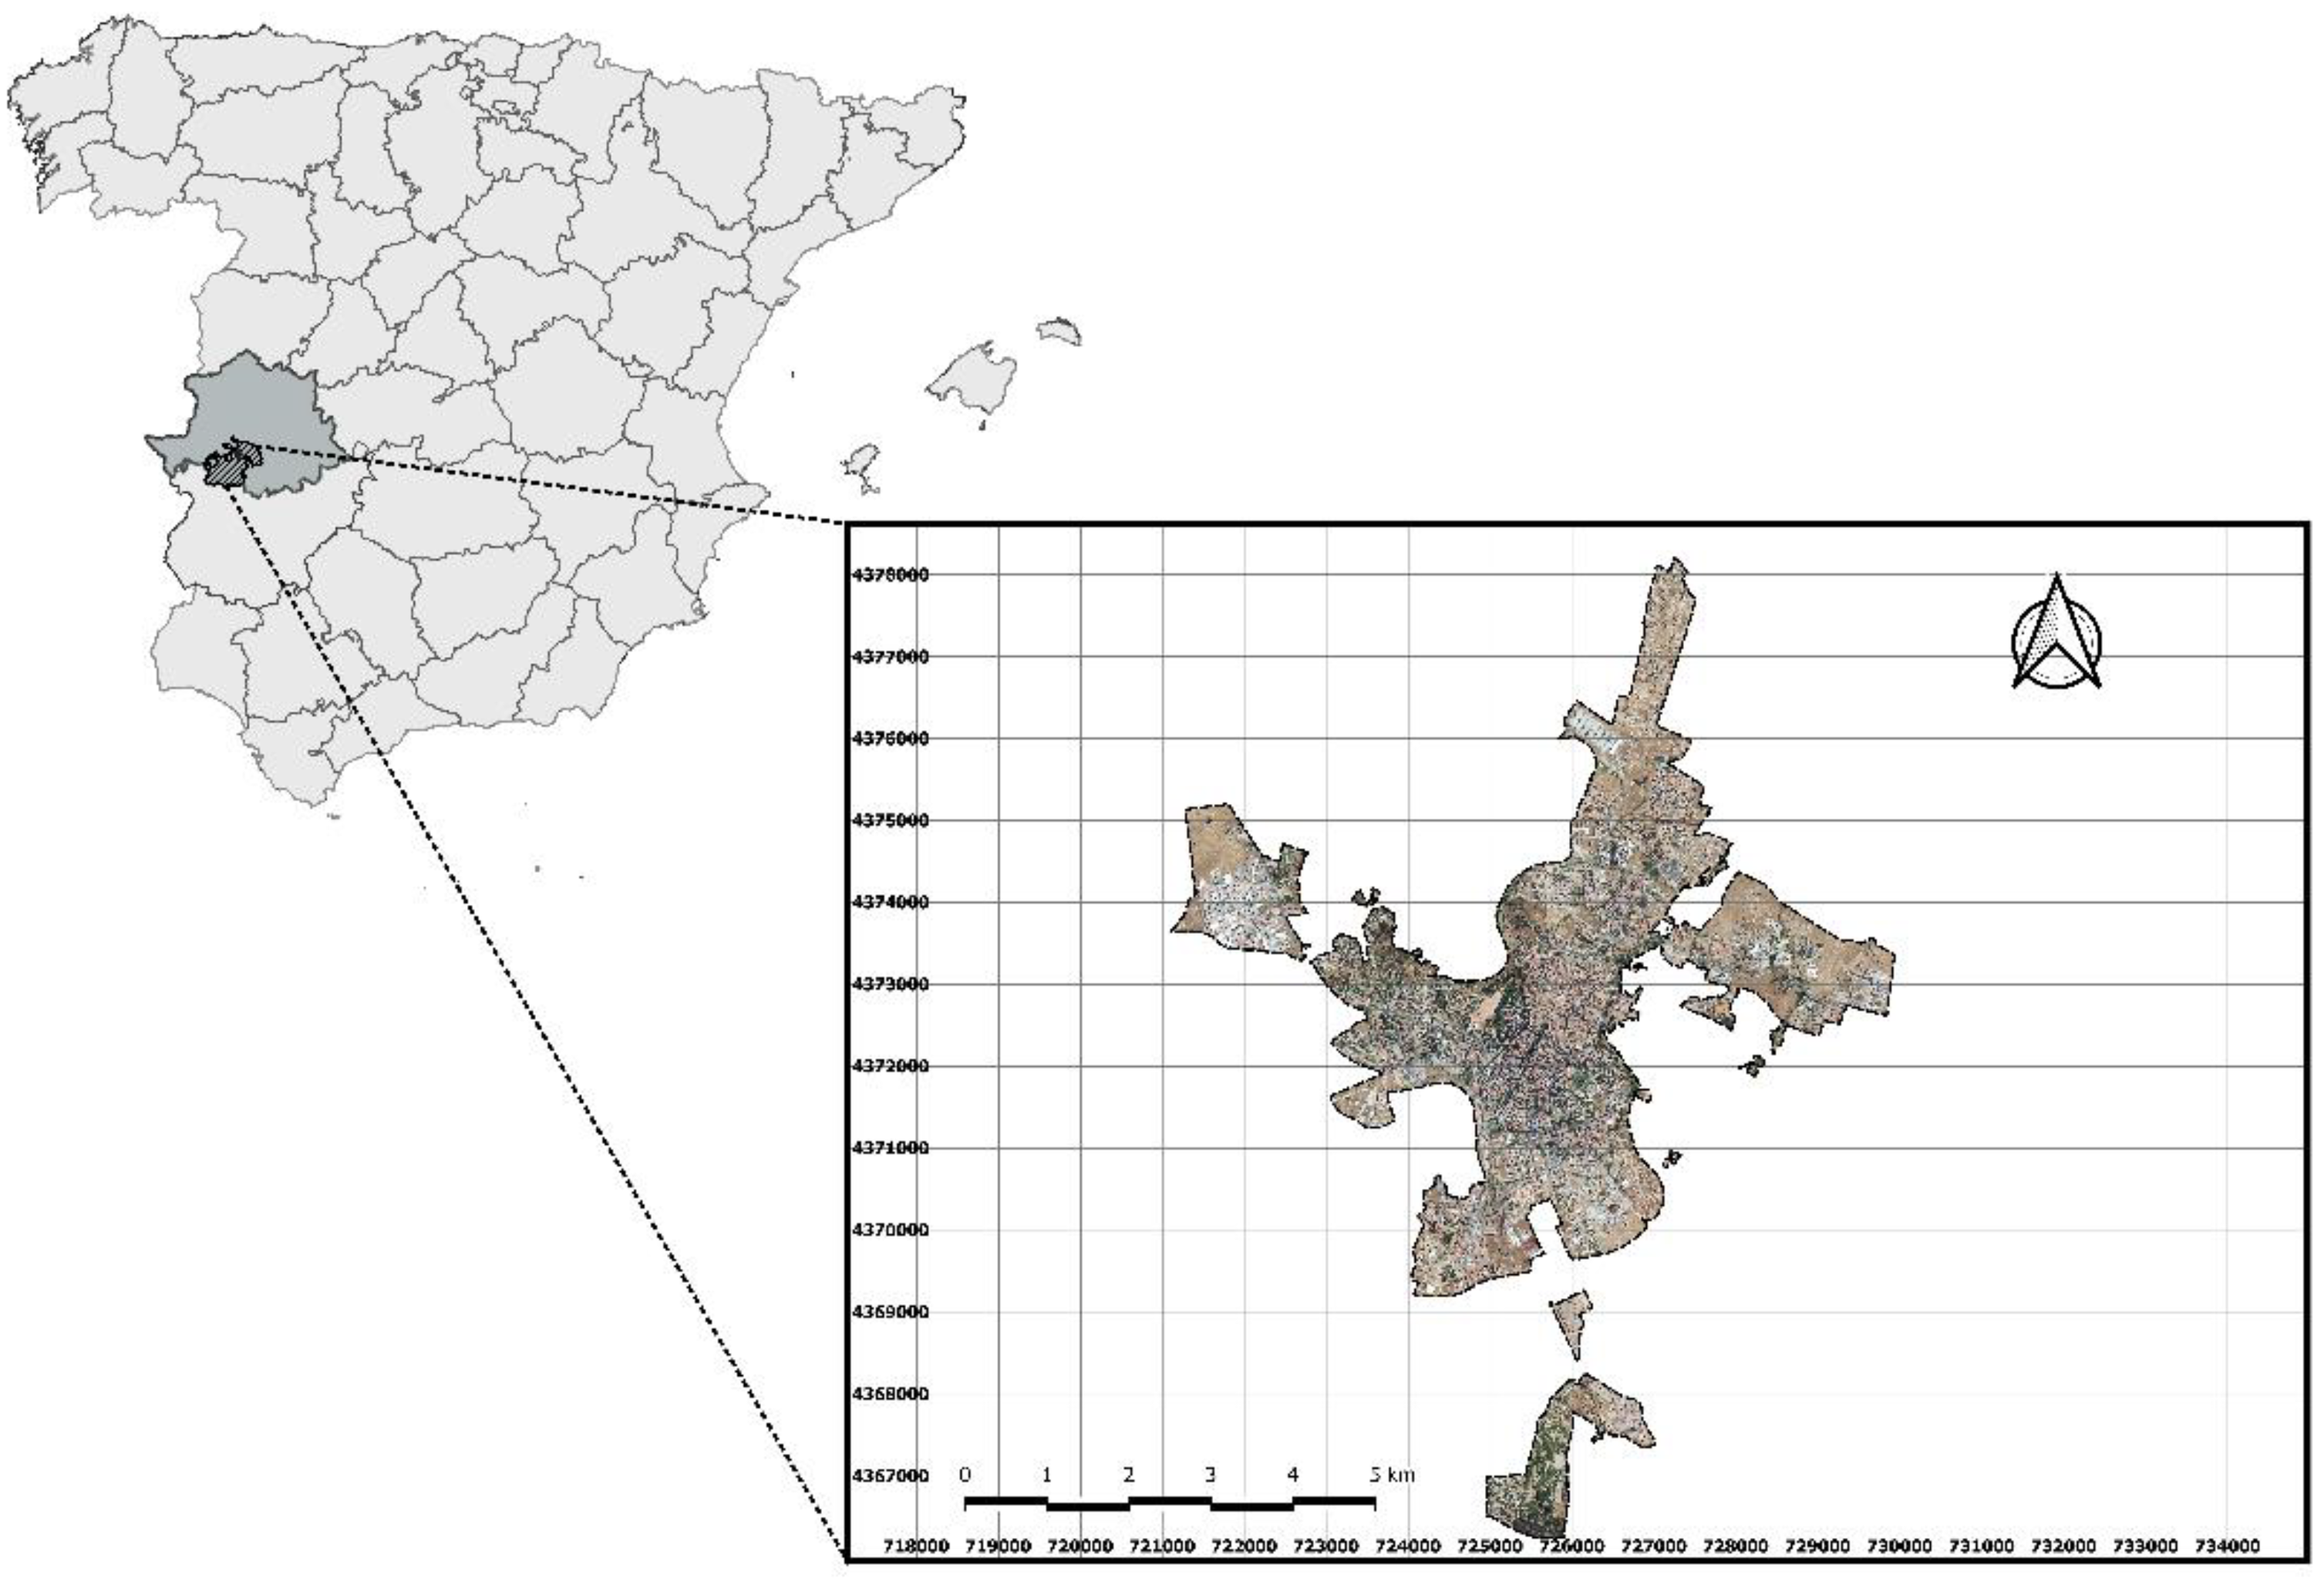
14,
15]. In this sense, the municipality of Cáceres has been chosen because its urban evolution shows very clear and contrasting examples, with a very marked medieval historic center and diffuse urban development towards the periphery.
The urban fabric of a city manifests an essential connection to the quality of its public space, commercial vitality, social dynamism and sense of security. Because of this motivation, the analysis of urban development in cities reflects on the link between dense, compact and diverse spaces and the urban sustainability of population centers [
16]. One of the aspects to be taken into account in determining urban sustainability is the quality of urban spaces as a parameter defining the functioning of a city [
17], as well as the relationships and behaviors of its population. The relationship between density and considerable use of public spaces is considered one of the main challenges to be addressed by Mediterranean society in terms of coexistence on public roads, as determined by several studies [
18,
19]. Medium-sized cities are ranked as the best urban condition in relation to sustainability and play a central role within the territorial structure [
20,
21,
22], having an important potential to establish innovative development dynamics; [
23] identifies various perceptions of the urban fabric of pedestrian centers, in which the economic vitality is related to partnership factors, trade strategies and the structural change of the city [
24].
European cities have shown a similar trend in their urban and socio-economic development, facing vital challenges for the social well-being of their inhabitants [
25]. These cities are suffering from population and economic stagnation, mainly in the west of Spain [
26,
27], and must address problems related to a reduced urban vitality in historic centers, which translates into a reduced productive fabric, relocation of economic activities, fewer social encounters and degradation of urban centers in terms of facilities and uses [
28,
29]. These cities are characterized by a rich cultural heritage, which is a relevant aspect in matters of urban sustainability and generates the need to develop indicators that allow the evaluation of these elements [
30,
31,
32]. This must be linked to the implementation of ICTs as tools that support the sustainable development and urban growth of cities, thus establishing the smart cities model [
33]. Thus, the sustainable development of medium-sized cities must be linked to citizen interaction, thus giving the population sufficient resources to compact the city as much as possible and reduce pollution [
34,
35]. The greater provision of resources and public elements allows citizens to use public transport [
36], and to even make these daily journeys on foot [
37]. Thus, the greater the degree of proximity of a city, the greater its tendency towards sustainable development [
38].With methodologies based on Geographic Information Systems (GIS), several studies have made it possible to assess and quantify the situation of urban spaces. The estimation and representation of these analyses make it possible to quantify the quality of public space at different levels. Some authors have used a grid-based diagnostic system [
39,
40] to determine the distribution of the indicators used. In parallel, other research has used irregular polygons to assess the urban fabric by dividing it into neighborhoods [
15] or through network analysis by means of space syntax, as applied by the authors in [
41] for the urban fabric of the city of Valdivia (Chile). The use of GIS allows the evaluation of sustainability through indicators, in aspects such as the planning and management of green spaces, mobility infrastructures and accessibility to public services [
42,
43,
44,
45].
The research shows a notable concern for public spaces and the revitalization of dense and compact urban fabrics that require evaluation, especially in the typologies of cities described. The characteristics of the city of Cáceres make it relevant to carry out a study using urban sustainability indicators that allow for a deeper analysis and reflection on the city model and make it possible to extrapolate the results to other similar medium-sized European cities.
The main objective of the research is to analyze the degree of sustainability of an average Spanish city declared World Heritage Site by UNESCO (Cáceres), taking into consideration the consolidated urban structure (urban design) and using geographic information system (GIS) tools and urban indicators. The methodology used combines the calculation of sustainability indicators (which allow for an in-depth analysis of the city) with GIS techniques that make it possible to generate useful graphic information. The results of this research could be used by the competent public administrations at local level. It would be of significant interest to be able to extrapolate the results obtained in the research to other World Heritage cities of similar size in terms of number of inhabitants and spatial distribution.
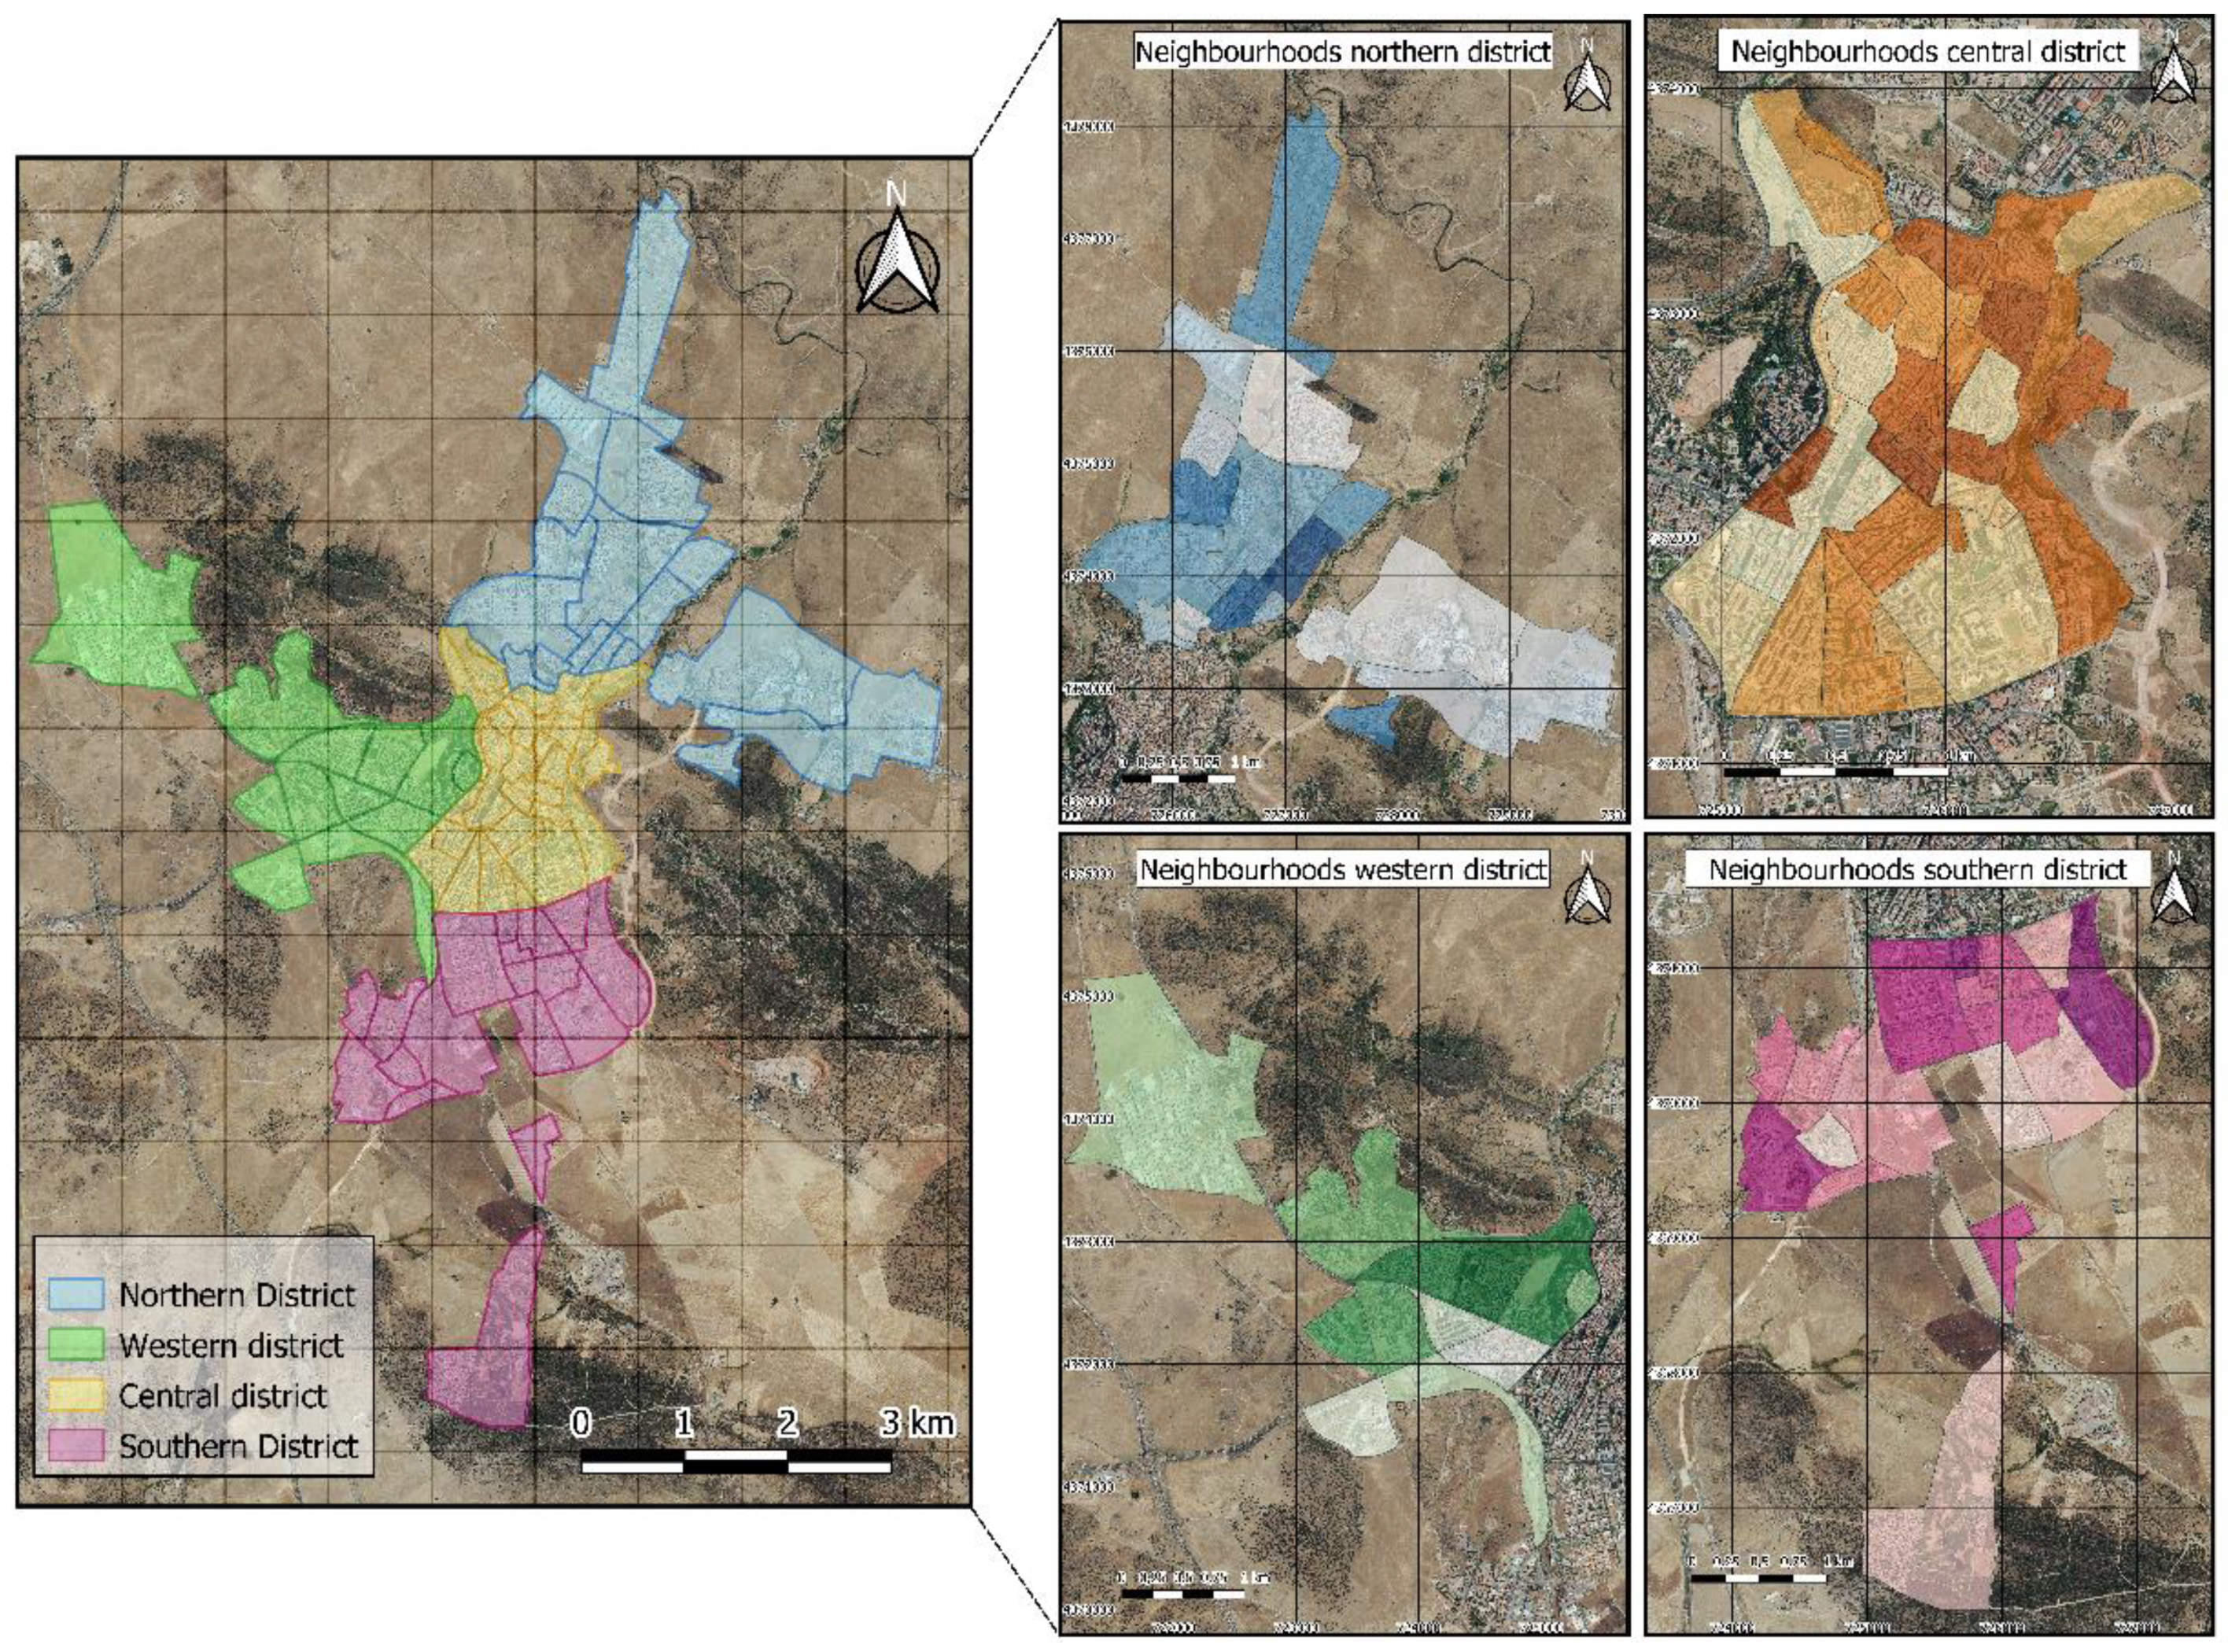
By way of summary, the purpose of this research is based on establishing an analysis of the formal relationship between urban sustainability and spatial morphology in a city chosen as a benchmark, using urban indicators and the application of geographic information system tools. On this specific occasion, we have chosen to develop the analysis using a segmentation at the neighborhood level, reflecting on the viability of planning instruments at the territorial and urban planning level that allow the achievement of an efficient and sustainable urban space.
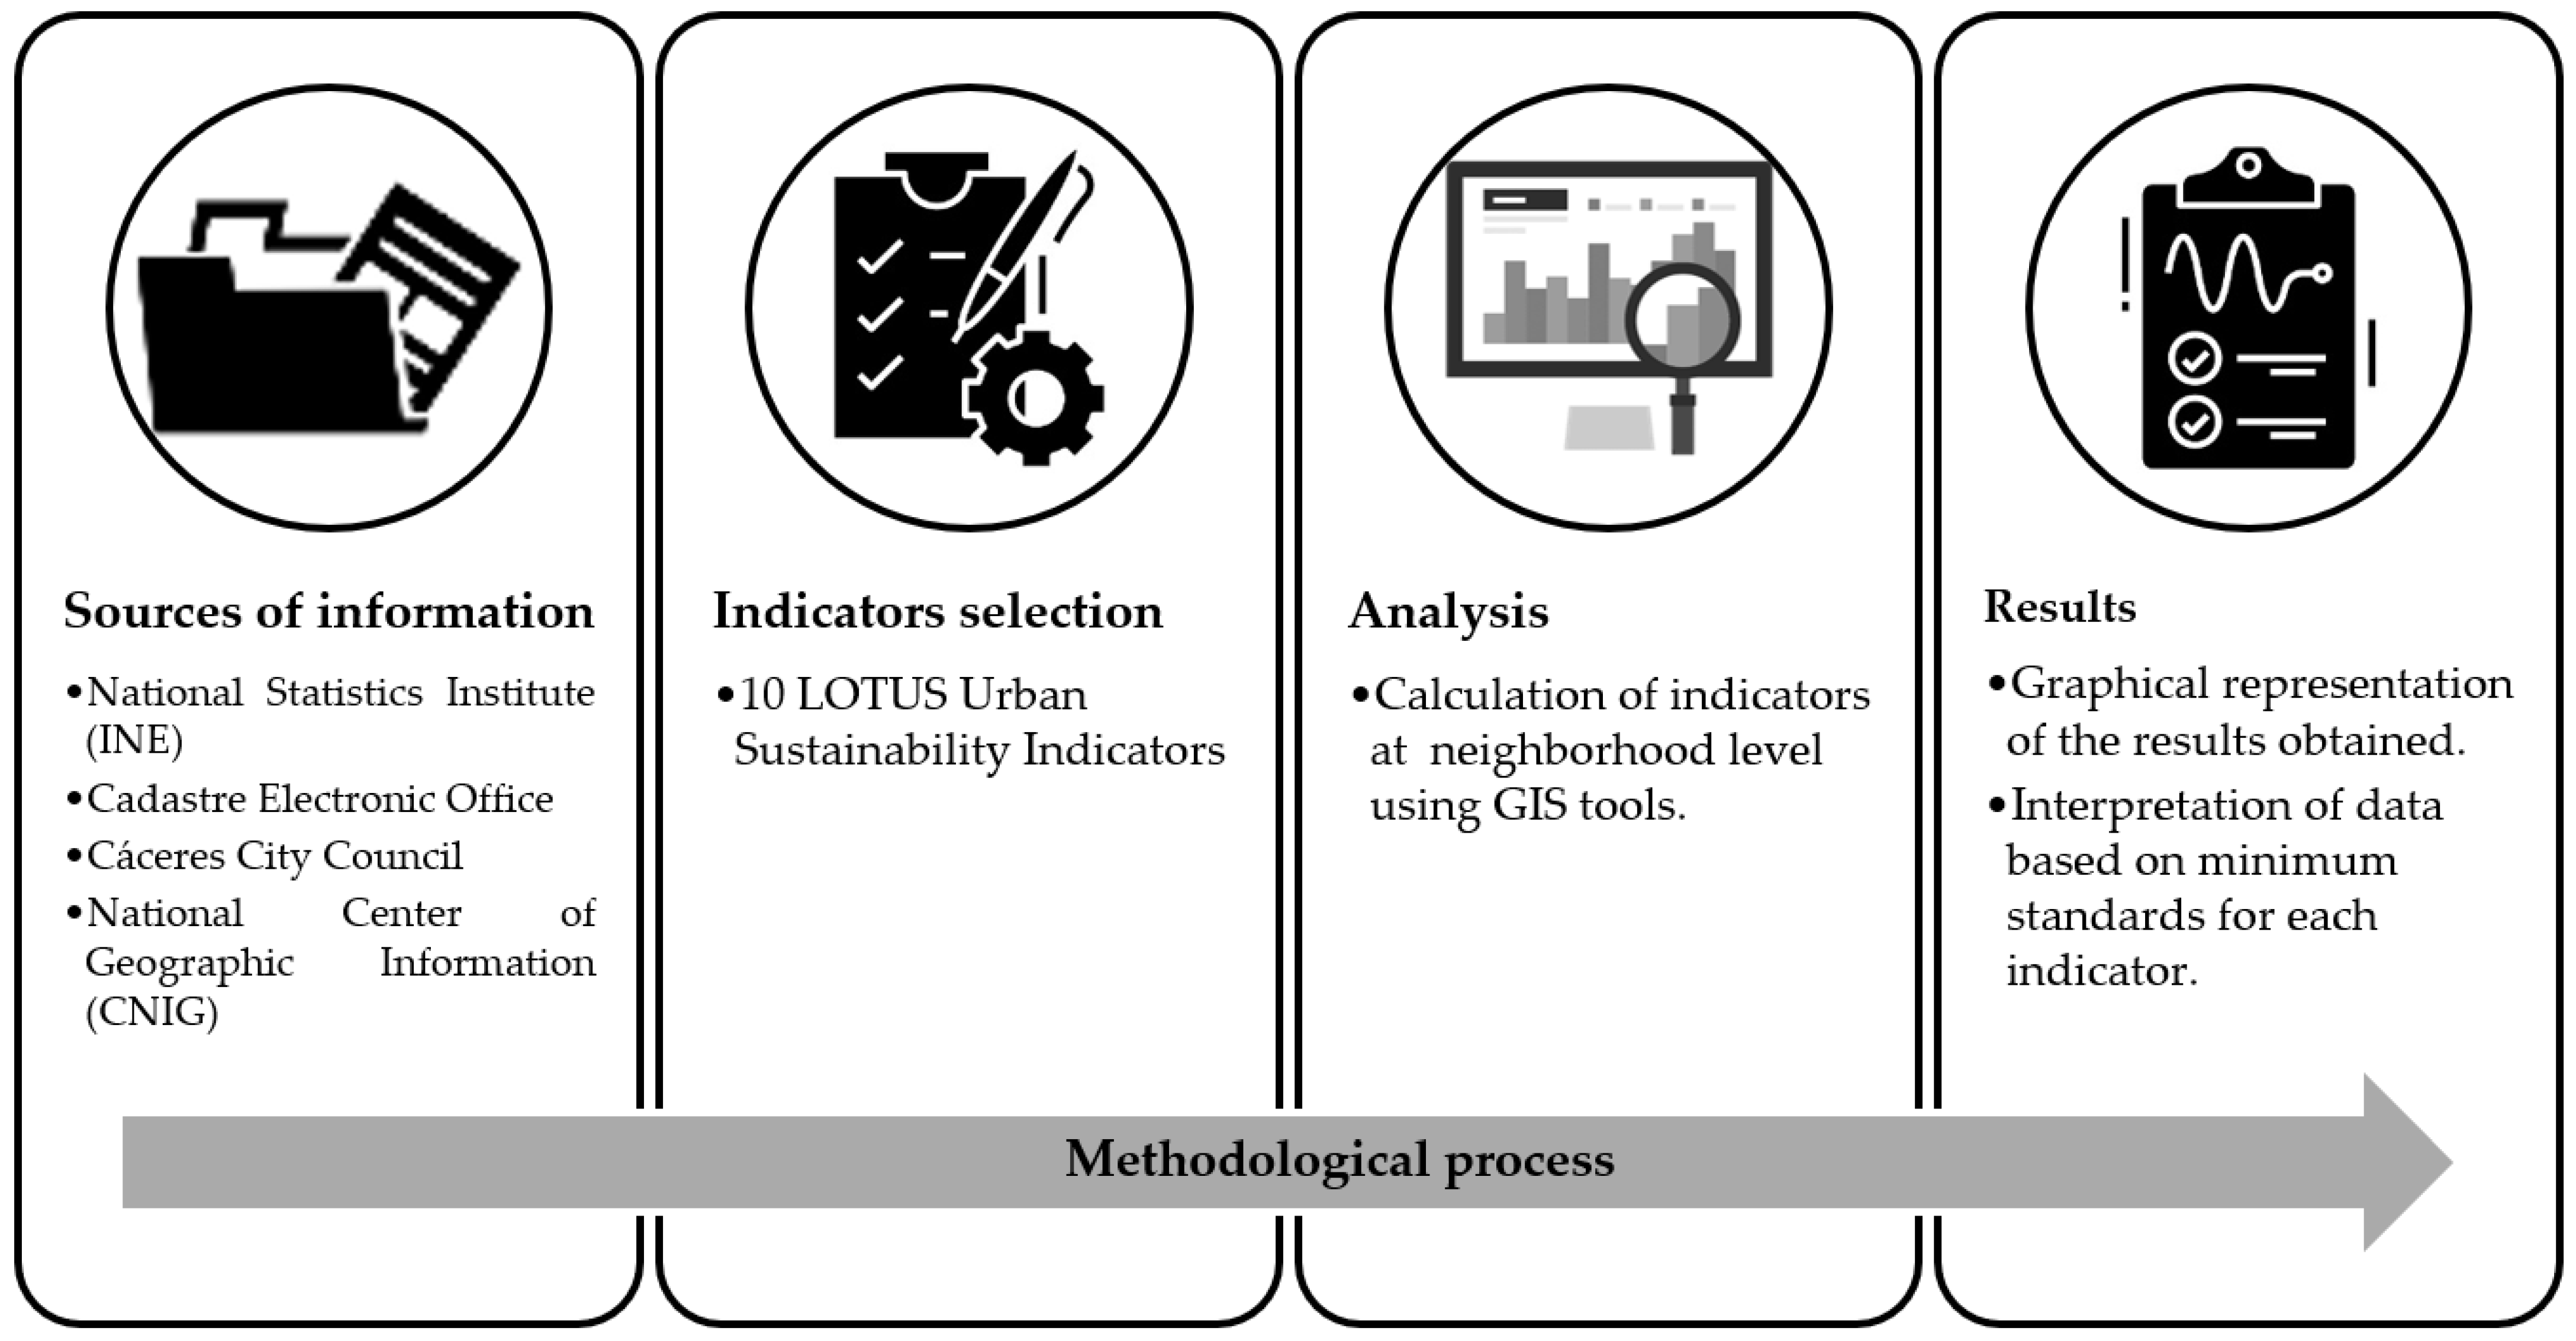
It is noted that one of the main drawbacks in having the possibility of carrying out a similar study lies in the limitation of certain open data at institutional level. There is a knowledge gap regarding the existence of information from open multi-source data sources belonging to public administrations. The key factor is how to develop the transformation of data into parameters that are useful for practical application for citizens in urban settings.
3. Results
The results obtained in the research for each urban sustainability indicator (following the criteria set out in the regional LOTUS legislation) are presented below through spatial representation by means of maps produced with GIS tools. The graphs provided allow a complete visualization of the analyzed indicators at the neighborhood level for each of the four districts within the city.
Based on these results, the degree of adaptation to the desirable sustainability objectives established in the methodology of the article for each indicator is evaluated, with the aim of diagnosing the level of adaptation of the current situation of the municipality with respect to the previously defined minimum standards established by law. In addition, the results are discussed to contextualize the values obtained. Likewise, the geographical representation of the results by neighborhood facilitates interpretation and helps to quickly locate imbalances, providing the municipality with room for maneuver to act on areas with values below the established ones.
3.1. Density
In order to carry out the density analysis, the indicator is subdivided into two different but interrelated parameters. First, the urban population density present in the city of Cáceres is determined in order to identify where there is a greater concentration of population in each neighborhood. Second, it is considered necessary to analyze the density of dwellings (given that there are different aspects that make the individualized study of this parameter necessary).
3.1.1. Urban Population Density
It is proposed that the calculation of this indicator will make it possible to observe the existing differences in terms of inhabitants between the neighborhoods and districts of the city of Cáceres. The concentration of population in different areas of the city depends on the type of building (in those neighborhoods where high-rise buildings predominate, there will be a greater concentration of inhabitants than in areas where single-family housing prevails). In this sense, this indicator can help to locate sectors of the city with a lower population rate due to the typology of the buildings, the remoteness of the main basic services or areas of very recent urban development.
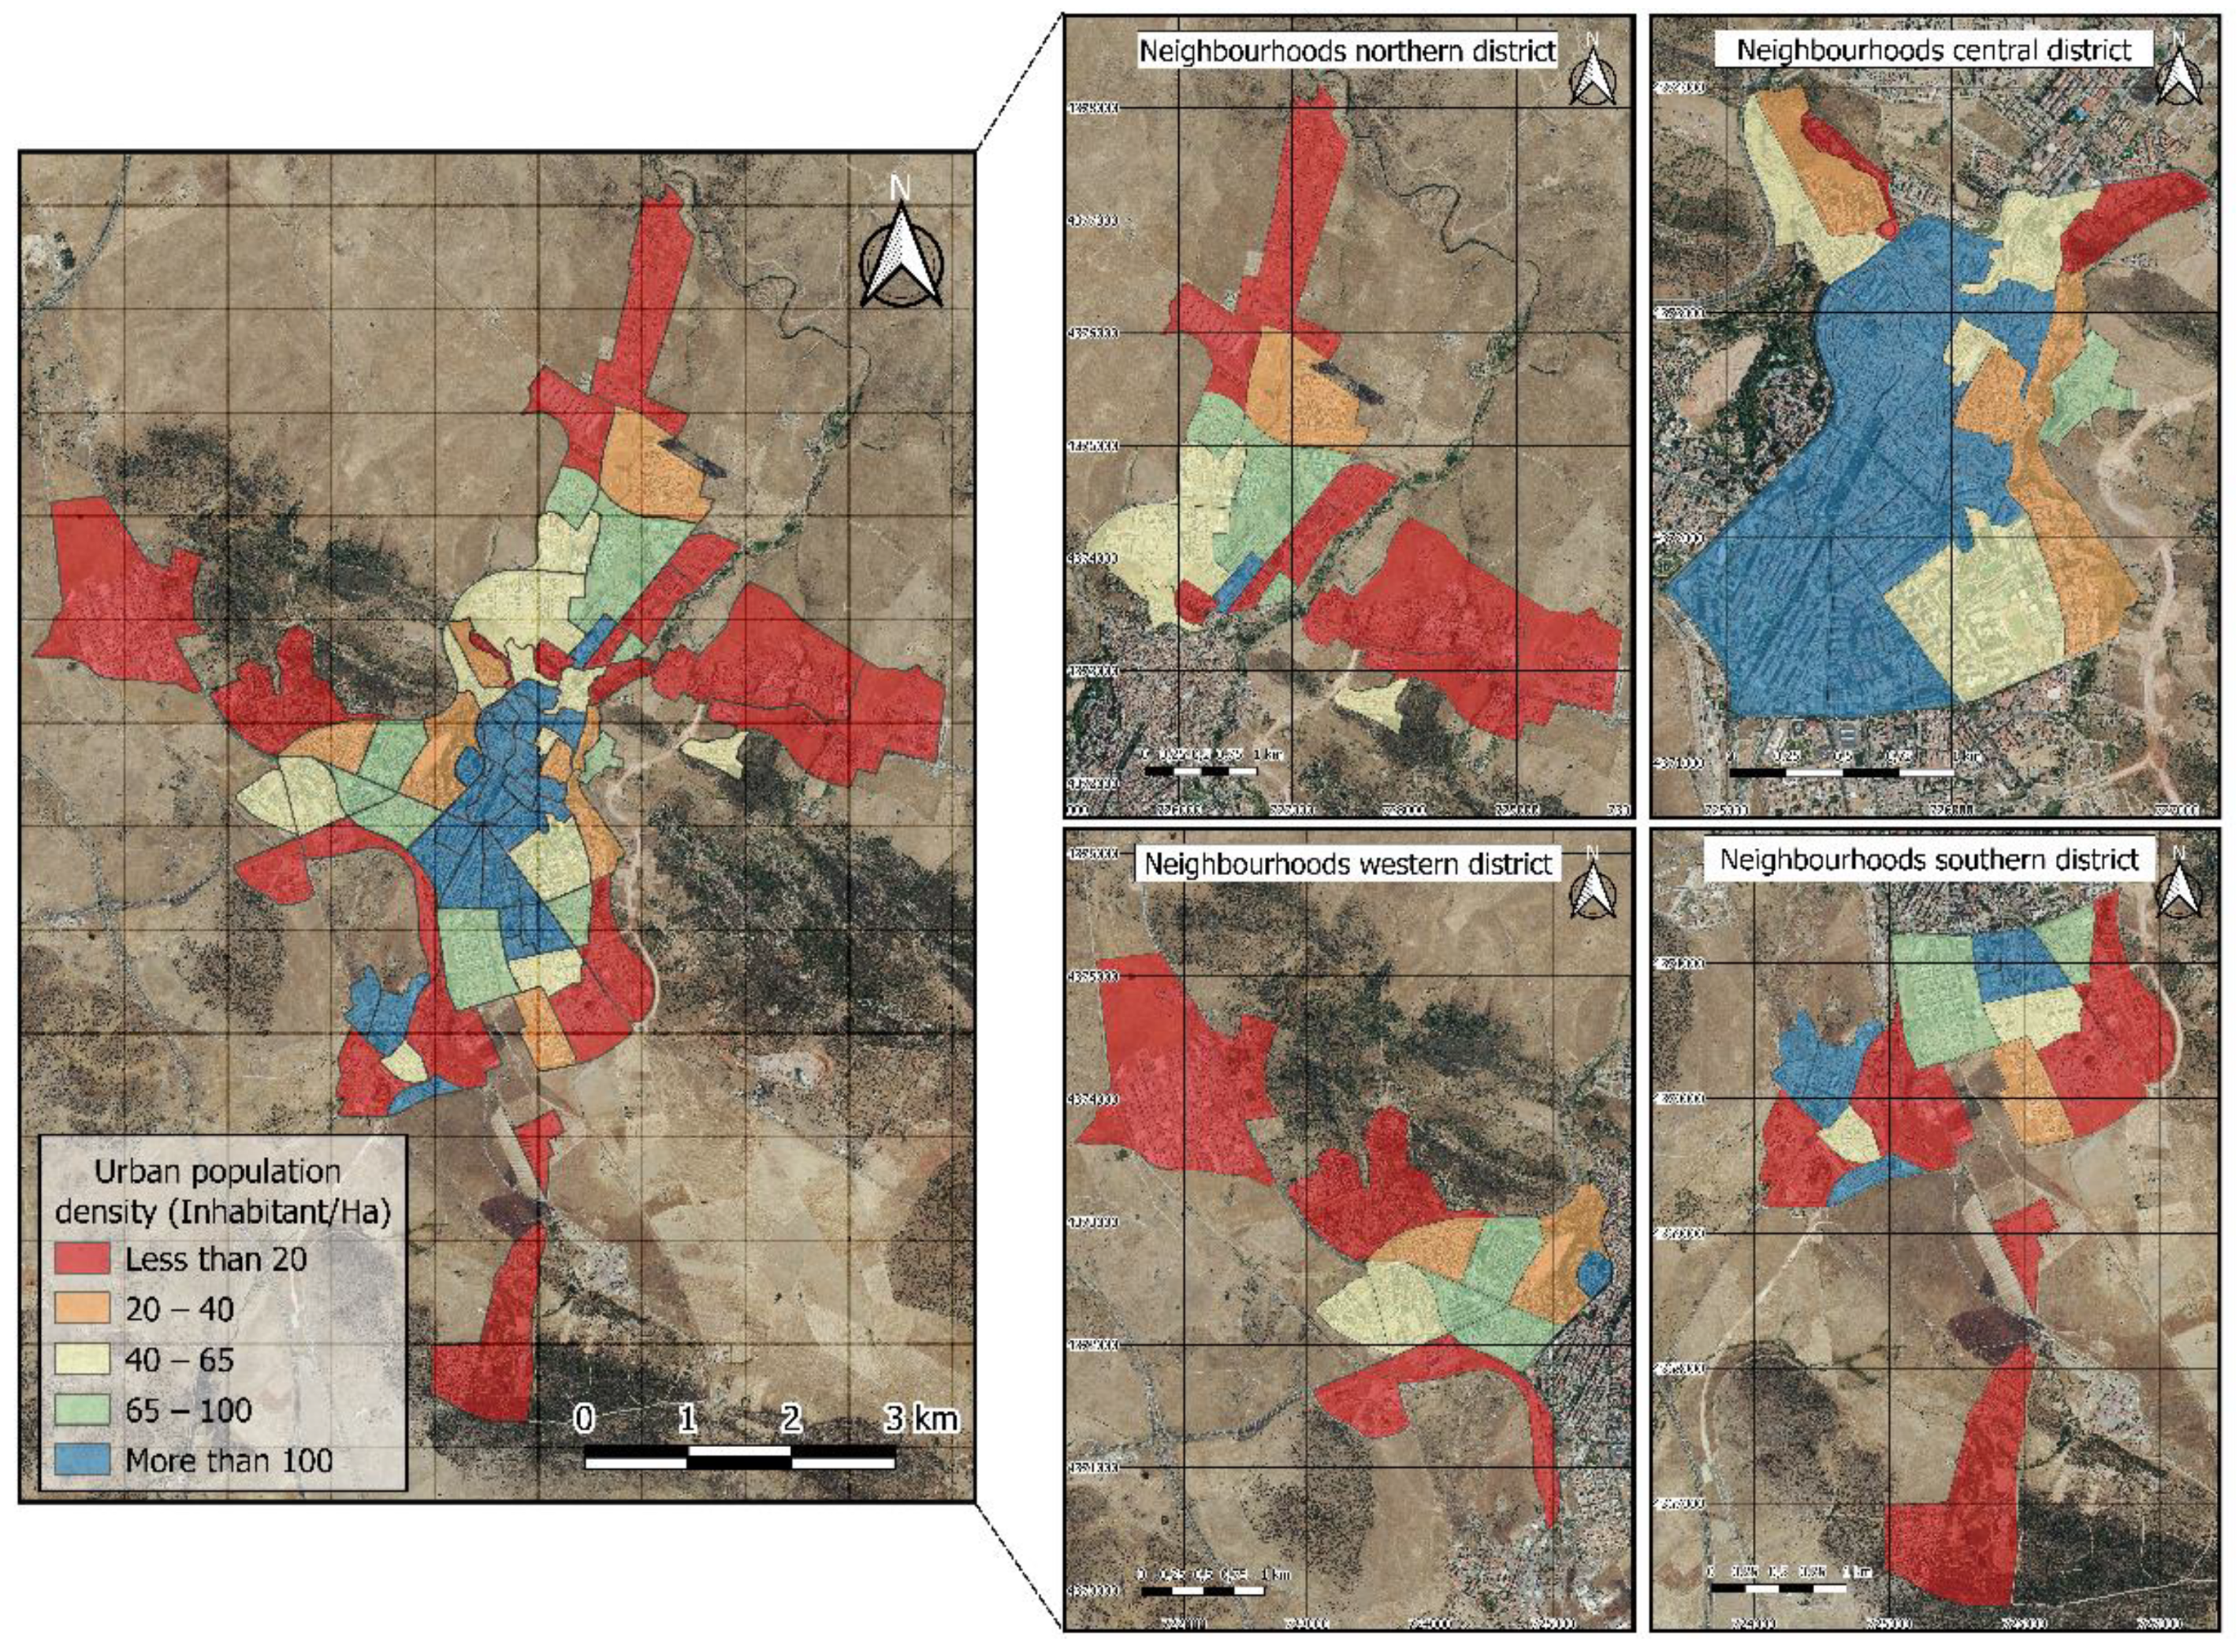
Figure 4 shows the distribution of the population of Cáceres segregated by neighborhoods and it is possible to see the differences existing in each district of the city.
As can be seen in
Figure 4, the distribution of the population in the city of Cáceres is very uneven. It is worth noting that the neighborhoods located on the fringes of the city center have a lower population density than those in the central areas of the city. The neighborhoods located in the central district show a higher concentration of population (most of the neighborhoods have a population density of more than 100 inhabitants/ha). In the north, west and south districts there is a greater number of neighborhoods with a density of less than 40 inhabitants/ha; these values are represented in red and orange. In the peripheral areas of the city (where there is a predominance of single-family houses), most of the values are lower than 40 inhabitants/ha. In the central areas of the city of Cáceres, there is a predominance of neighborhoods with an urban population density of over 65 inhabitants/ha.
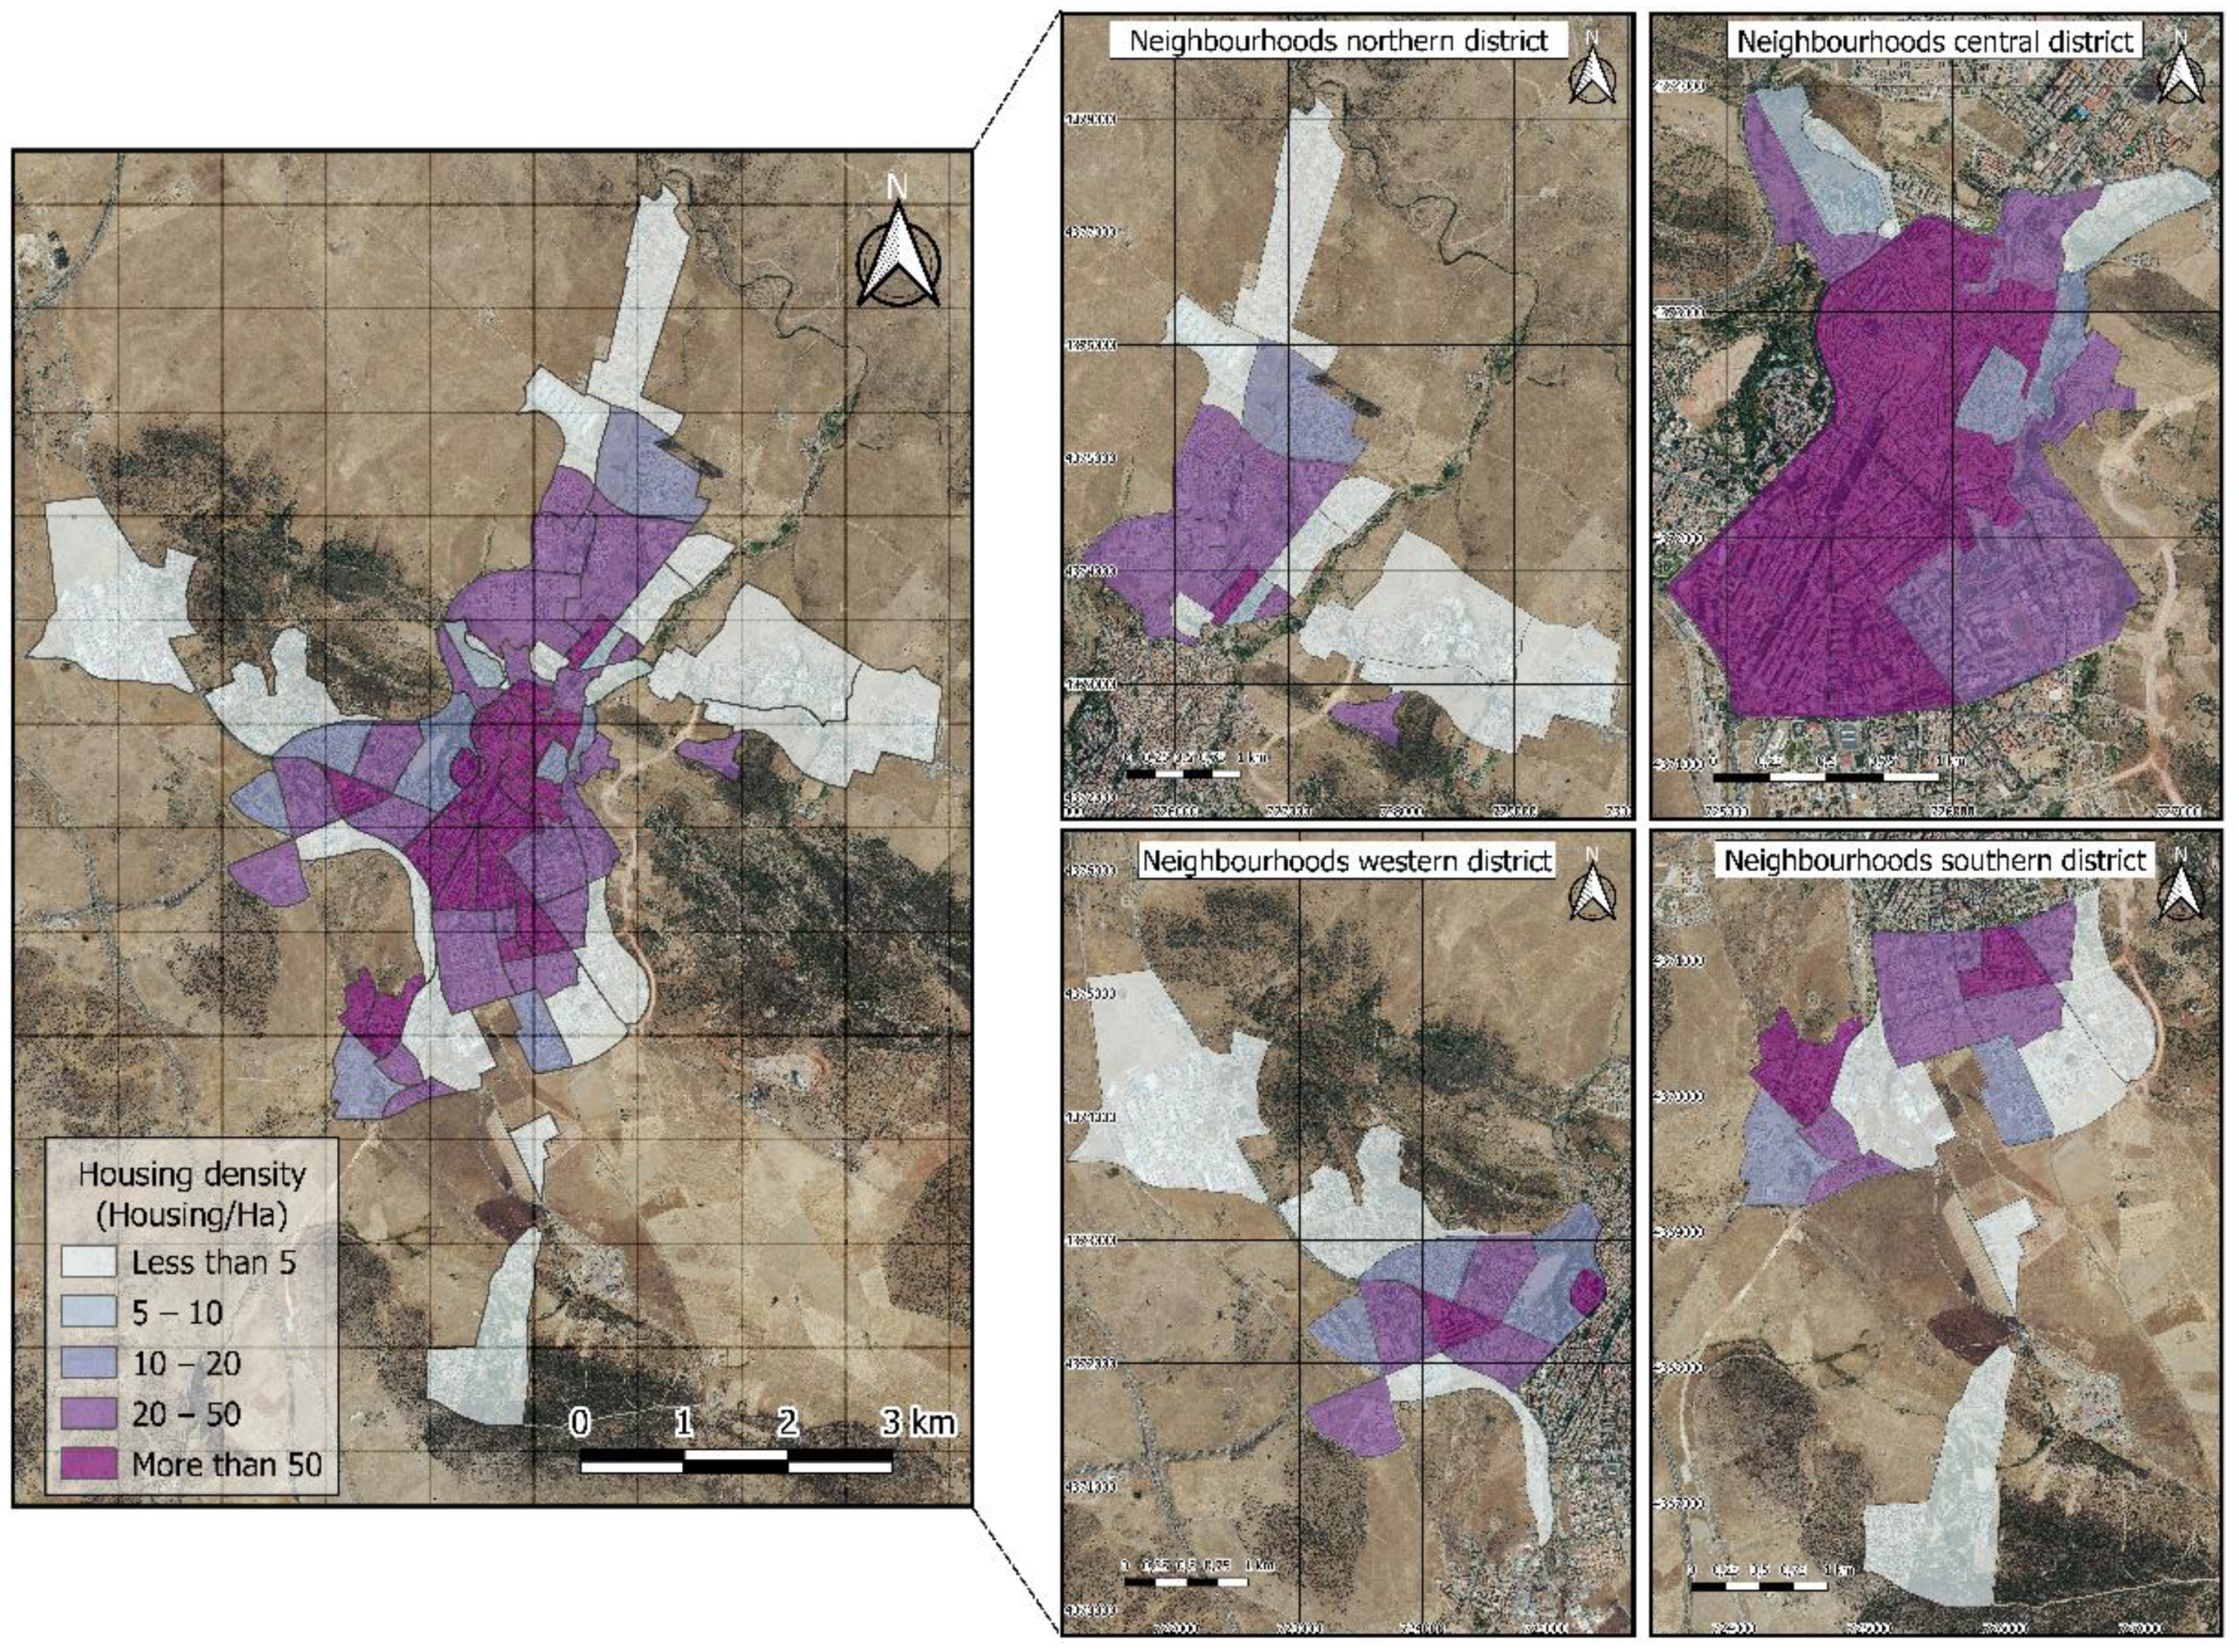
3.1.2. Housing Density
When analyzing the urban sustainability of a city, the concentration of population and buildings in specific areas must be considered, with the aim of having an urban fabric with adequate pressure to guarantee a better quality of life for citizens. A balance must prevail in the number of dwellings distributed throughout the urban nucleus to make it possible to achieve a desirable scenario of greater sustainability, without very disparate or extreme values. In this way, the existence of neighborhoods in the city of Cáceres with a higher concentration of housing would result in lower consumption of land and resources than those where the housing typology is characterized by being dispersed, which would result in not providing sufficient tension for the normal development of urban functions.
Figure 5 shows the distribution of housing density in the city of Cáceres.
In line with the previous values obtained for urban population density in Cáceres, the density of dwellings shows a similar structure, where the highest concentration of dwellings is in the neighborhoods located in the city center and in those with predominantly multi-story buildings. The results show that the peripheral neighborhoods have a higher number of single-family dwellings, with a density of less than 5 dwellings/ha. Consequently, the neighborhoods in the northern, western and southern districts have lower housing density values than the central district. This may also be since they are larger than the neighborhoods located in the city center, together with the fact that these are areas where new urban developments are taking place.
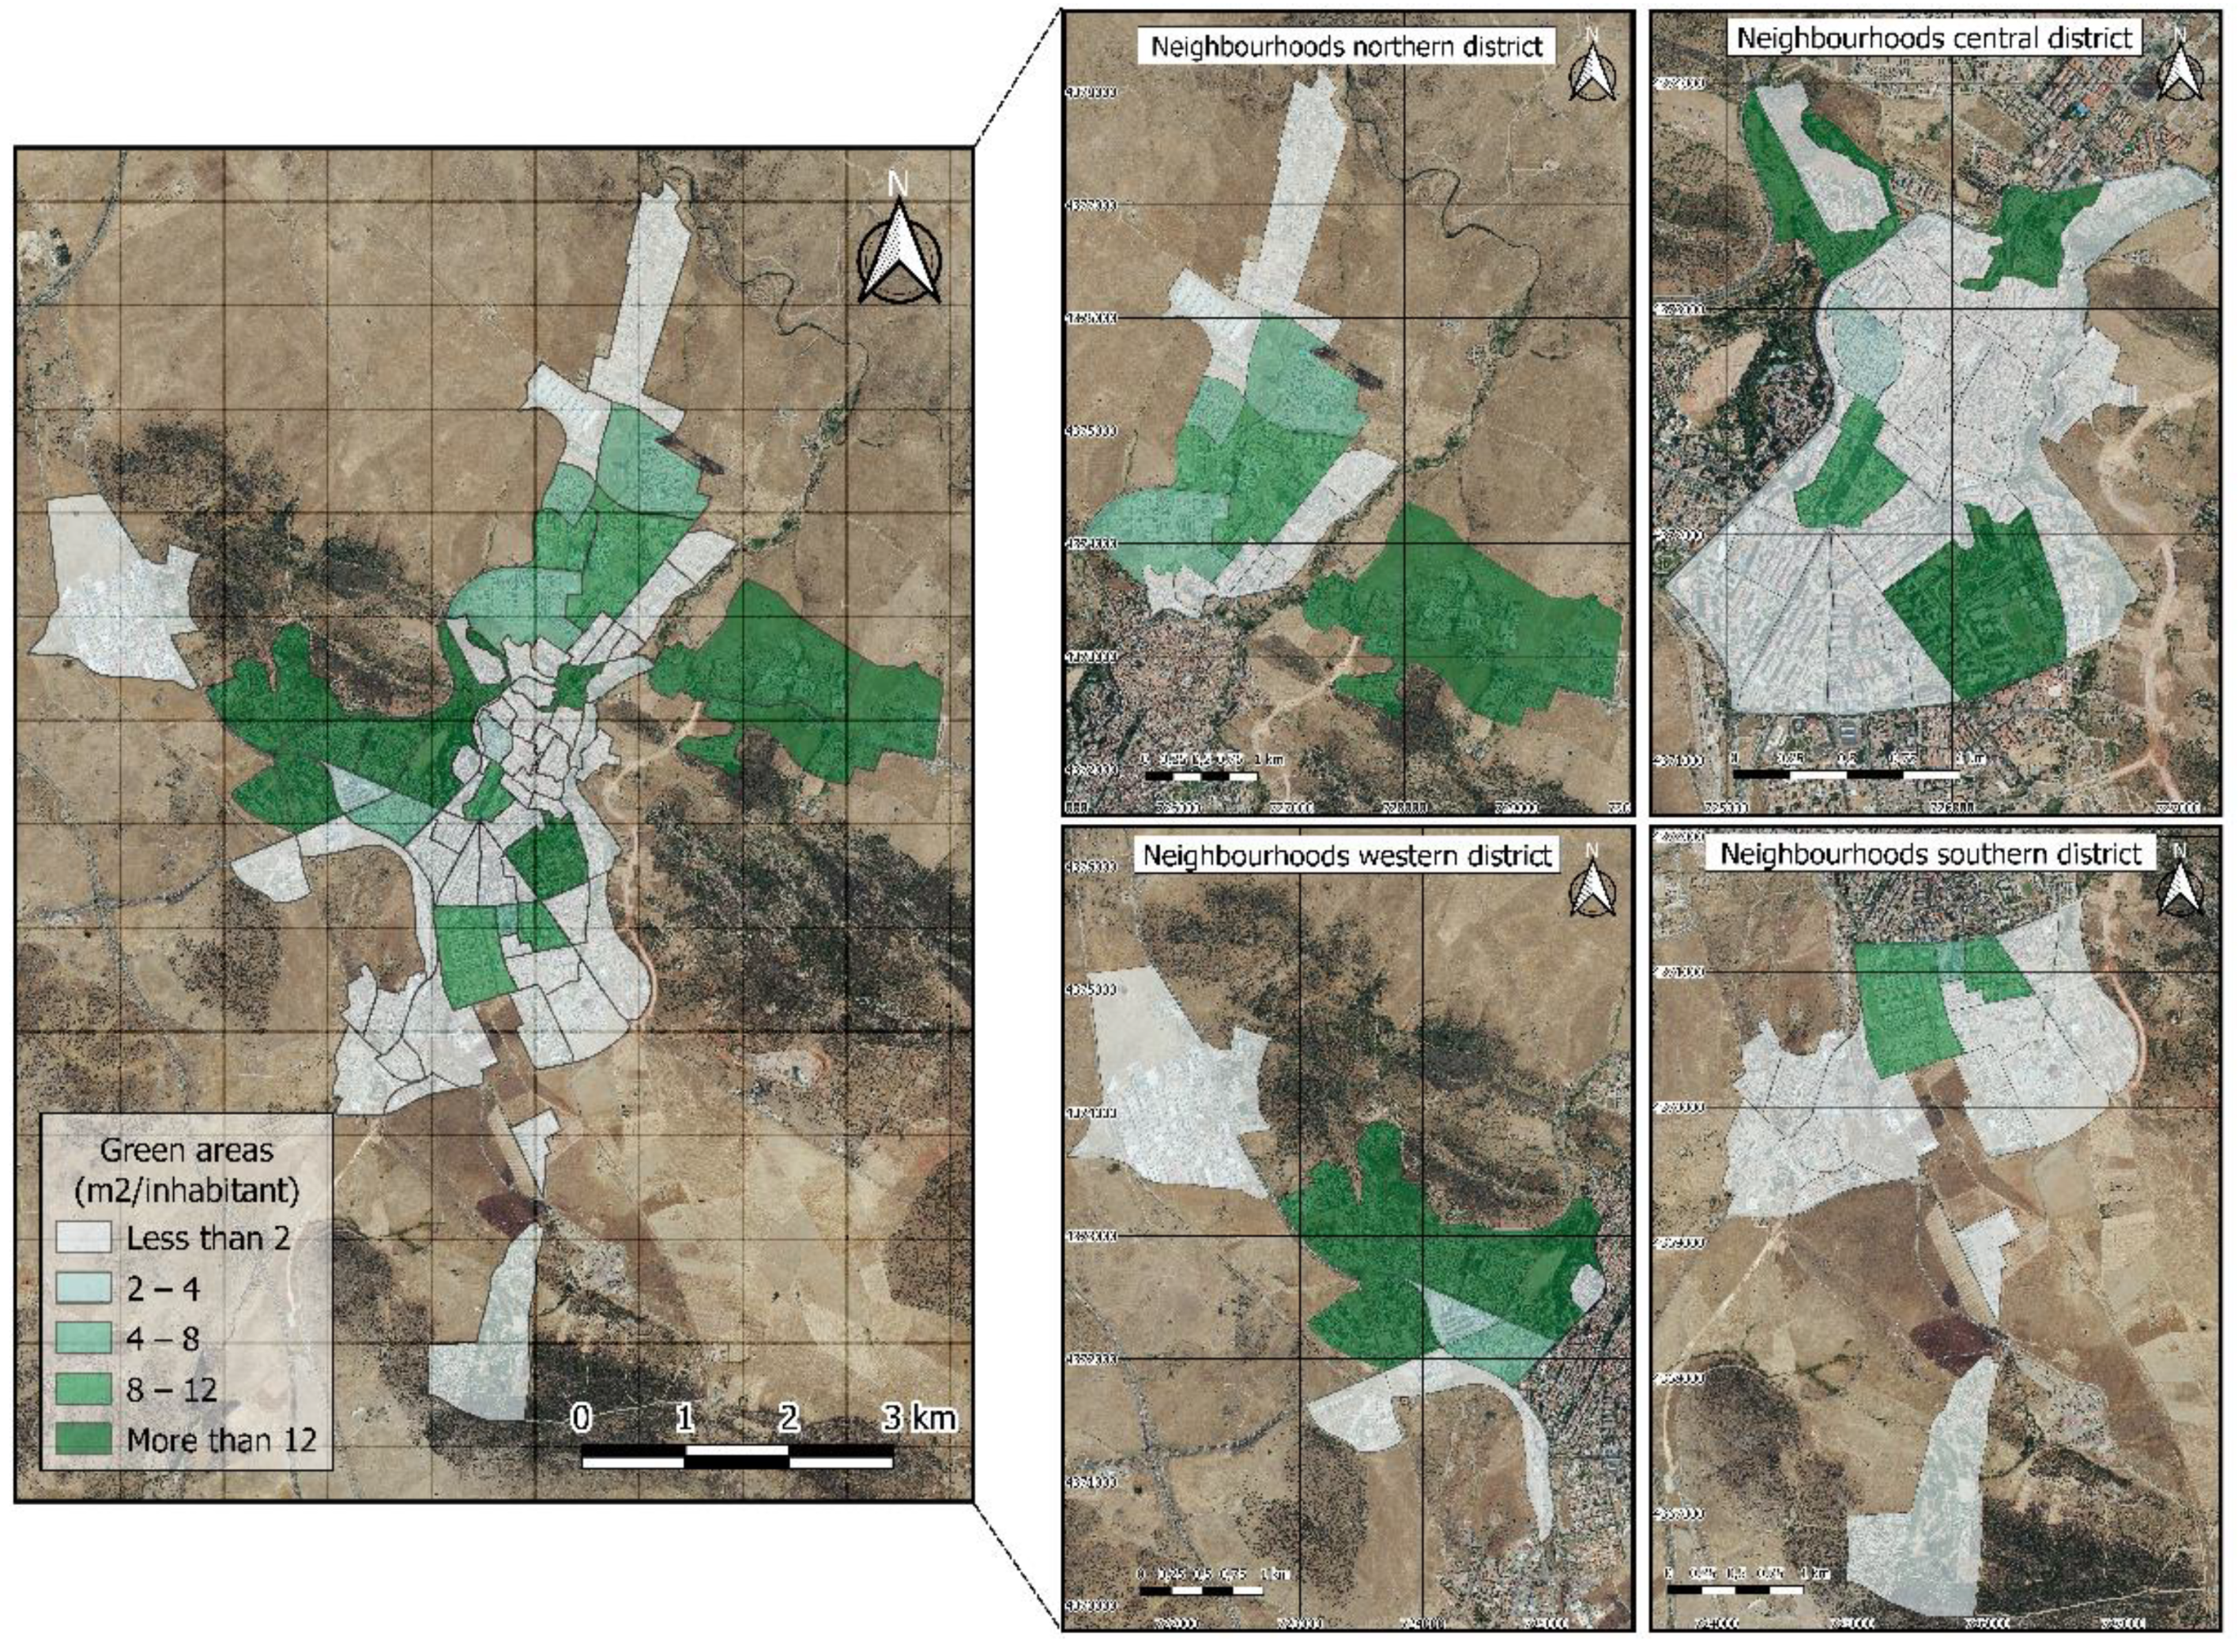
3.2. Green Areas
Green spaces play a fundamental role in the concept of urban sustainability, as they foster social cohesion and improve the quality of life of their inhabitants (measured in terms of health and well-being). Public trees help to reduce air pollution levels, reduce the harmful consequences of the greenhouse effect, mitigate the externalities produced by traffic noise and enhance the livability of public spaces.
A municipality with a balanced provision of green spaces transforms the public space into a visually pleasing place, which is an essential element for the health of the city. Knowing the distribution of green spaces in a city at the neighborhood level is an essential task, as it can offer a whole range of specific circumstances according to each specific situation and can show considerable disparities. It may turn out that some areas are hardly representative due to their distribution and nature, but neighborhoods with a significant amount of green space will contribute to climate change mitigation and increase life expectancy, as well as providing opportunities for physical activity and social interaction.
Sometimes green spaces are not located close enough to homes, so that the intended health benefits are not realized. The uneven distribution of green space in a city is a phenomenon that places a significant proportion of citizens at a disadvantage, depending on the neighborhood in which they live. Typically, poorer neighborhoods tend to have less green space and therefore do not benefit from its advantages.
Figure 6 shows the distribution in m
2 of green areas depending on the neighborhoods under analysis in the city of Cáceres.
The green space sustainability indicator is evaluated through the m
2/inhabitant ratio for each of the different neighborhoods that make up the physiognomy of the city.
Figure 6 shows that the neighborhoods with the highest number of m
2 of green spaces (more than 12 m
2/inhabitant) are mainly located in the western district (around the Príncipe Park), an area that stands out for its large surface area of green spaces in relation to its lower population density. There are also neighborhoods in the central district located next to the Parque del Rodeo (El Rodeo neighborhood), Paseo Alto (Paseo Alto neighborhood) and Parque Valhondo (San Blas neighborhood). In the case of the northern district, the neighborhoods comprising the University Campus and El Cuartillo are those with the largest surface area of green areas per inhabitant. In general, it can be observed that a large part of the neighborhoods of the city of Cáceres have a scarce surface area of green areas per inhabitant (less than 2 m
2/inhabitant). However, there are neighborhoods located in the north and south districts where green spaces are between 4 and 8 m
2 per inhabitant.
This fact contrasts with the data offered by the Sustainability Observatory in its 2018 report [
52], which argues that the city of Cáceres has almost two million m
2 of green areas, which has placed it among the top five Spanish cities in environmental matters. However, despite having an excellent ratio of tree mass per inhabitant, in terms of accessibility to green areas, the results do not show that there is adequate proximity to such a formidable natural heritage [
42].
In view of the previous results, it is considered crucial that green spaces are accessible and close to people’s homes. In this sense, cities should focus on increasing urban green infrastructures (parks and gardens, tree-lined streets and squares, green roofs and facades, playgrounds, etc.).
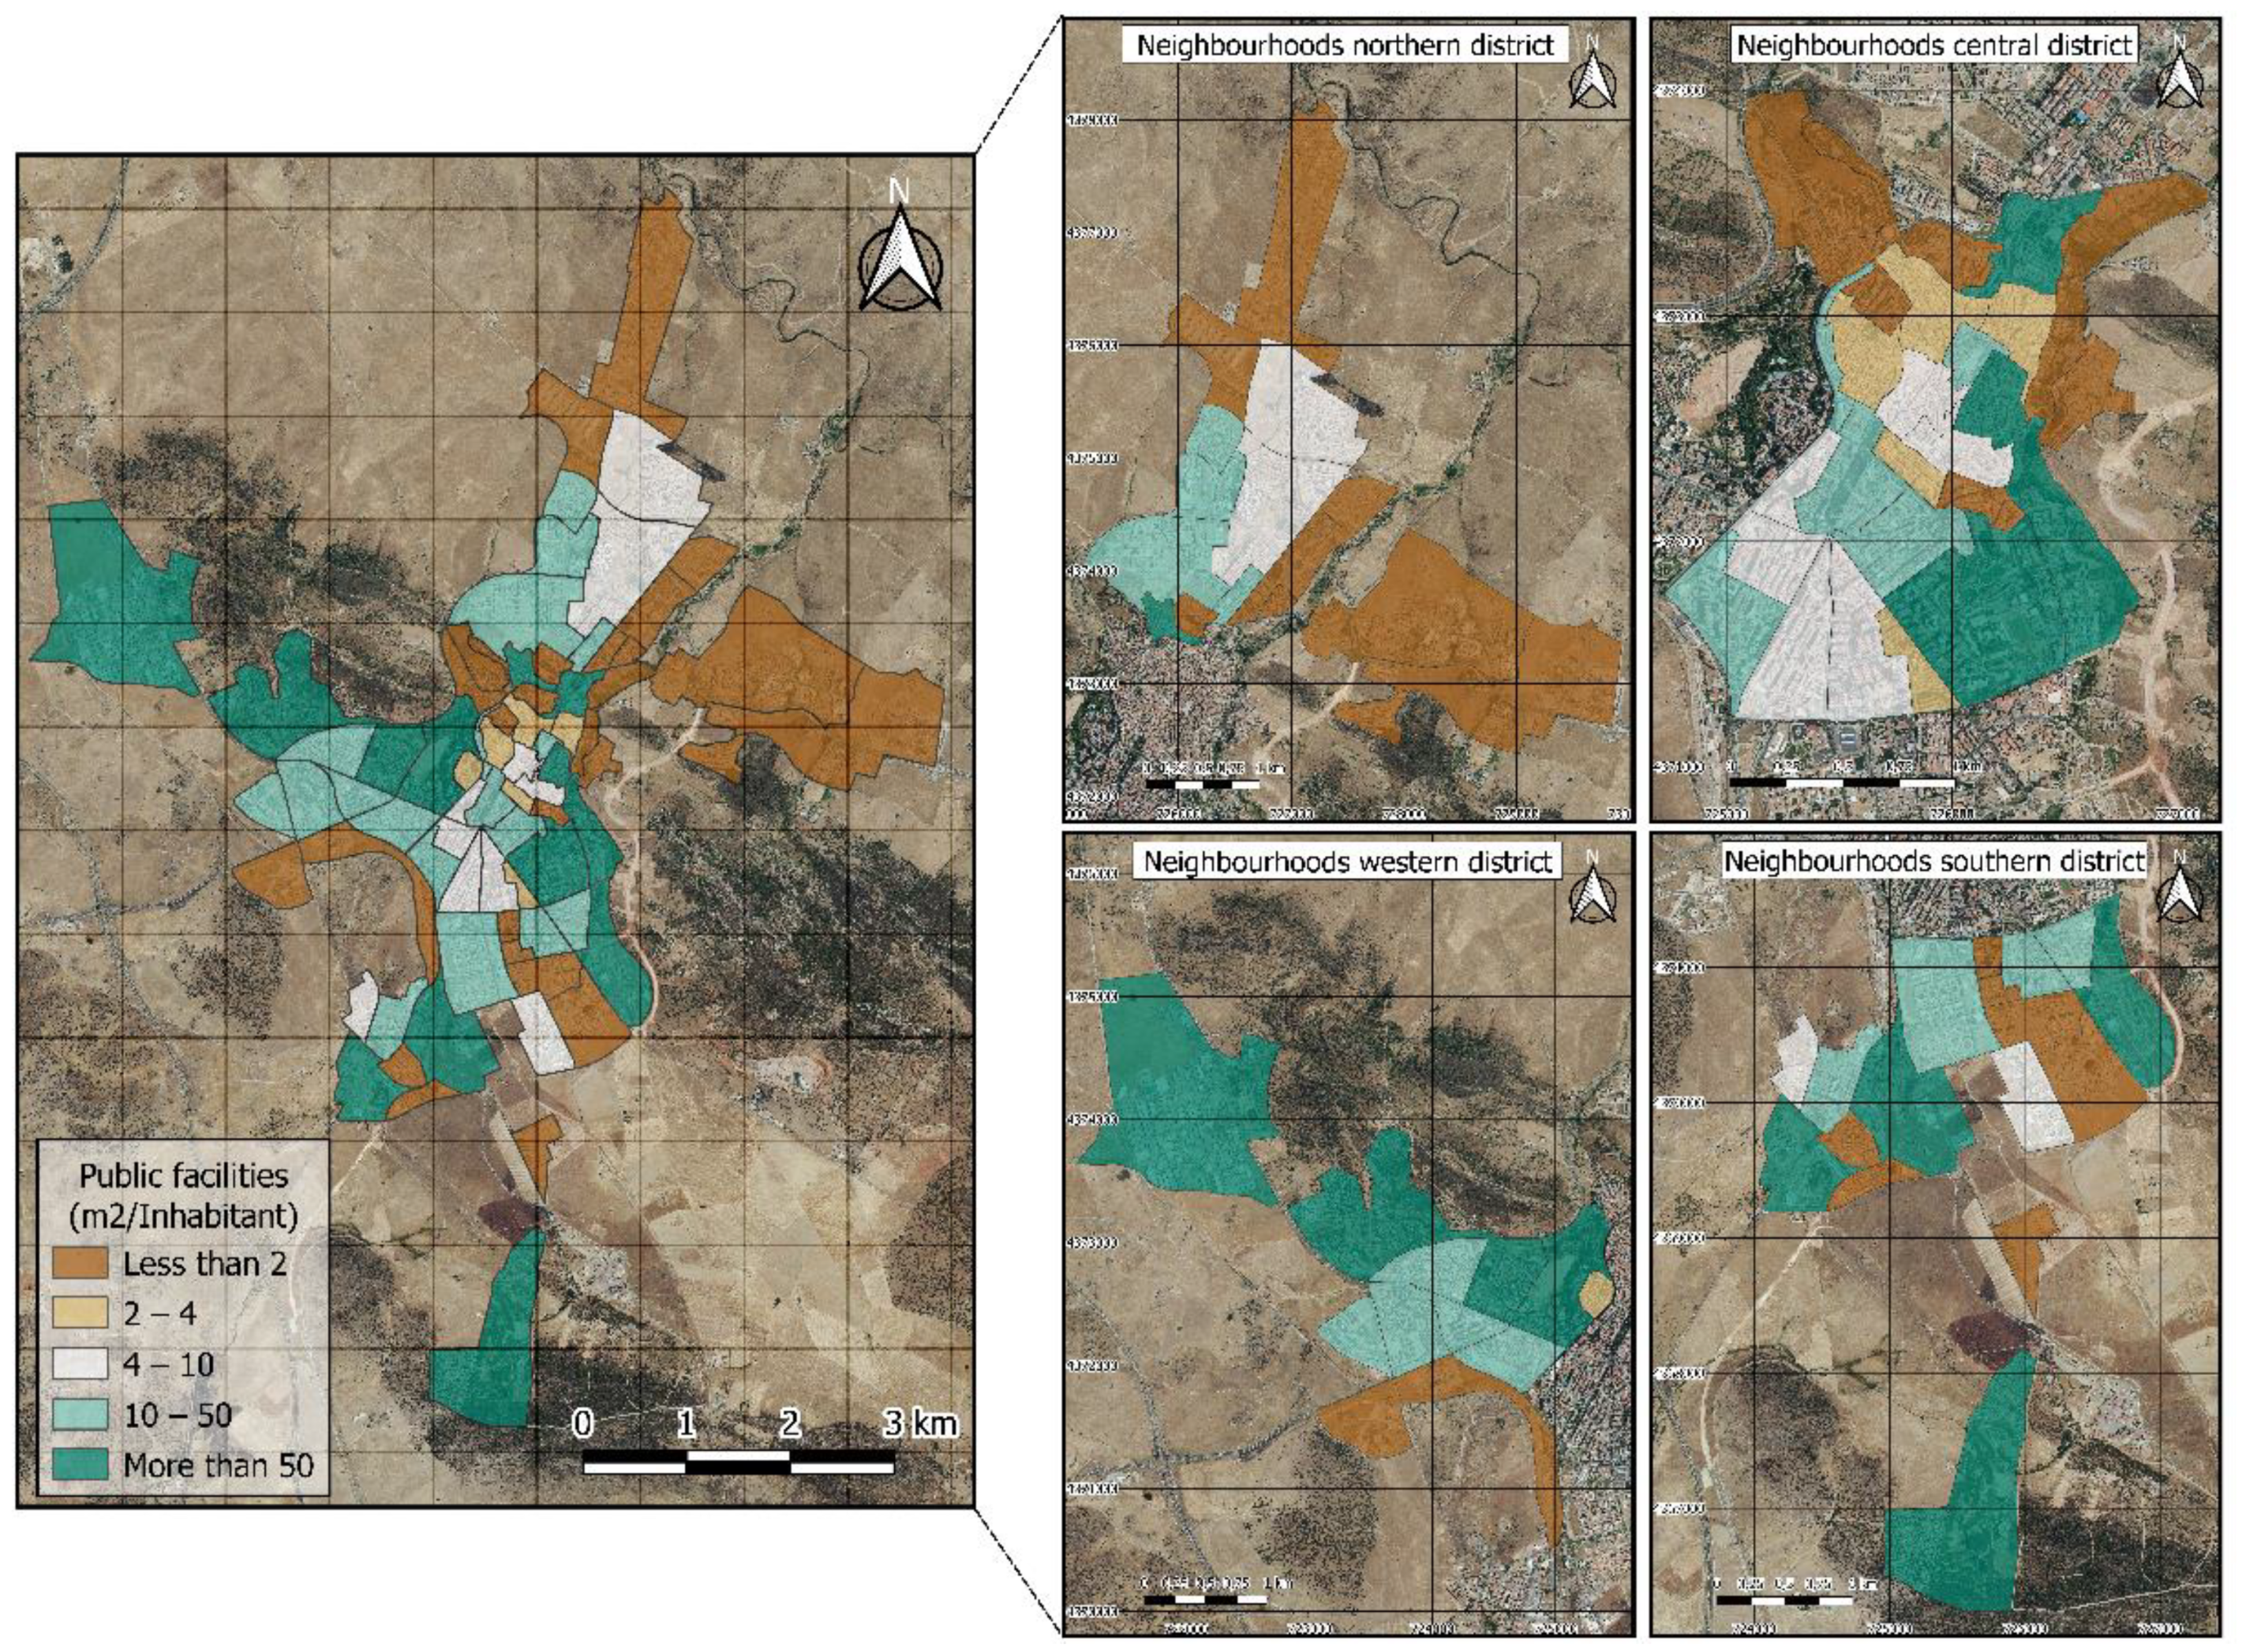
3.3. Public Facilities
The provision of public facilities is traditionally related to a greater state of wellbeing of the population, at the same time as it guarantees the coverage of services of vital interest to citizens: health, education, mobility infrastructures, supply, etc. This fact motivates the need for adequate planning at the neighborhood level in a city. A correct distribution of services and facilities at the urban level must be established as a strategic line for the present and future development of the city, given that sustainability at the local level is clearly influenced by this factor. The distribution of public facilities in the city of Cáceres is shown in
Figure 7.
The distribution of public facilities in the city center shows very heterogeneous values. The neighborhoods with the highest number of m2 per inhabitant are randomly distributed throughout the four districts that make up the population.
The western, central and southern districts are particularly noteworthy, as they have the largest number of neighborhoods with a public facilities area of more than 50 m2/inhabitant. The neighborhoods with values of less than 2 m2/inhabitant are mainly located in the north district, although there are also some neighborhoods in the center district and, to a lesser extent, in the south and west districts.
It is appreciated that work must be executed on a balanced and accessible distribution of basic services that allows the population to identify with their immediate urban space, increasing social cohesion and the interrelationship between the city and its inhabitants.
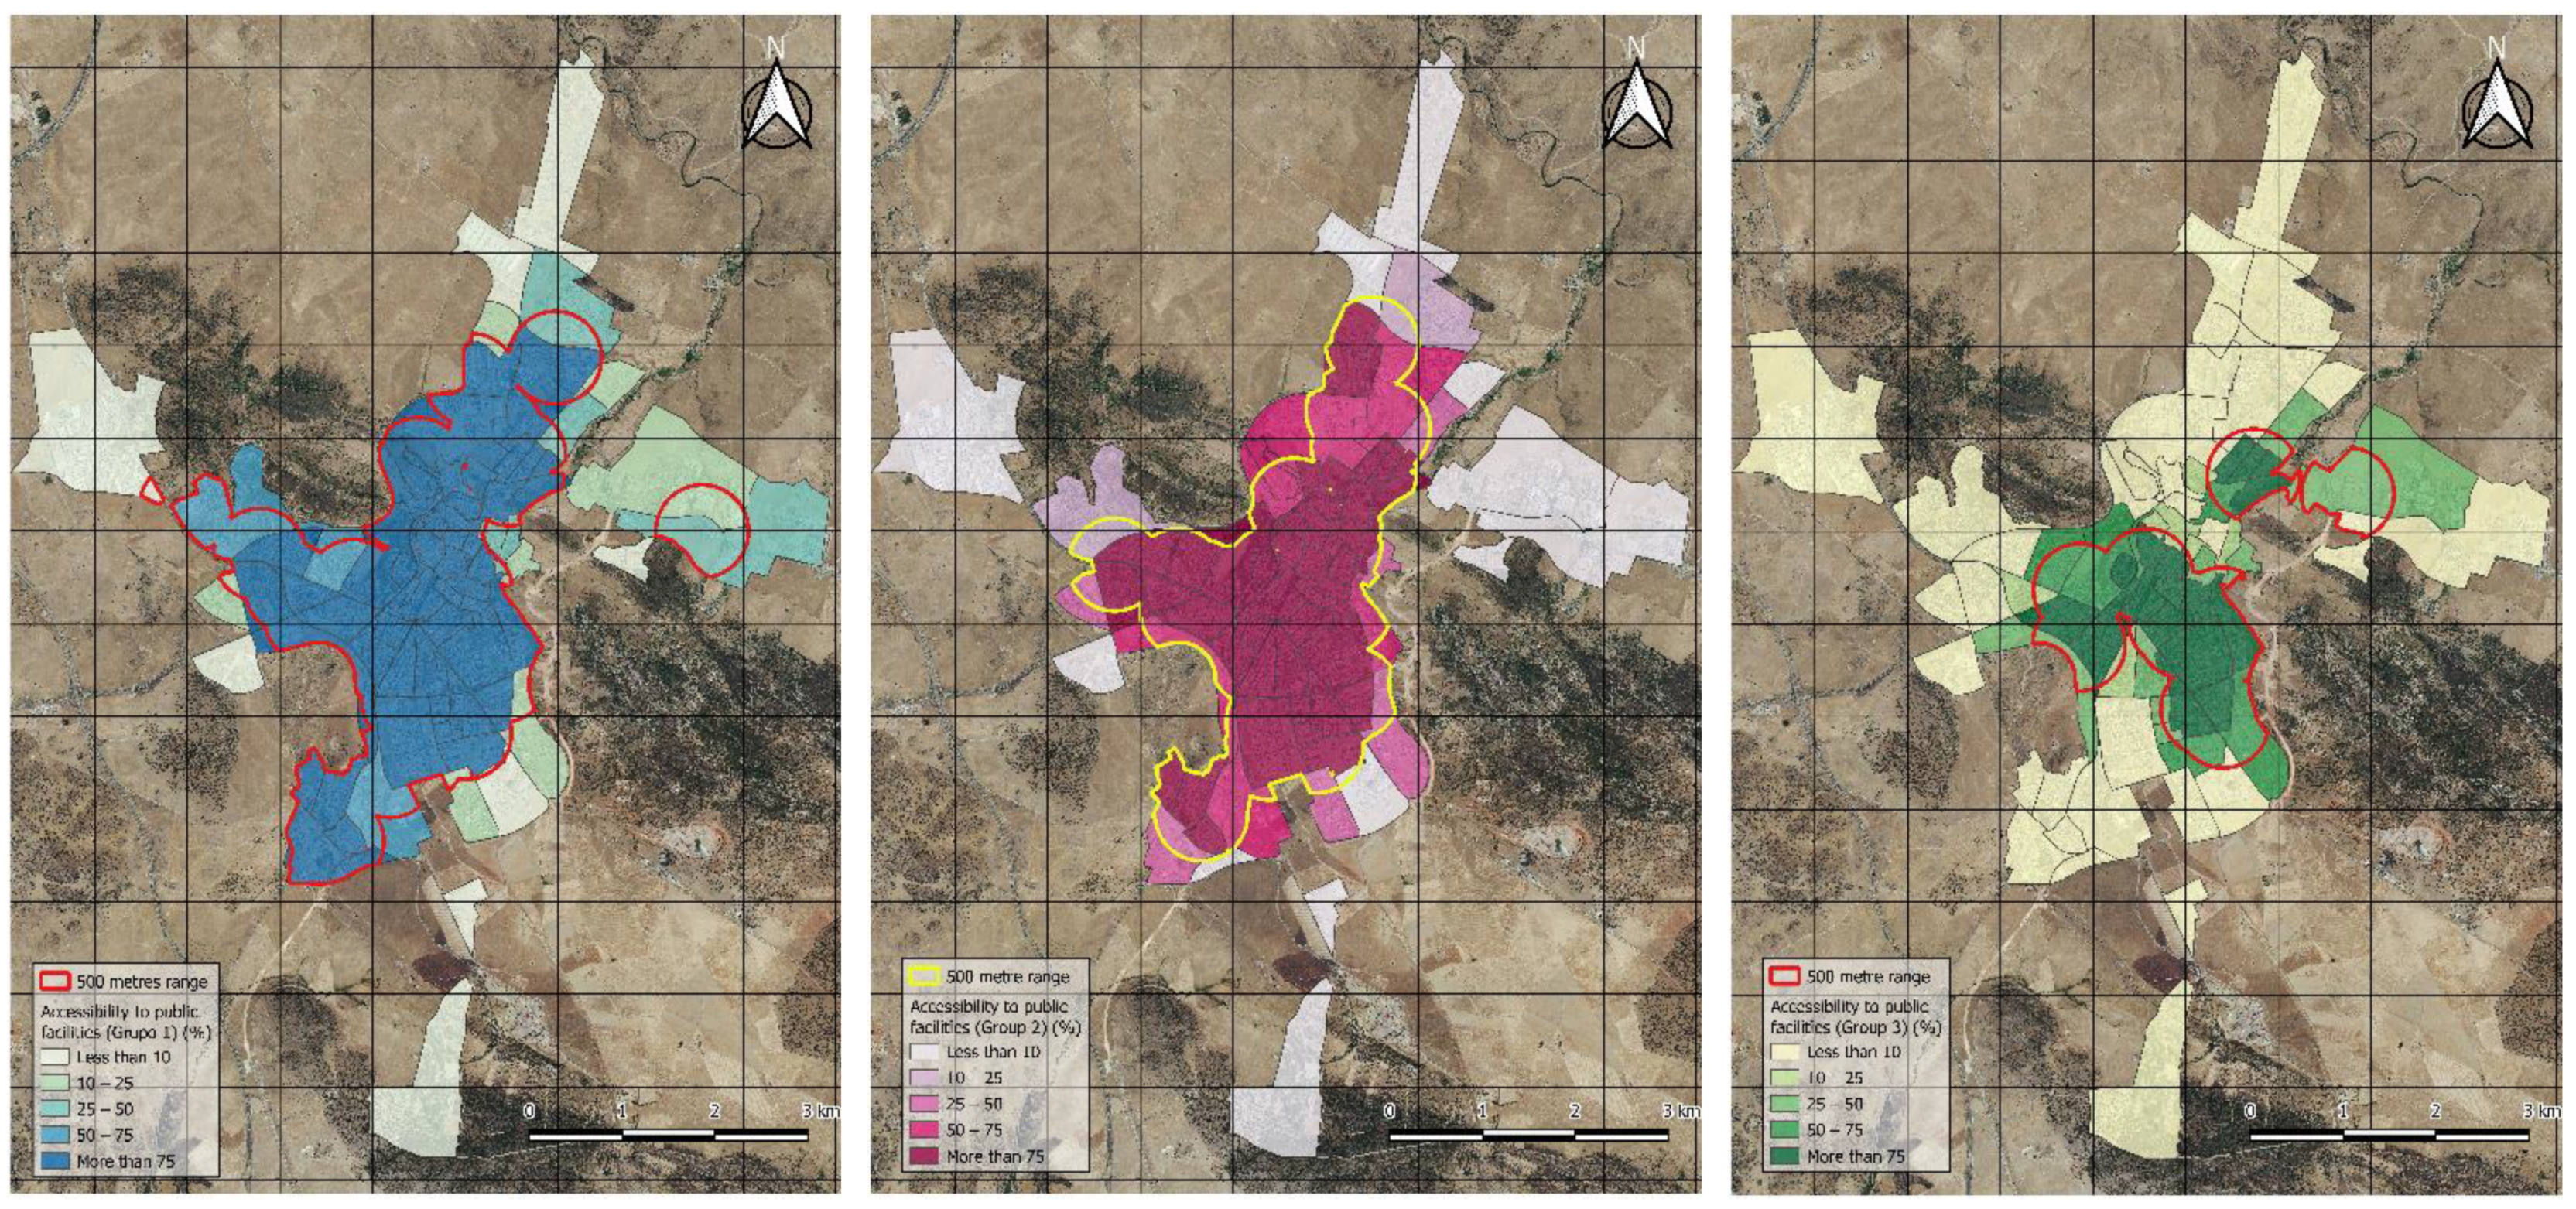
3.4. Accessibility to Public Facilities and Basic Services
In relation to the above, accessibility to public facilities must be closely linked to urban planning and based on concepts of proximity and closeness in order to promote the possibility of spending more time on social relations. A balanced and accessible distribution of basic services in the territory increases social cohesion and the interrelation between the city and its inhabitants, allowing the population to identify with their closest urban space and promoting a reduction in motorized mobility. Proximity facilities meet most of the daily needs of the population and constitute the first level of service provision, with a sphere of influence limited to the neighborhood where they are located. They have little power of attraction for the population outside the neighborhood but fulfil irreplaceable functions for city facilities, which have a wider sphere of influence and cover other needs. The analysis carried out in this research considers both proximity facilities and city facilities (vital for the daily development of activities in medium-sized cities, such as hospitals, schools and retirement homes).
Figure 8 shows the percentage of surface area with access to public facilities divided by neighborhood in the city of Cáceres. Three different types of facilities have been used for the calculation: (a) Group 1 (schools, nursery schools and retirement homes); (b) Group 2 (health centers and pharmacies); and (c) Group 3 (secondary schools and hospitals).
Figure 8 shows the proportion of public facilities available in each of the three groups. This makes it possible to identify in which neighborhoods there have higher figures in relation to accessibility to basic services.
First, in Group 1, the neighborhoods located in the city center have more than 75% accessibility to schools, nursery schools and retirement homes. In contrast, in the northern, western and southern districts, the peripheral neighborhoods have less than 25% accessibility. Second, Group 2 shows a degree of accessibility (measured in surface area) to health centers and pharmacies in the inner districts above 75%, but compared to Group 1, the number of districts with these values decreases as they move away from the central area of the city, although values above 50% are found. The worst performing neighborhoods are in the north, west and south districts (similar to the situation mentioned above for Group 1).
Finally, neighborhoods with a surface area of access to public facilities of more than 75% and belonging to Group 3 (institutes and hospitals), reduce their area of influence considerably with respect to that observed previously for the other two groups, being located preferably in the central district. A good part of the districts of the city of Cáceres have less than 10% access to this type of facilities (distributed geographically and including practically all of the northern, western and southern districts).
In terms of urban sustainability, it is considered particularly crucial to ensure access to basic facilities and services within a sufficiently close radius to the user’s home, with a positive impact on energy savings, fossil fuel consumption and travel times. In addition, proximity to facilities becomes a basic condition that makes it possible to promote accessibility for people with reduced mobility.
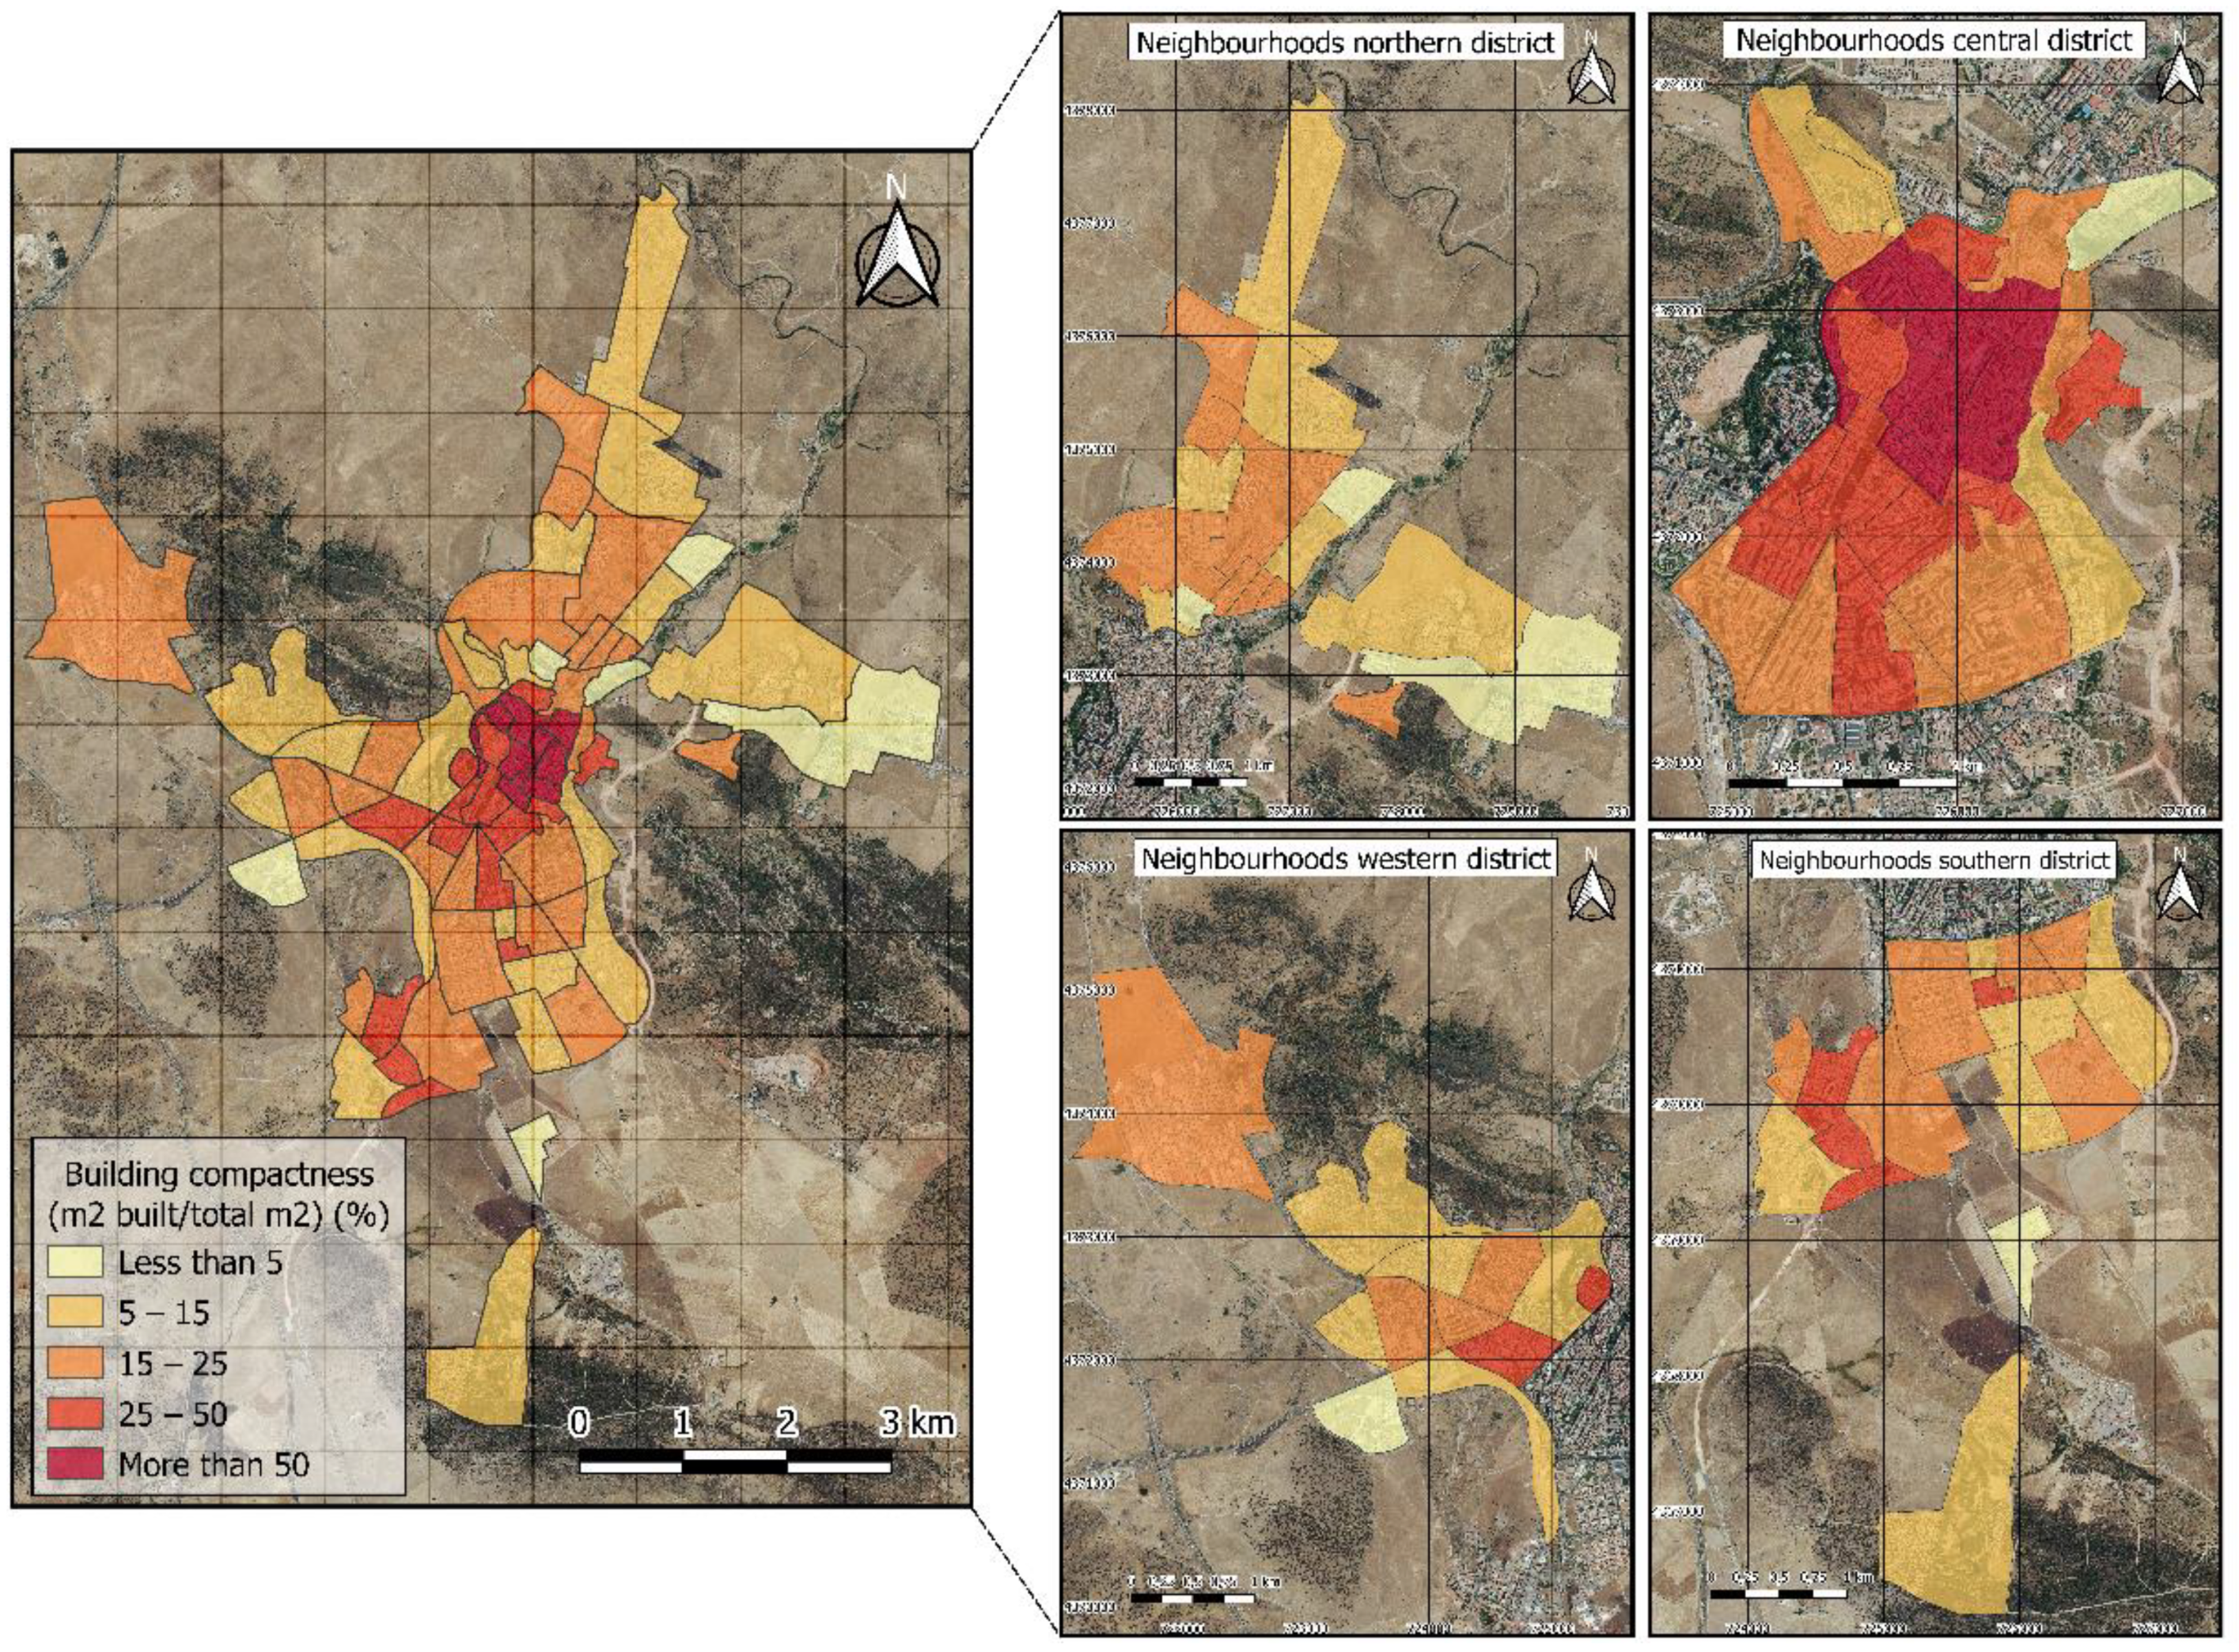
3.5. Building Compactness
Compactness is a first approximation of the pressure that building exerts on the urban fabric and expresses the idea of proximity of the components that make up the city, i.e., the gathering of urban uses and functions in a limited space. Compactness facilitates contact, exchange and communication (which happen to be the essence of the city), enhancing the likelihood of contacts and the relationship between the elements of the urban system. It is the axis of urban sustainability that affects the physical form of the city, its functionality and, in general, the model of land use and the organization of mobility and open space networks. The compact city seeks efficiency in the use of natural resources, land being one of the basic, non-renewable natural resources. Abandoning the concept of functionalist zoning and increasing the mix of uses as an efficiency strategy entails a minimization of land use. The reconversion of industrial spaces, their reuse, densification and the introduction of new uses in mono-functional areas make it possible to increase complexity and, at the same time, free natural space from the pressure generated by the diffuse city model.
In this sense, this indicator provides an insight into the building situation of the city, to be able to determine the places where the greatest social contact is generated. The use of this parameter can be considered of essential relevance to determine the urban sustainability of a city, as it has direct implications on its morphology and functionality.
Through the calculation of this variable, the aim is to locate those districts of the city where a more compact city model has been established (which, due to its building characteristics, has facilitated greater efficiency of urban land). The compact city is a model that enhances the social cohesion of the inhabitants, thus renouncing functionalist zoning and increasing the multifunctionality of uses as an efficiency strategy.
Figure 9 shows the percentage representation of building compactness distributed by neighborhoods in the city of Cáceres.
Given that the calculation of this indicator is based on a percentage analysis of the built-up square meters divided by the total square meters existing in the territorial delimitation, it can be seen in
Figure 9 that the neighborhoods that present the most densely built-up areas are in the center of the city of Cáceres (characterized by many buildings and smaller neighborhoods). In this area, values of over 25% predominate, although there are many neighborhoods with a building compactness of over 50%.
On the other hand, the peripheral districts (located in the north, west and south districts) exhibit a lower building intensity than the central district, with values ranging between 5% and 25%. Among them, there are neighborhoods in the west and south districts where the building compactness reaches higher values than the rest of the districts with lower values, reaching in some of them a compactness between 25% and 50% of the total surface area of these neighborhoods.
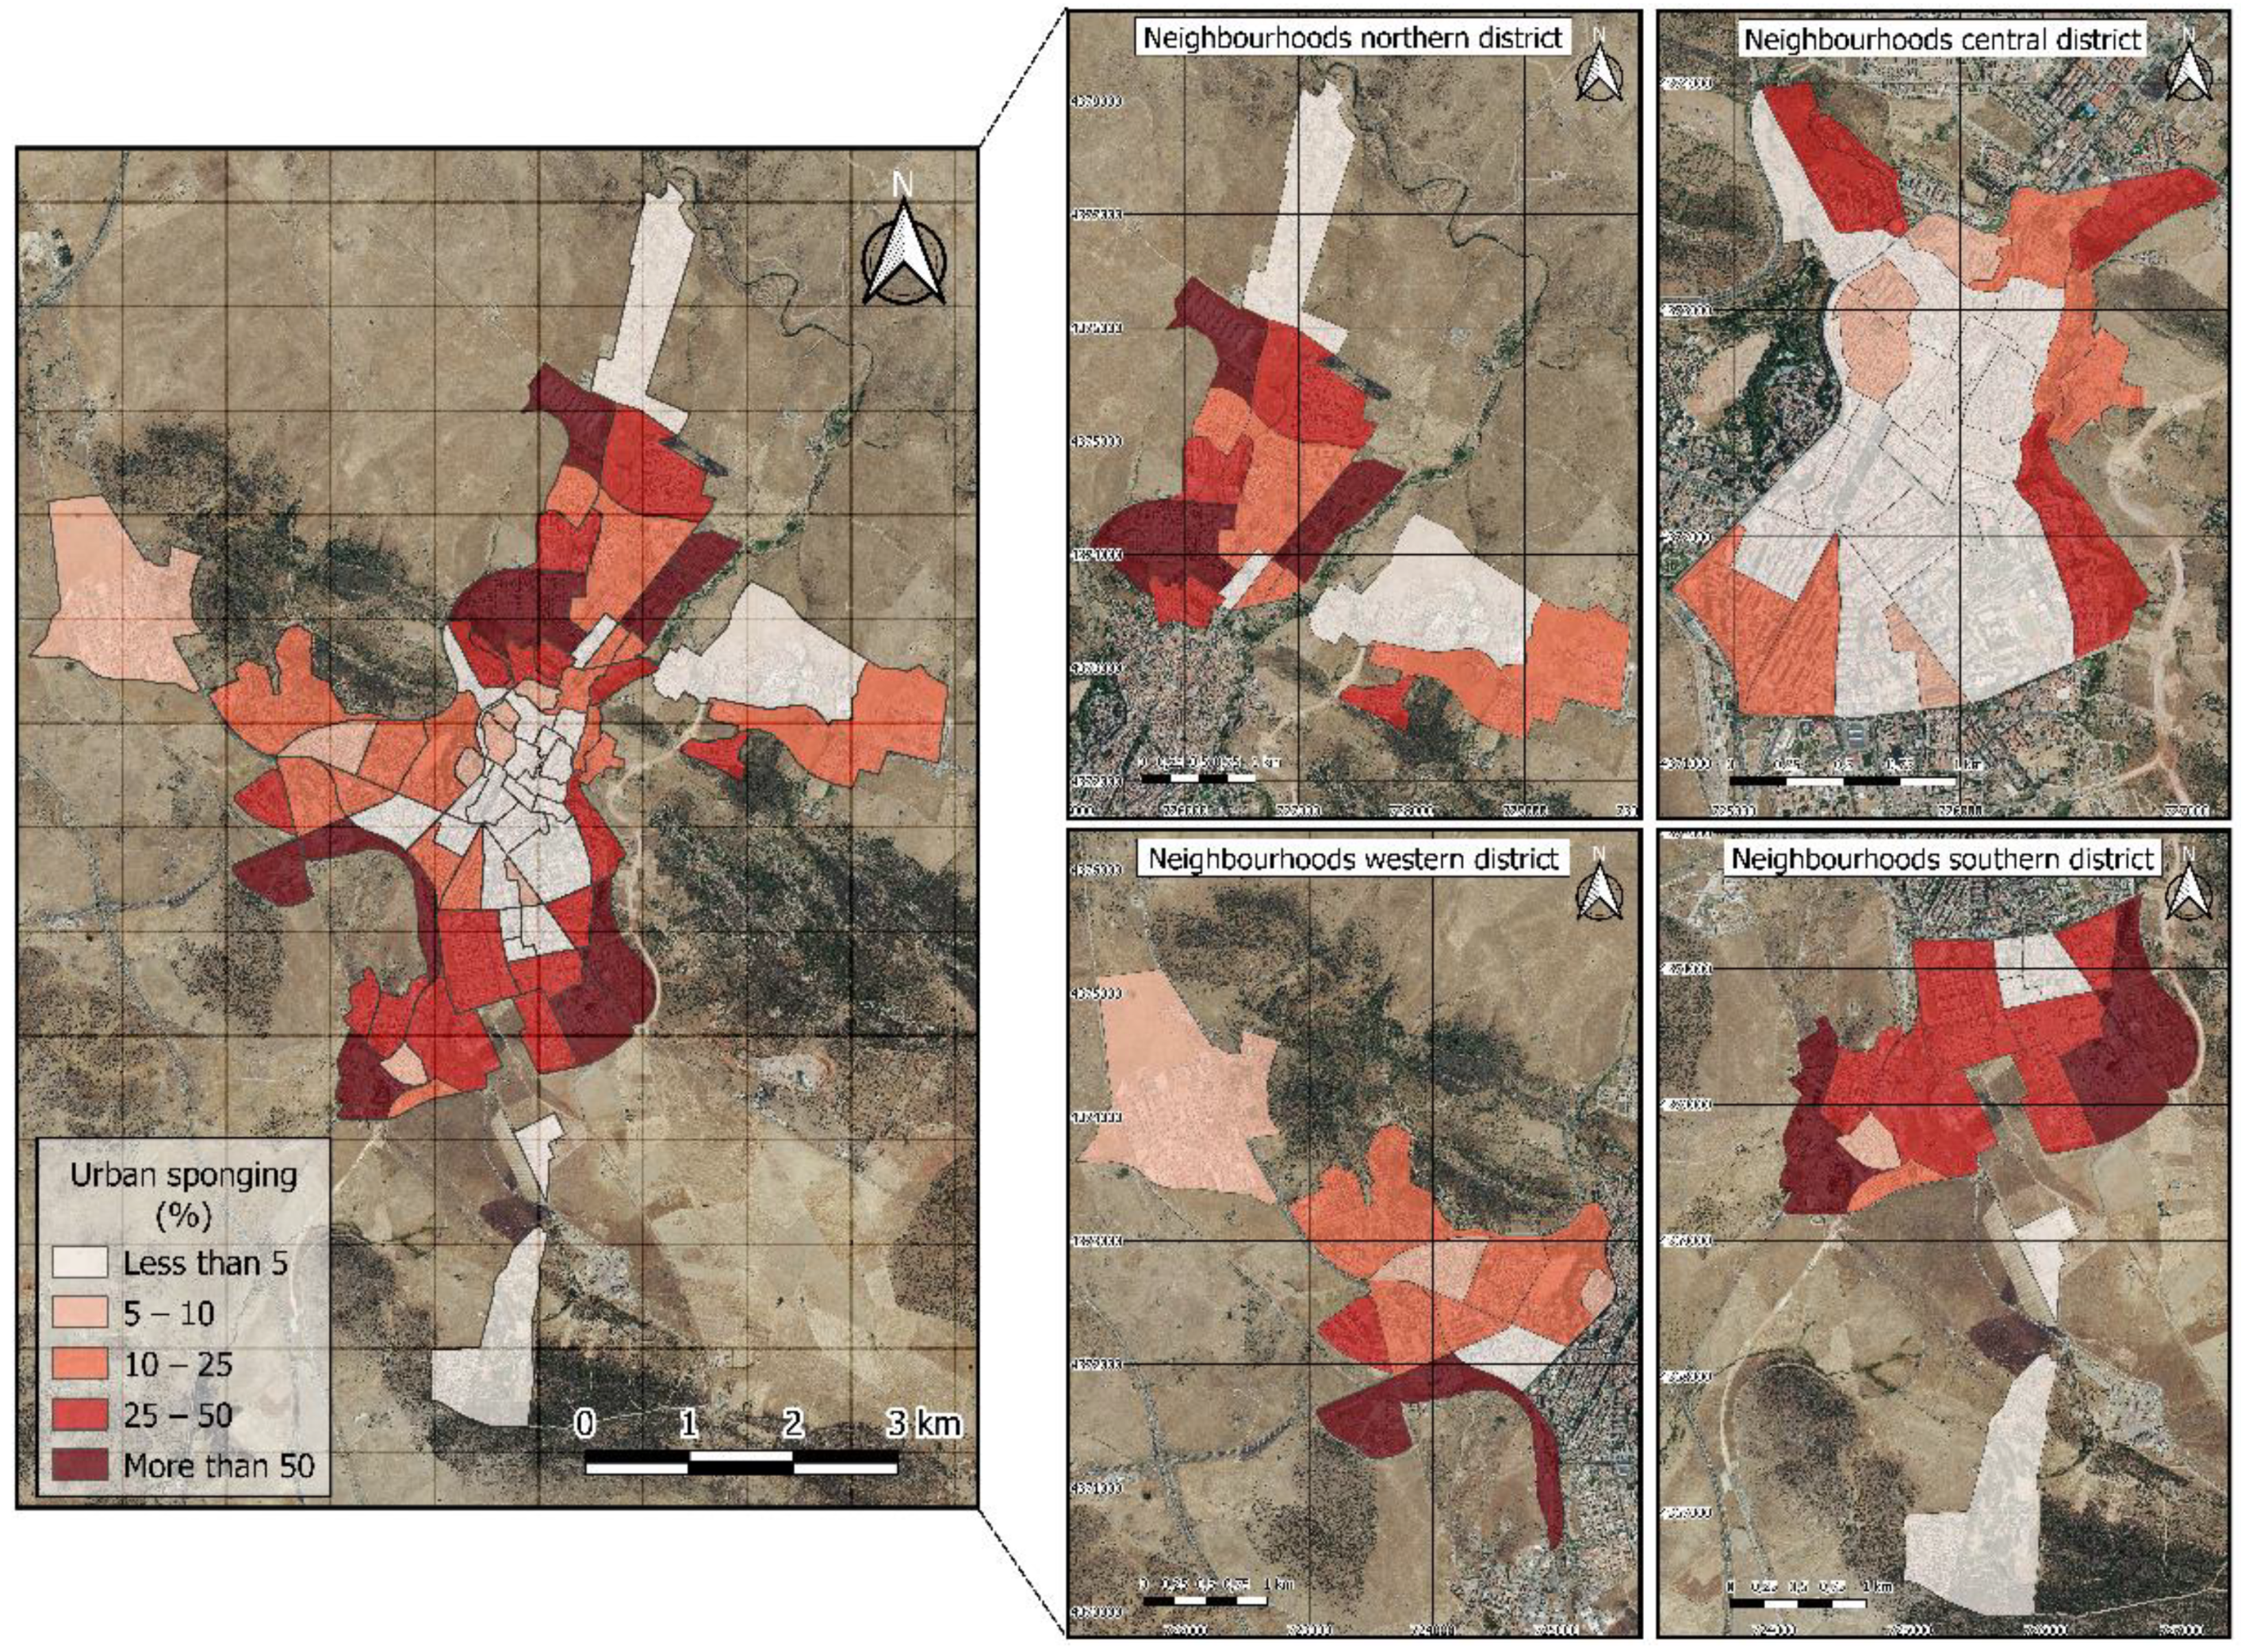
3.6. Urban Sponging
Urban growth in a municipality depends directly on the existing availability of building land, and this variable is a descriptive component of the urban sustainability of the city. Actions such as freeing up space to generate more balanced urban density and enhance the value of the inhabitants’ lives in the city are essential interventions in many situations. The possibility of being able to identify the neighborhoods with the greatest capacity to attract new urban development could prove to be a valuable tool for local administrations, as it would offer the opportunity to improve urban planning and adapt the city to the needs of the population in terms of infrastructure and public facilities.
Figure 10 shows the analysis of the urban sponging carried out in the city of Cáceres fragmented by neighborhoods.
Figure 10 shows that the distribution of the areas with the highest percentage of available building land is to be found in the neighborhoods located on the margins of the urban core of Cáceres (where the urban development of the city is being generated through the construction of multi-story housing and, to a lesser extent, the construction of single-family homes). In both the southern and northern districts, there are several neighborhoods that exceed 50% of the urban sponging up (these are areas where there is a high rate of vacant building land). In contrast, the neighborhoods located in the central district stand out for having an urban sponginess of less than 5% (the urban fabric is characterized by its high building density, resulting in a practically non-existent availability of buildable urban land).
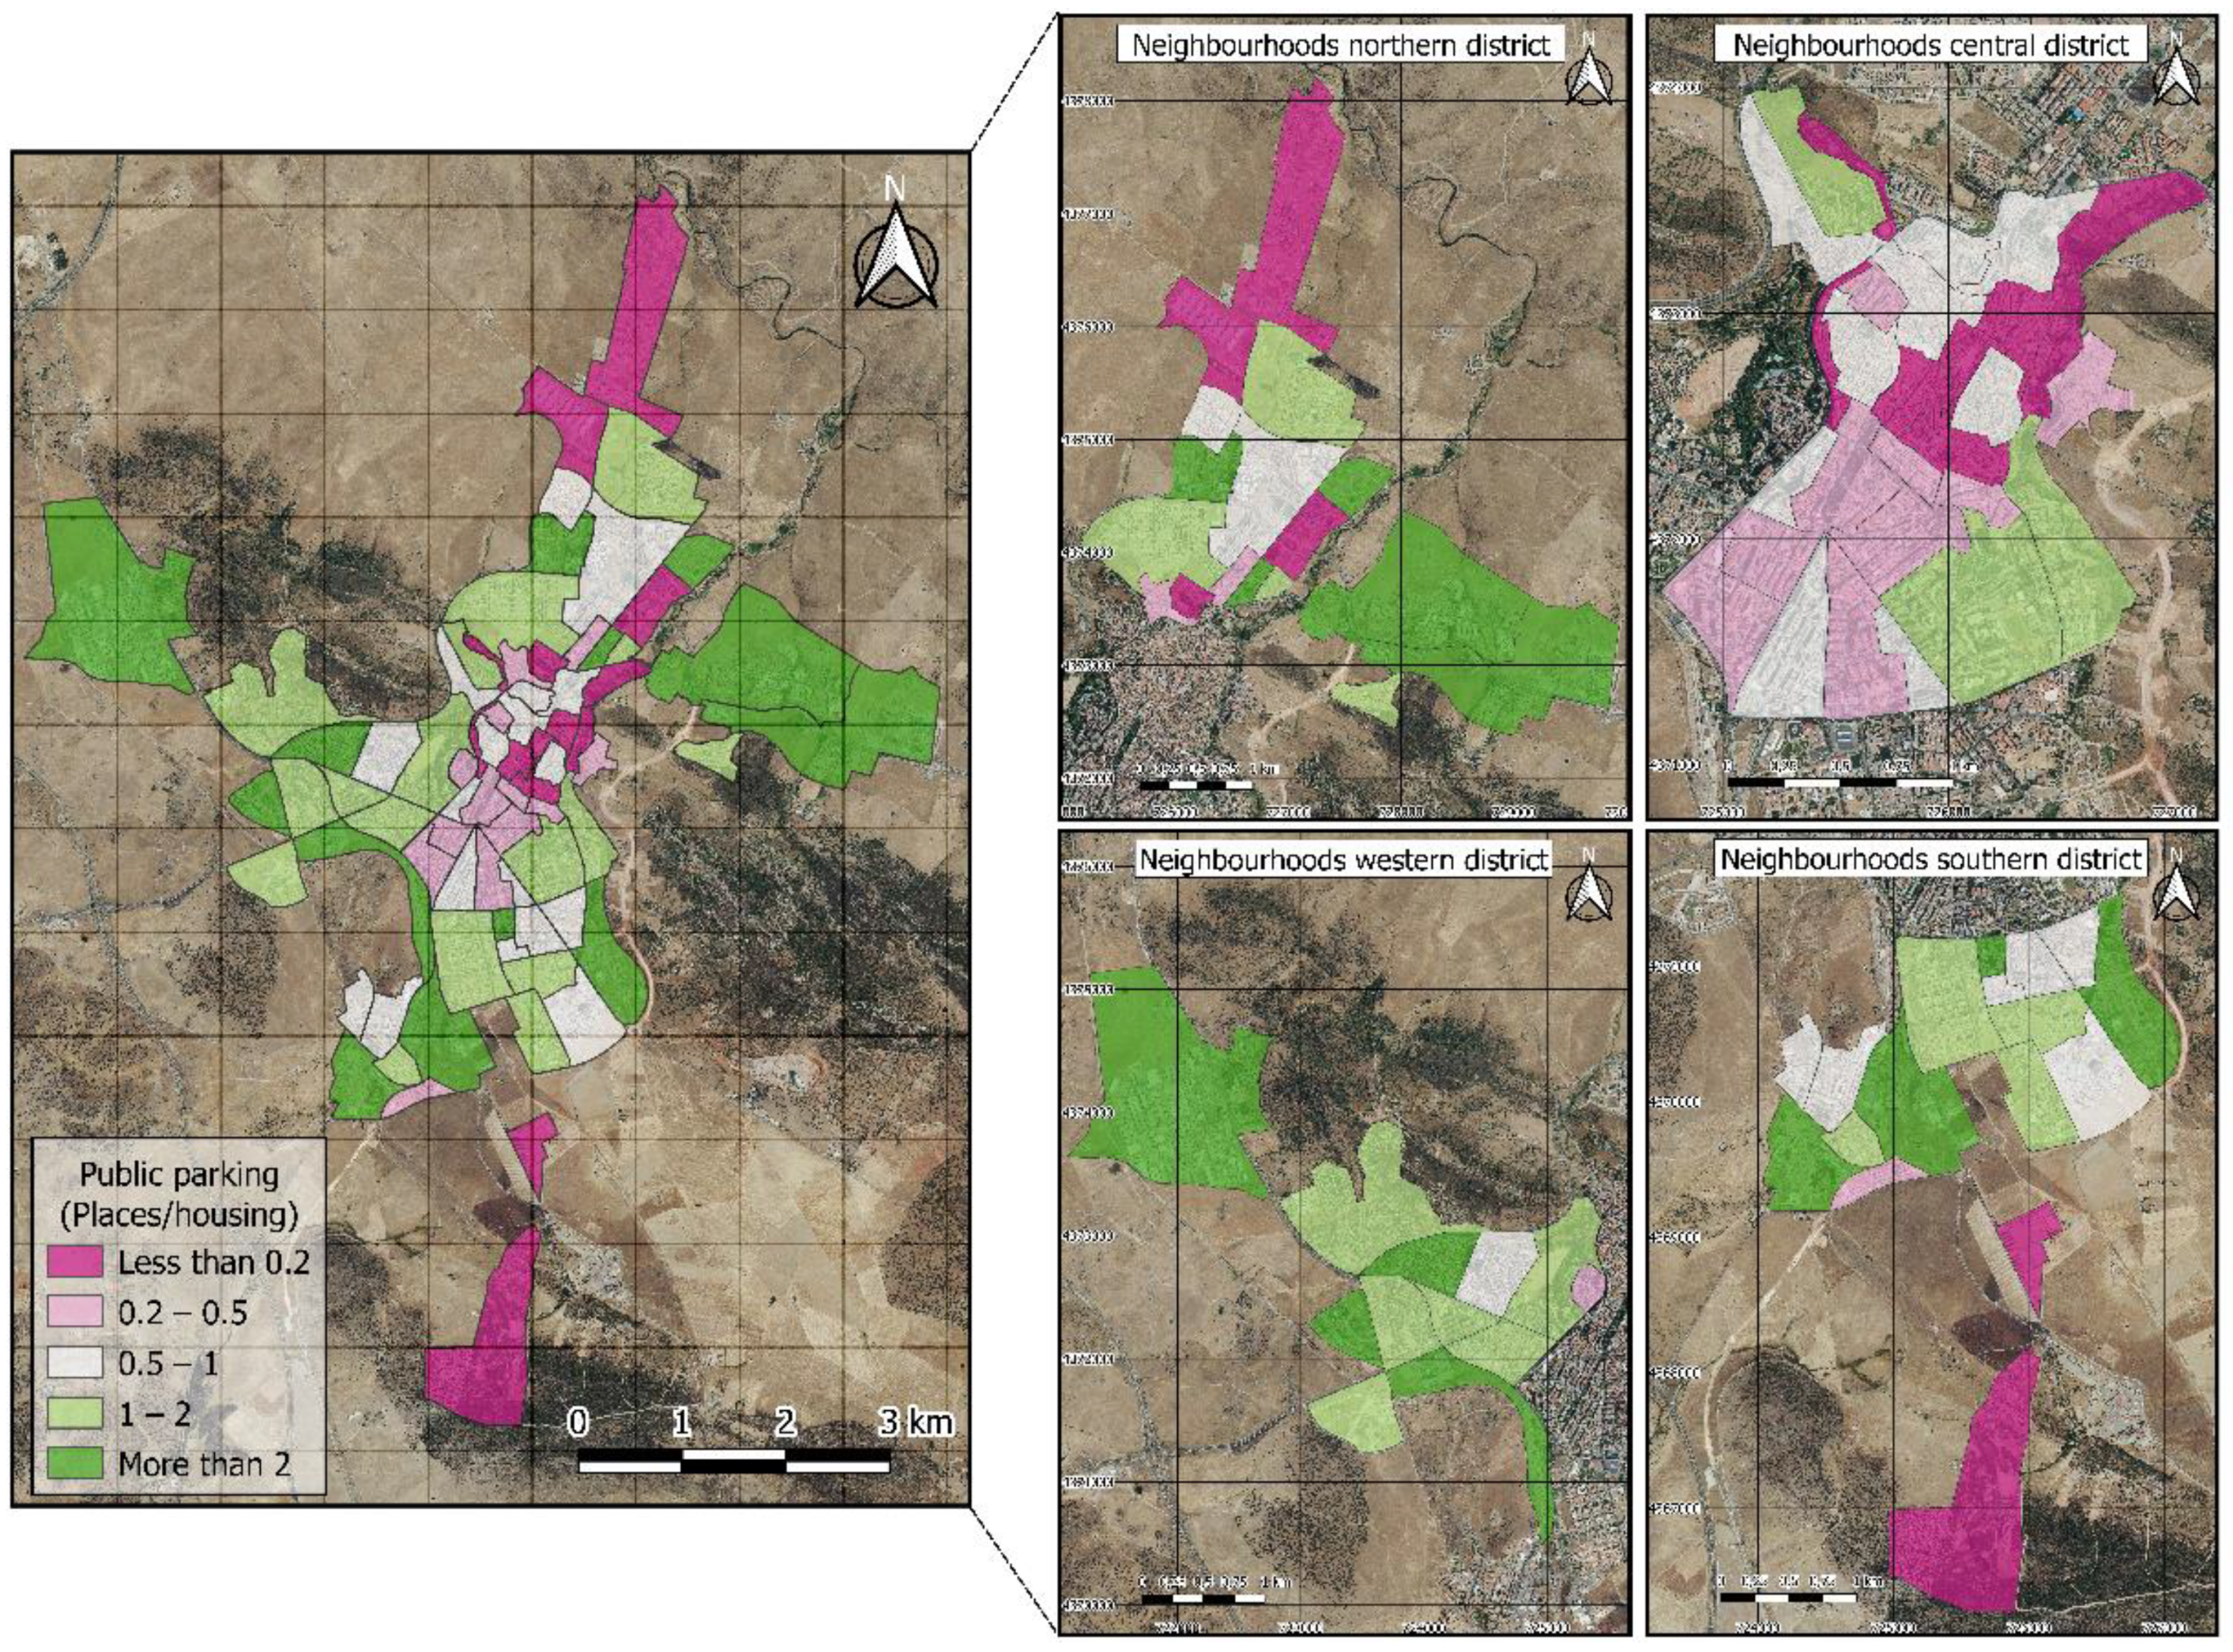
3.7. Public Parkings
The availability of public parking spaces is an aspect to be considered to avoid congestion in cities, since the degree of occupation of public roads by private vehicles is a constant in most cities. This sometimes reduces the availability of public space for citizens and, above all, prevents them from being able to fully carry out their own activities, such as staying, travelling and socializing. Greater planning and control of parking in public spaces would be highly desirable to free up and recover this space for pedestrians (without obstacles or friction), allowing the maximum number of off-street parking spaces.
In this section, the indicator on the distribution of public parking spaces shows the relationship between the number of parking spaces located on and off-street at the neighborhood level (
Figure 11).
The calculation of this indicator provides information on the number of parking spaces available in relation to the number of dwellings registered in the city of Cáceres, with this information segregated by neighborhood. The results show that the neighborhoods with the highest number of parking spaces per dwelling (more than 2 spaces/dwelling) are mainly located in the peripheral areas of Cáceres. In the north district, the neighborhoods of Seminario and Nueva Ciudad stand out; in the west district, Macondo and R-66, and in the south district Vistahermosa and Vera Cruz stand out, as they are areas where there is a relatively balanced number of dwellings with respect to the number of parking spaces. With a lower number of parking spaces in relation to housing, the neighborhoods located in the central district stand out (values of less than 0.5 spaces/housing are identified).
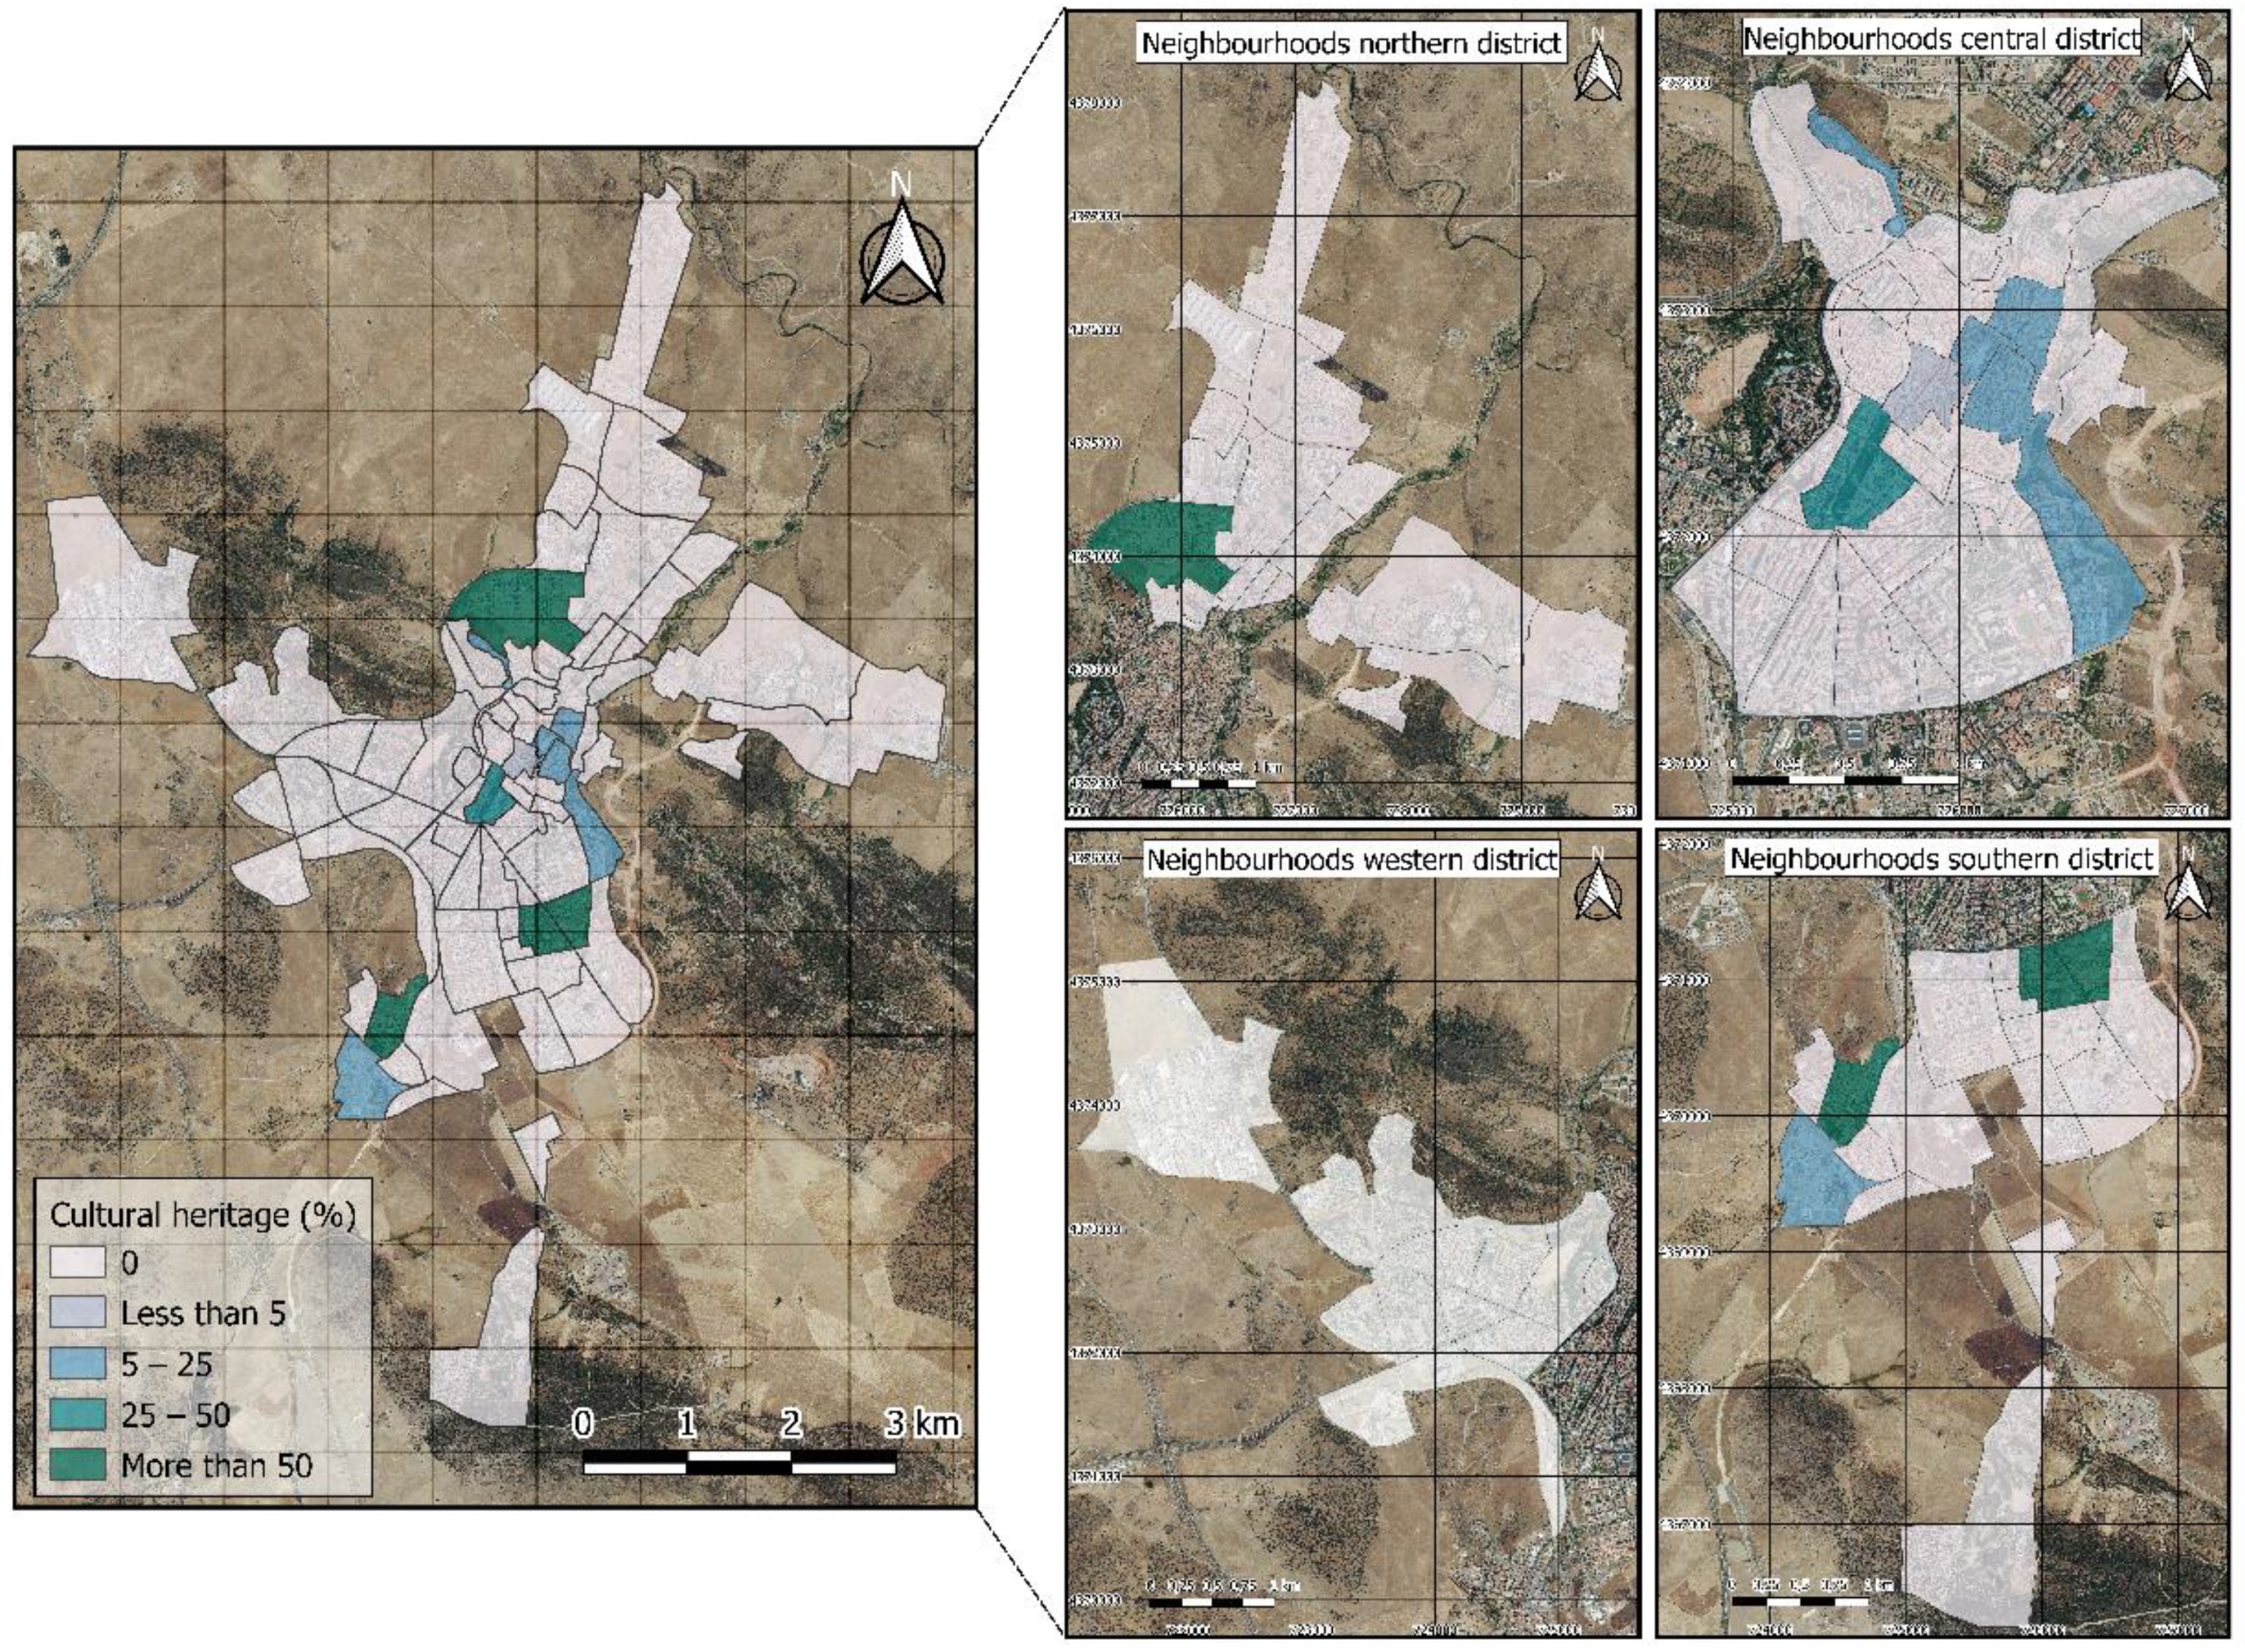
3.8. Cultural Heritage Elements
The monumental city of Cáceres was declared a World Heritage Site by UNESCO in 1986. Given this situation, it is concluded that the heritage value of the historic buildings present in the city has a considerable relevance in its urban environment, as well as in the society that composes it. The indicator used for the purpose of determining the percentage of cultural heritage put to good use in the city helps to identify the neighborhoods in which the wealth of historic monuments plays an important role in their development and morphology.
Figure 12 shows the spatial distribution of this indicator. The results make it possible to evaluate the integration of heritage in urban planning, as well as to implement the development of measures that favor the sustainability of environments with heritage of great relevance and notable artistic interest.
As can be seen in
Figure 12, the elements of cultural heritage that have been put to good use in the different neighborhoods of the city of Cáceres show very different values, as in some cases the heritage elements are non-existent. The locations with the greatest importance in terms of heritage are located around the monumental city, although there are some neighborhoods that are located further away.
In the northern district, only one neighborhood (Montesol) has more than 50% of heritage elements of value, and the rest of the neighborhoods have no value. As for the western district, it is observed that it lacks valuable heritage elements. Both the central and southern districts show a greater number of neighborhoods with higher percentages of representative heritage elements, with the central district (the neighborhood of Cánovas) and the southern district (the neighborhoods of La Abundancia, Llopis Ivorra and Espíritu Santo) standing out with more than 50% of elements with heritage value.
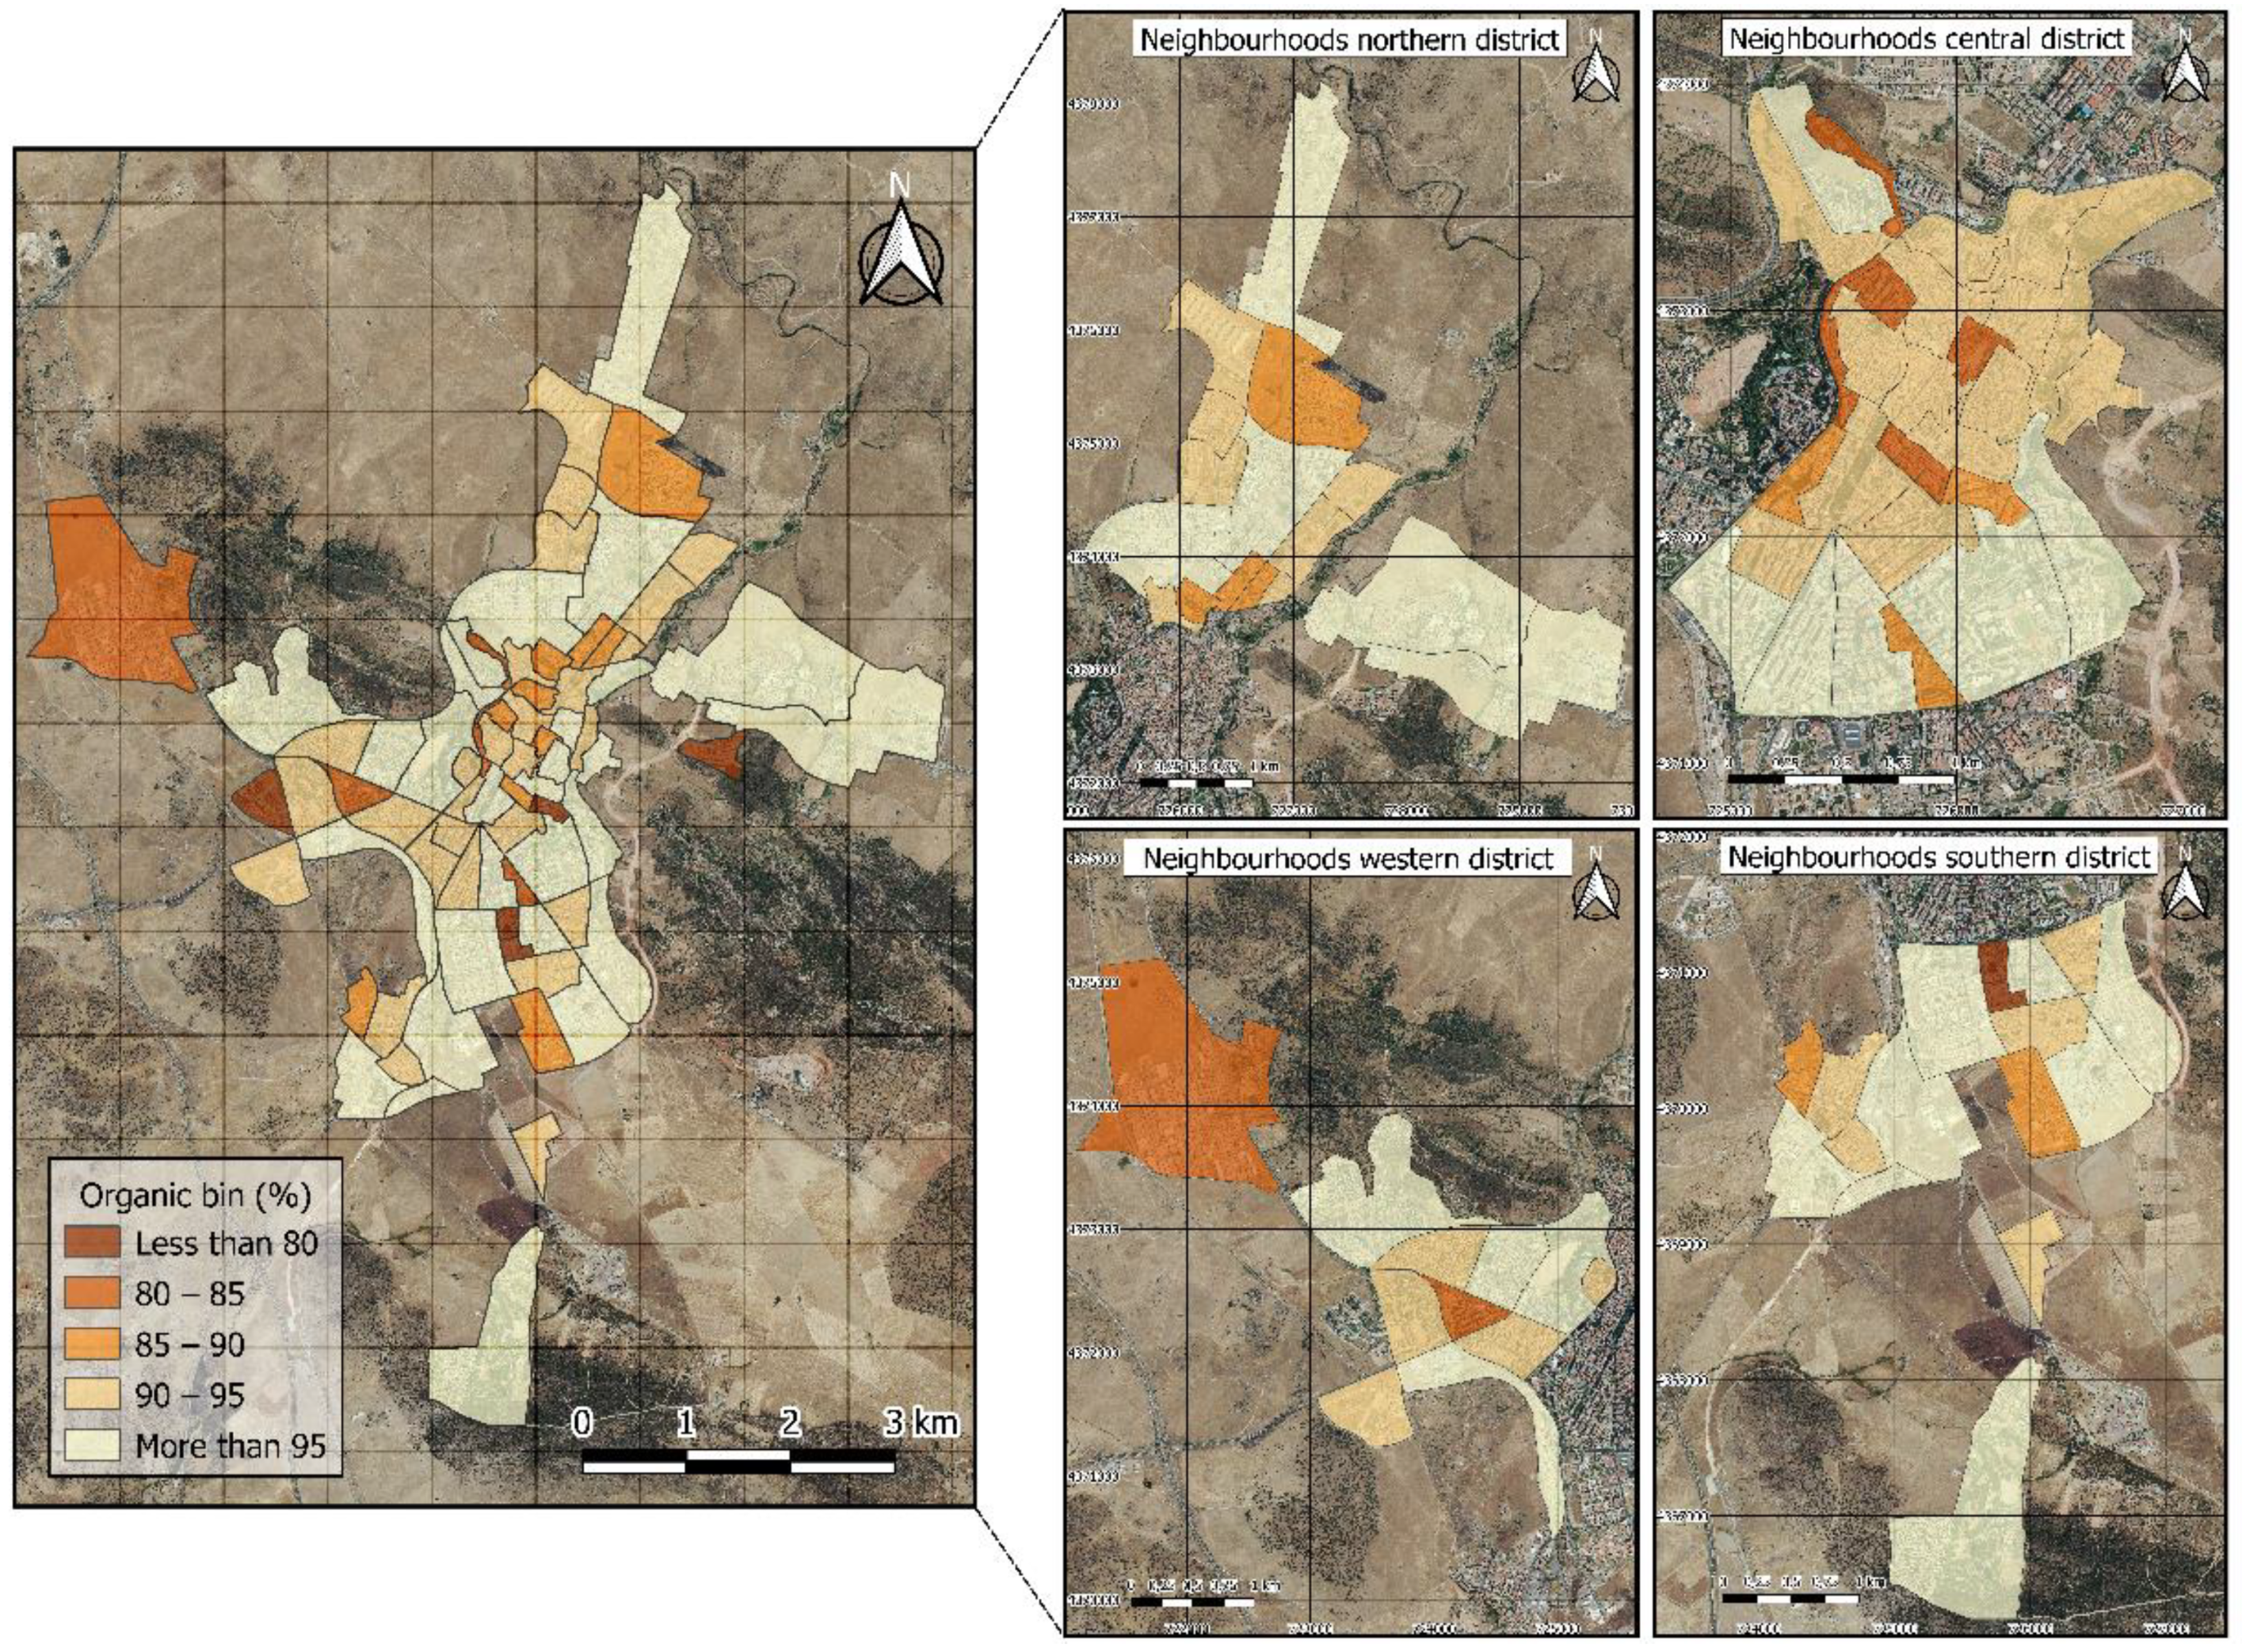
3.9. Organic Bin
The indicator analyzed below shows the percentage of urban land located at more than 50 m from an organic bin, divided by the total area of urban land. A determining factor for the correct functioning of a city’s recycling system is the proximity of citizens to the collection points for the different types of waste. The favorable circumstance that citizens have a collection area close to their homes makes long journeys unnecessary, favoring a greater contribution to selective waste collection. In addition, having waste containers close to homes means that waste is not left indiscriminately on the public highway.
The study of this variable supports the identification of the neighborhoods in the city of Cáceres where the greatest distance must be covered on foot when travelling to the container to dispose of organic waste, allowing measures to be established to improve the geographical distribution and placement of natural waste containers.
Figure 13 shows the result of the analysis considering what percentage of territory for each neighborhood in Cáceres has more than 50 m from the existing organic waste containers.
The spatial distribution of organic waste containers in the different neighborhoods of Cáceres shows that, in most cases, 95% of the surface area analyzed has more than 50 m. Specifically, in the neighborhoods of the central district, values of between 90 and 95% are obtained, with the Hernández Pacheco neighborhood standing out (less than 80% of its surface area is at more than 50 m). These figures are also repeated in the north district (Residencial Universidad), west district (Macondo) and south district (Las Trescientas and Vera Cruz).
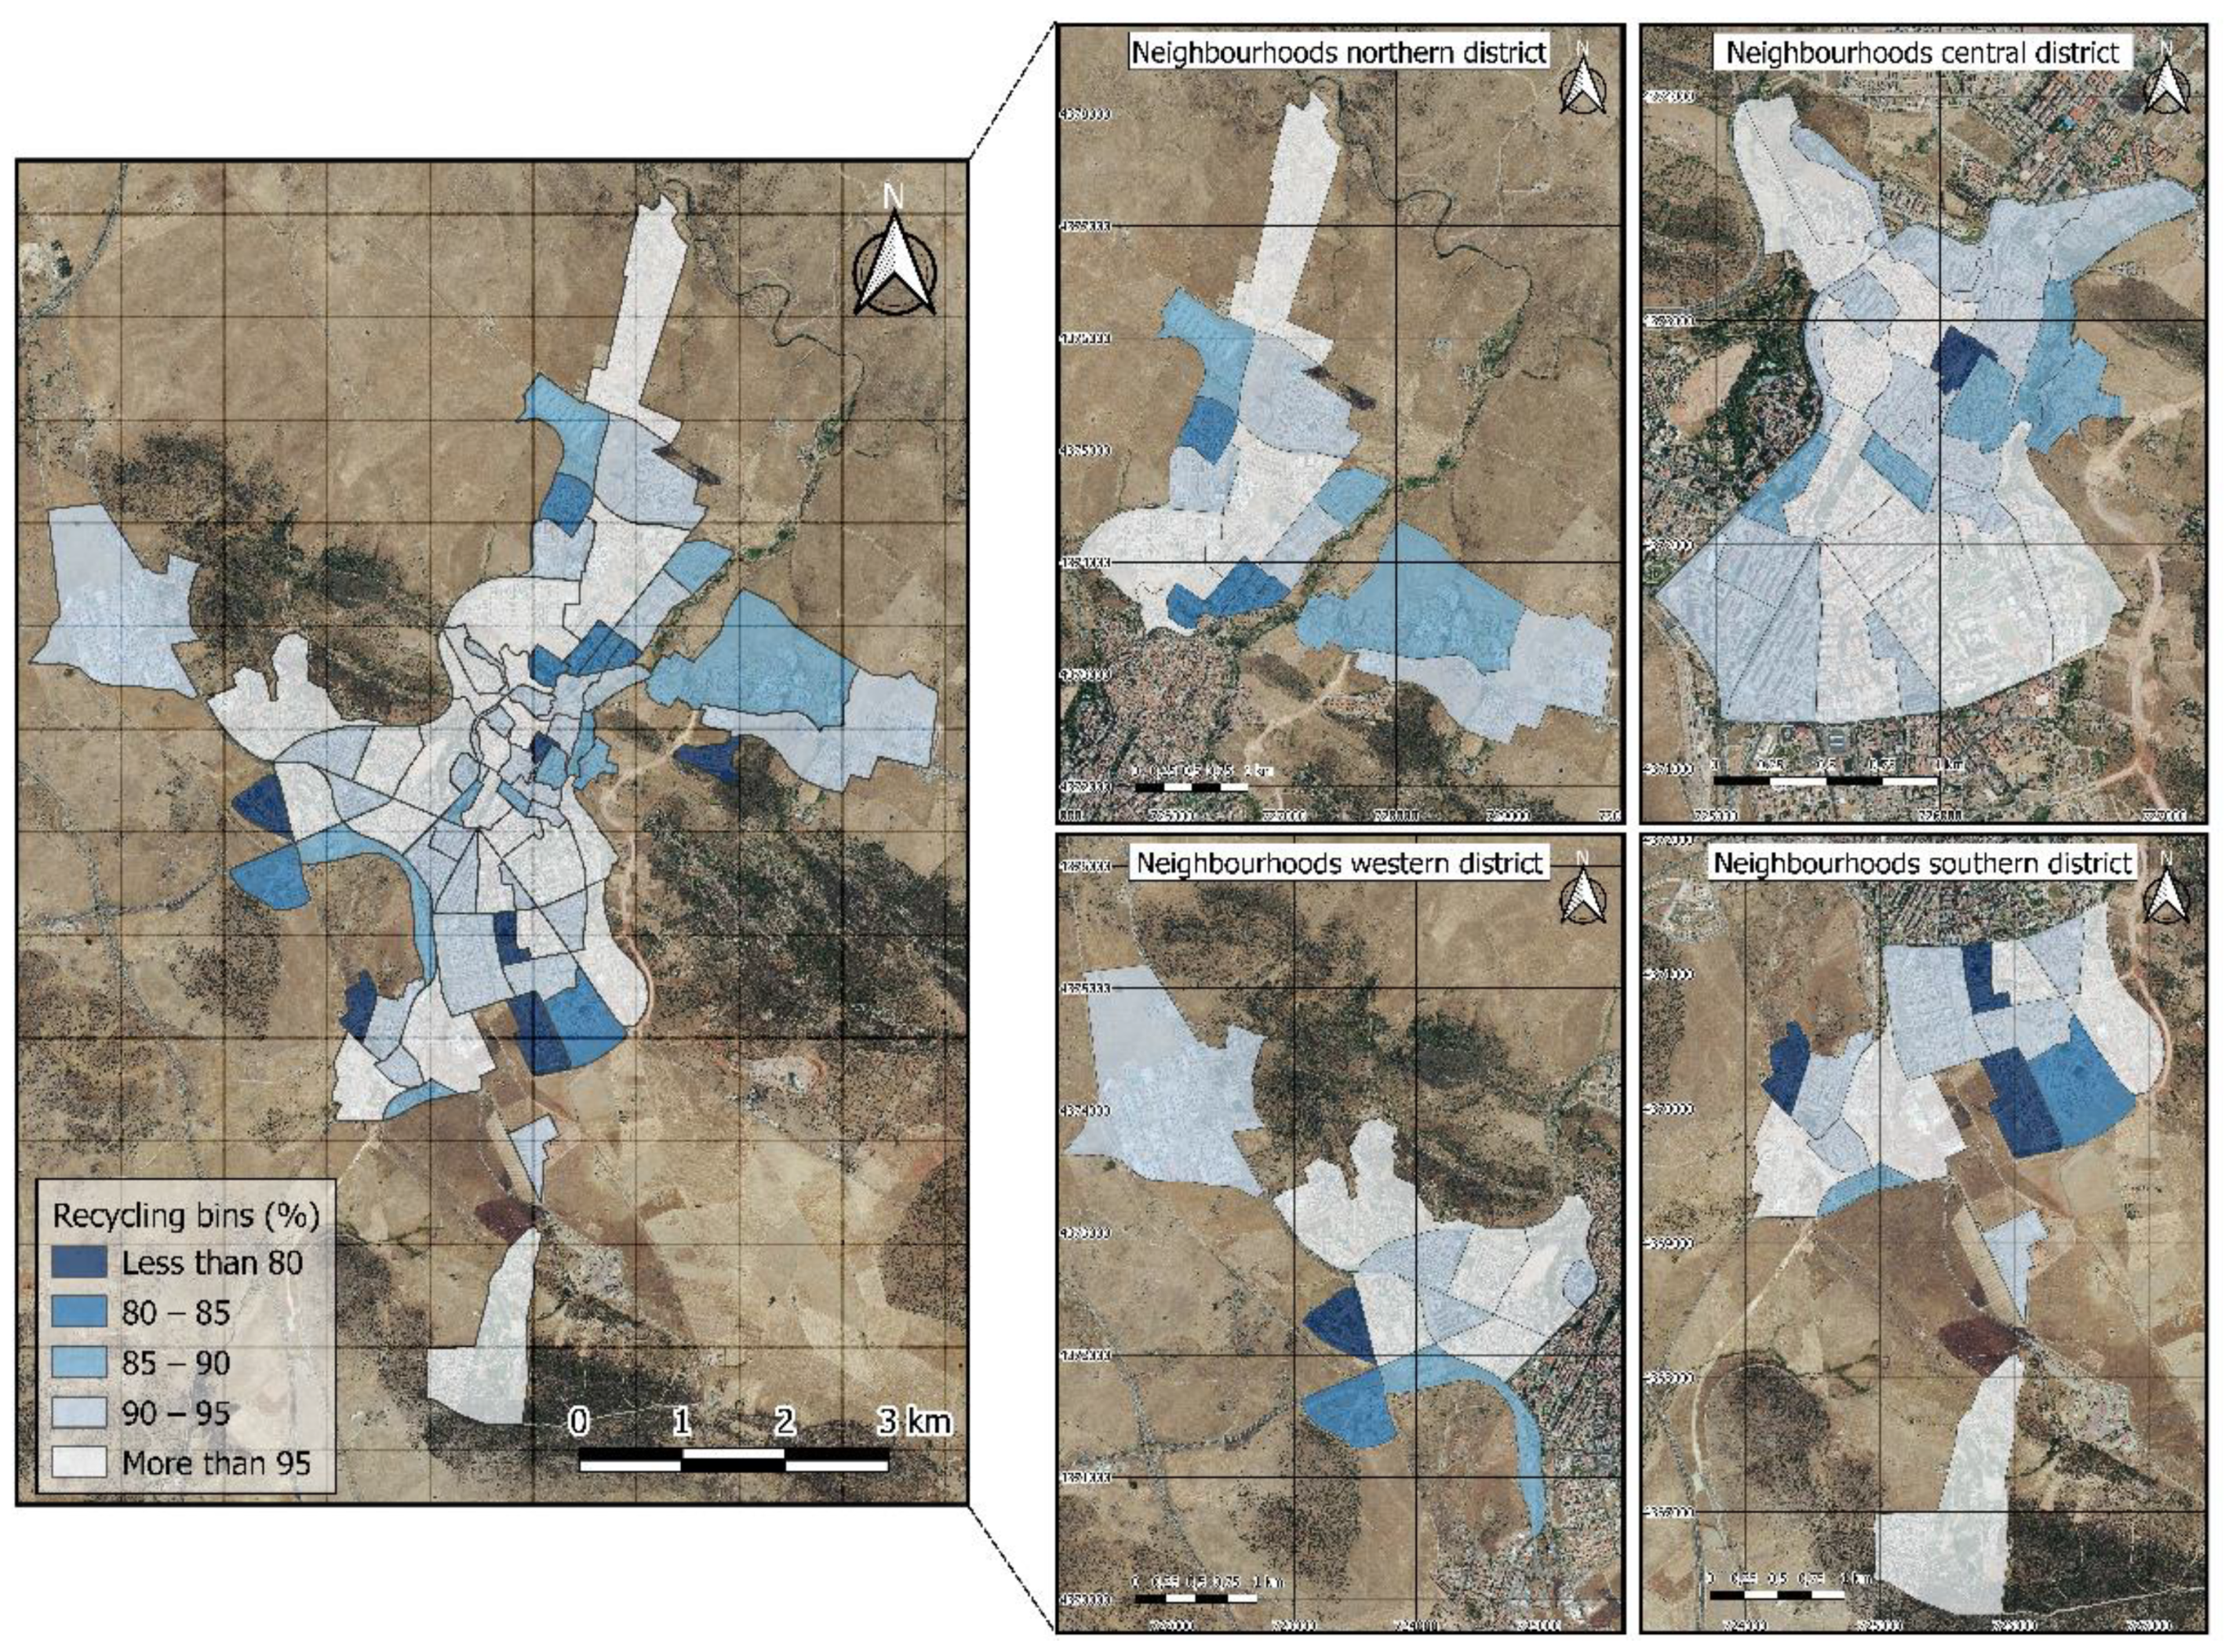
3.10. Recycling Bin
The sustainable and efficient management of solid urban waste is one of the key points for improving the quality of life of the inhabitants of municipalities. The proximity of citizens to the waste collection points (distance that a person has to travel from the doorway of their home to the container) of the different fractions (glass, paper and cardboard) is one of the main factors for improving the functioning of the system, avoiding excessive journeys and favoring a greater contribution to the selective collection of waste. This indicator provides a more precise parameter for assessing the quality of the waste collection service.
In this section, the main objective is to determine the percentage of urban land located at more than 100 m from a glass/paper/packaging container, with respect to the total area of urban land for each neighborhood in the city. The calculation of this indicator can be seen in
Figure 14.
In line with the previous section, the distribution of the containers for the different fractions analyzed (glass, paper and cardboard) has a similar structure to the results obtained for the organic containers. A large majority of districts have a surface area of more than 90% with more than 100 m from the recycling containers. In the western, central and southern districts, it can be observed that some neighborhoods have less than 80% of their surface area at a distance of more than 100 m, which is very significant given that the inhabitants of these neighborhoods show greater proximity to these urban elements. In general terms, there are palpable differences at neighborhood level in each of the districts of the city of Cáceres, with a predominant situation where more than 95% of the surface area is located at more than 100 m.
4. Discussion
The use of urban sustainability indicators at the neighborhood level, selected from the regulatory text of Law 11/2018 on Sustainable Land and Urban Planning of Extremadura (LOTUS) [
51], has allowed the authors to analyze a real case study, with the intention of being able to transfer the knowledge acquired to the local public administration for the benefit of improving urban planning in the city of Cáceres. Likewise, the General Regulations of the Law of Territorial Planning and Sustainable Urban Development of Extremadura declare the need to use sustainability indicators as tools for the planning and evaluation of urban models, establishing the minimum standards or objectives to be achieved.
In this way, it explores the development of an urban model that is based on sustainability, where the maximum possible proximity to public services is present and where pedestrian mobility plays a fundamental role in the development of cities [
53]. The joint use of urban indicators and GIS tools has allowed for a more detailed analysis at the city level of neighborhoods, as other authors have demonstrated [
22,
39,
42] in different scales, with the intention of being able to determine graphically those parameters that show values within the minimum standards required by law and those that need to be improved in order to reach the established goals.
In this sense,
Table 2 shows a numerical summary, providing the results obtained for each urban sustainability indicator used in the research, segregating the values for each of the four neighborhoods analyzed and additionally providing the overall figure at the level of the entire city. Likewise, the minimum values that the urban sustainability parameters (standards) must reach are provided.
Analyzing the results through the complete city approach, it can be seen that a large number of indicators are above the minimum standards required, which would mean that they comfortably meet the regulatory requirements and present a presumably adequate degree of sustainability. This is the case of the following parameters: density, green areas, public facilities, accessibility to public facilities and basic services (Group 1 and 2), public parking and cultural heritage elements. On the other hand, there are other indicators that are below the minimum required standard, such as accessibility to public facilities and basic services (Group 3), building compactness, urban land sponging and organic and recycling bin. The city under study, through the urban planning instruments set out in the LOTUS, should consider the evaluation of the urban model obtained and establish the necessary measures that are applicable to try to adjust the urban configuration to the objectives of sustainable development. In terms of actions to be carried out in terms of territorial sustainability, environment and social cohesion, urban planning should consider the following criteria: (a) Promote the quality and functionality of public spaces and facilities (priority to the criterion of proximity and access by means of sustainable mobility; (b) Achieve urban fabrics where the diversity of uses prevails; (c) Favor pedestrian streets over roads in historic centers; (d) Encourage the removal of architectural barriers and the provision of accessible parking spaces close to places and buildings of interest; and e) Encourage citizen participation in the strategic planning of the city.
The analysis of sustainability is a fundamental element for urban planning and should focus on the application of methodologies using indicator systems that develop qualitative and quantitative definers of cities [
54]. The measurement of sustainability is an aspect that has been analyzed in recent years, due to the imperative need to change the city model that was being generated until the first decade of the 21st century. This fact has led numerous authors [
45,
55] to try to identify the sustainability of cities through different urban indicators, with the aim of achieving better planning and management and promoting adequate development at the local level [
56,
57]. The application of the methodology used has provided highly relevant information and results for certain city neighborhoods, which can help to improve decision making in those neighborhoods where minimum standards are not met. Other researchers [
4,
58,
59] have sought the procedure to make clear the need to link the data obtained in their studies on urban sustainability with the needs of cities, so that the decisions taken by the different administrations would lead to more environmentally sustainable actions. It is intended to gain importance in local urban governance and, in that sense, indicator-based assessments represent a means for its implementation, as discussed in [
60,
61].
The urban fabric of the city is explained mainly through the density indicators (urban population and housing) used, the compactness of the city’s buildings and its urban sponginess. It can be observed that the inner districts of Cáceres present a compact city model, resulting in these areas with the highest urban population and housing density in parallel with a high compactness of buildings. The building typologies analyzed are configured in collective dwellings that reduce the pressure of the urban system on the environment [
31]. At the same time, on the outskirts of the urban center of Cáceres, a different system to the one mentioned above is being developed, with an urban model based on land consumption prevailing, which is unsustainable for the urban environment as it reduces the social interrelations of the city’s inhabitants and at the same time hinders the availability of the services offered by the city [
10,
62].
The indicators are complemented by those that determine the capacity of neighborhoods to adapt to different public facilities and the population’s access to services. The existence of proximity and accessibility to the main public facilities enhances the design of cities as a more livable place, where urban planning is transformed in order to guarantee the quality of life of the urban population [
15]. The scheme is based on the development of a city model in which strong links to mobility flows and to the main activities manage to dynamize the life of the city to make it a more socially cohesive place [
63,
64]. Related to the above is the predisposition of the population to park their vehicles in publicly owned car parks, with the aim of determining those places where the pressure of private vehicles is most intense [
65] and, therefore, urban redevelopment is needed to facilitate the life of citizens. At the same time, accessibility to all the fabrics and sets of mobility poles must be guaranteed from any of the modes of transport, prioritizing the use of more sustainable means of transport such as public transport, cycling or walking, as explained by different authors [
66,
67,
68,
69].
The analysis of indicators associated with the collection of solid urban waste and the proximity of these everyday elements in the life of a city implies the need to expose their considerable degree of relevance in the evaluation of the sustainability of an urban environment. Some authors [
70,
71,
72] intend to show through their research the impact that these elements have on the urban environment, while at the same time aiming to characterize and map the proximity of these elements at different levels. In this sense, the proximity of organic waste and recycling bins to residential doorways allows for better urban management, while at the same time providing quality of life for citizens. This fact encourages the administrations in their commitment to the development of policies that care for the environment and promote awareness of the circular economy.
The development of a sustainable city model is the political and technical aspiration of the main Spanish municipalities, therefore, the analysis of urban sustainability indicators together with the use of GIS tools helps to locate the aspects to improve in a city in order to reach the standards that are considered to be more suitable. The urban model to be implemented must be related to the configuration of spaces, tending towards a greater degree of compactness and accessibility to the different services provided by a city. It is highly recommended to create patterns of proximity between housing and work, leisure and service activities, as indicated in [
73], with the premise of determining the proximity of commercial establishments as planning elements.
The implementation of urban sustainability indicators as a territorial planning tool linked to GIS tools would objectively facilitate the application of measures to promote an improvement in the citizens’ quality of life. The intention is to turn the city into a more habitable space in which the maximum efficiency of the urban system is achieved, especially in those neighborhoods that obtain results that are not within the minimum parameters. The incorporation of urban sustainability indicators as a tool to help assess the evolution and achievement of the objectives and goals proposed [
74] in urban development strategies is considered the main purpose of this research.
In summary, it should be mentioned that this research has attempted to obtain information on those neighborhoods in which it is necessary to alleviate the problems that arise in the daily life of their inhabitants, in order to achieve greater social cohesion and successful management of the city. It is considered that the application of GIS techniques in combination with the sources of information provided by the public administrations and the methodology of calculation through urban indicators is an invaluable source of information for the local manager, becoming a real planning tool in medium-sized cities, as it allows the establishment of appropriate guidelines for action in the case of inadequate sustainability. However, one of the main limitations of this methodology is the need to have a considerable amount of initial data to carry out the research (based on access to basic digitalized cartography in different formats), as well as to know the exact location of the different municipal services to be analyzed in each indicator to consider the study feasible. One of the aspects that can be taken into account for future lines of work is the use of indicators of natural hazards for urban areas, as well as studies that have been carried out [
75], which can help to prevent the different risks that the city of Cáceres may suffer in this case.
5. Conclusions
The main objective of this study was to analyze and identify which neighborhoods in the city of Cáceres are within the minimum standards of urban sustainability established in the Law on Sustainable Land and Urban Planning of Extremadura, with the aim of being able to detect existing problems in the city in terms of territorial planning and to transfer this knowledge to the local administration so that it can be used to support public decision-making. In the results obtained, there are large differences between the neighborhoods in the city’s interior and those located in the periphery. The neighborhoods located in the central district show urban sustainability values that are within the minimum standards in most of the indicators used in the research. As for the peripheral areas, values well below the appropriate standards of urban sustainability are observed in indicators such as urban population density, housing density, accessibility to public facilities and compactness of buildings. The results obtained for these neighborhoods are characteristic of the diffuse city model, where there is a high consumption of land (the typology of buildings is based on single-family dwellings).
Focusing on the calculation of the urban sponginess coefficient, a change begins to be observed, with the central areas of Cáceres obtaining values below the minimum standards and, on the contrary, in the peripheral neighborhoods there is a higher availability of buildable land (these are areas where new urban developments are being carried out in the city). The rest of the indicators used show data that are unevenly distributed throughout the city, except for the cultural heritage indicator, where the values are in line with urban sustainability in the neighborhoods surrounding the monumental city. It should be noted that GIS tools have proved to be the ideal complement in the calculation and obtaining of the results of the urban sustainability analysis of this article, as their use has allowed a notable improvement in the development of the diagnosis, interpretation and visualization of data through maps.


