Article

Spatial Interaction Analysis of Shared Bicycles Mobility Regularity and Determinants: A Case Study of Six Main Districts, Beijing

School of Geomatics and Urban Spatial Informatics, Beijing University of Civil Engineering and Architecture, Beijing 102616, China
*
Author to whom correspondence should be addressed.
ISPRS Int. J. Geo-Inf. 2022, 11(9), 477; https://doi.org/10.3390/ijgi11090477
Submission received: 24 May 2022 / Revised: 21 August 2022 / Accepted: 25 August 2022 / Published: 2 September 2022

Abstract

:
Understanding the regularity and determinants of mobility is indispensable for the reasonable deployment of shared bicycles and urban planning. A spatial interaction network covering streets in Beijing’s six main districts, using bike sharing data, is constructed and analyzed. as Additionally, the exponential random graph model (ERGM) is used to interpret the influencing factors of the network structure and the mobility regularity. The characteristics of the spatial interaction network structure and temporal characteristics between weekdays and weekends show the following: the network structure on weekdays is obvious; the flow edge is always between adjacent blocks; the traffic flow frequently changes and clusters; the network structure on weekends is more complex, showing scattering and seldom changing; and there is a stronger interaction between blocks. Additionally, the predicted result of the ERGM shows that the influencing factors selected in this paper are positively correlated with the spatial interaction network. Among them, the three most important determinants are building density, housing prices and the number of residential areas. Additionally, the determinant of financial services shows greater effects on weekdays than weekends.

1. Introduction

Since 2014, the use of shared bicycles has gradually increased, becoming a new type of “Internet + sharing” travel pattern. Especially after the COVID-19 pandemic, the bike sharing system (BSS) has gradually become one of the most widespread and popular shared and sustainable mobility systems [1,2,3], providing a viable alternative mode of transport for short or medium urban distances [4]. The BSS is generally equipped with positioning devices to record location in real time, contributing much data for urban flow analysis in cities [5,6]. The current bike sharing system still cannot successfully solve the problem of rebalancing [7,8,9,10,11]. During peak periods, areas with a high demand for shared bicycles tend to suffer from low supply [12]. In areas with low demand, shared bicycles constitute a large amount of urban resources that cannot be used. The key to the success of shared bicycles lies in whether they can meet the needs of users, and the driving factors of these needs [13]. Since the establishment of the BSS around the world, in order to improve the BSS and solve the demand problem, many studies had focused on travel behavior, the regularity of shared bicycle use in cities, the spatiotemporal pattern, travel demand and influencing factors [14,15,16]. Therefore, this paper focuses on the travel rules and influencing factors of shared bicycles.
Research on the influencing factors of population migration between cities or regions is important in the fields of urban economics, regional economics and geographical economics [17,18,19,20]. Although the use of shared bicycles is also a form of urban travel behavior, their influencing factors are quite different to those of population migration and other such ways. At present, much research has focused on the influencing factors of shared bicycle travel [21,22,23], and showed that the travel pattern of the shared bicycles has obvious spatiotemporal characteristics and different determinants; a variety of factors, including weather, built environment, land use, public transport, station levels, socio-demographic factors, time factors, and safety, all play a role [14]. Among them, convenience is the most important factor [24,25], population density [26,27], flow conditions, temporal characteristics and weather [28] are factors also having an impact. Different areas such as rail transit stations, railway-stations, and the built environment around the stations are also the main influencing factors [29]. Factors such as campus characteristics, time factors, and weather events have a positive impact on campus bike-sharing travel [28]. Convenience facilities are found to have a positive impact at public places such as public transportation centers, entertainment centers, and coffee shops [30]. The previous studies show that the influencing factors of shared bicycles are indispensable for improving the BBS and guiding the reasonable layout of bicycles. At present, the research on the influencing factors of shared bicycles mostly adopts regression analysis and correlation analysis methods [22,23,24,25,26,27,28,29,30]. Although these methods can qualitatively and quantitatively analyze the effects of various factors, it is difficult to study their effects on the interaction between regions by taking the properties of regions as factors.
In addition, the city flow can be divided into daily flow (weekday flow), rest day flow and other flow [31]. Due to the large difference in travel purposes between weekdays and weekends, the traffic attributes of these two periods are completely different, and the spatial agglomeration characteristics of residents and the population’s center of gravity are also different [32,33]. Therefore, the differences in the travel regularities of shared bikes and the influencing factors of different periods should also be paid attention to [34], i.e., the travel regularity of shared bikes at weekdays and weekends (holidays). The model without consideration of different periods is not so applicable for accurate spatiotemporal analysis. Researchers found obvious differences in shared bicycles’ travel patterns, time concentration [21] and travel distance [35] on weekdays and weekends. Seasonal differences in flow profiles were identified for each day of the week [36]. Therefore, a comparative study of travel behavior based on weekdays and weekends (holidays) can reveal the characteristics of travel behavior at different periods, in order to explore residents’ travel regularity. However, the current research on the differences in the utilization of shared bicycle between weekdays and weekends mostly focuses on the regularities of the travel flow [34,36,37,38], while a few of them described and analyzed the spatiotemporal variation of the influencing factors. By analyzing the impact of different factors on shared bicycles at different times, we can better understand and improve BSS from a new perspective. In order to improve the shortcomings of previous research, we innovatively construct a complex network model based on shared bicycle trip data and use the network statistical model. From the perspective of the network, we conduct an overall analysis of the shared bicycle system in the city, and qualitatively and quantitatively analyze the travel patterns and influencing factors of shared bicycles in different periods within the same week.
Since the 1970s, network science has undergone rapid development [39]. With the applications of complex network theory in many fields such as biology [40] and social science [41], urban and regional networks have also attracted widespread attention [42,43,44]. Public travel activities among regions can be used to construct a typical directed weighted spatial network, so that the travel behavior in different regions can be revealed from the constructed spatial network. There are many methods of analysis of the spatial interaction network, including characteristics and statistics analysis of the network, directed weighted network statistical analysis [45], network centrality theory [46], community detection theory [18,47] and network prediction analysis. The vertexes relationship of a network can be predicted and analyzed from the constructed statistical network model and its attributes. According to the complexity of the network model, the statistical network model can be divided into the simple random graph model [48], dyadic independence model [49], dyadic dependence model [50] and high-order dependence model [51]. The differences between observation networks and randomly occurring networks can be explained by the network statistics and modeling. The weights of network member attributes and global characteristics are used to determine the degree of influence of each factor. Complex network theory enriches the methodology of research on shared bicycle travel behavior. Hence, network theory is introduced into the study of the travel regularities of shared bicycles in cities [52,53]. By studying the travel network, geographical divisions of shared bicycles can be found between areas with different degrees of demand [52], with a correlation between the flow strength and point-of-interest (POI) [53]. The research areas of the city are divided into different areas according to the required spatial scale, and areas are regarded as nodes of the network graph. Different from previous research methods, the complex network structure is constructed by travel activities such as shared bicycles between areas. The network regards the region as an independent individual in the system, and the research on travel laws and influencing factors is based on this independent unit of the region. Therefore, the method can comprehensively consider and analyze the internal factors of the region, which helps optimization from the perspective of the entire network, and directly serves the development and construction of the region.
As one of the biggest cities in the world, Beijing has a huge population. As of September 2021, the total number of shared bicycles in Beijing reached 941,000 [54]. In Beijing, the six administrative districts of Xicheng, Dongcheng, Chaoyang, Haidian, Fengtai and Shijingshan are collectively referred to as the Urban Six Districts. Approximately 60% of Beijing’s total population and nearly 70% of its industries are located in the Urban Six Districts of Beijing, and it is the capital’s core functional area. The Urban Six Districts have a vast area and a huge population, which makes the flow of people complex, with the characteristics of long range, long time and multiple methods of transport. Particularly during the peak hours of weekdays, serious road congestion causes shared bicycle travel to have a completely different spatiotemporal pattern and regularity compared with other countries and regions. Coupled with the impact of COVID-19 on people’s travel patterns, it is urgent to study the travel regularity of shared bicycles and their influencing factors. Not only will such studies reveal important practical values of the rational layout of shared bicycles, and good related policies, but they will also provide an important reference for the construction of BSS in other cities. With the process of urbanization, administrative division is always studied at the spatial scale of street blocks. Hence, street blocks are used as the basic research units, which can directly provide suggestions for the decision making and planning of the street-related management departments. All instances of “streets” in this paper refer to the administrative division unit of street blocks.
For this reason, three problems are proposed and resolved in this paper. How can we explore the spatial characteristics and geometric structure of shared bicycles traveling between streets from the perspective of the network model? What are the influencing factors of the inter-street shared bicycle travel network in the Urban Six Districts of Beijing? What are the differences between the travel patterns of shared bicycles on weekdays and weekends? To solve these problems, this paper attempts to (i) analyze the structure of the shared bicycles’ network and analyze its regularity; (ii) construct the exponential random graph model (ERGM), combining pure network structure variables and node attribute variables, and explore the core influencing factors affecting the formation of shared bicycle travel networks within the Urban Six Districts of Beijing; and (iii) analyze the spatiotemporal characteristics and influencing factors of shared bicycle travel behavior during weekdays and weekends.
This paper is organized as follows: the research area and data sources, the principles of network construction, and the indicators for the ERGM model are introduced in the second part, and the network structure and indicators are analyzed in the third part. The conclusions and a discussion are given in the fourth part.

2. Materials and Methods

2.1. Research Data

Six districts of Beijing (Dongcheng, Xicheng, Haidian, Fengtai, Shijingshan, and Chaoyang) were chosen as the basic research areas. Due to the limitation of the operating area of shared bicycles, the research area chosen in this paper was the area in which the six districts of Beijing intersect with the operating area of shared bicycles. A total of 122 street-level administrative units of this area were selected as the research units (in Figure 1b the specified intersected research area is extracted). Two types of data sources were used (see Table 1):
(1)
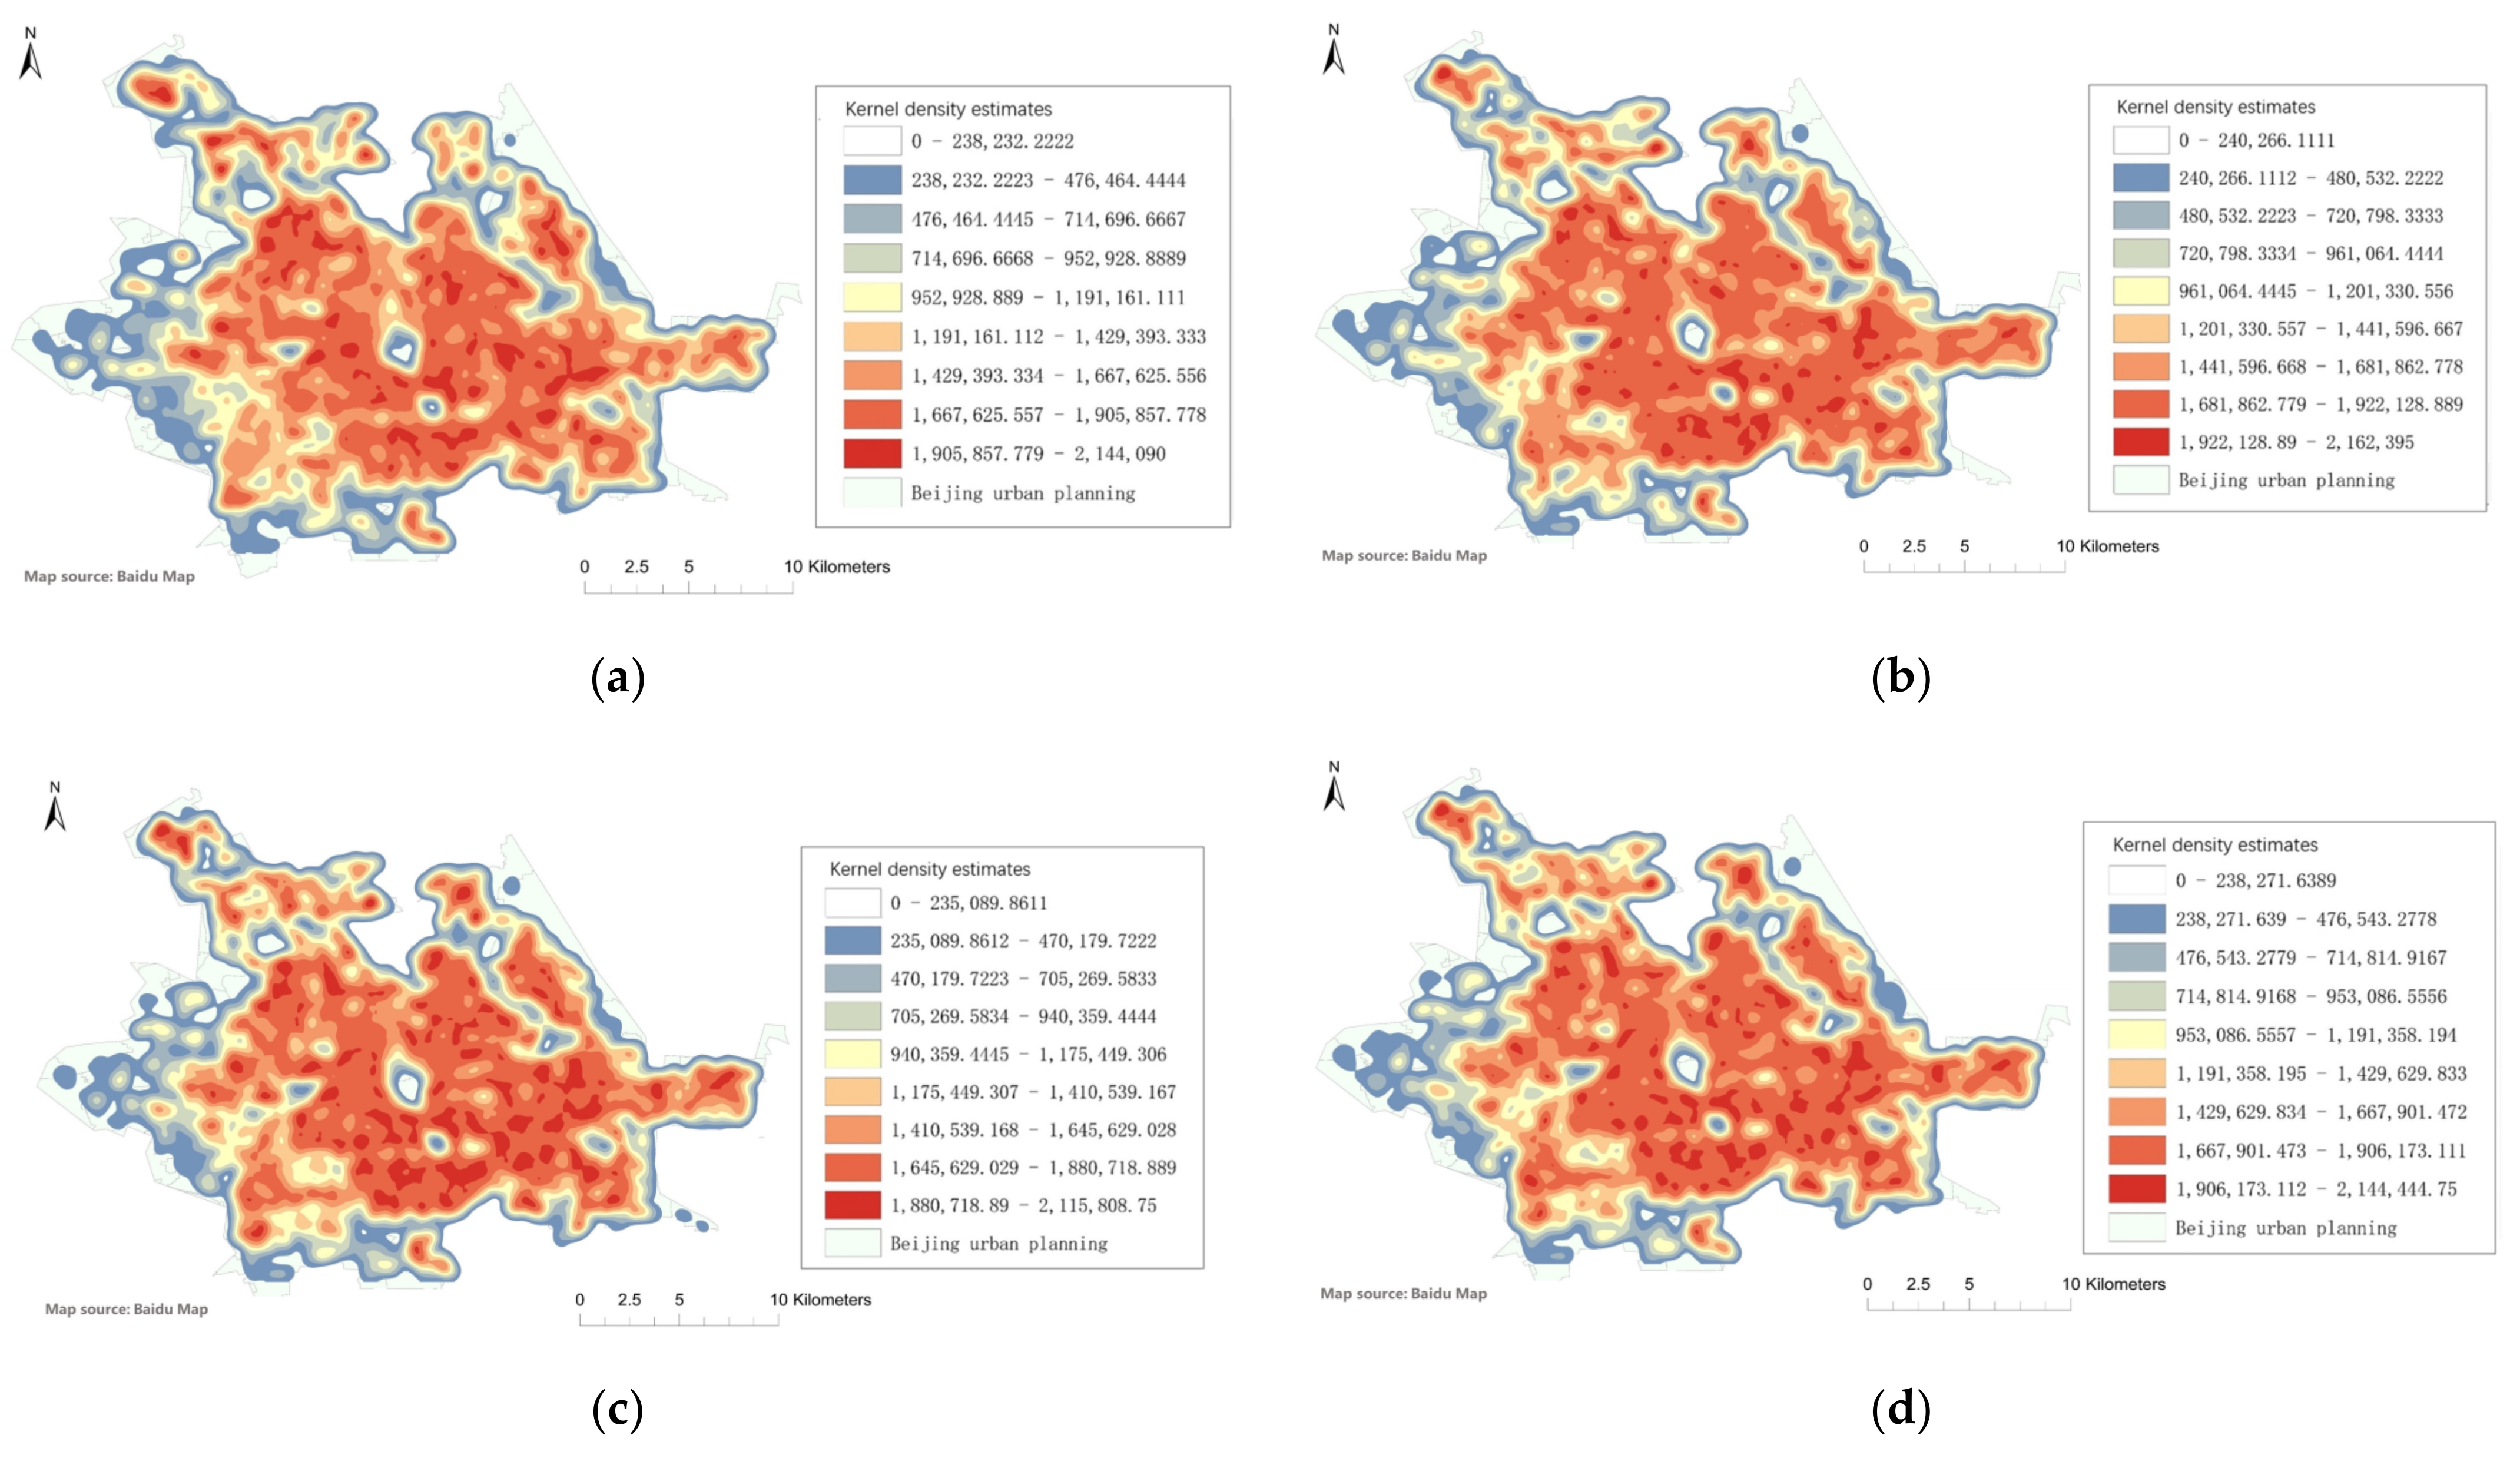
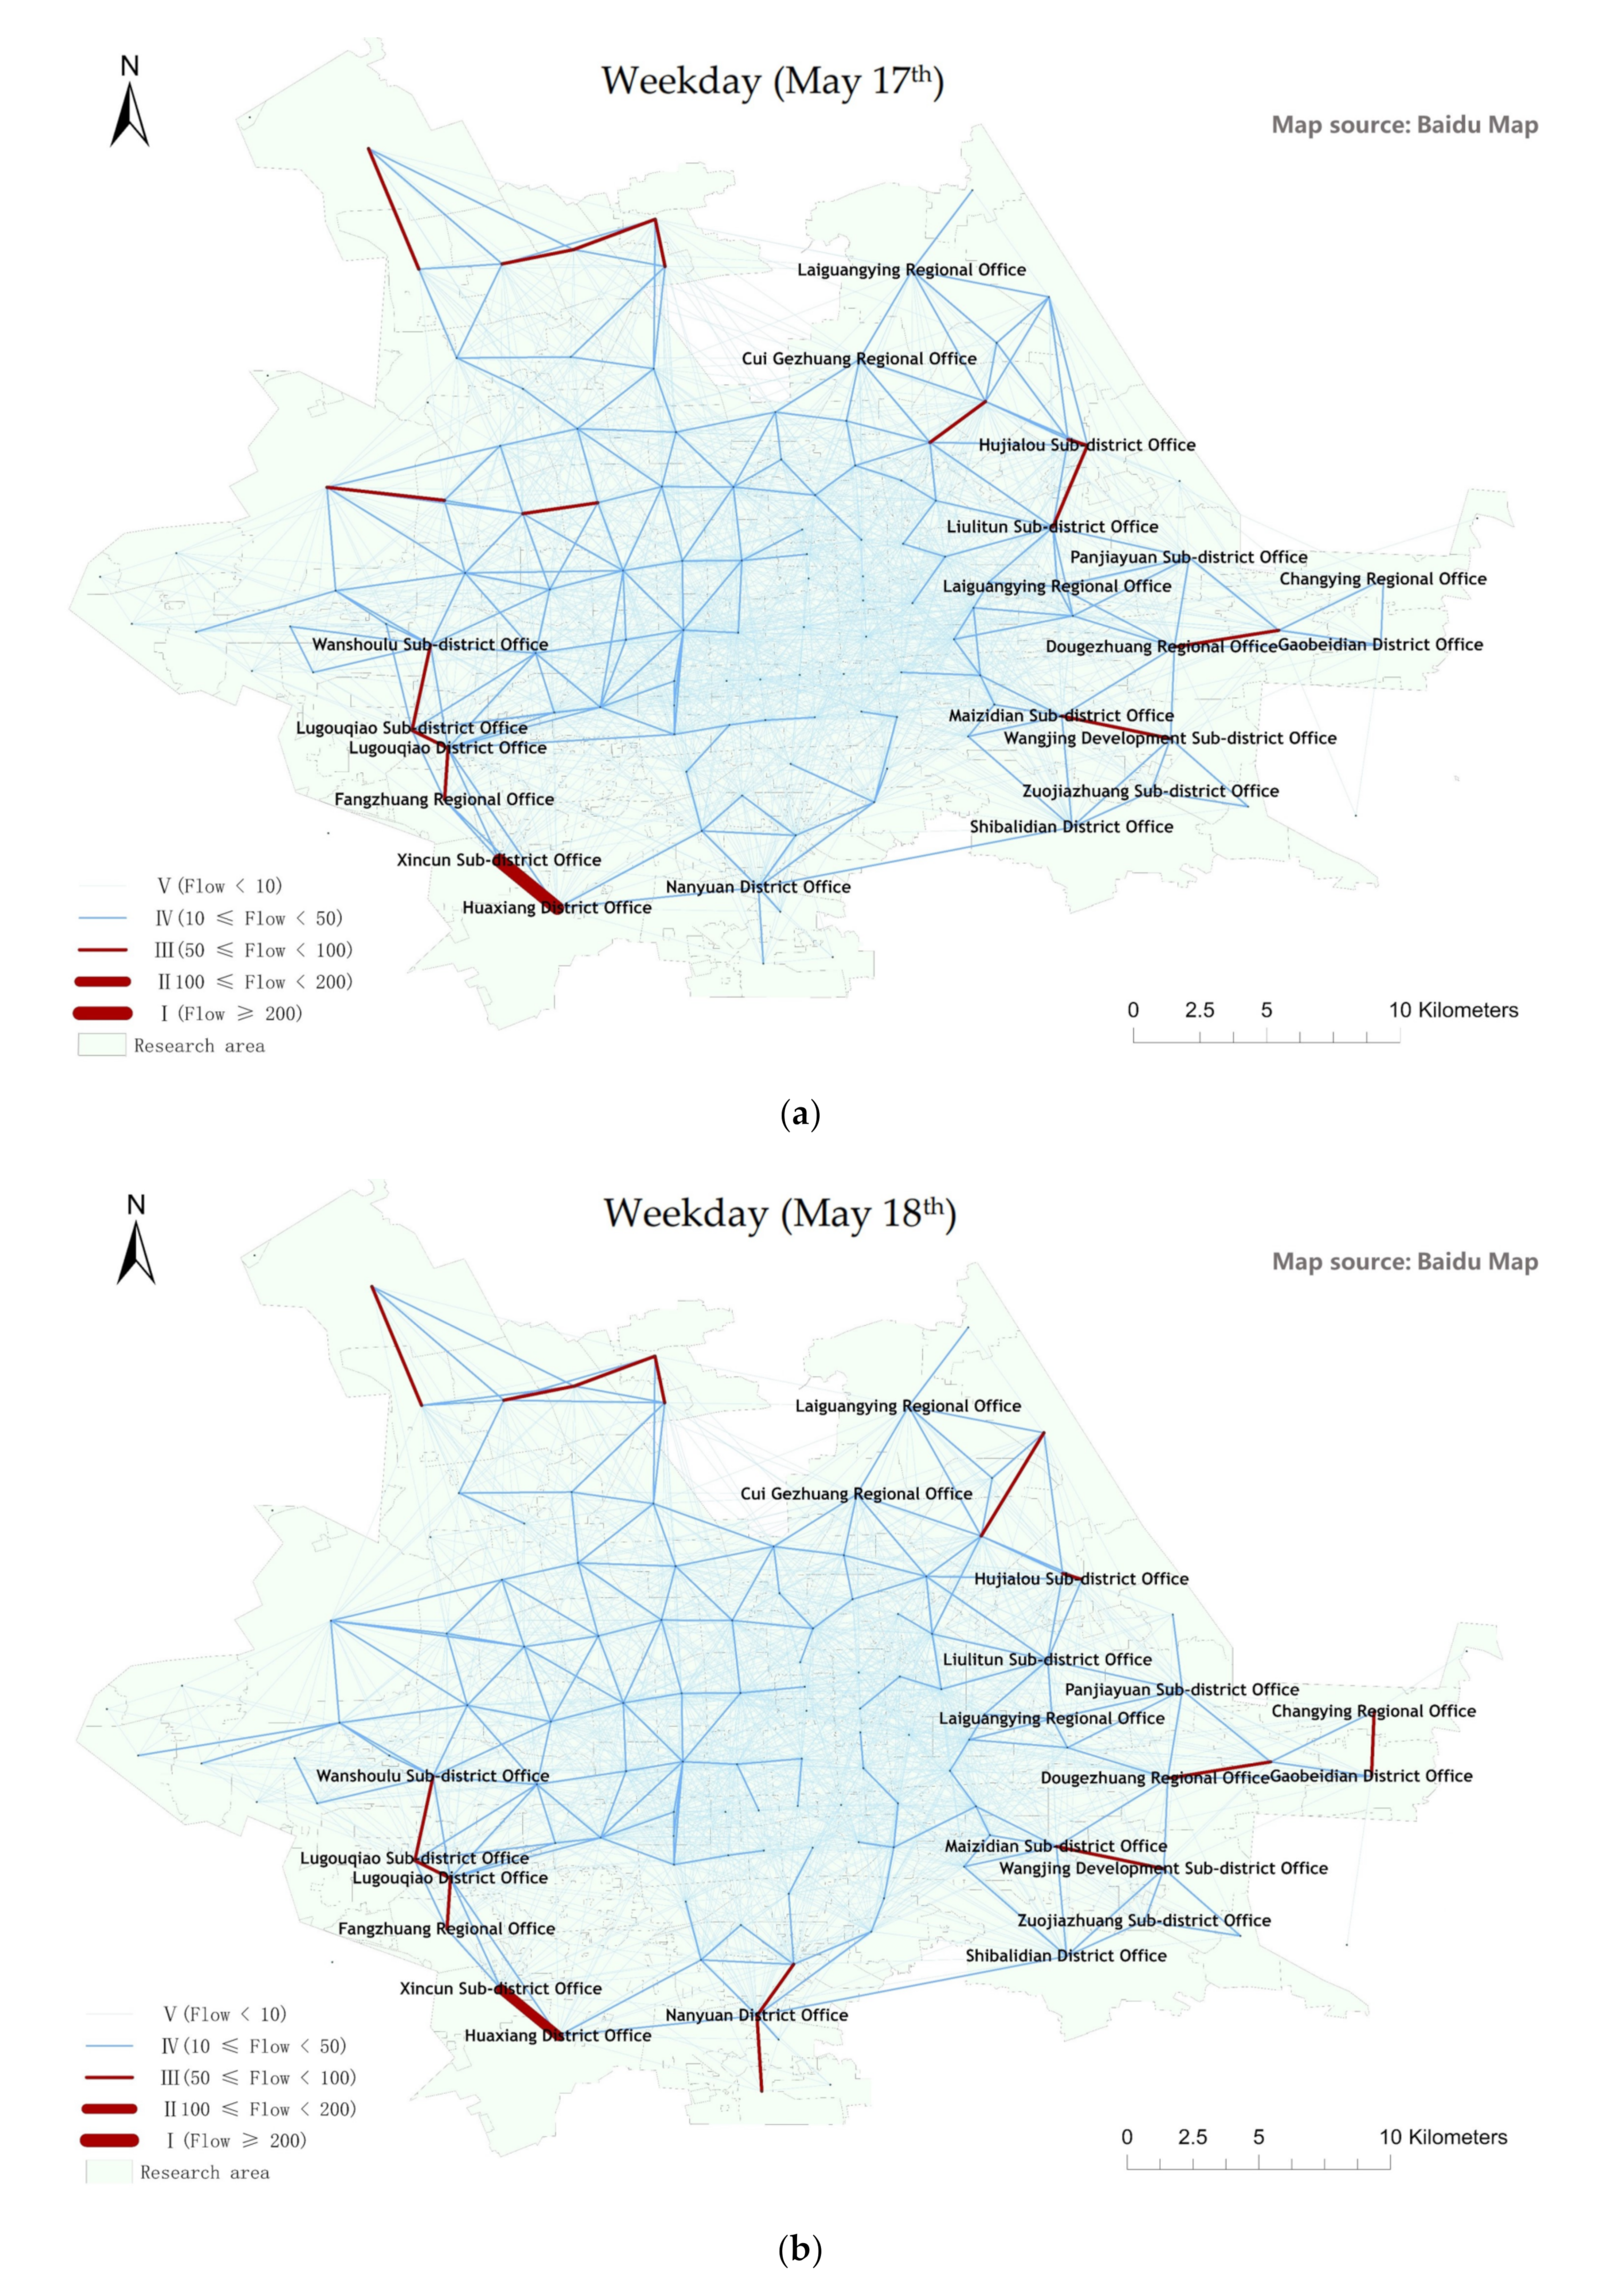
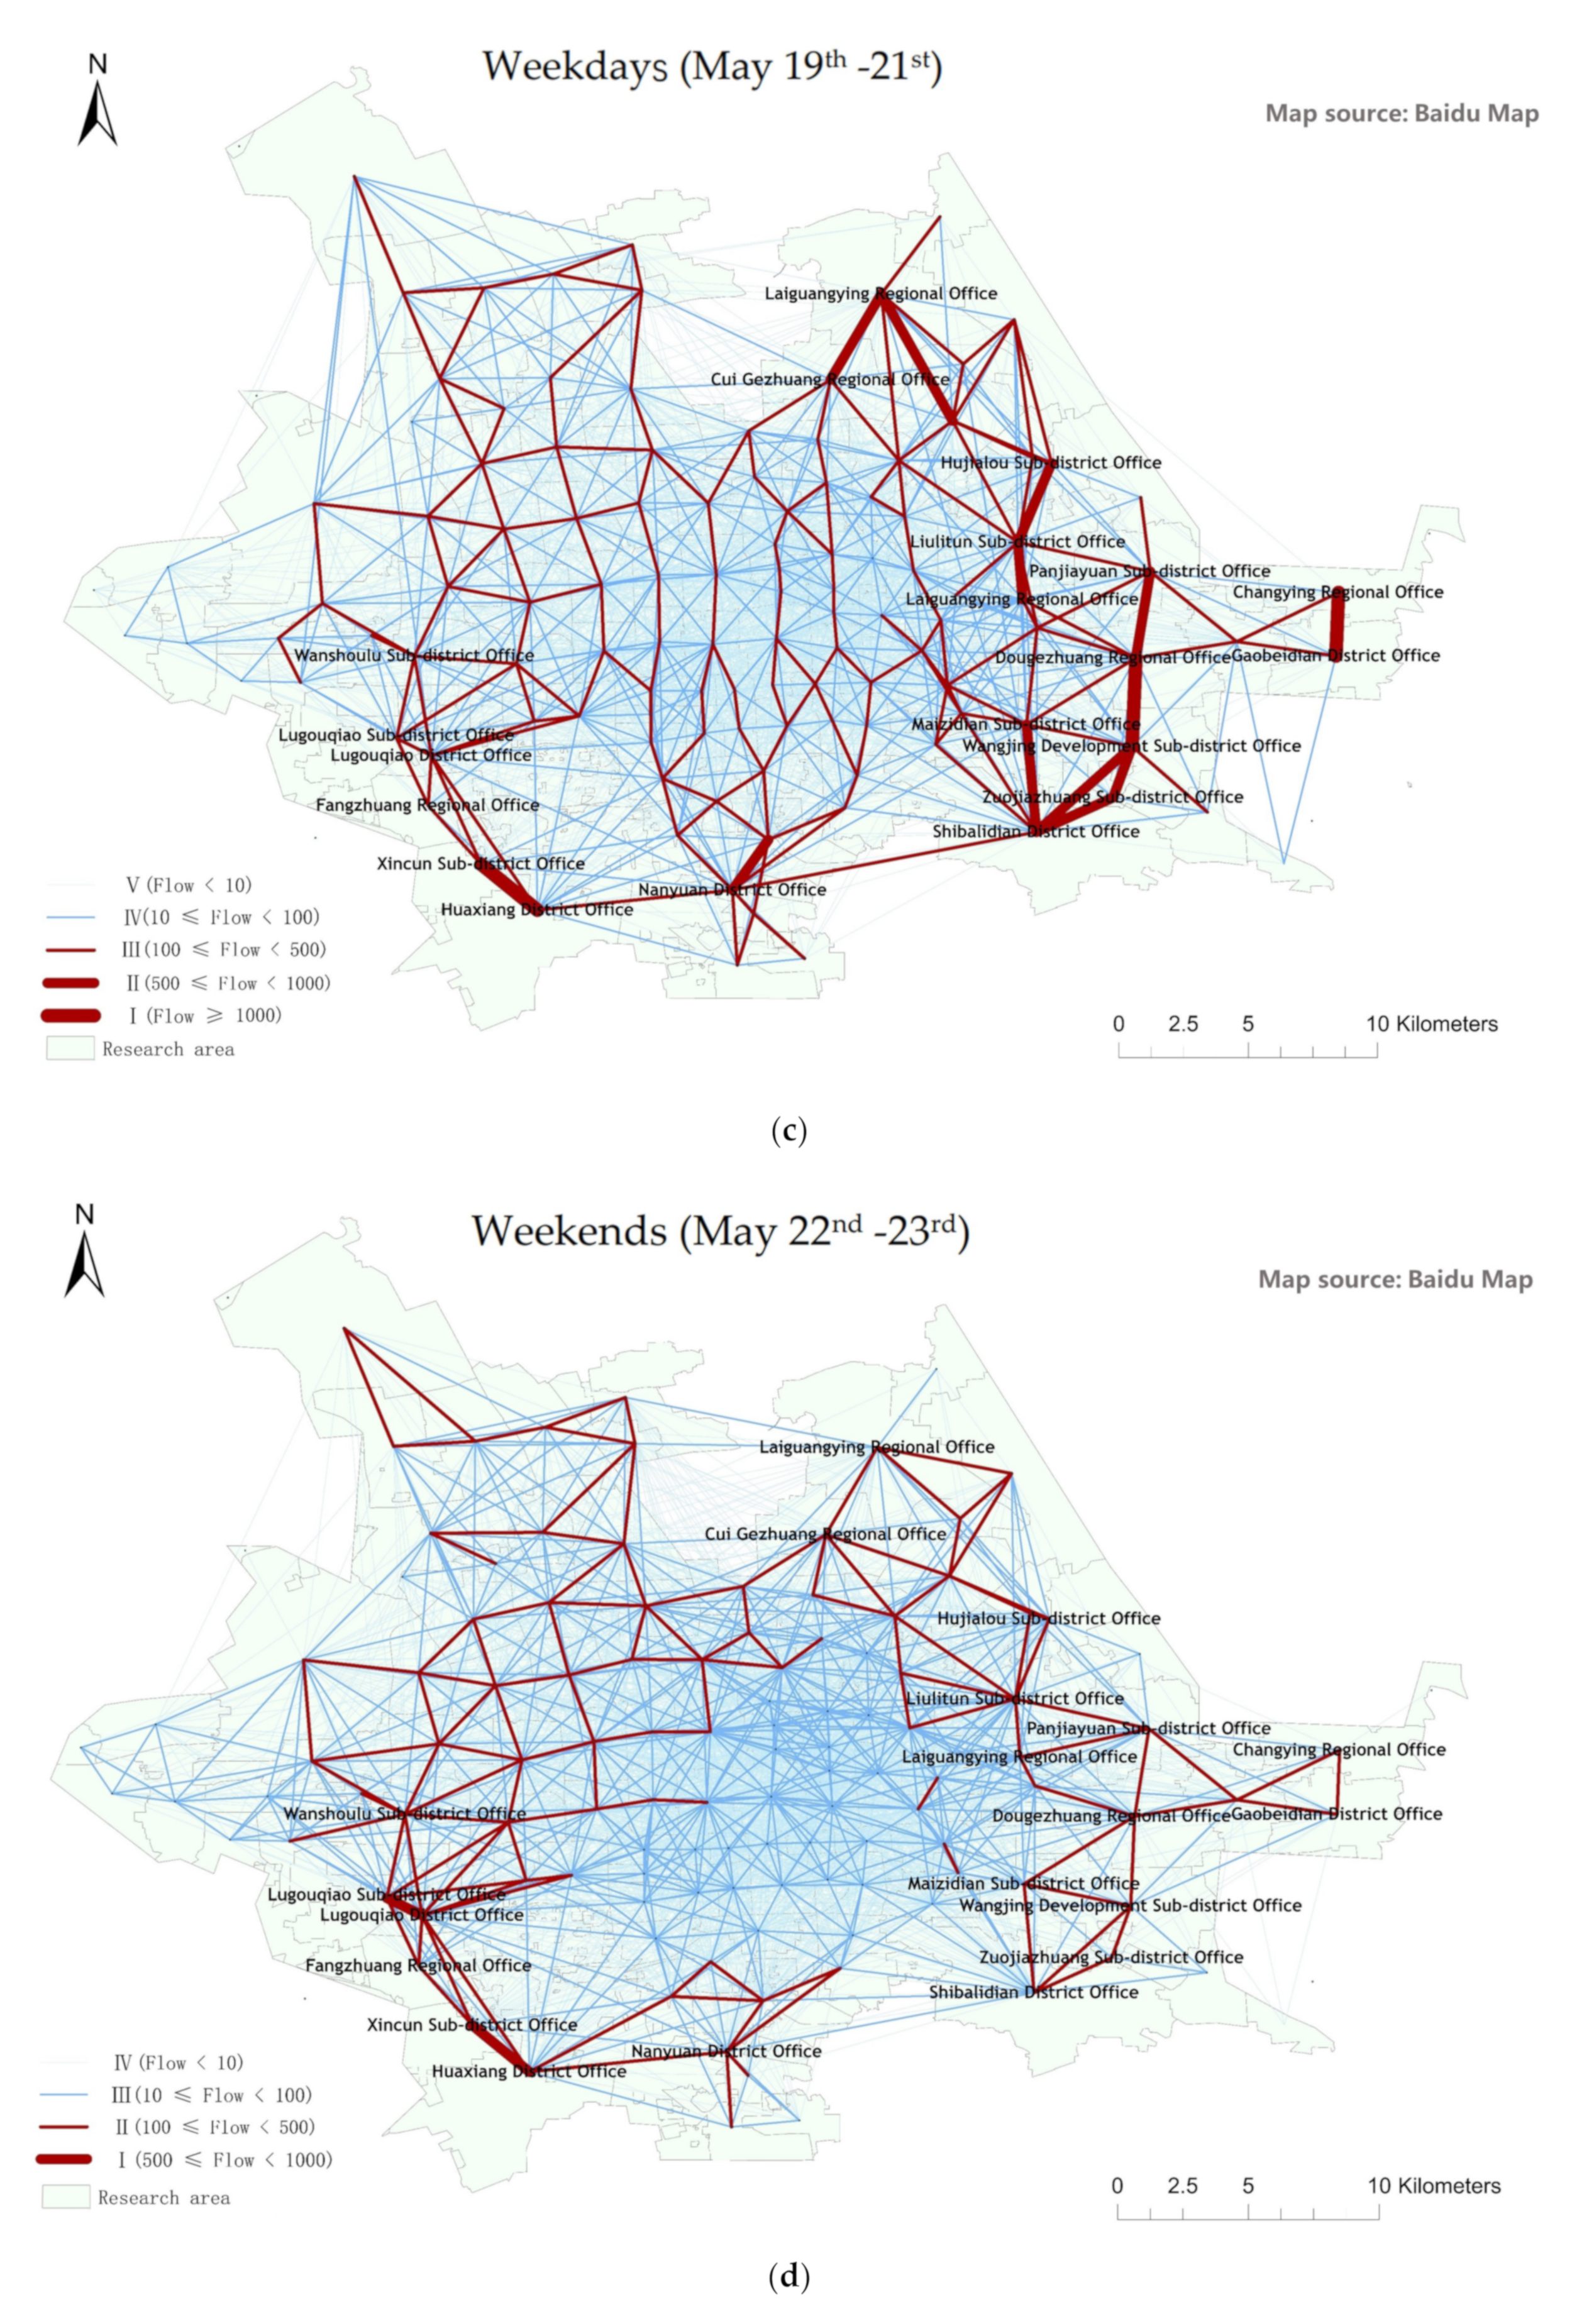
Shared bicycle data: The shared bicycle data used in this paper is enterprise cooperation data, with the attributes of bicycle ID number, time, and the longitude and latitude of the bicycle. The data collection time interval was 3 h, and these two points of collected data were correlated with the ID number of the bicycle. The starting and ending points of each bicycle were obtained to generate a trajectory. Taking into account the impact of the new crown pneumonia epidemic, the data collection period was from early May to mid-to-late August. During this period, the epidemic situation in various regions of China, especially Beijing, was relatively optimistic, and the impact on travel was small, with residents being more willing to use shared bicycles to travel. Screening the existing data: First, in the existing data, abnormal data (such as rain, high temperature, etc.) were removed. Then, the pre-experiment of the data was carried out. The experimental results show that the distribution of shared bicycles on each weekday or weekend in the same week is basically stable, and the distribution of different weeks shows seasonal fluctuations on a weekly basis. Finally, after excluding the data of abnormal day (such as the day with rain, high temperature, etc.), Among the remaining data of 17 May 2021 to 23 May 2021 is a week with continuous date series and continuous data records, and it conforms to the general rule of bicycle distribution; 17 May to 21 May are weekdays, and 22 May and 23 May are weekends. In order to compare the difference between weekdays and weekends, the working days were divided into three parts for a better analysis of the travel regularities: the period of 17 May, the period of 18 May and the period of 19 to 21 May. We divide the data of weekdays in this way, on the one hand, to make the data of weekdays and weekends continuous, on the other hand, Monday is often the busiest day of the week in China, the regularity of the day is important for the travel pattern analysis of a week. Additionally, the number of data collection intervals on 17 and 18 May are the same, and the number of data collection intervals on 19 and 21 May and 22 to 23 are the same. Because 17:00 and 20:00 are the start and end time of the evening rush hour on weekdays, the data of this period of a day are chosen to show the spatial distribution characteristics of the shared bikes. Meanwhile in order to compare the differences of the distribution of shared bicycles on weekdays and weekends, we chose one day on weekdays and weekends to display the distribution rules of the shared bicycles. The results of the kernel density analysis of shared bicycles’ spatial distribution are shown in the figure below (Figure 2).
(2)
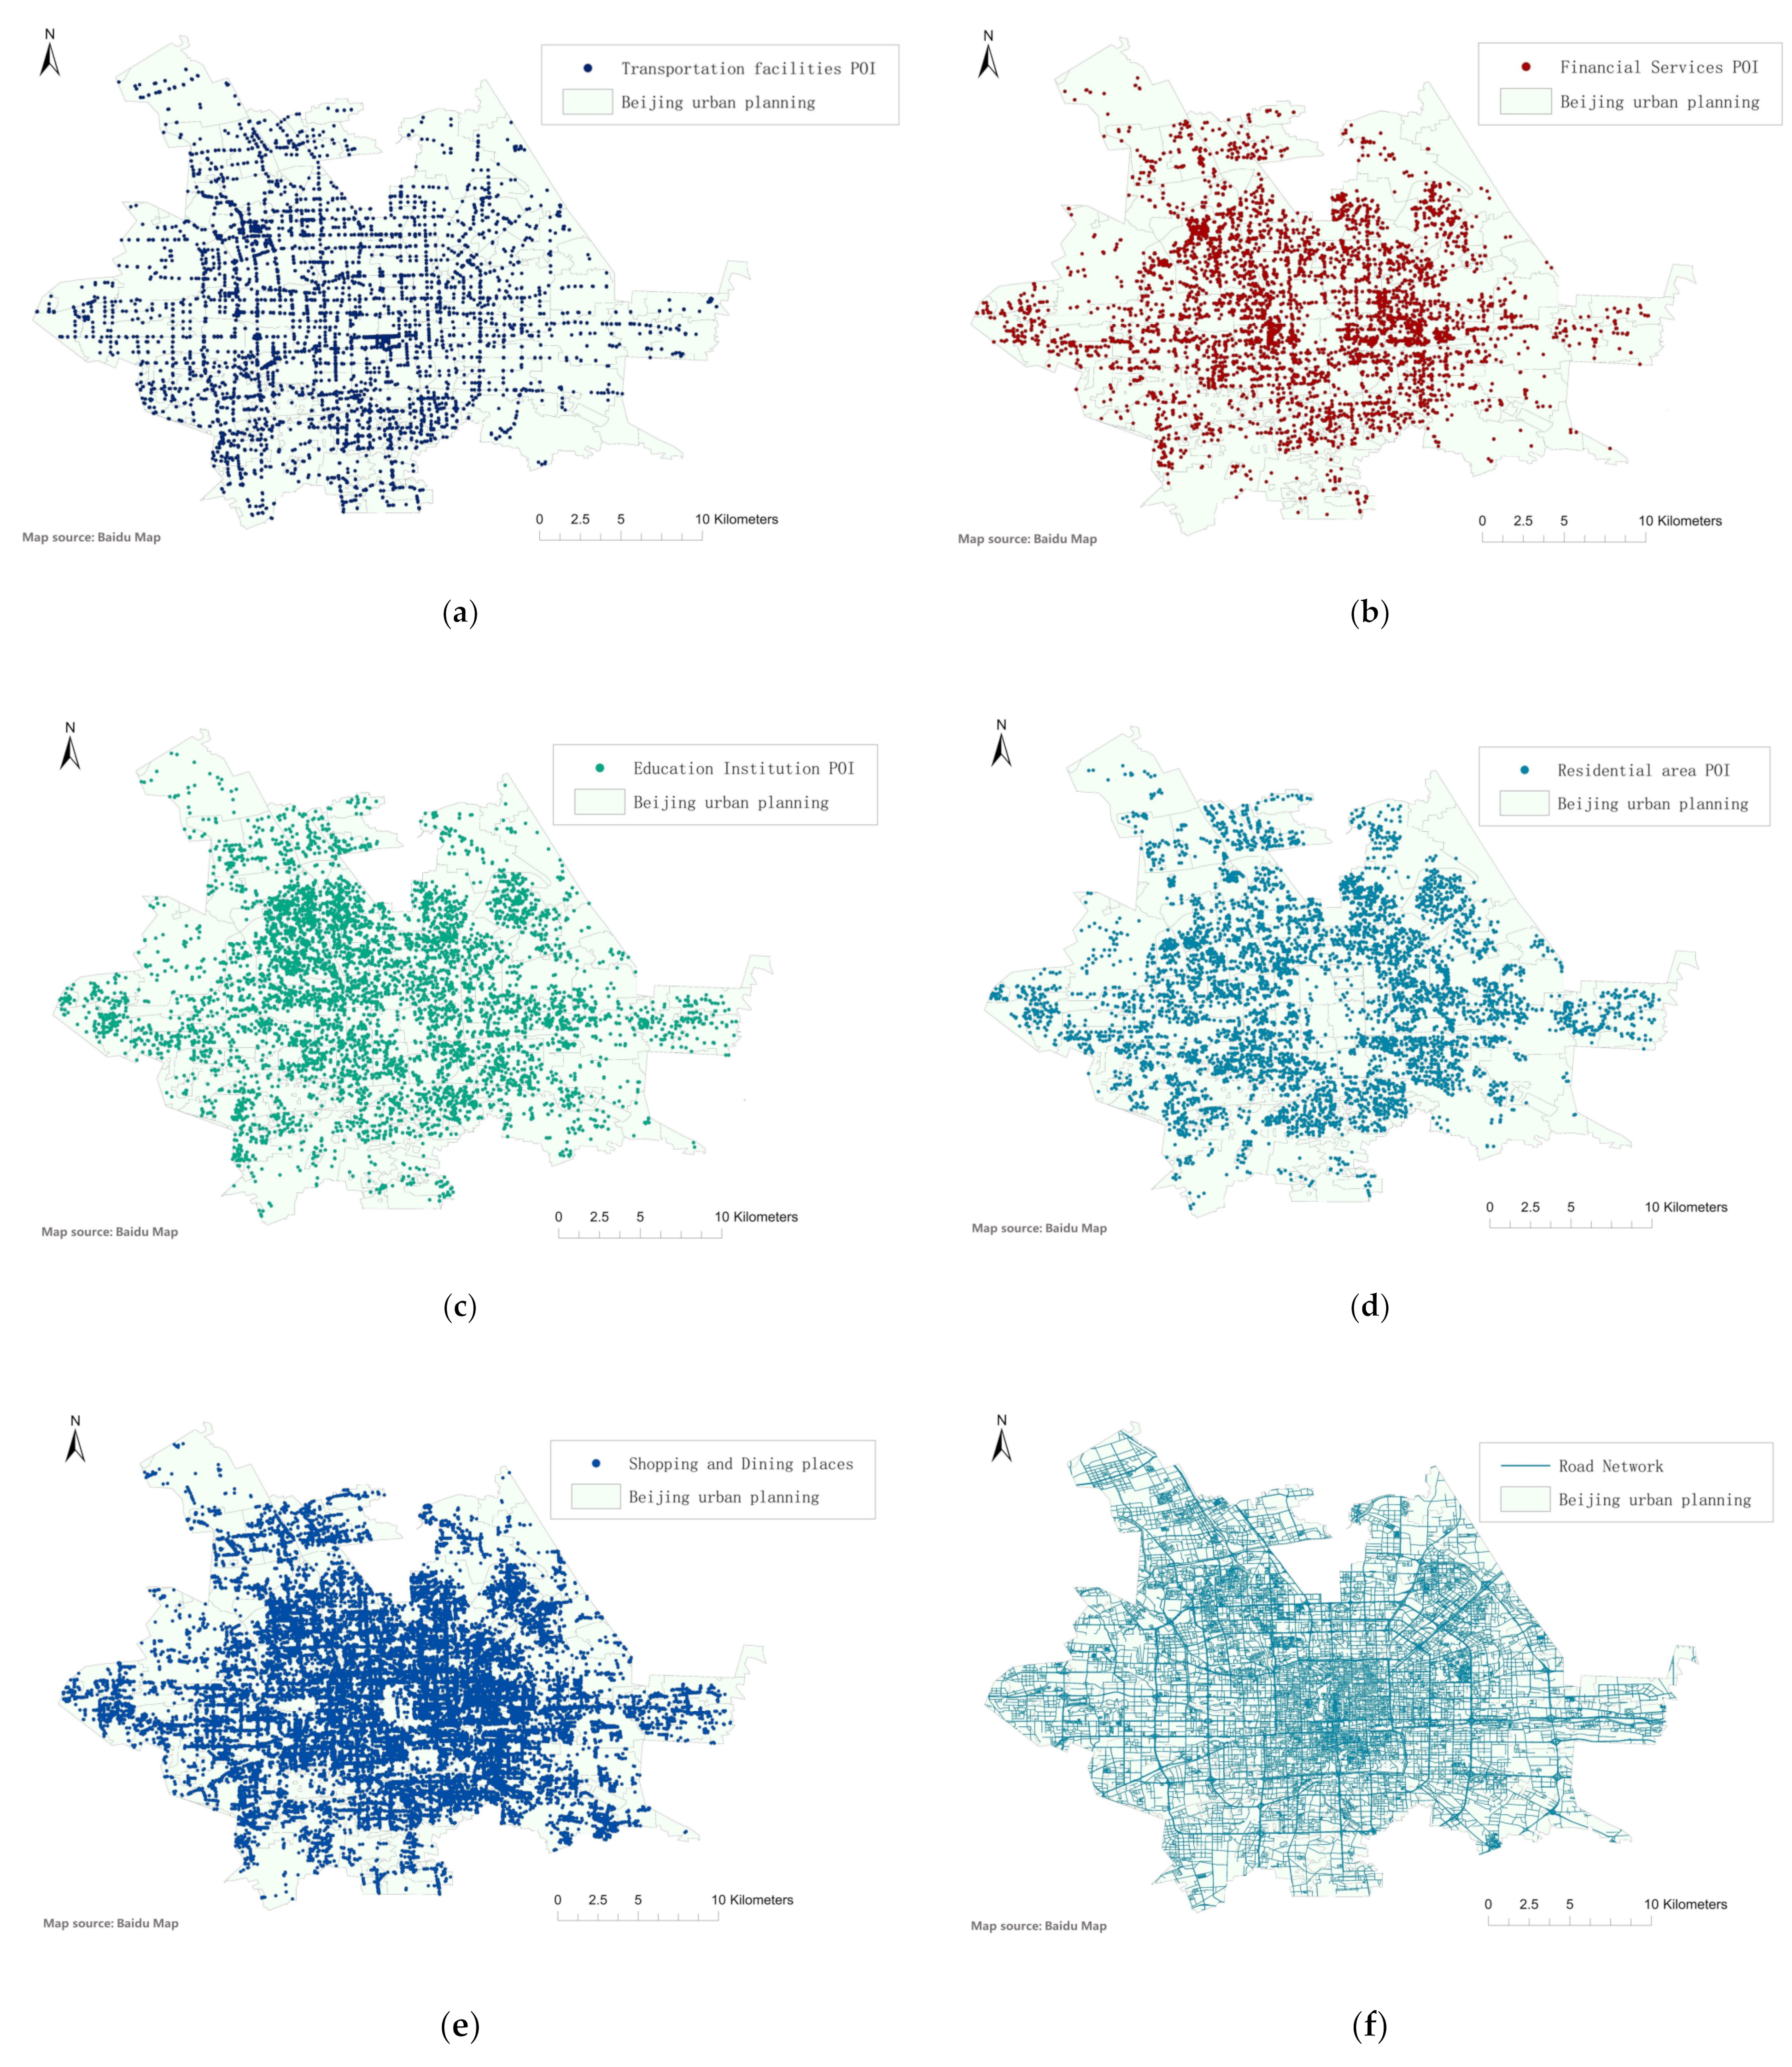
Other data: With the rapid development of electronic maps and location-based services, points of interests (POIs) have been continuously enriched and improved. POIs have the attributes of spatial information, such as latitude, longitude, and address, and other information, such as names and category. POIs can reflect the distribution of various facilities and institutions and are used in this paper, including attributes such as transportation facilities, financial services, residential areas, shopping, catering, and education institution (Figure 3a–e). The main types of POI spatial distribution are shown in the figure below. Besides POI data, road net-work data (including urban expressways, subways, expressways, national roads, provincial roads, county roads, and nine-level roads, etc.), building data and the housing prices of each street block are used as indicators of the travel patterns of shared bicycles in this paper (Figure 3f). The data of the above content can also be downloaded from https://master.apis.dev.openstreetmap.org (accessed on 26 April 2021).

2.2. Research Methods

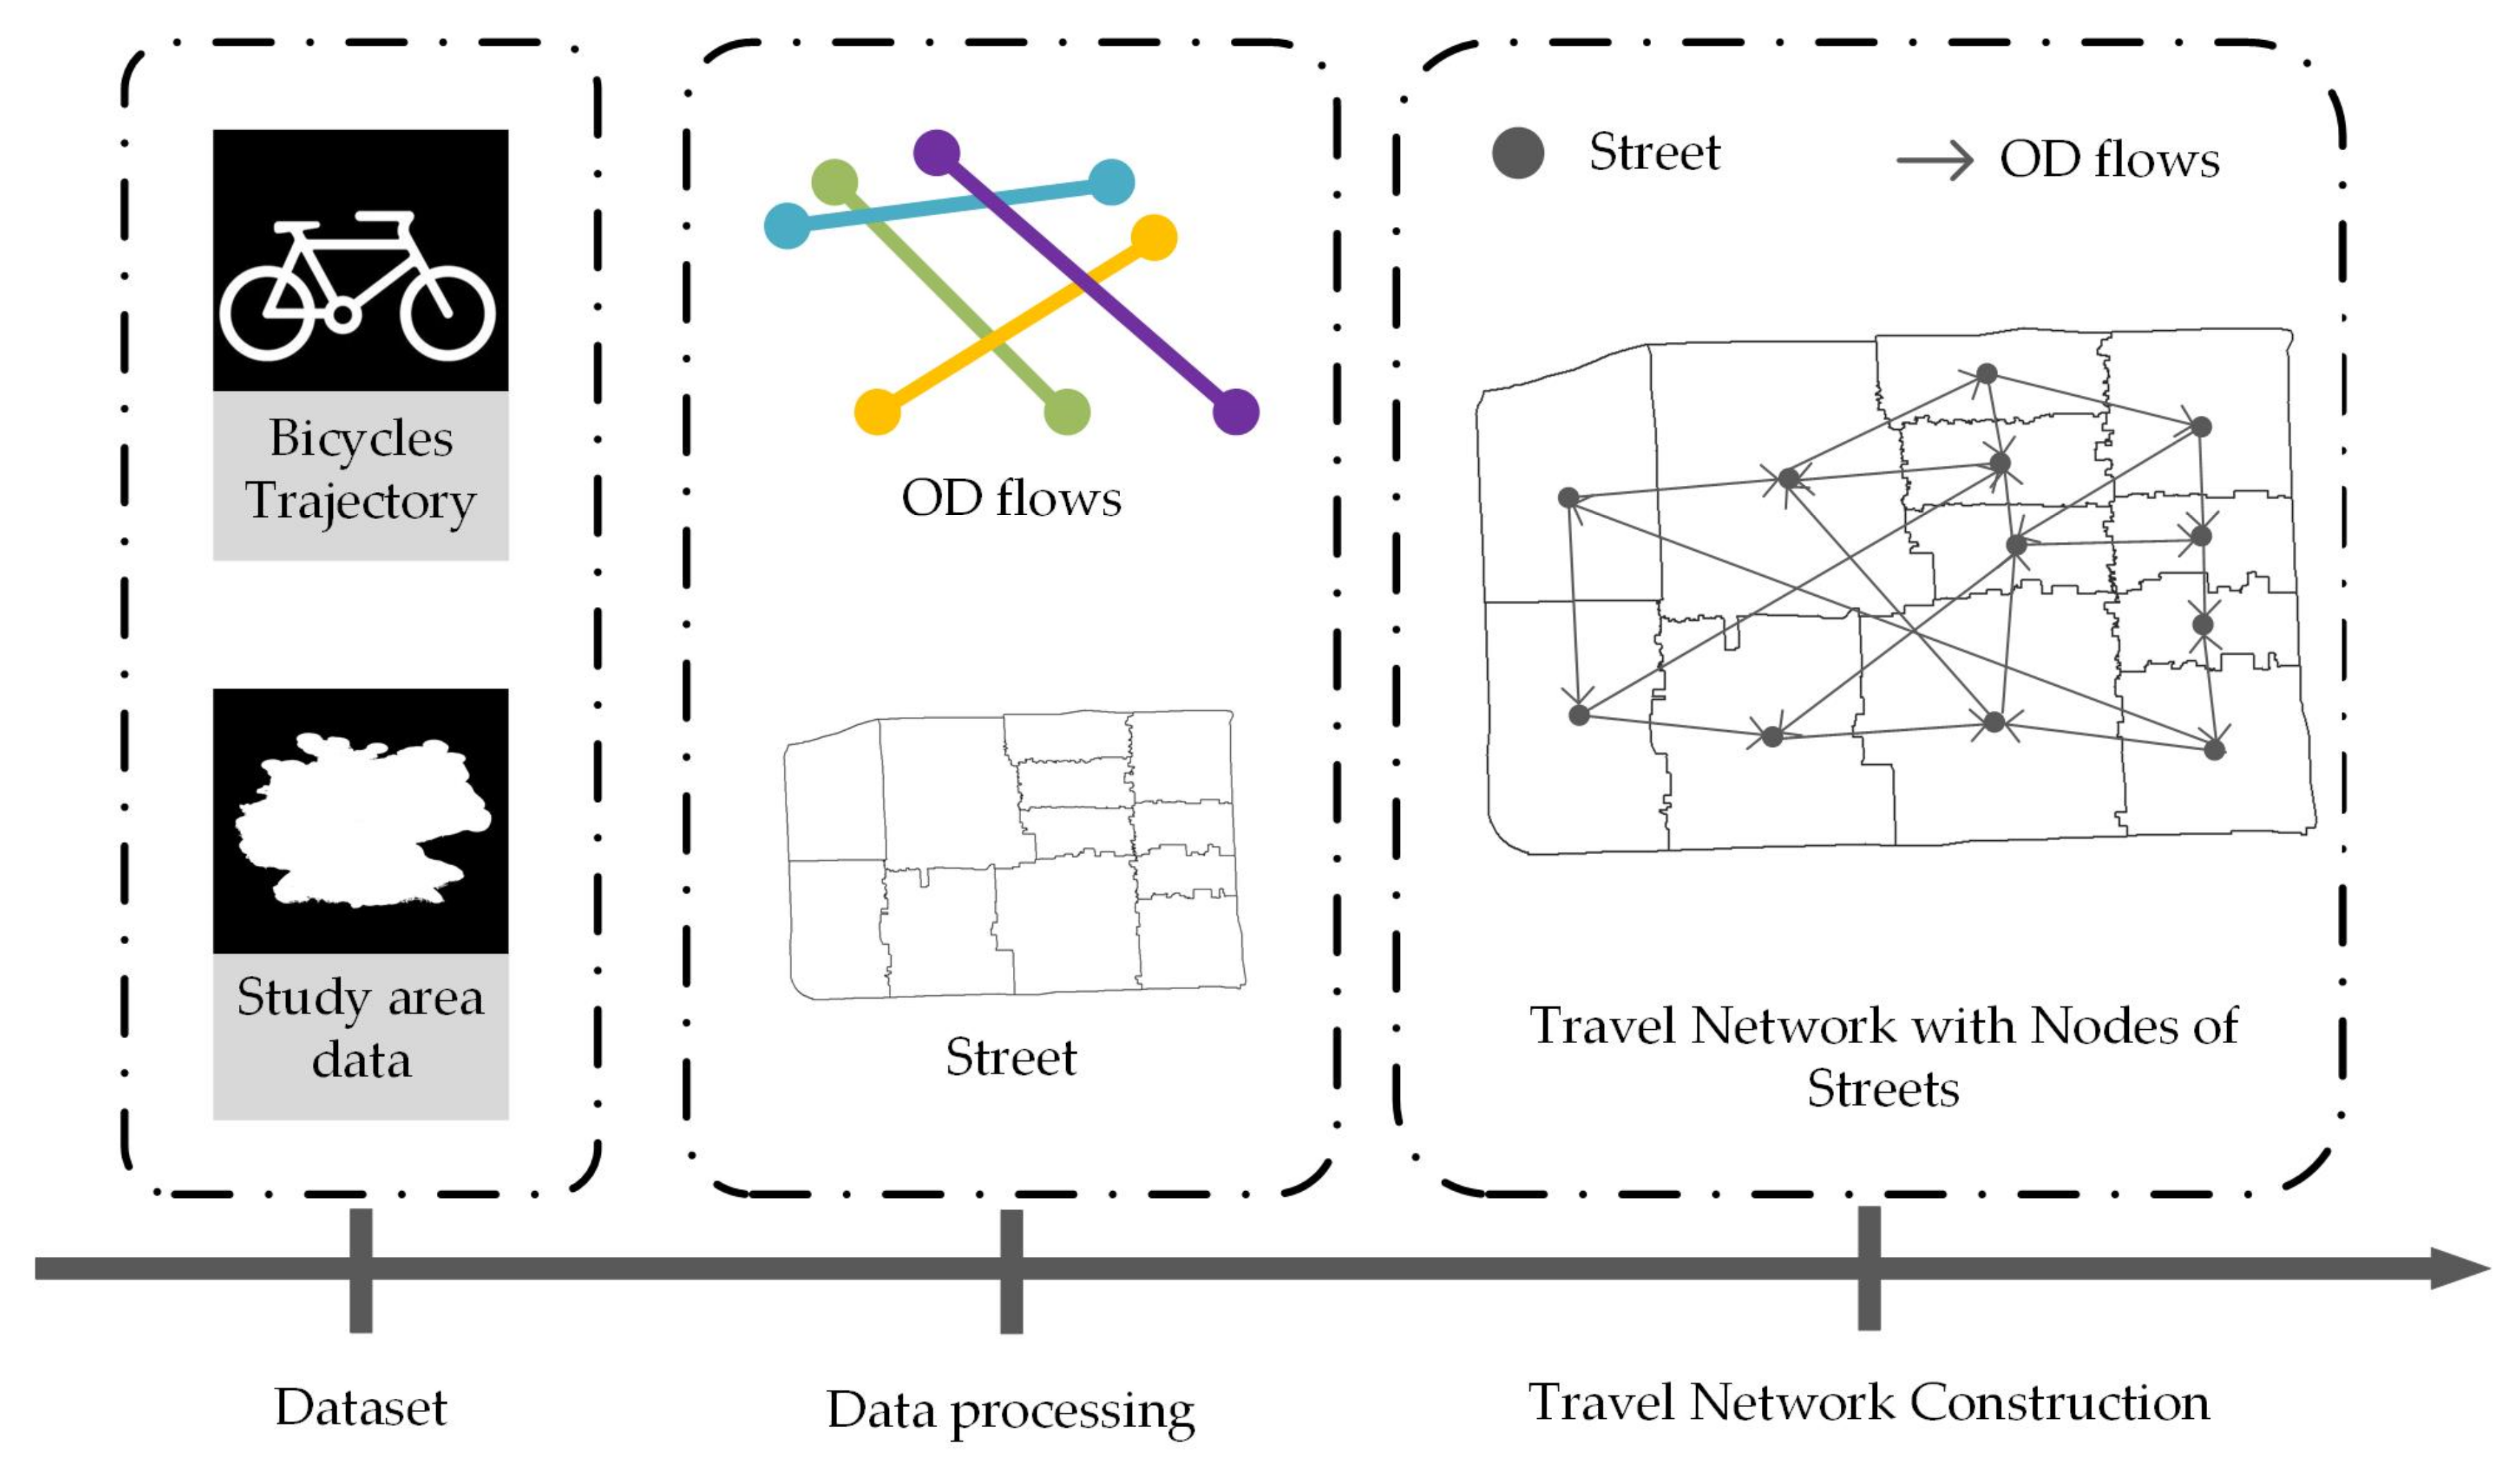
2.2.1. Travel Network Construction

The network structure is composed of a series of actors and their relationships. The actors are called vertices or nodes, and the relationships between actors are called edges, or connections. This relationship can be direct or indirect. All pairs of nodes are stored in the form of two-tuples. In a directed network, two-tuples can establish relationships through asymmetric or mutual interactions.
According to the principle of network construction, residents’ travel activities, considering streets as nodes, will form a corresponding directed network. The travel behavior is represented by a directed edge between nodes, in which the direction of the edge is the direction of the travel activities, and the weight of the edge is equal to the number of travel activities. Therefore, the location points of the same bike acquired at different times can be associated with the ID number of the shared bike, and the starting and ending nodes can be determined by the location point within the street block. Then, a travel trajectory between streets can be generated. With the directed edges between nodes, a network structure with streets as nodes is finally constructed (Figure 4).

2.2.2. Characterization of Travel Network

Network statistics can reflect the crucial information of a network’s characteristics. Several standard network statistics metrics can be computed to characterize a weighted directed network [55], as presented below:
Network density: This is an index used to describe the degree of network relevance. This indicator can characterize the number and complexity of relationships in the network, and is a measurement of the completeness of the network structure. The calculation equation is shown in Equation (1).
D = d k k 1
where D is the network density, k is the number of nodes, and d is the number of edges in the network. When D = 1, it means that all nodes in the network are connected, and when D = 0, it means that there is no connection between nodes. The larger the value of the network density, the more complex the network structure, the closer the relationship between network nodes, and the larger the degree of mutual influence between nodes.
In the undirected network, the strength of a node is defined as the sum of the weights of all edges connected to the same node:
S i = j N i W i j
N i is the set of nodes connected to node i , and W i j is the weight of the edge connecting nodes i and j , which in this paper is the number of shared bicycles. The network structure of this paper is a directed network, so according to the direction of the edge, the node strength can be divided into the in strength and the out strength of the node [56]. According to the equation calculation, the net flow ratio (NFR) of the node can be obtained [57]. The calculation equation is shown in Equations (3)–(5).
S i n v i = ν j ν i n w v j , ν i
S o u t v i = ν j ν o u t w v j , ν i
N F R = S i n v i S o u t v i S i n v i + S o u t v i
S i n v i and S o u t v i are the incoming and outgoing intensity, respectively, V i n v i is a set of nodes flowing to node i , V o u t v i is the set of nodes flowing from node i to other nodes, and NFR is the net flow ratio. When NFR > 0, it means that the incoming intensity of the node is larger than the outgoing intensity, and the popularity of the place is high. Otherwise, the popularity of the place is low.

2.2.3. Analysis of the Determinants of the Travel Network

The Exponential Random Graph Model (ERGM) is a relational data measurement model, which has been applied to the analysis of social networks both home and abroad. It is a newly developed and popularized model [45]. Different from general descriptive methods, ERGM is a statistical model, which can not only explain the observed characteristics of the network structure, but also explain the internal mechanism of network formation [39].
A random graph G = V , E represents the random spatial correlation matrix associated with G , and M i , j represents a directed edge from i to j in G , and M = M i , j represents the adjacency matrix. The elements in the i -th row and j -th column correspond one-to-one with the relationship from node i to node j. P θ M = m represents the probability of m appearing in M under the condition of θ , assuming that the probability of network formation depends on the various network structure statistics included in the model. The general and simplest form of ERGM is shown in Equation (6).
P θ M = m = 1 k e x p H θ H g H m
k = m e x p H θ H g H m
In Equations (6) and (7), g m represents the network statistics related to matrix m , which mainly includes pure network structure statistics that may affect the formation and construction of network relationships, network structure statistics related to node attributes, and network structure statistics related to other external relationship networks. θ is the estimated parameter vector of the relevant network statistics. If the parameter is positive (negative), it indicates the probability of the statistic appearing being more (less) accurate than the random expectation under control of other statistics; this statistic has a positive (negative) influence on the formation of the network structure. H represents a series of structural statistical variables for the network. The magnitude of this value can also reflect the influence of the statistic on the formation of the network. k is the normalization constant of the above-mentioned network statistics, which can cause the sum of the estimated parameters of all network structure statistics to be 1. The calculation equation is shown in Equation (7).

2.2.4. Network Structure Variables

From the perspective of network formation, any network structure is a special case among many network structures formed by various nodes in the network. ERGM aims to describe the connection or structure in this network, and explain the reasons for the formation of the network structure and connection relationship. The explanatory variables (influencing factors) are expressed in the form of probability in the process of forming the network. Therefore, the explanatory variables are actually a series of network structure statistics.
The network structure statistics enable a reasonable explanation for the formation of the ERGM network structure. The number of network edges, mutuality, transitivity, interactive k star, interactive k path, etc., are the common statistical methods used for the ERGM. Studies have shown that the network should have a strong convergence, while if triangular structure variables are added to the ERGM model estimation, this may cause the attenuation of the model and the non-convergence of the estimated parameters [58]. It has been verified that the network convergence is determined by the number of edges and reciprocity added into the model. The statistics and significance of each variable are shown in Table 2. In addition to the statistics inside the network, other statistic indicators can explain the network structure, which are the attribute variables of the nodes. The probability of forming an edge is affected by the attributes of the two linked nodes. ERGM can input individual attributes into the model by adding statistics to the node. The influencing factors selected in this paper are input as the node attribute variables. In the model, the selected factors are described in detail, as follows:
(1)
Housing Prices (Price): Housing is an important part of the national economy, and housing prices directly affect people’s housing choices. The relationship between housing prices and travel behavior is inseparable, and there is obvious spatial heterogeneity between them [59]. We calculate the average housing prices of streets as one of the influencing factors;
(2)
Building Density (Bden): Residents’ travel in the city is affected by the distribution of buildings [56], which can be directly expressed as building coverage or building density. Building density is an important indicator used to measure urban development, which can reflect the density and vacancy rate of street blocks and buildings. Therefore, building density was chosen as one of the influencing factors;
(3)
Road Network Density (Rden): Similar to building density, road network density is also one of the standards used to measure the development of a city. It can evaluate the rationality of a city’s road network and represent the basic road network development. Researchers found that the density of the road network has a great impact on the daily life of residents, especially in terms of bicycle travel [57,60];
(4)
Transportation Facilities (Tra): Traffic accessibility has a positive impact on the number of shared bicycle trips [61,62]. Traffic accessibility is affected by the distribution of traffic facilities, and affects residents’ travel. Transportation facilities mainly include transportation hubs such as bus stations and subway stations. For POI data containing the attributes of transportation facilities, it is used to represent the distribution of transportation facilities. The bus stations and subway stations in the POI data are mixed with other types of transportation facilities, and then, the number of POI which contain the attributes of transportation facilities is calculated in each street as the input of the model;
(5)
Shopping and Dining Places (SaD): The number of cafes and restaurants has a significant impact on the use of shared bicycles [30]. In addition, the distribution of shopping institutions such as malls and supermarkets has an impact on the spatial agglomeration of crowds on weekends and holidays [63]. Therefore, the POI of shopping and dining attributes are mixed together to reflect the convenience of shopping and dining in each street block, which is treated as one of the influencing factors;
(6)
Financial Services (Fin): Financial service facilities have a significant impact on shared bicycle travel [64]. The financial service industry has experienced the most significant productivity growth in the modern urban service industry. It is one of the industries that use modern information technology with a higher density, which has attracted the widespread attention of economic geographers [65]. In the previous studies on the factors affecting shared bicycle travel patterns, financial service factors are rarely considered. Hence, POI data with financial service attributes are chosen as the standard to measure the financial service capabilities of the street block;
(7)
Residential Area (Res): Different from building density, residential density directly reflects the residential attributes in the area. In China, there are four indicators of residential density: residential population density, residential land per capital, residential building density and residential building area density. Studies have found that the residential density and POI of residential attributes have a certain impact on the travel demand of shared bicycles [56,66]. Therefore, the POI data of residential area attributes are chosen as one of the influencing factors;
(8)
Education Institution (Edu): On weekdays, science and education services have a positive impact on shared bicycle travel [22]. There are several scientific education institutions for every street block, which can effectively improve the convenience of people’s lives. According to the microscopic neoclassical theory, maximizing personal interests is the main reason for crowd mobility. Therefore, POI data with the attributes of science education are used to measure the convenience of education services.
In summary, the influencing factors of the network structure statistics are used in this paper, and are shown in Table 3.

3. Results

3.1. Network Structure Analysis

According to the principle of network construction, the shared bicycle travel network is constructed based on data from two different periods. The network has 122 nodes, and each node represents a street block (Figure 5). Figure 5 shows the difference in the network structure between weekdays and weekends, where the flow strength is represented by the color and thickness of the line of the edge: the wider the red line, the larger the flow strength, and a blue line indicates weak flow strength. Table 4 shows the ten travel activities with the highest flow volume on weekdays (19–21 May) and weekends. According to the information in the figure and table, we can summarize the following characteristics of the travel network:
From the network structure of a single weekday (Figure 5a,b) or the network structure of a period of several weekdays (Figure 5c), we can see that most travel activities occur between adjacent streets, which verifies that bike sharing is usually a short-distance travel method. The flow volume is relatively concentrated. In particular, the Huaxiang District Office and Xincun Sub-district Office tend to generate the greatest traffic flow during weekdays (Figure 5). The flow volume is relatively high in the area closed to Shibalidian District Office, Wangjing Development Street, Zuojiazhuang Sub-district Office, Panjiayuan Sub-district Office, Hujialou Sub-district Office and Liulitun Sub-district Office. These street blocks play an important role in the network structure on weekdays. The reason for the formation of the above network structure may be that on weekdays, people’s travel purpose is often related to work, and shared bicycles are used as a method of short-distance commuting to avoid congested roads during peak hours. Therefore, destination streets with higher traffic may have more businesses or employment units, such as Wangjing Development Street, Huaxiang District Office, Gaobeidian District Office, etc.
On weekends, the network structure is relatively complex, and the events of travel flow referring to several street blocks are significantly greater than on weekdays. This shows that more people choose to use shared bicycles for long-distance travel activities on weekends. Meanwhile, the travel destinations have a stronger diversity. The flow on weekends is more scattered than that on weekdays, as can be seen from Table 4. Additionally, there are more node pairs, which can verify that the interaction between the street blocks on weekends is stronger.

3.2. Characteristics Analysis of Travel Network

The network density and degree of node accessibility of the spatial interactions during weekends and weekdays are computed in this paper. The in-degree and out-degree of the same street block are added, in order to calculate the node strength of all street blocks. Then, node strength is arranged in descending order. The importance of every node (street block) can be analyzed with the spatial interaction. The following conclusions can be drawn:
With the value of network density, the daily travel volume on weekdays tends toward stable. The network density on weekends is greater than that on weekdays (19–21 May). On weekends, the interaction between the various streets is more active, and the flow is also greater (see Table 5).
The differences in the travel network attributes are analyzed, as shown in Figure 6, where the X-axis shows the street IDs. From Figure 6a,b, the Y-axis shows the value of the node’s out-degree or in-degree. From Figure 6c,d, the Y-axis represents the total degree value corresponding to the street. In Figure 6e, the Y-axis shows the value of the node’s NFR.
The network structure indicators of weekdays (19–21 May) and weekends are analyzed. From Figure 6, we can conclude that combined with the value of node strength, the in-degree and out-degree have a significant difference on weekdays. Meanwhile, at weekends, the in-degree and out-degree in the same street are close to each other. This verifies the phenomenon that residents have different travel purposes on weekdays and weekends. The purpose of residents’ travels during weekdays is more clear, which results in larger differences in in-degree and out-degree values in some streets (Figure 6a,b). Regardless of the temporal scale, only a few streets have strong node strengths, and most streets have node strengths near the average. The node intensity of most streets on weekdays is between 500 and 2000, and the range of node strength between 500 and 2500 on weekends covers most of the streets. The degree of distribution of all streets is consistent with the power–law distribution, that is, it satisfies the scale-free characteristics of the complex network (Figure 6c,d).
Finally, according to our results, the value of NFR for most streets on weekdays is much larger than on weekends. On weekdays, the NFR of many streets shows large positive and negative values. On the one hand, these streets are hot spots in the network during weekdays, and many people choose to use these streets as the starting point or end of their trip. On the other hand, on weekdays, residents have a clearer potential willingness of travel from streets with negative NFR to streets with positive NFR. The larger the absolute value of the NFR of the street, the more likely the street has a single attribute between employment or residence, that is, the street is an employment area or a residential area. On weekends, the popularity of each street is small, and the NFR always fluctuates around the 0 mark, because the inflow and outflow of each street block are roughly equal. Additionally, it shows that over the weekend, all street blocks interact with each other, and the volume of travel flow is also larger (see Figure 6).

3.3. Analysis of Influencing Factors of Travel Network

The statnet package in the R language is used to estimate, simulate, compare and test the ERGM model. The model can be downloaded from https://github.com/statnet/ergm (accessed on 20 May 2021). Additionally, the method of the classic Markov chain Monte Carlo maximum likelihood estimation (MCMC MLE) is used to train the model parameters. The evaluation indicators of the fitting effect adopt the Akaike Information Criterion (AIC) and Bayes Information Criterion (BIC). The smaller the corresponding index value, the better the model effect. The ERGM estimation results are shown in Table 6. The numerical value in Table 6 represents the result coefficient, the standard error corresponding to the value is in brackets, and, finally, P is the parameter for judging the hypothesis test result.
From the fitting results of pure network structure variables, it can be seen that the coefficients of the edge statistical items are all negative values, which means the network density is less than 50%. Existing research generally regards this item as a constant item without explanation [43]. The variable Mutual can reflect the possibility of interaction between pairs of street blocks. The larger the value, the more interaction between these two street blocks. Meanwhile, the value of the variable Mutual during weekends is higher than on weekdays (19–21 May), which shows that the interaction between the streets on weekends is stronger (Table 6). The results are also consistent with the results obtained from the network structure analysis.
From the fitting results of the node attribute variables in Table 6, it can be seen that all variables have obvious positive coefficients, which indicates that the influencing factors selected in this paper all have a positive impact on the formation of the shared bicycle travel network. The coefficient of Bden is significantly higher than the coefficients of other influencing factors, indicating that building density has a great impact on promoting travel behavior, whether on weekdays or weekends. Additionally, with the accumulation of weekdays, the degree of influence of building density (Bden) becomes more and more obvious (Figure 7a). The larger the density of buildings in the street, the higher the demand for shared bicycles. The coefficients of Price and Res are almost equal, showing more importance than the other five influencing factors, except Bden. Factors such as Eco, Rden, Tra, SaC and Edu all have a positive correlation, but the impact is relatively low (Figure 7a,b).
As an important indicator to measure the level of urban development, building density determines the comprehensive development level of streets to a certain extent. The higher the development of the street, the more frequent the movement of people. There is a clear correlation between house prices and travel, which is consistent with Lu J’s conclusion [56]. In addition, considering the special rental housing situation in Beijing, in which the renting population accounts for one-third of the population of permanent residents, such people tend to have a greater demand for shared bicycles, which increases the traffic on the streets. There is a certain positive correlation between the number of residential areas and the size of the resident population, resulting in a high positive coefficient of Res.
This paper compares and analyzes the influencing factors of working days (19th–21st) and weekends (Figure 7b,c). From the aspects of temporal analysis, comparing the coefficients of various factors on weekdays and weekends, it can be concluded that the coefficients of Bden, Price, and Res reach the same peak in the two periods, indicating that these factors are effective for people traveling between streets in either part of the week (Figure 7b). The remaining five coefficients are Eco, Rden, Tra, SaC and Edu. From the weekday results, it can be seen that the coefficient of the financial service factor is larger than the coefficients of the other four factors (Figure 7c). Financial service facilities are used to measure the financial service capacity of the street, which can reflect the economic development level of the street to a certain extent, and are the most important factor to distinguish between weekends and weekdays. The more convenient the financial services of the street, the more shared bicycle flow can be generated on weekdays. From the weekend estimation results, it can be seen that the coefficients of the above five influencing factors are almost the same. The formation of the shared bicycle travel network is the result of a combination of many factors. A person’s choice to use a shared bicycles to reach their destination is always made according to their own needs.

4. Discussion

Based on the theory of complex networks, a spatial interaction network is constructed during weekdays and weekends, and the results are analyzed in terms of three aspects: network structure, network statistical indicators, and influencing factors.
(i) Through the analysis of the network structure, it is found that on weekdays, the spatial pattern of the network is relatively stable, most of the flow is generated between adjacent blocks, and the flow is relatively concentrated at several specific places. On weekends, the network pattern is relatively complicated, with more flow across street blocks. To be specific, on weekdays, shared bicycles are usually the choice for short-distance travel, and the purpose of residents’ travel is stronger. On weekends, more people may choose to share bicycles for longer-distance travel, the starting and ending points of travel are diverse, and the inter-street interaction is stronger. (ii) The network density and degree of node accessibility of the spatial interaction network during weekdays and weekends are computed in this paper. It is found that the network density on weekends is greater than that on weekdays. The number of accessible degrees in the same street block varies greatly on weekdays, but remains almost the same at weekends. The distribution of node strength presents a power–law distribution on both weekdays and weekends, which is consistent with the scale-free characteristics of complex networks. NFR calculation results show that residents travel more purposefully during the weekdays, leading to a sharp increase or decrease in the popularity of certain neighborhoods. The magnitude of the absolute value of the NFR also determines whether the street is an employment area or a residential area. On weekends, residents’ travel patterns are relatively complicated. Since the inflow and outflow of each street block are roughly equal, and the increase or decrease in popularity is small. (iii) According to the results of ERGM, the reciprocity (Mutual) on weekends is much higher than that on weekdays, which verified the results suggesting that the interactivity between streets on weekends is stronger. The influencing factors selected in this paper all have a positive impact on the formation of the network. Among them, the influence coefficient of building density (Bden) is the largest. Additionally, with the accumulation of weekdays, the influence of building density (Bden) becomes more obvious. It can be seen that the building density of the street determines people’s choice of shared bicycles as a mode of travel. The effects of housing prices (Price) and the number of residential areas (Res) are the second in importance only to building density (Bden). By comparing the estimation results on weekdays and weekends, it can be seen that on weekdays, street blocks with more convenient financial services are more likely to generate travel and spatial interaction flow. On weekends, financial services (Fin), road network density (Rden), transportation (Tra), shopping and dining (SaD) and education institution (Edu) have roughly the same impact.
Based on the above research results, this paper can provide corresponding decision-making assistance for street management departments and bicycle-sharing companies, and provide a reference for urban traffic management and social management to formulate time-sharing management policies and measures. First, bicycle-sharing companies can schedule vehicles in advance according to the increase or decrease in the heat of a street to meet the balance of supply and demand. Streets with high heat should focus on improving the BSS and adjust relevant policies in a timely manner to prevent traffic problems caused by excessive crowds. Second, priority should be given to deploying more bike-sharing stations in areas with higher building density. In addition, on weekdays, priority should be given to setting up more shared bicycle gathering points near financial institutions. During holidays, appropriately increasing the number of bicycles that can be used near transportation, shopping, and catering locations, financial services, scientific research and education institutions, etc., can effectively increase the utilization rate of shared bicycles and enable residents to travel. This study not only enriches the methodology of the research on the influencing factors of shared bicycles, but also regards the influencing factors as an important feature to distinguish weekdays from weekends. While validating previous research results, there are many other new discoveries. Nonetheless, our research has potential for improvement in influencing factor selection, travel data attributes, and network construction.
First, it is possible to continue to expand the influencing factors that can be studied. The variables related to urban areas are still being refined. Future research should also include sports facilities, municipal media, road congestion, weather, the COVID-19 pandemic, and more. Second, the data should be further refined in the future to increase the applicability of the conclusions. It is necessary to increase the resident attributes of the travel data, such as the social attributes (occupation, gender, and age) of residents for accurately analyze of the travel purposes. Third, we can continue to refine how complex networks are built. The network constructed with streets as nodes cannot directly study a specific shared bicycle parking spot in the area. In the future, such hot spots can be used as network nodes to make the results more specific. In addition, it is necessary to continuously strengthen cooperation and interaction with other disciplines, so that the research results have greater social and economic value and significance. Finally, the shared bike data in this article covers a full week, while in order to found more valuable rules of the shared bikes travel, we will expand the time coverage in the next step. In addition, most of the data used in this paper is confidential data, so the reproducibility of this paper is limited. In the future study, we will use public datasets to improve the reproducibility of the paper’s experiments.

Author Contributions

Conceptualization, Lujin Hu and Zheng Wen; Data curation, Zheng Wen and Jing Hu; Methodology, Lujin Hu; Project administration, Jian Wang; Validation, Zheng Wen; Visualization, Zheng Wen; Writing—original draft, Zheng Wen; Writing—review & editing, Lujin Hu, Jian Wang and Jing Hu All authors have read and agreed to the published version of the manuscript.

Funding

This work was supported by the National Key Research and Development Program of China (Grant No. 2020YFD1100201).

Institutional Review Board Statement

Not applicable.

Informed Consent Statement

Not applicable.

Data Availability Statement

Not applicable.

Conflicts of Interest

The authors declare no conflict of interest.

References

  1. Vt, A.; Mi, A.; Gi, B.; Gt, C.; Tc, C. Exploring the factors affecting bike-sharing demand: Evidence from student perceptions, usage patterns and adoption barriers. Transp. Res. Procedia 2021, 52, 573–580. [Google Scholar]
  2. Politis, I.; Fyrogenis, I.; Papadopoulos, E.; Nikolaidou, A.; Verani, E. Shifting to shared wheels: Factors affecting dockless bike-sharing choice for short and long trips. Sustainability 2020, 12, 8205. [Google Scholar] [CrossRef]
  3. Li, X.; Zhang, Y.; Du, M.; Yang, J. Social Factors Influencing the Choice of Bicycle: Difference Analysis among Private Bike, Public Bike Sharing and Free-Floating Bike Sharing in Kunming, China. KSCE J. Civ. Eng. 2019, 23, 2339–2348. [Google Scholar] [CrossRef]
  4. Parkes, S.D.; Marsden, G.; Shaheen, S.A.; Cohen, A.P. Understanding the diffusion of public bikesharing systems: Evidence from Europe and North America. J. Transp. Geogr. 2013, 31, 94–103. [Google Scholar] [CrossRef]
  5. Weng, S. Research on integral governance innovation of urban bike-sharing supervision system. E Gov. 2018, 4, 21–31. [Google Scholar]
  6. Liu, X. The bottleneck and countermeasures of the bicycle market under the “Internet + sharing model”. Financ. Account. Commun. 2017, 8, 57–62. [Google Scholar]
  7. Wang, X.; Sun, H.; Zhang, S.; Lv, Y.; Li, T. Bike sharing rebalancing problem with variable demand. Phys. A Stat. Mech. Its Appl. 2022, 591, 126766. [Google Scholar] [CrossRef]
  8. Dell’Amico, M.; Iori, M.; Novellani, S.; Subramanian, A. The bike sharing rebalancing problem with stochastic demands. Transp. Res. Part B 2018, 118, 362–380. [Google Scholar] [CrossRef]
  9. Chen, J.; Yang, Z.; Shu, Y.; Cheng, P. Rebalance bike-sharing system with deep sequential learning. IEEE Intell. Transp. Syst. Mag. 2020, 13, 92–98. [Google Scholar] [CrossRef]
  10. Federico, C.; Chiara, P.; Andrea, Z.; Michele, Z. A dynamic approach to rebalancing bike-sharing systems. Sensors 2018, 18, 512. [Google Scholar]
  11. Jia, Y.; Zeng, W.; Xing, Y.; Yang, D.; Li, J. The bike-sharing rebalancing problem considering multi-energy mixed fleets and traffic restrictions. Sustainability 2020, 13, 270. [Google Scholar] [CrossRef]
  12. Li, Y. Optimizing the Location of Virtual Stations in Free-Floating Bike-Sharing Systems with the User Demand during Morning and Evening Rush Hours. Master’s Thesis, Dalian Maritime University, Liaoning, China, 2020. [Google Scholar]
  13. Du, M.; Cheng, L. Better Understanding the Characteristics and Influential Factors of Different Travel Patterns in Free-Floating Bike Sharing: Evidence from Nanjing, China. Sustainability 2018, 10, 1244. [Google Scholar] [CrossRef]
  14. Eren, E.; Uz, V.E. A review on bike-sharing: The factors affecting bike-sharing demand. Sustain. Cities Soc. 2020, 54, 101882. [Google Scholar] [CrossRef]
  15. Lin, P.; Weng, J.; Hu, S.; Alivanistos, D.; Li, X.; Yin, B. Revealing Spatio-Temporal Patterns and Influencing Factors of Dockless Bike Sharing Demand. IEEE Access 2020, 8, 66139–66149. [Google Scholar] [CrossRef]
  16. Zzab, C.; Yc, D.; Dz, D.; Hs, E.; Jw, E.; Xing, P.A.; Dla, B. Extreme unbalanced mobility network in bike sharing system—ScienceDirect. Phys. A Stat. Mech. Its Appl. 2020, 563, 125444. [Google Scholar]
  17. Hunter, M.L. Environmental Hazards, Migration, and Race. Popul. Environ. 2003, 25, 23–39. [Google Scholar] [CrossRef]
  18. Peter, R.M.; Philip, P.G. Examining the Role of Economic Opportunity and Amenities in Explaining Population Redistribution. Soc. Sci. Electron. Publ. 1995, 37, 176–200. [Google Scholar]
  19. Faggian, A.; Royuela, V. Migration Flows and Quality of Life in a Metropolitan Area: The Case of Barcelona-Spain. Appl. Res. Qual. Life 2010, 5, 241–259. [Google Scholar] [CrossRef]
  20. Sjaastad, L.A. The Costs and Returns of Human Migration. J. Political Econ. 1962, 70, 80–93. [Google Scholar] [CrossRef]
  21. Li, W.; Wang, S.; Zhang, X.; Jia, Q.; Tian, Y. Understanding intra-urban human mobility through an exploratory spatiotemporal analysis of bike-sharing trajectories. Int. J. Geogr. Inf. Sci. 2020, 34, 2451–2474. [Google Scholar] [CrossRef]
  22. Lin, P.; Weng, J.; Hu, S.; Liang, Q.; Yin, B. Analysis of Influencing Factors of Dockless Bicycle Share Demand Based on Geographically Weighted Regression. J. Transp. Eng. 2020, 20, 65–72. [Google Scholar]
  23. Chen, Q.; Fu, Z. A Study on the Temporal and Spatial Characteristics of Residents’ Cycling Behavior under the Influence of Shared Bicycles—A Case Study of Nanjing City Center. In Proceedings of the Annual National Planning Conference, Hangzhou, China, 24–26 November 2018. [Google Scholar]
  24. Scott, D.M.; Ciuro, C. What factors influence bike share ridership? An investigation of Hamilton, Ontario’s bike share hubs. Travel Behav. Soc. 2019, 16, 50–58. [Google Scholar] [CrossRef]
  25. Faghih-Imani, A.; Eluru, N. Incorporating the impact of spatio-temporal interactions on bicycle sharing system demand: A case study of New York CitiBike system. J. Transp. Geogr. 2016, 54, 218–227. [Google Scholar] [CrossRef]
  26. Sun, Y.; Mobasheri, A.; Hu, X.; Wang, W. Investigating Impacts of Environmental Factors on the Cycling Behavior of Bicycle-Sharing Users. Sustainability 2017, 9, 1060. [Google Scholar] [CrossRef]
  27. He, Y.; Song, Z.; Liu, Z.; Sze, N.N. Factors Influencing Electric Bike Share Ridership: Analysis of Park City, Utah. Transp. Res. Rec. J. Transp. Res. Board 2019, 2673, 12–22. [Google Scholar] [CrossRef]
  28. Kutela, B.; Teng, H. The influence of campus characteristics, temporal factors, and weather events on campuses-related daily bike-share trips. J. Transp. Geogr. 2019, 78, 160–169. [Google Scholar] [CrossRef]
  29. Wang, Z.; Cheng, L.; Li, Y.; Li, Z. Spatiotemporal Characteristics of Bike-Sharing Usage around Rail Transit Stations: Evidence from Beijing, China. Sustainability 2020, 12, 1299. [Google Scholar] [CrossRef] [Green Version]
  30. Maas, S.; Nikolaou, P.; Attard, M.; Dimitriou, L. Heat, Hills and the High Season: A Model-Based Comparative Analysis of Spatio-Temporal Factors Affecting Shared Bicycle Use in Three Southern European Islands. Sustainability 2021, 13, 3274. [Google Scholar] [CrossRef]
  31. Xie, P.; Li, T.; Liu, J.; Du, S.; Yang, X.; Zhang, J. Urban flow prediction from spatiotemporal data using machine learning: A survey. Inf. Fusion 2020, 59, 1–12. [Google Scholar] [CrossRef]
  32. Li, T.; Wang, J.; Huang, J.; Gao, X. Research on the Similarities and Differences of Intercity Travel Network between Chinese Residents Working Days and Holidays. J. Geogr. Sci. 2020, 30, 25–44. [Google Scholar]
  33. Wu, Z.; Ye, Z. Research on urban spatial structure based on the heat map of baidu maps—Taking shanghai central city as an example. China City Plan. Rev. 2016, 40, 33–40. [Google Scholar]
  34. O’Brien, O.; Cheshire, J.; Batty, M. Mining bicycle sharing data for generating insights into sustainable transport systems. J. Transp. Geogr. 2014, 34, 262–273. [Google Scholar] [CrossRef]
  35. Brashears, M.E. Exponential Random Graph Models for Social Networks: Theory, Methods, and Applications. Contemp. Sociol. J. Rev. 2014, 43, 552–553. [Google Scholar] [CrossRef]
  36. Crawford, F.; Watling, D.P.; Connors, R.D. A statistical method for estimating predictable dif-ferences between daily traffic flow profiles. Transp. Res. Part B Methodol. 2017, 95, 196–213. [Google Scholar] [CrossRef]
  37. Borgnat, P.; Abry, P.; Flandrin, P.; Robardet, C.; Rouquier, J.B.; Fleury, E. Shared bicycles in a city: A signal processing and data analysis perspective. Adv. Complex Syst. 2011, 14, 415–438. [Google Scholar] [CrossRef]
  38. Miranda-Moreno, L.; Nosal, T. Weather or not to cycle. Transp. Res. Rec. J. Transp. Res. Board 2011, 2247, 42–52. [Google Scholar] [CrossRef]
  39. Harris, J.K. Introduction to Exponential Random Graph Models; Shanghai People’s Publishing House and Gezhi Publishing House: Shanghai, China, 2016. [Google Scholar]
  40. Li, X.; Li, W.; Zeng, M.; Zheng, R.; Li, M. Network-based methods for predicting essential genes or proteins: A survey. Brief. Bioinform. 2020, 21, 566–583. [Google Scholar] [CrossRef]
  41. Ryan, L.; D’Angelo, A. Changing times: Migrants’ social network analysis and the challenges of longitudinal research. Soc. Netw. 2018, 53, 148–158. [Google Scholar] [CrossRef]
  42. Wang, X.; Ding, S.; Cao, W.; Fan, D.; Tang, B. Research on Network Patterns and Influencing Factors of Population Flow and Migration in the Yangtze River Delta Urban Agglomeration, China. Sustainability 2020, 12, 6803. [Google Scholar] [CrossRef]
  43. Zhang, W.; Chong, Z.; Li, X.; Nie, G. Spatial patterns and determinant factors of population flow networks in China: Analysis on Tencent Location Big Data. Cities 2020, 99, 102640. [Google Scholar] [CrossRef]
  44. Chong, Z.; Pan, S. Understanding the structure and determinants of city network through intra-firm service relationships: The case of Guangdong-Hong Kong-Macao Greater Bay Area. Cities 2020, 103, 102738. [Google Scholar] [CrossRef]
  45. Zhou, Q. Hotspots Detection and Dynamic Analysis from Trajectory Data Based on Spatio-Temporal Data Field Clustering and Complex Network. Master’s Thesis, Wuhan University, Wuhan, China, 2017. [Google Scholar]
  46. Freeman, L.C. A Set of Measures of Centrality Based on Betweenness. Sociometry 1977, 40, 35–41. [Google Scholar] [CrossRef]
  47. Chen, Q.; Wu, T.-T.; Fang, M. Detecting local community structures in complex networks based on local degree central nodes. Phys. A: Stat. Mech. Its Appl. 2013, 392, 529–537. [Google Scholar] [CrossRef]
  48. Erds, P.; Rényi, A. On Random Graphs. Publ. Math. 1959, 6, 290–291. [Google Scholar]
  49. Holland, P.W.; Leinhardt, S. An Exponential Family of Probability Distributions for Directed Graphs. J. Am. Stat. Assoc. 1981, 76, 33–50. [Google Scholar] [CrossRef]
  50. Hunter, D.R.; Handcock, M.S.; Butts, C.T.; Goodreau, S.M.; Morris, M. ergm: A Package to Fit, Simulate and Diagnose Exponential-Family Models for Networks. J. Stat. Softw. 2008, 24, nihpa54860. [Google Scholar] [CrossRef]
  51. Morris, M.; Handcock, M.S.; Hunter, D.R.; Pebesma, E.; Zeileis, A. Specification of Exponential-Family Random Graph Models: Terms and Computational Aspects. J. Stat. Softw. 2008, 24, 1548–7660. [Google Scholar] [CrossRef]
  52. Yao, Y.; Zhang, Y.; Tian, L.; Zhou, N.; Li, Z.; Wang, M. Analysis of Network Structure of Urban Bike-Sharing System: A Case Study Based on Real-Time Data of a Public Bicycle System. Sustainability 2019, 11, 5425. [Google Scholar] [CrossRef]
  53. Zhang, H.; Zhuge, C.; Jia, J.; Shi, B.; Wang, W. Green travel mobility of dockless bike-sharing based on trip data in big cities: A spatial network analysis. J. Clean. Prod. 2021, 313, 127930. [Google Scholar] [CrossRef]
  54. Tao, F.; Wang, C. In response to green travel, full coverage of shared bicycles in Beijing before the end of the year. Beijing Commer. Dly. 2021, 2021-09-23, 002. [Google Scholar]
  55. Barrat, A.; Barthelemy, M.; Vespignani, A. Modeling the evolution of weighted networks. Phys. Rev. E Stat. Nonlinear Soft Matter Phys. 2004, 70, 066149. [Google Scholar] [CrossRef] [Green Version]
  56. Mo, H.; Wei, Z.; Zhai, Q. A Study on the Characteristics and Influencing Factors of Shared Bicycle Trips in the Old City—Taking Guangzhou as an Example. South Archit. 2019, 1, 7–12. [Google Scholar]
  57. Yin, Q.; Zhen, F.; Luo, S.; Yan, X.; Guo, S. Influencing factors and layout suggestions of public bicycle travel space in the new city. Mod. Urban Res. 2018, 12, 9–15+46. [Google Scholar]
  58. Yang, W.; Du, D. The Investment Network Structure and Influencing Factors of Countries Along the “Belt and Road”: A Study Based on the ERGM Model. World Econ. Stud. 2018, 5, 80–94, 136–137. [Google Scholar]
  59. Lu, J.; Zhou, S.; Yuan, Q.; Liu, L. The Spatial Differentiation of Relationship between Travel Distance and Housing Rent: Exploring Bid-rent Mode in Polycentric Cities. Shanghai Urban Plan. Rev. 2019, 3, 1–9. [Google Scholar]
  60. Yu, E.; Zhou, J. Analysis of Characteristics and Influencing Factors of Public Bicycle Trip Based on Spatial Lag Model. J. Transp. Inf. Saf. 2021, 39, 103–110. [Google Scholar]
  61. Hui, Y.; Tang, L.; Xie, Y.; Liao, J.; Shi, C. The influence of the regional built environment on the daily change characteristics of shared bicycles: Taking Xiamen as an example. Urban Transp. Constr. 2021, 19, 81–90. [Google Scholar]
  62. Li, Y.; Zhang, N.; Wang, S.; Lin, Y. Old Beijing on Bicycles: A Study on the Influencing Factors of Cycling Behavior in Beijing’s Old City. Beijing Plan. Rev. 2018, 3, 6–12. [Google Scholar]
  63. Feng, J.; Yang, Z. Influencing Factors of Urban Elderly Traveling Behavior in Nanjing. Prog. Geogr. 2015, 34, 1598–1608. [Google Scholar]
  64. Gao, F.; Li, S.; Wu, Z.; Lu, D.; Huang, G.; Liu, X. Temporal and spatial characteristics and influencing factors of shared bicycle riding destinations in the main urban area of Guangzhou. J. Geogr. Res. 2019, 38, 2857–2872. [Google Scholar]
  65. Liu, B.; Gao, J.; Peng, B.; Wan, R. The spatial pattern and sub-industry distribution of Suzhou’s financial service industry based on POI data. J. Henan Univ. (Nat. Sci.) 2021, 51, 29–39. [Google Scholar]
  66. Gao, Y.; Song, C.; Guo, S.; Pei, T. Temporal and Spatial Characteristics and Influencing Factors of the Source and Sink of Shared Bicycles Connecting to Subway Stations. J. Geo Inf. Sci. 2021, 23, 155–170. [Google Scholar]
Figure 1. (a) Research area in Beijing; (b) Research Area of the darkened place in (a).
Ijgi 11 00477 g001
Figure 2. Heat map of shared bicycle spatial distribution at 17:00 and 20:00 from 19 May 2021 to 22 May 2021: (a) 17:00 19 May 2021; (b) 20:00 19 May 2021; (c) 17:00 22 May 2021; (d) 20:00 22 May 2021.
Ijgi 11 00477 g002
Figure 3. Spatial distribution of data in the research area: (a) POI of transportation facilities; (b) POI of financial services; (c) POI of education institution; (d) POI of residential area; (e) POI of shopping and dining places; (f) Road network in Urban Six Districts of Beijing.
Ijgi 11 00477 g003
Figure 4. Travel network construction. The data used in this paper include shared bike trajectories and study areas. The OD flows are generated from the shared bicycle trajectory, and the streets in the study area are extracted as network nodes. The location of the start and end points of the OD stream are determined by the location of the block. A travel network is generated with streets as nodes.
Ijgi 11 00477 g004
Figure 5. Bike travel network structure: (a) Weekday (17 May); (b) Weekday (18 May); (c) Weekdays (19–21 May); (d) Weekends (22–23 May).
Ijgi 11 00477 g005aIjgi 11 00477 g005b
Figure 6. Analysis of travel network characteristics: (a) Analysis of in-degree and out-degree during weekday (19–21 May); (b) Analysis of in-degree and out-degree during weekend (22–23 May); (c) Analysis of node strength during weekday (19–21 May); (d) Analysis of node strength during weekend (22–23 May); (e) NFR (19–23 May).
Ijgi 11 00477 g006aIjgi 11 00477 g006b
Figure 7. ERGM estimation results: (a) Coefficient values of all the influencing factors on weekdays; (b) Comparison of coefficient values of all influencing factors on weekdays and weekends; (c) Coefficient values of influencing factors other than Price, Bden and Res.
Ijgi 11 00477 g007
Table 1. Data sources.
Type of DataNumber of Data PiecesData SourceUpdate Date
Shared bicycle data1,903,655Hello BikeMay, 2021
POIs data168,271BaiduApril, 2021
Road network data103,592BaiduApril, 2021
Building data283,088BaiduApril, 2021
Housing prices data122BaiduApril, 2021
Table 2. ERGM variables description.
VariableSchematic DiagramStatisticsStatistical Significance
EdgesIjgi 11 00477 i001 i j y i , j Similar to linear regression constant term, generally not explained
MutualIjgi 11 00477 i002 i j y i , j y j , i Tests the mutual relationship between different street blocks
Table 3. Definitions of variables in the ERGM model.
Variable Measure UnitDefinition
Network structure effectsEdgesNumberEqual to the number of links in the network
Mutual Whether network nodes tend to form interactions
Node attribute effectsPriceThousand CNY per square kilometerAverage housing prices in the neighborhood
Bden%Street building density
RdenKilometer per square KilometerStreet road network density
TraNumberNumber of flow POI in the street, such as buses and subways
SaDNumberNumber of shopping and dining POI in the street
FinNumberNumber of financial service POI in the street
ResNumberNumber of POI in residential areas in the street
EduNumberNumber of education institution POI in the street
Table 4. Travel volume ranking.
PeriodsOriginDirectionDestinationFlow
Weekday
(19–21 May)
Dougezhuang District OfficeIjgi 11 00477 i003Wangjing Development Street1532
Xincun Sub-district OfficeIjgi 11 00477 i003Huaxiang District Office1184
Changying District OfficeIjgi 11 00477 i003Gaobeidian District Office1101
Panjiayuan Sub-district OfficeIjgi 11 00477 i003Dougezhuang District Office891
Maizidian Sub-district OfficeIjgi 11 00477 i003Shibalidian District Office853
Hujialou Sub-district OfficeIjgi 11 00477 i003Liulitun Sub-district Office812
Laiguangying District OfficeIjgi 11 00477 i003Cui Gezhuang District Office670
Wangjing Development StreetIjgi 11 00477 i003Shibalidian District Office645
Zuojiazhuang Sub-district OfficeIjgi 11 00477 i003Shibalidian District Office612
Wangjing Development StreetIjgi 11 00477 i003Zuojiazhuang Sub-district Office604
Weekend
(22–23 May)
Xincun Sub-district OfficeIjgi 11 00477 i003Huaxiang District Office946
Huaxiang District OfficeIjgi 11 00477 i003Xincun Sub-district Office880
Lugouqiao District OfficeIjgi 11 00477 i003Lugouqiao Sub-district Office565
Lugouqiao Sub-district OfficeIjgi 11 00477 i003Lugouqiao District Office536
Jinzhan District OfficeIjgi 11 00477 i003Hujialou Sub-district Office444
Hujialou Sub-district OfficeIjgi 11 00477 i003Jinzhan District Office416
Qinghe Sub-district OfficeIjgi 11 00477 i003Xisanqi Sub-district Office386
Shangdi Sub-district OfficeIjgi 11 00477 i003Qinghe Sub-district Office371
Xisanqi Sub-district OfficeIjgi 11 00477 i003Qinghe Sub-district Office367
Dongsheng District OfficeIjgi 11 00477 i003Xisanqi Sub-district Office361
Table 5. Basic index statistics of the network.
PeriodsNumber of NodesAverage Node StrengthNetwork Density
Weekday (17 May)122215.150.1660344
Weekday (18 May)122210.970.1608183
Weekday (19–21 May)1221275.680.2518629
Weekend (22–23 May)1221459.230.3504945
Table 6. Analysis of the influencing factors of the travel network.
Dependent Variable
WeekdayWeekend
17 May18 May19–21 May22–23 May
Network structure
Edges−5.001 ***−4.941 ***−4.689 ***−5.389 ***
(0.0087)(0.0090)(0.0087)(0.013)
Mutual2.66 ***2.801 ***2.305 ***4.37 ***
(0.0041)(0.0041)(0.0036)(0.0053)
Node attribute
Price0.00066 ***0.00062 ***0.00067 ***0.00067 ***
(0.000062)(0.000061)(0.000054)(0.000052)
Bden0.001003 ***0.00083 **0.0016 ***0.0015 ***
(0.00028)(0.00027)(0.00024)(0.00021)
Rden0.000089 ***0.000096 ***0.00008 ***0.00011 ***
(0.000018)(0.000020)(0.000017)(0.000015)
Tra0.00025 ***0.00016 *0.00022 ***0.00017 ***
(0.000065)(0.000065)(0.00006)(0.000049)
SaD0.00015 ***0.00015 ***0.00016 ***0.00016 ***
(0.000020)(0.000021)(0.000023)(0.000015)
Fin0.00049 ***0.00036 **0.0004 ***0.00025 **
(0.00011)(0.00012)(0.000098)(0.000097)
Res0.00048 ***0.00052 ***0.00057 ***0.00049 ***
(0.00012)(0.00011)(0.000099)(0.00009)
Edu0.00012 ***0.00014 **0.00013 *0.00018 **
(0.000089)(0.000079)(0.00007)(0.000062)
AIC10575107671383812334
BIC10651108431391412410
Note: * p < 0.1, ** p < 0.05, *** p < 0.01.
Publisher’s Note: MDPI stays neutral with regard to jurisdictional claims in published maps and institutional affiliations.

