
Identification of Urban Agglomeration Spatial Range Based on Social and Remote-Sensing Data—For Evaluating Development Level of Urban Agglomeration

Abstract
:1. Introduction
2. Materials and Methods
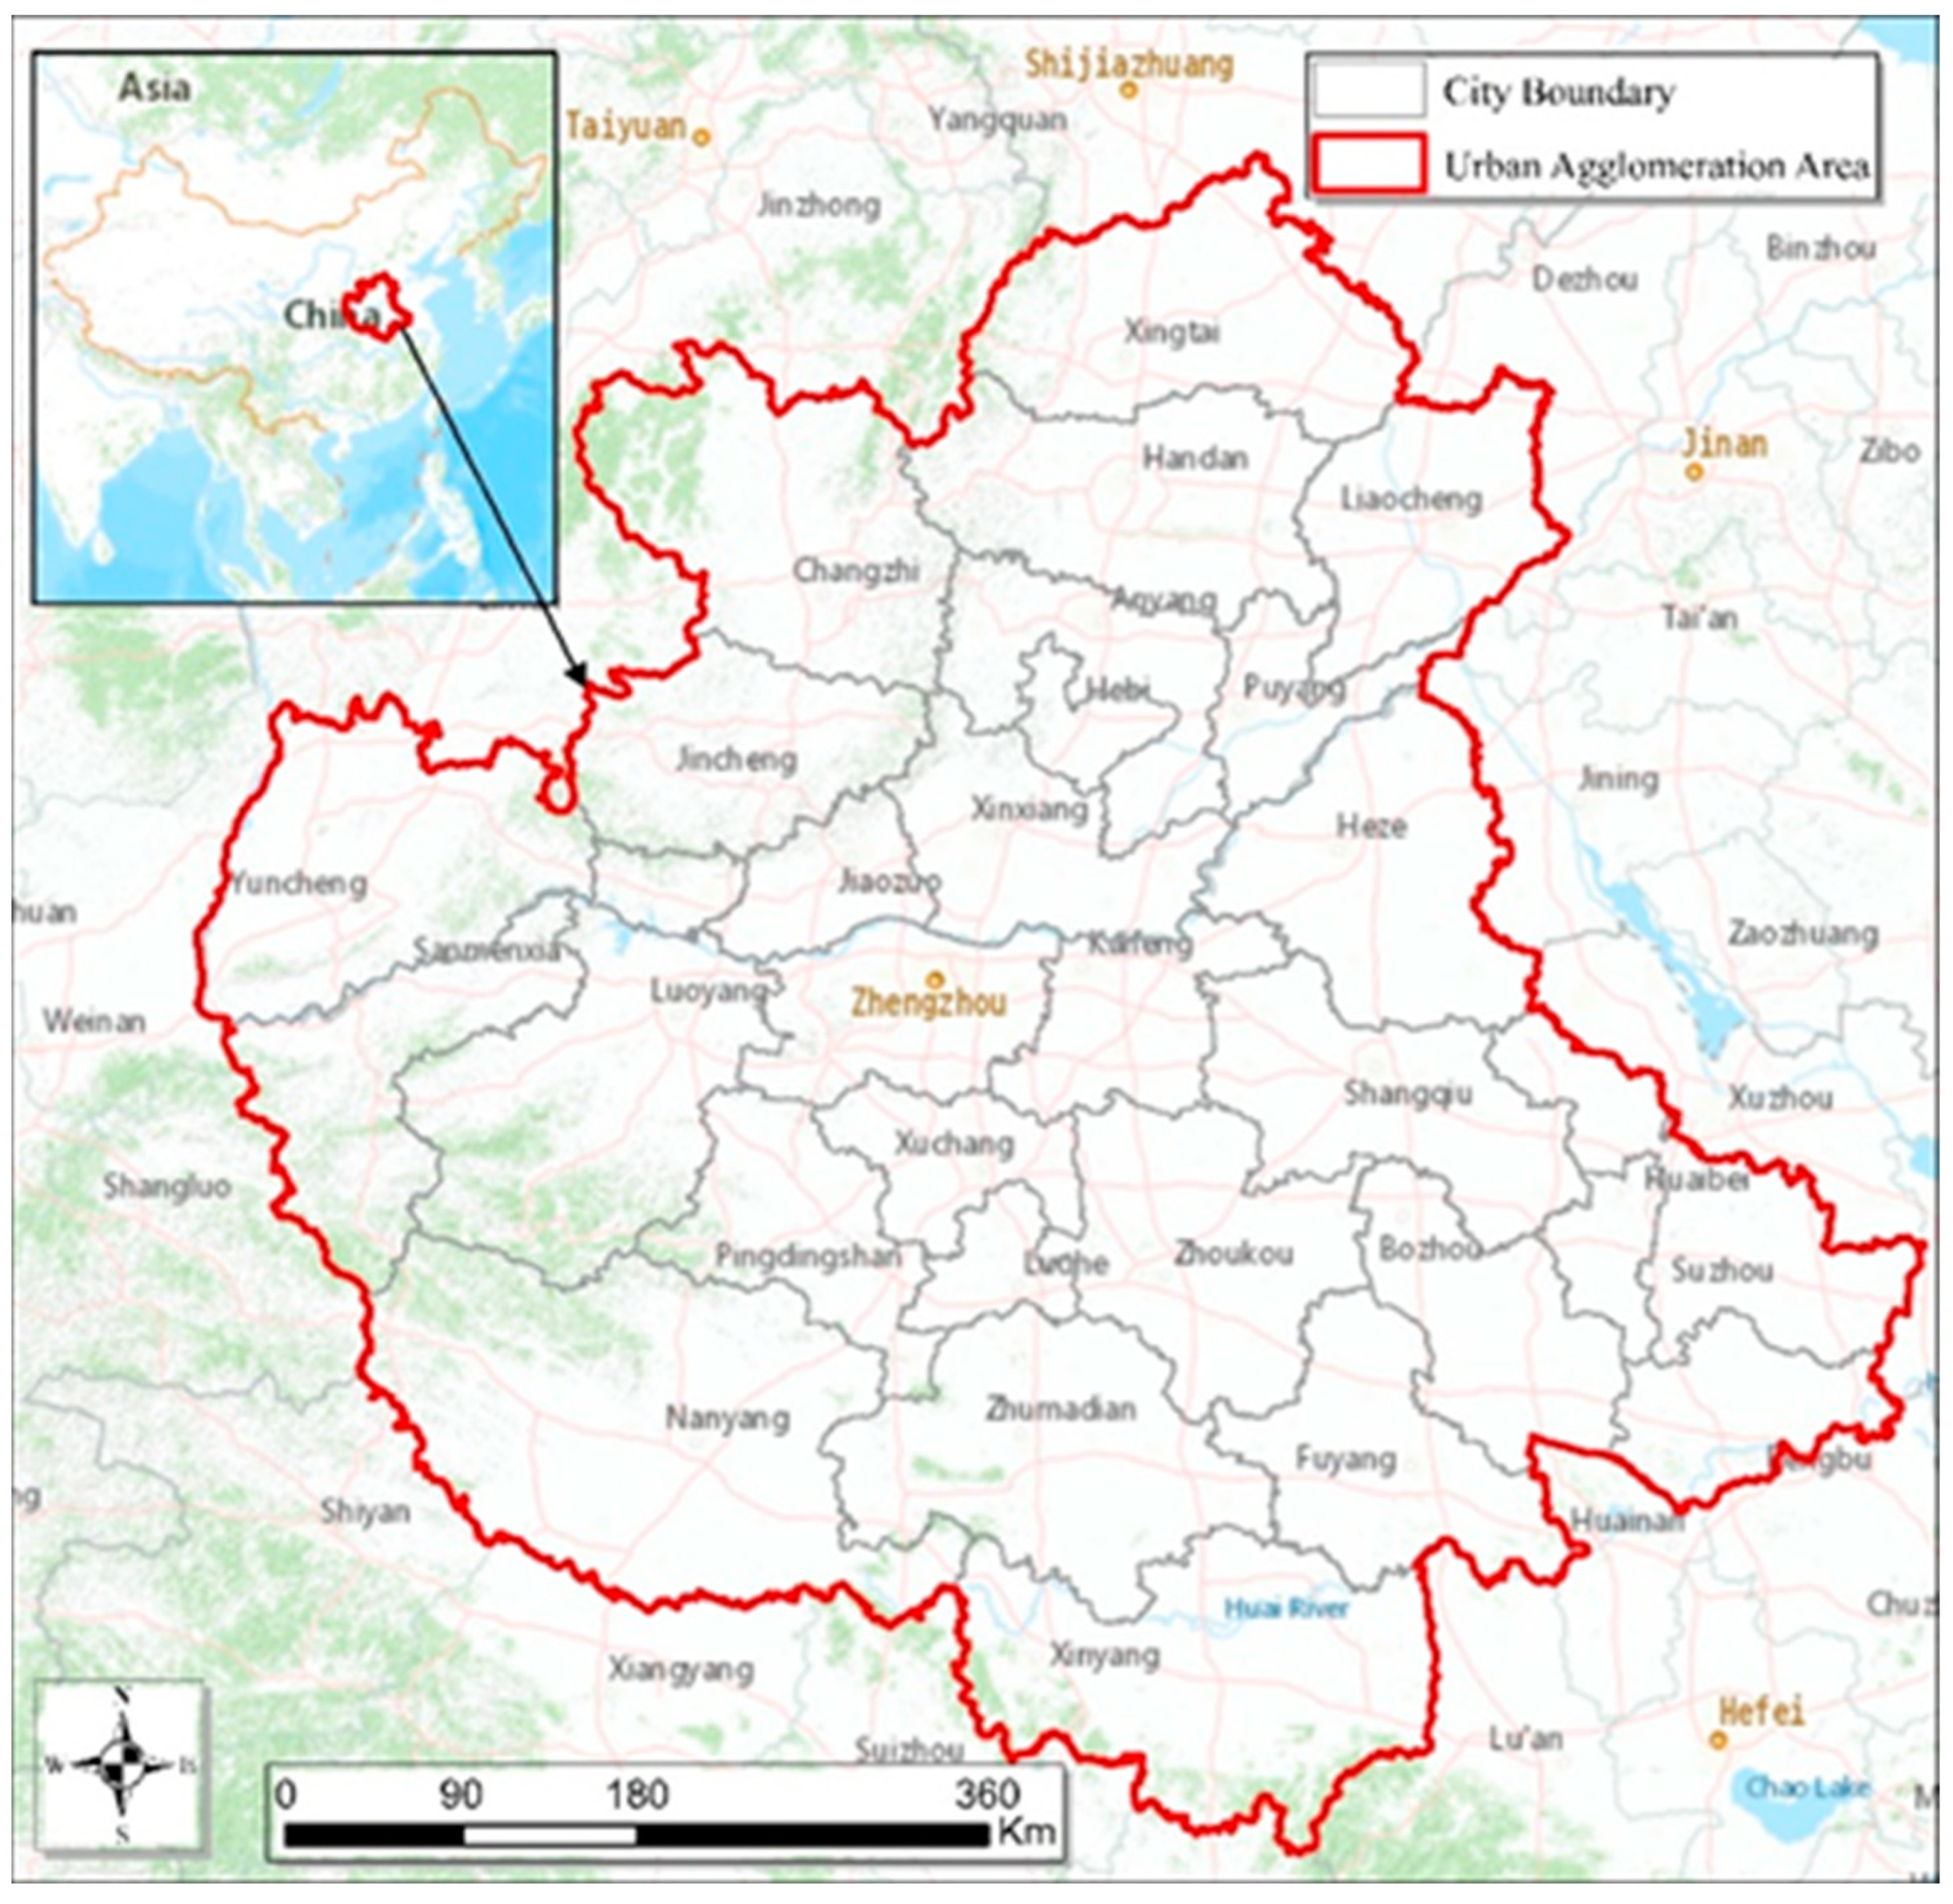
2.1. Study Area
2.2. Study Data
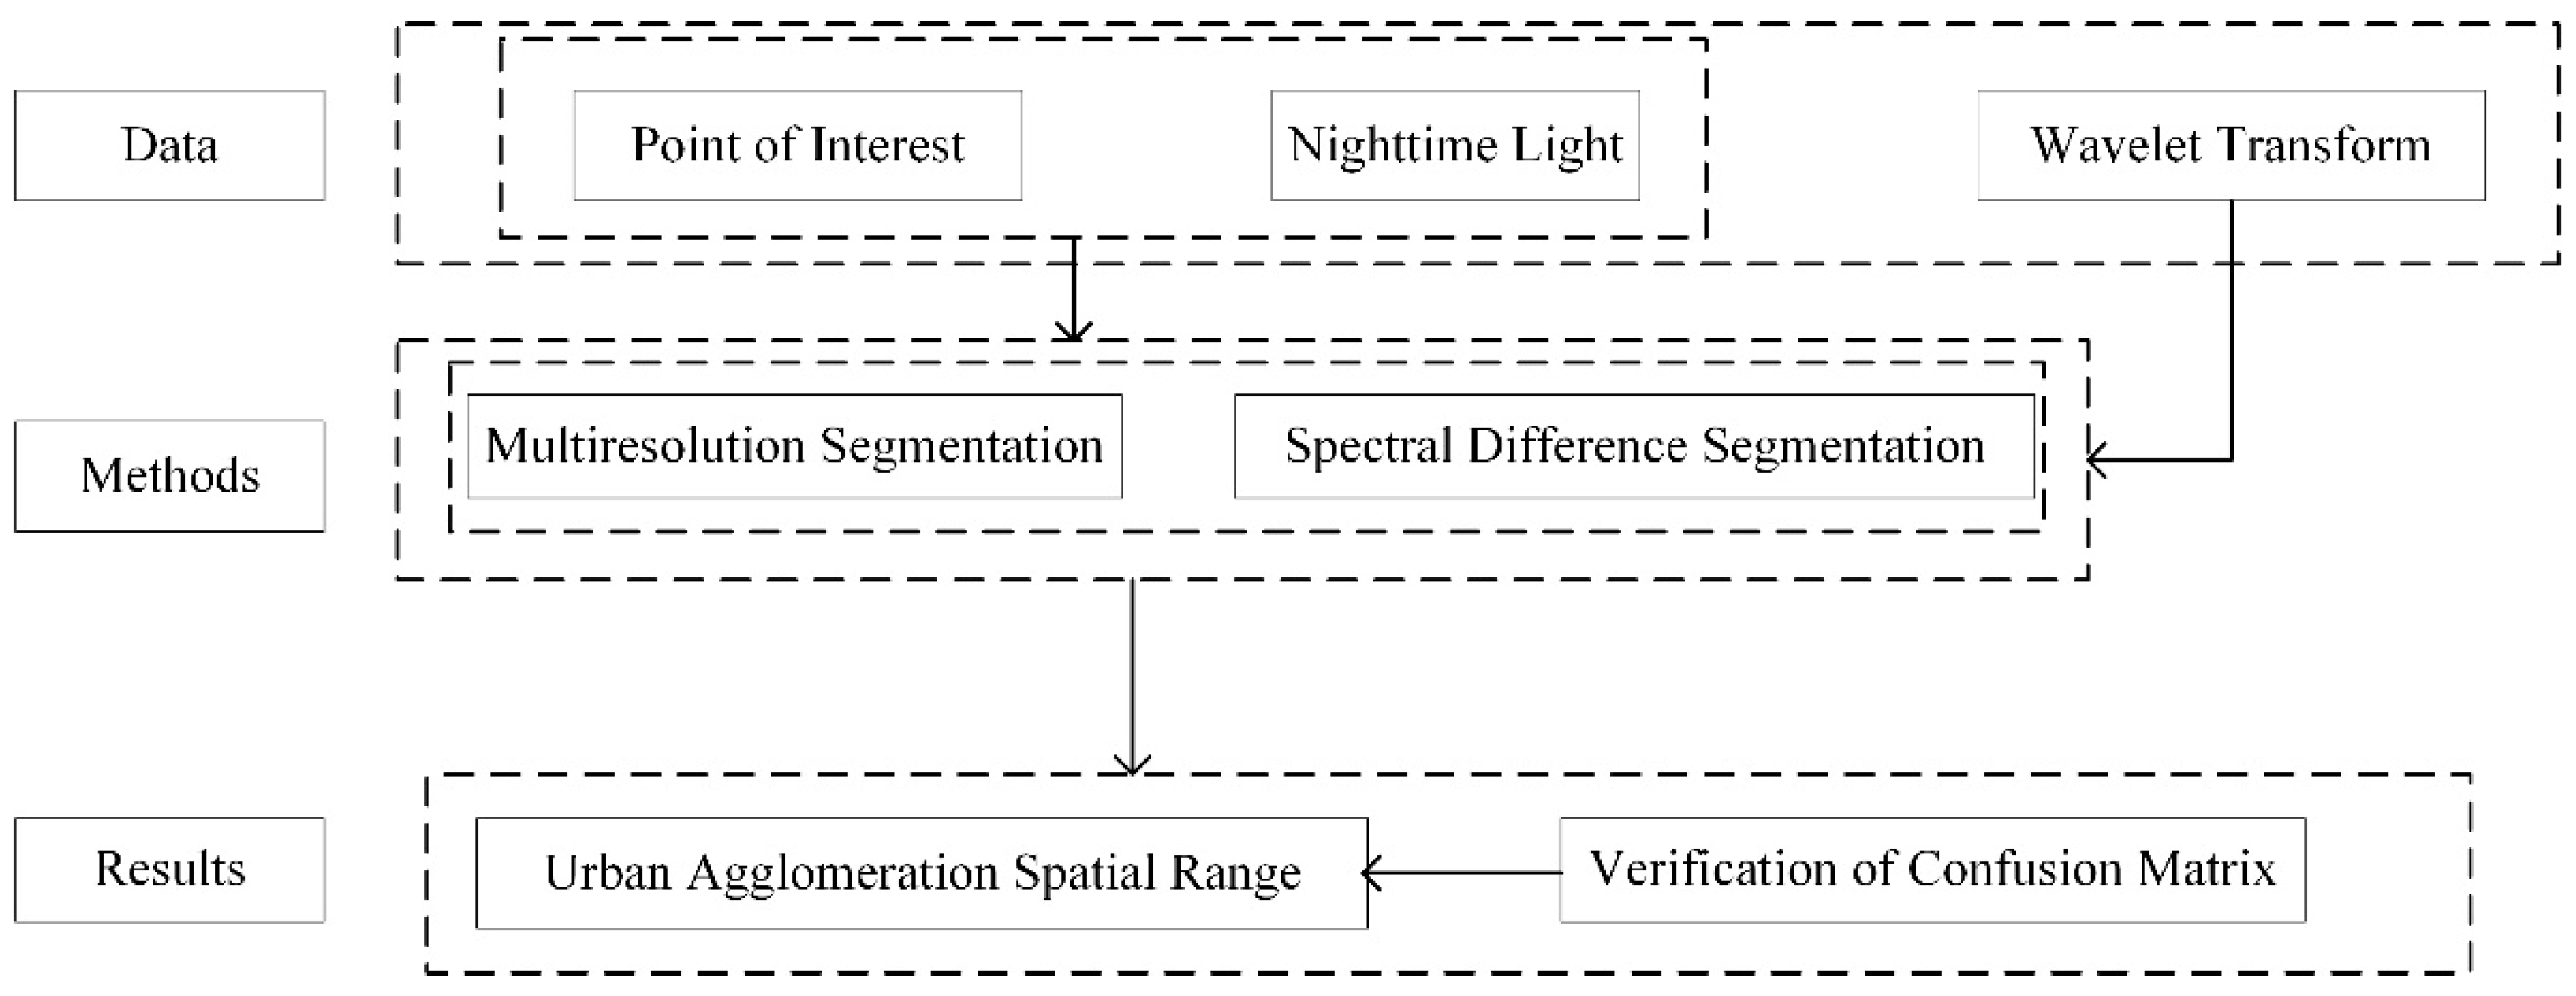
2.3. Methods
2.3.1. Wavelet Transform (WT)
2.3.2. Object-Oriented Image Segmentation
2.3.3. Accuracy Verification
3. Results
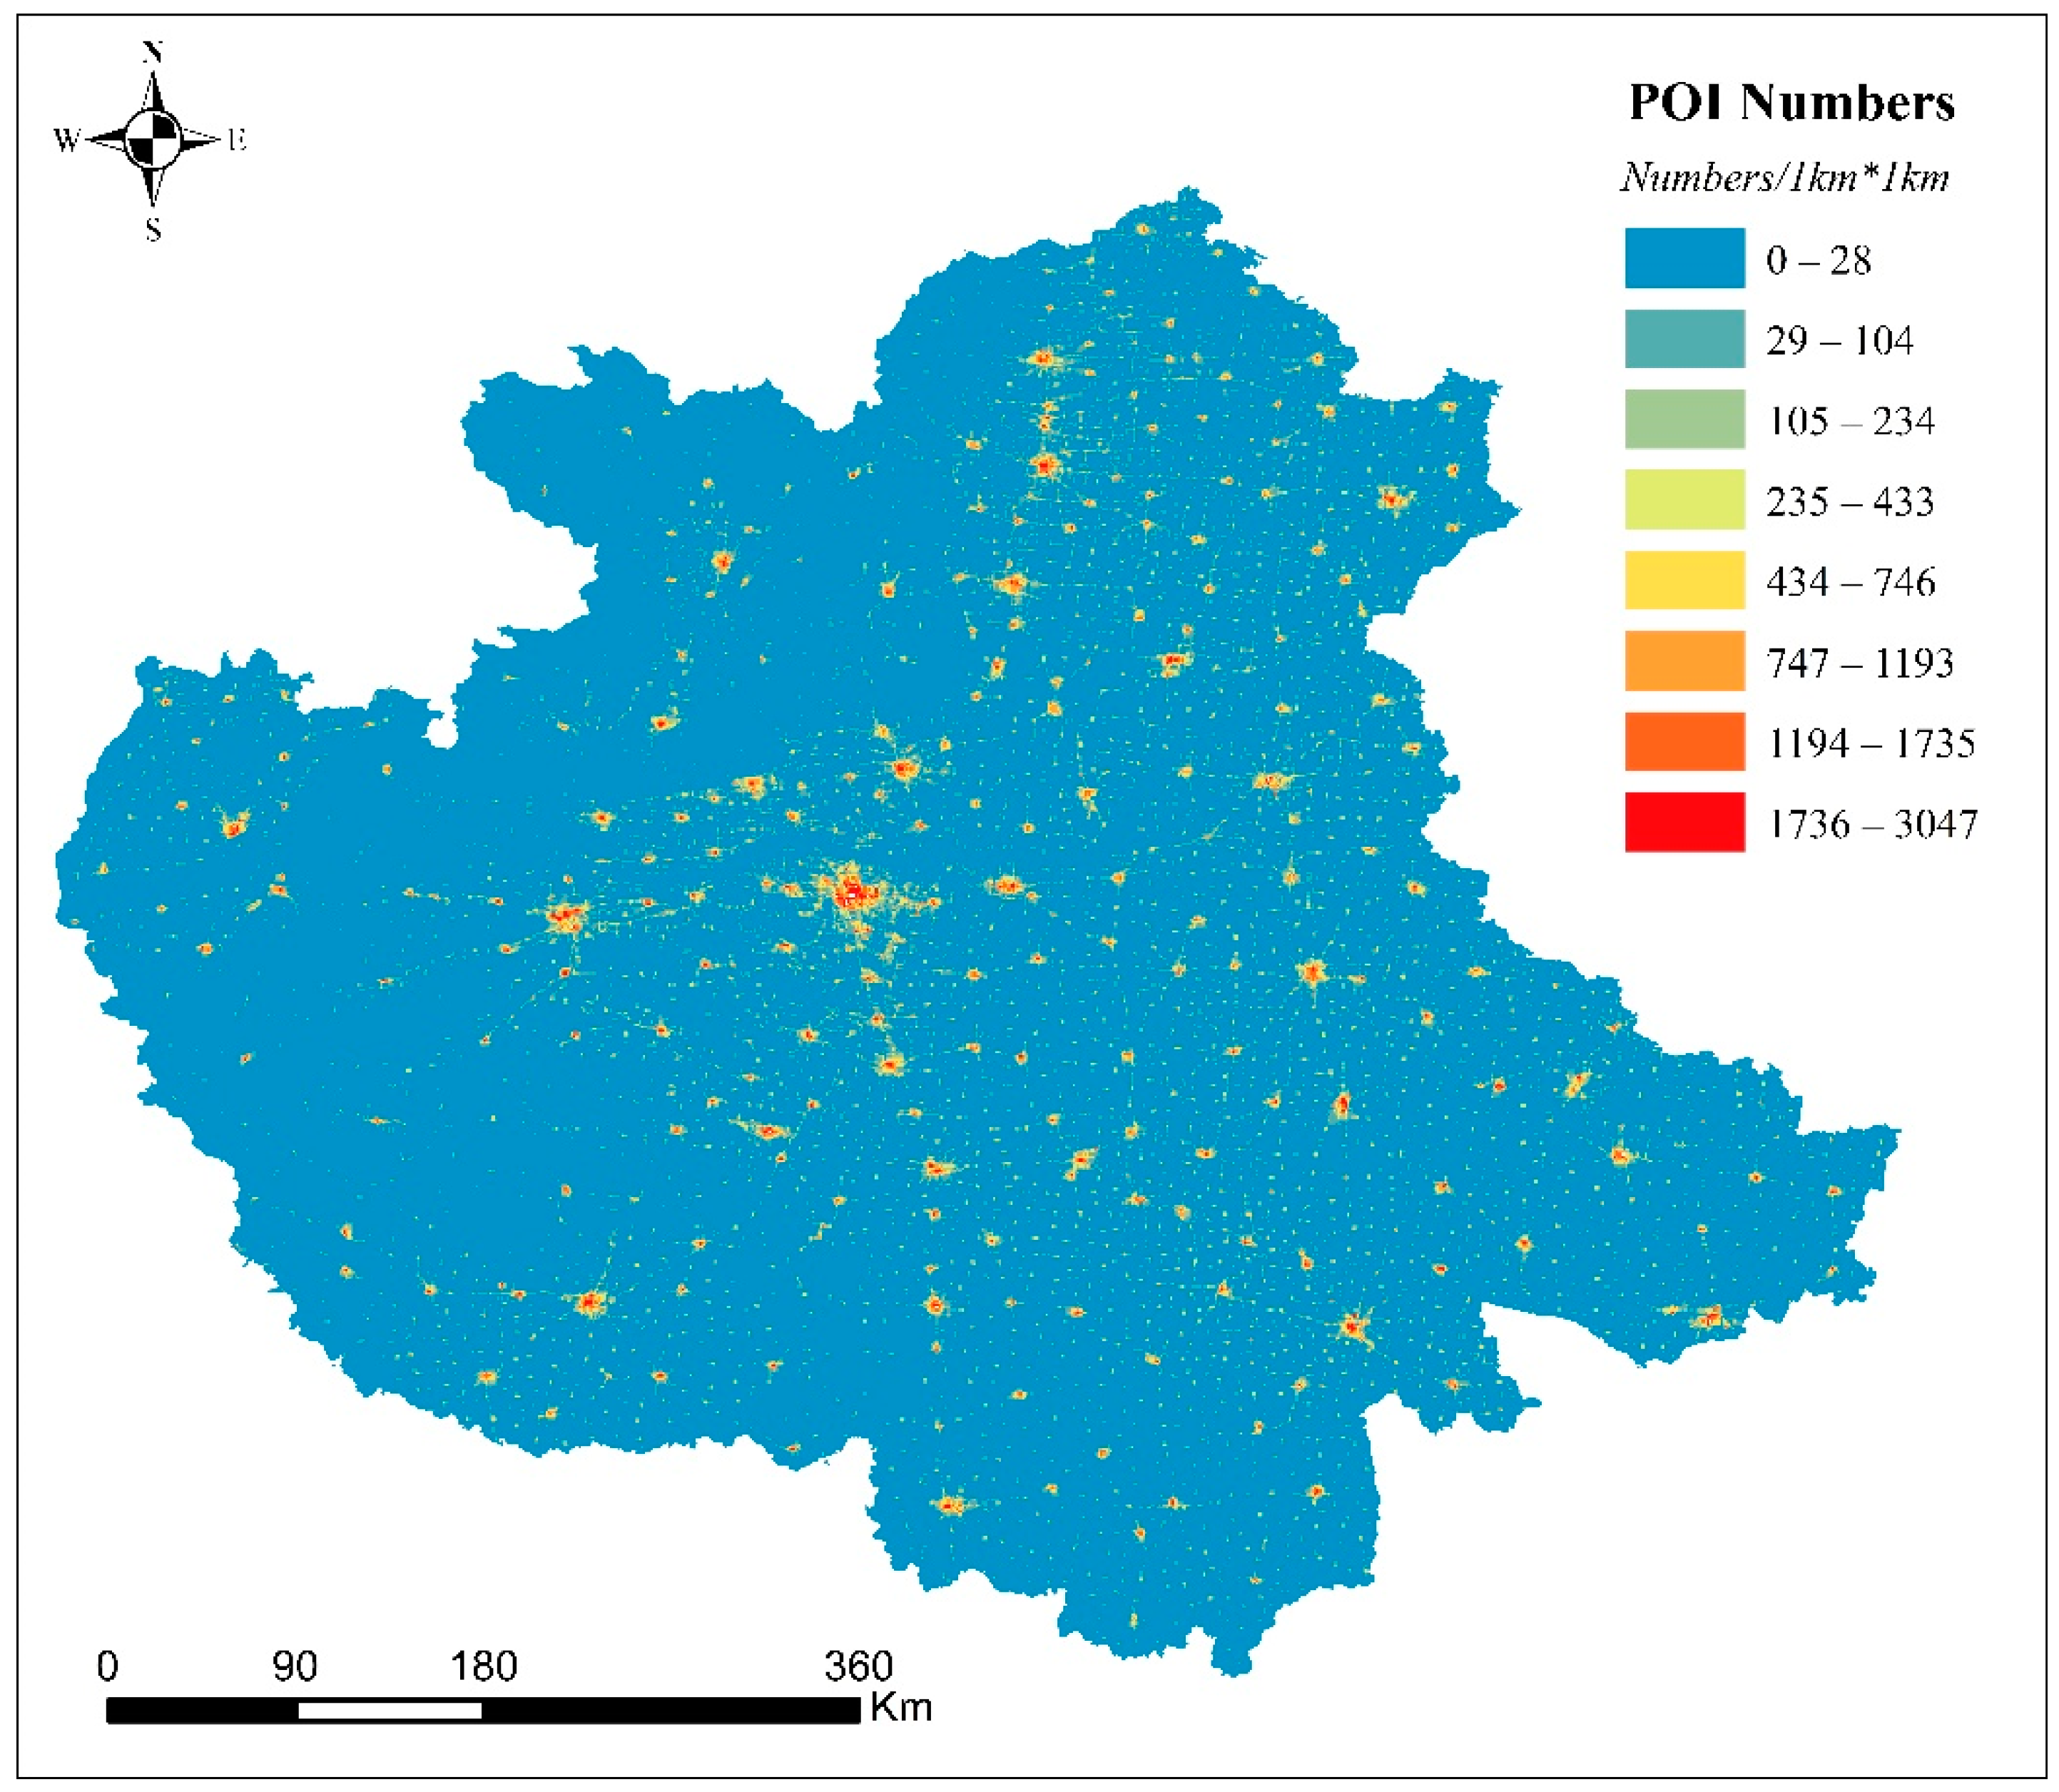
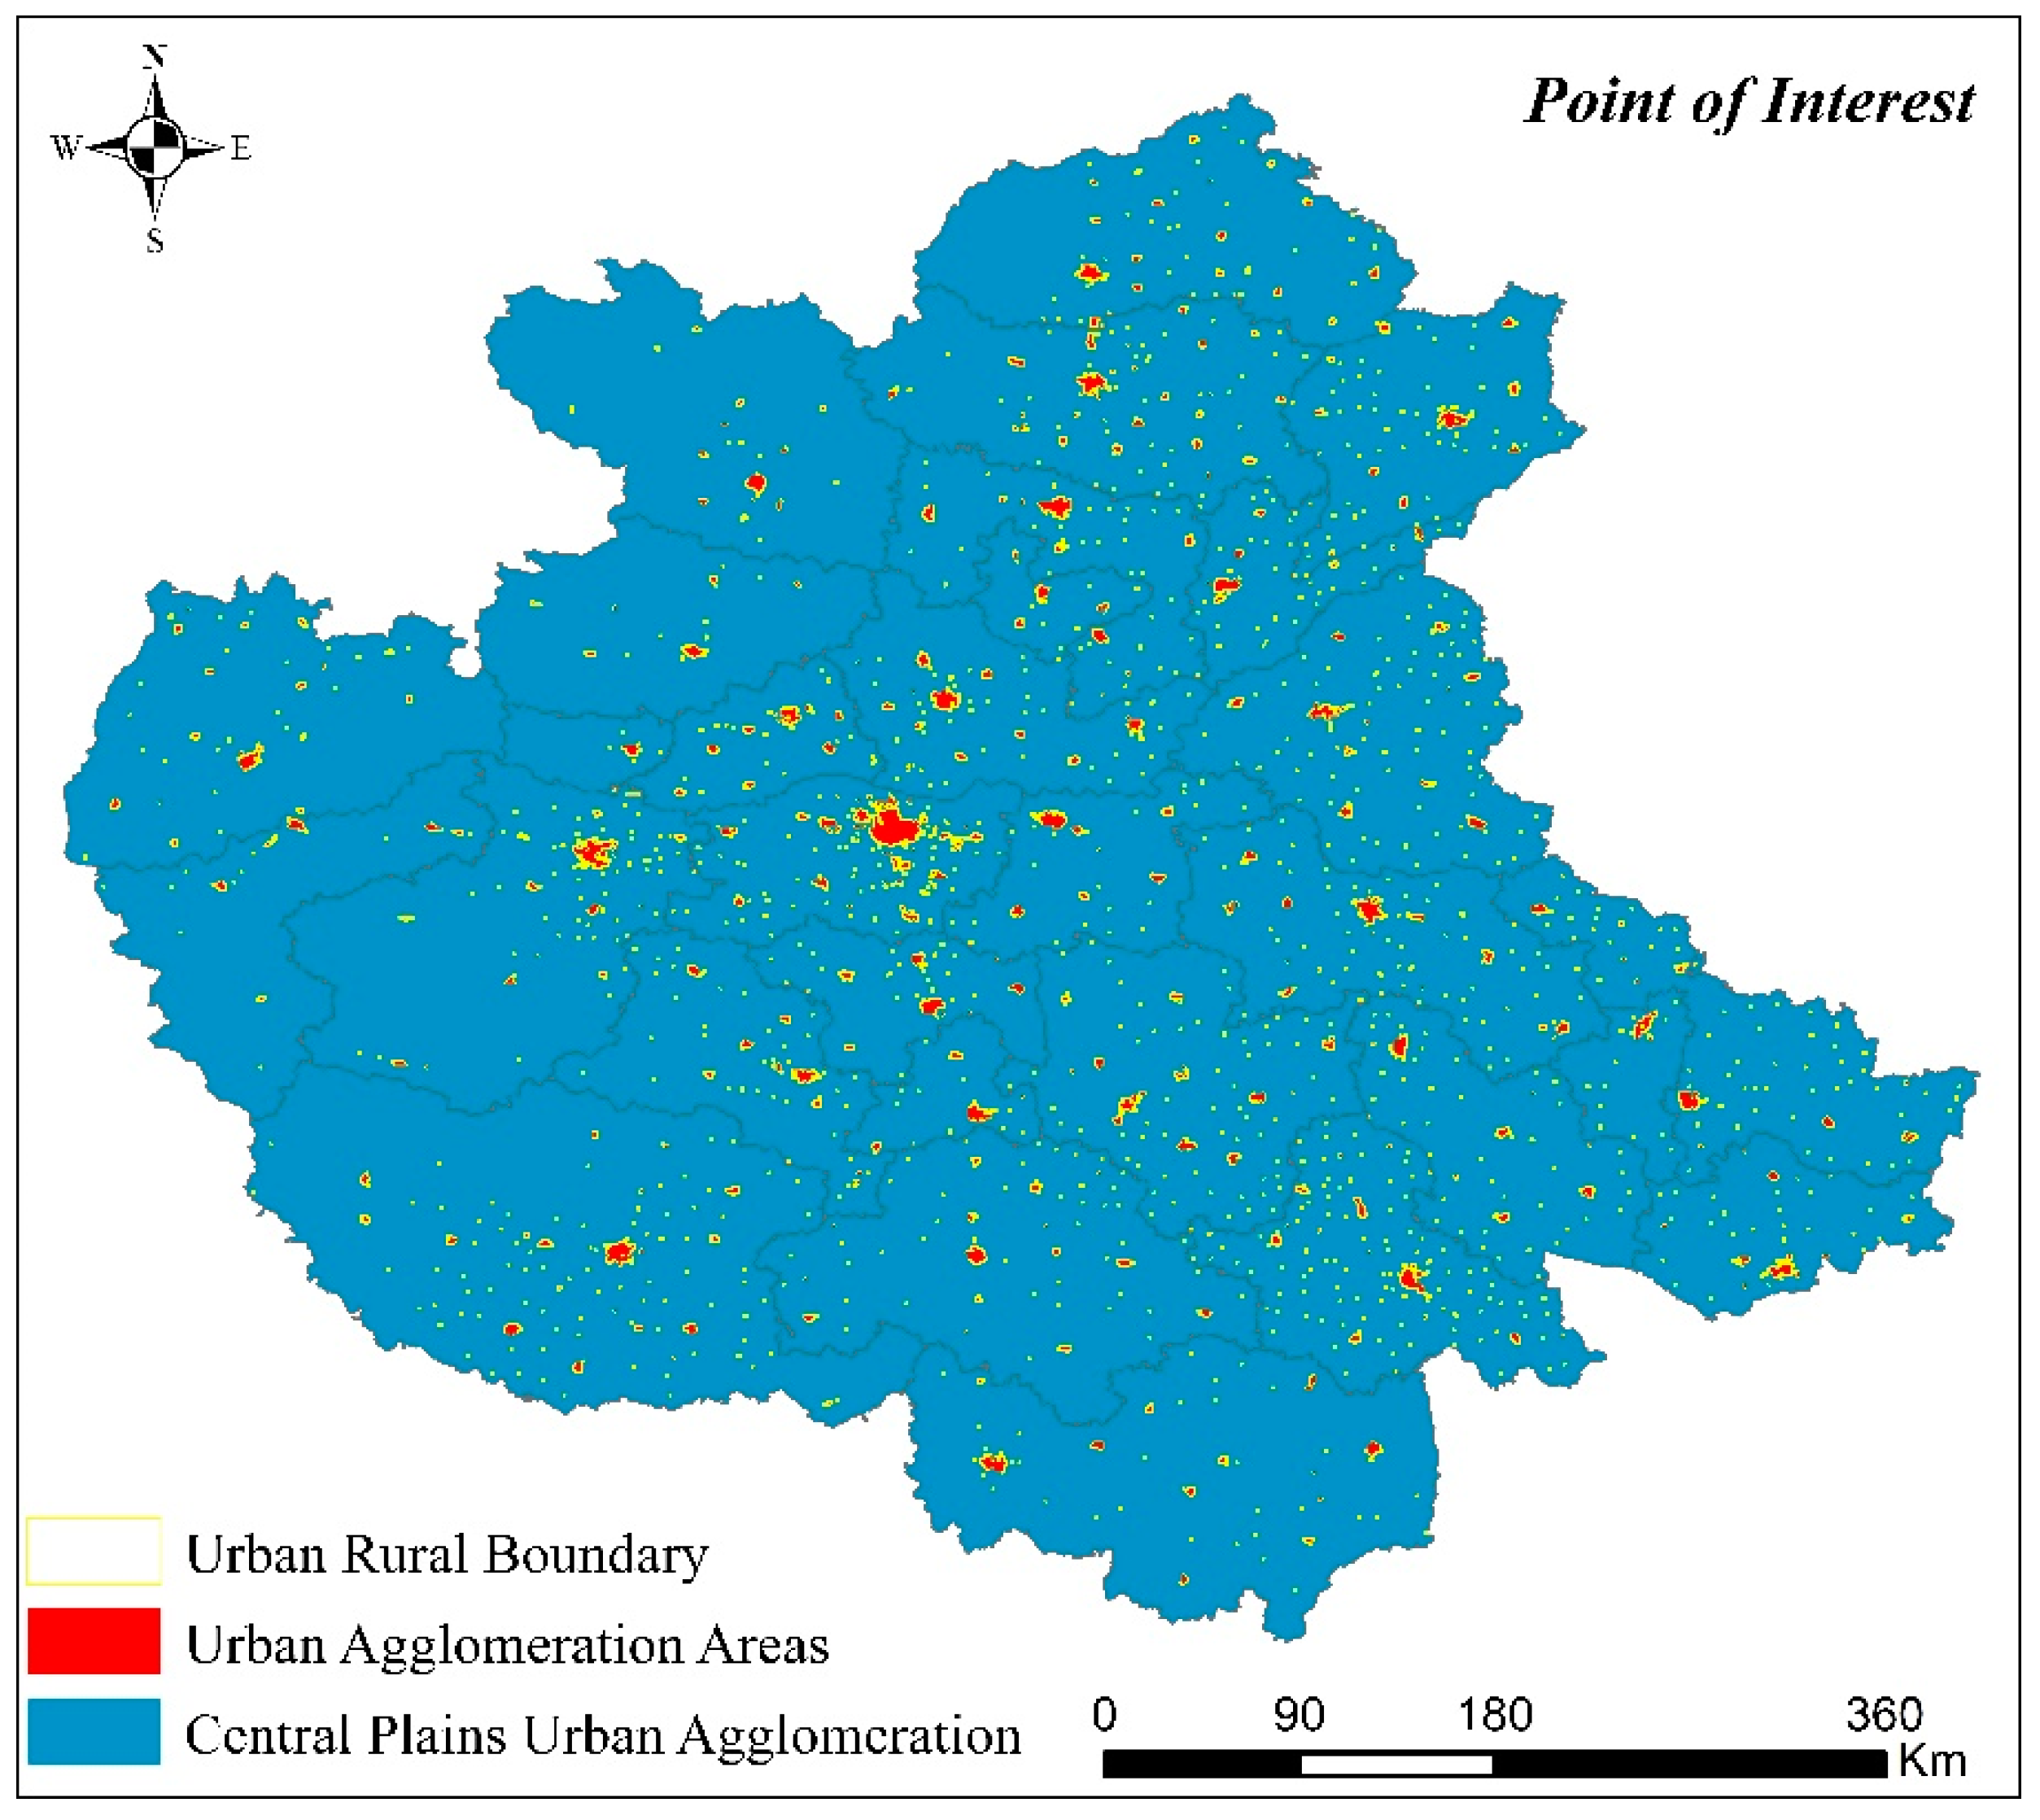
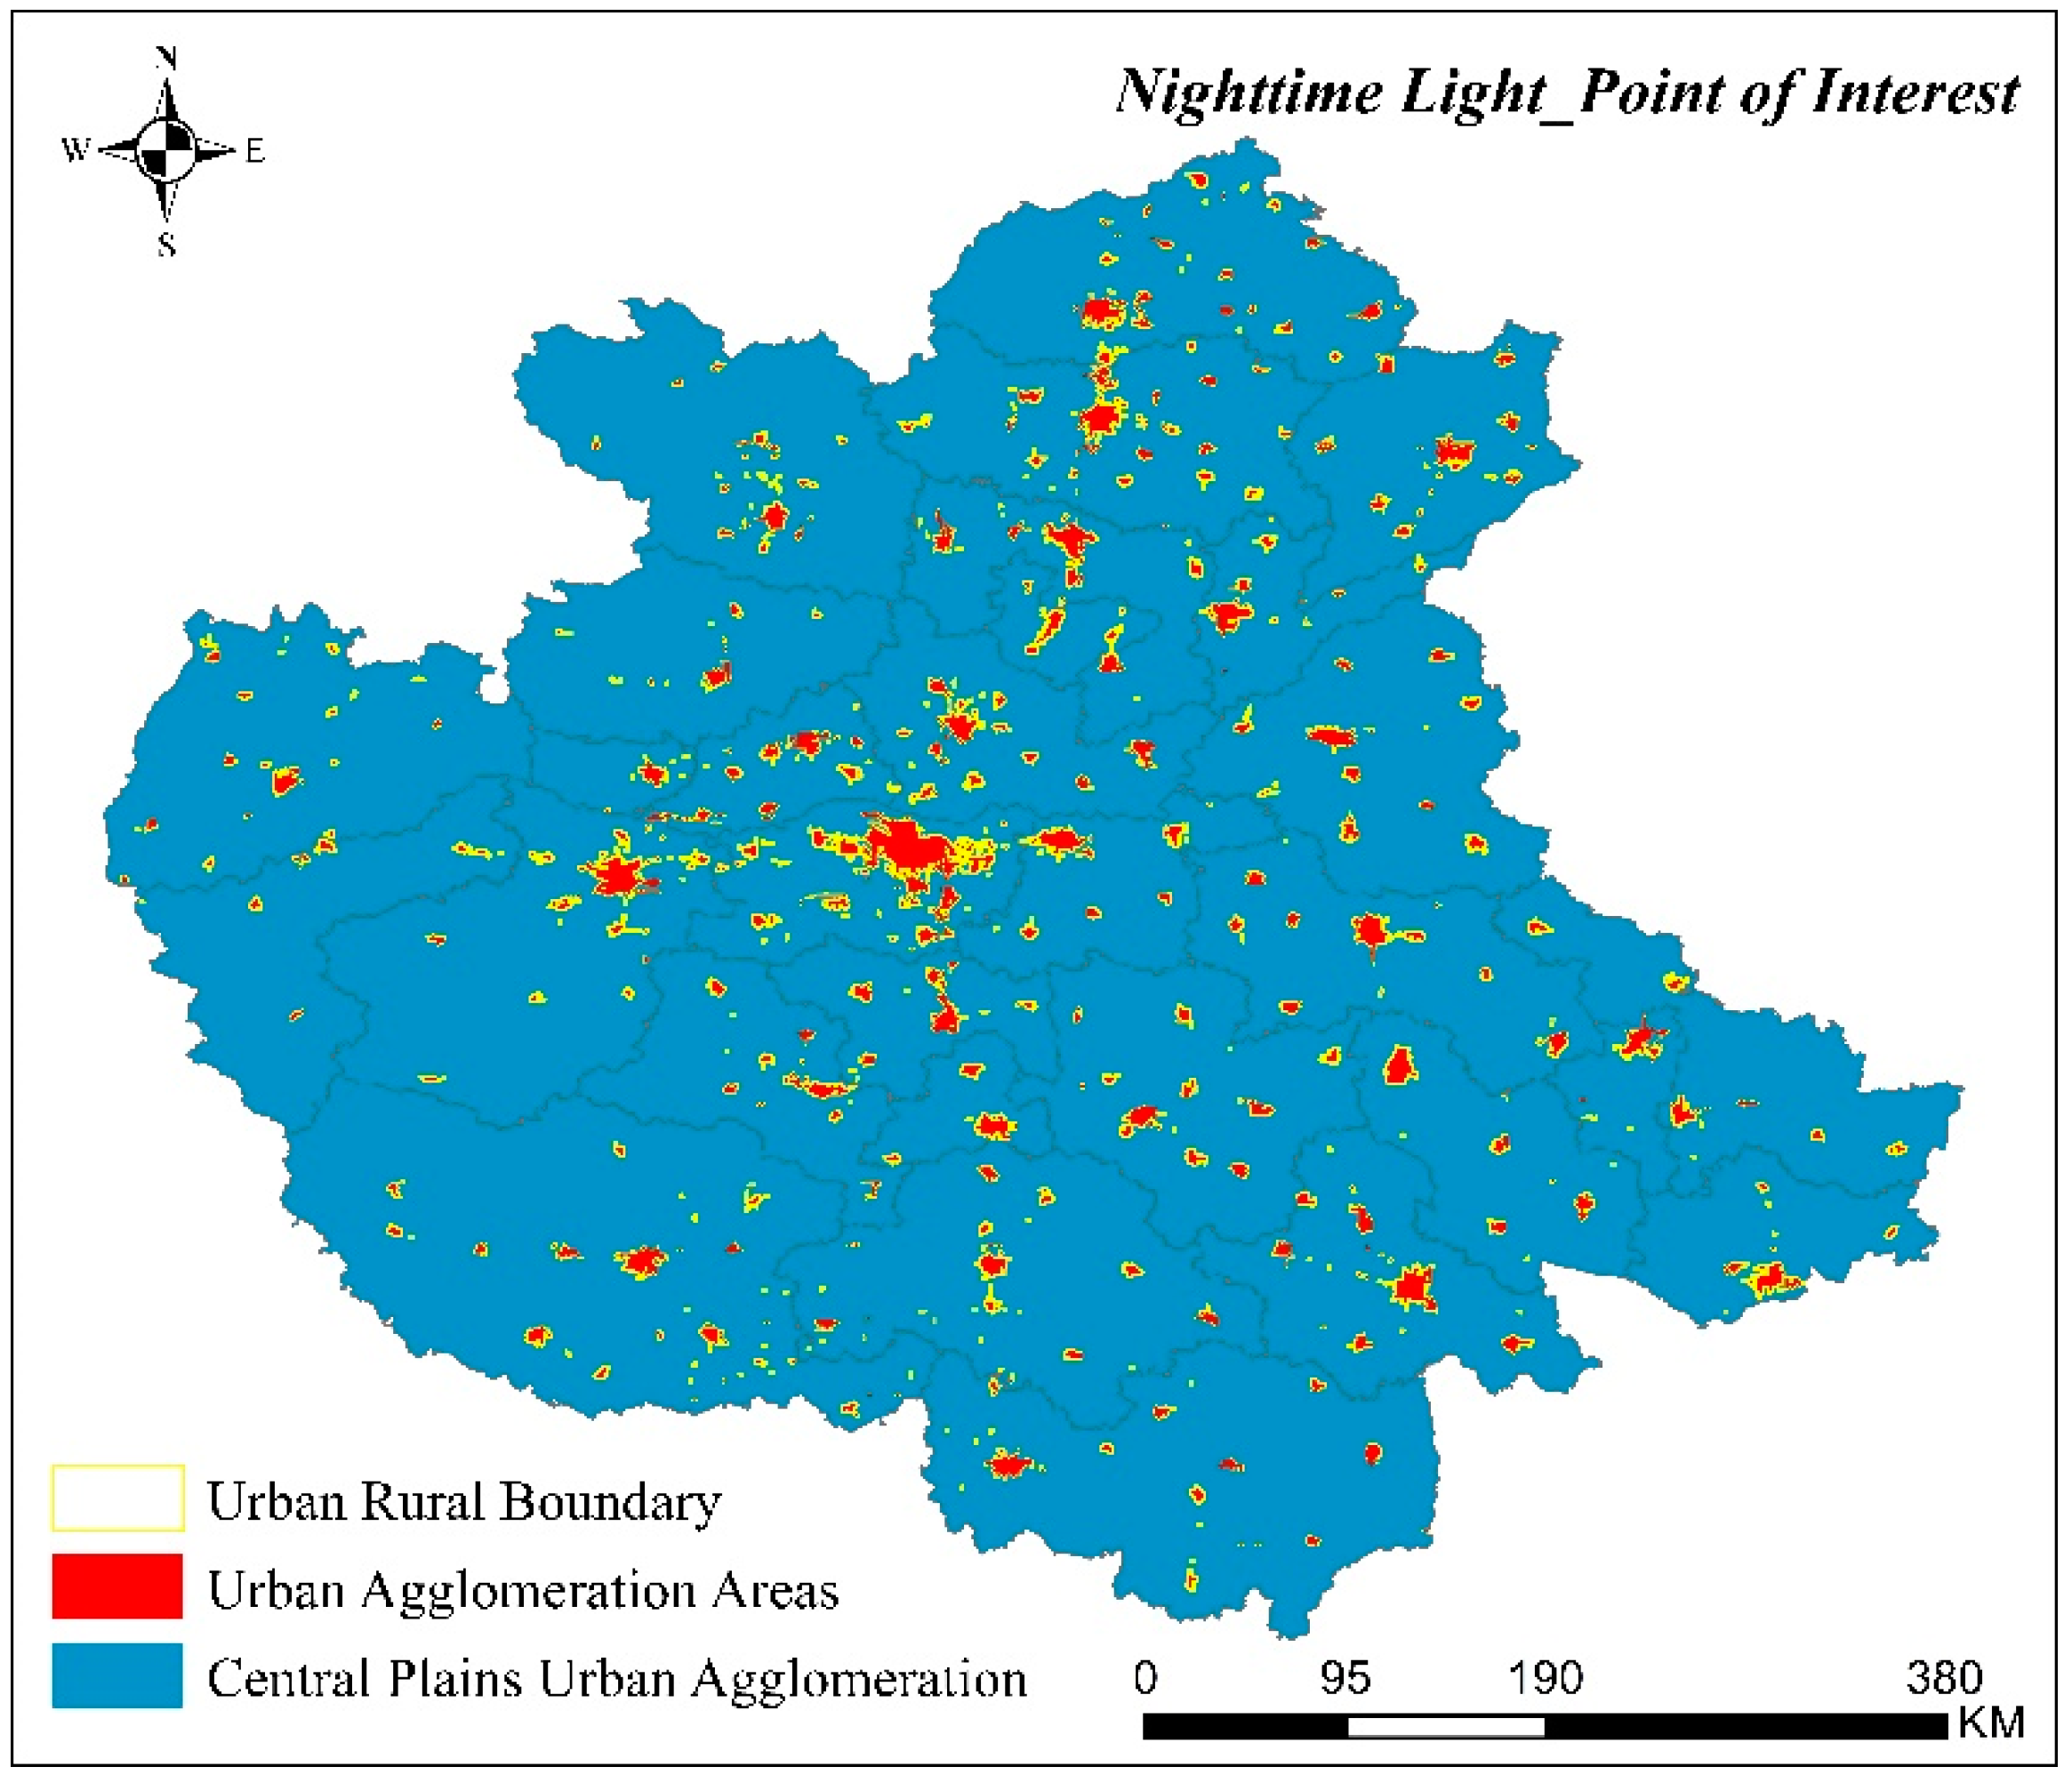
3.1. Spatial Area of CPUA Identified by POI Data
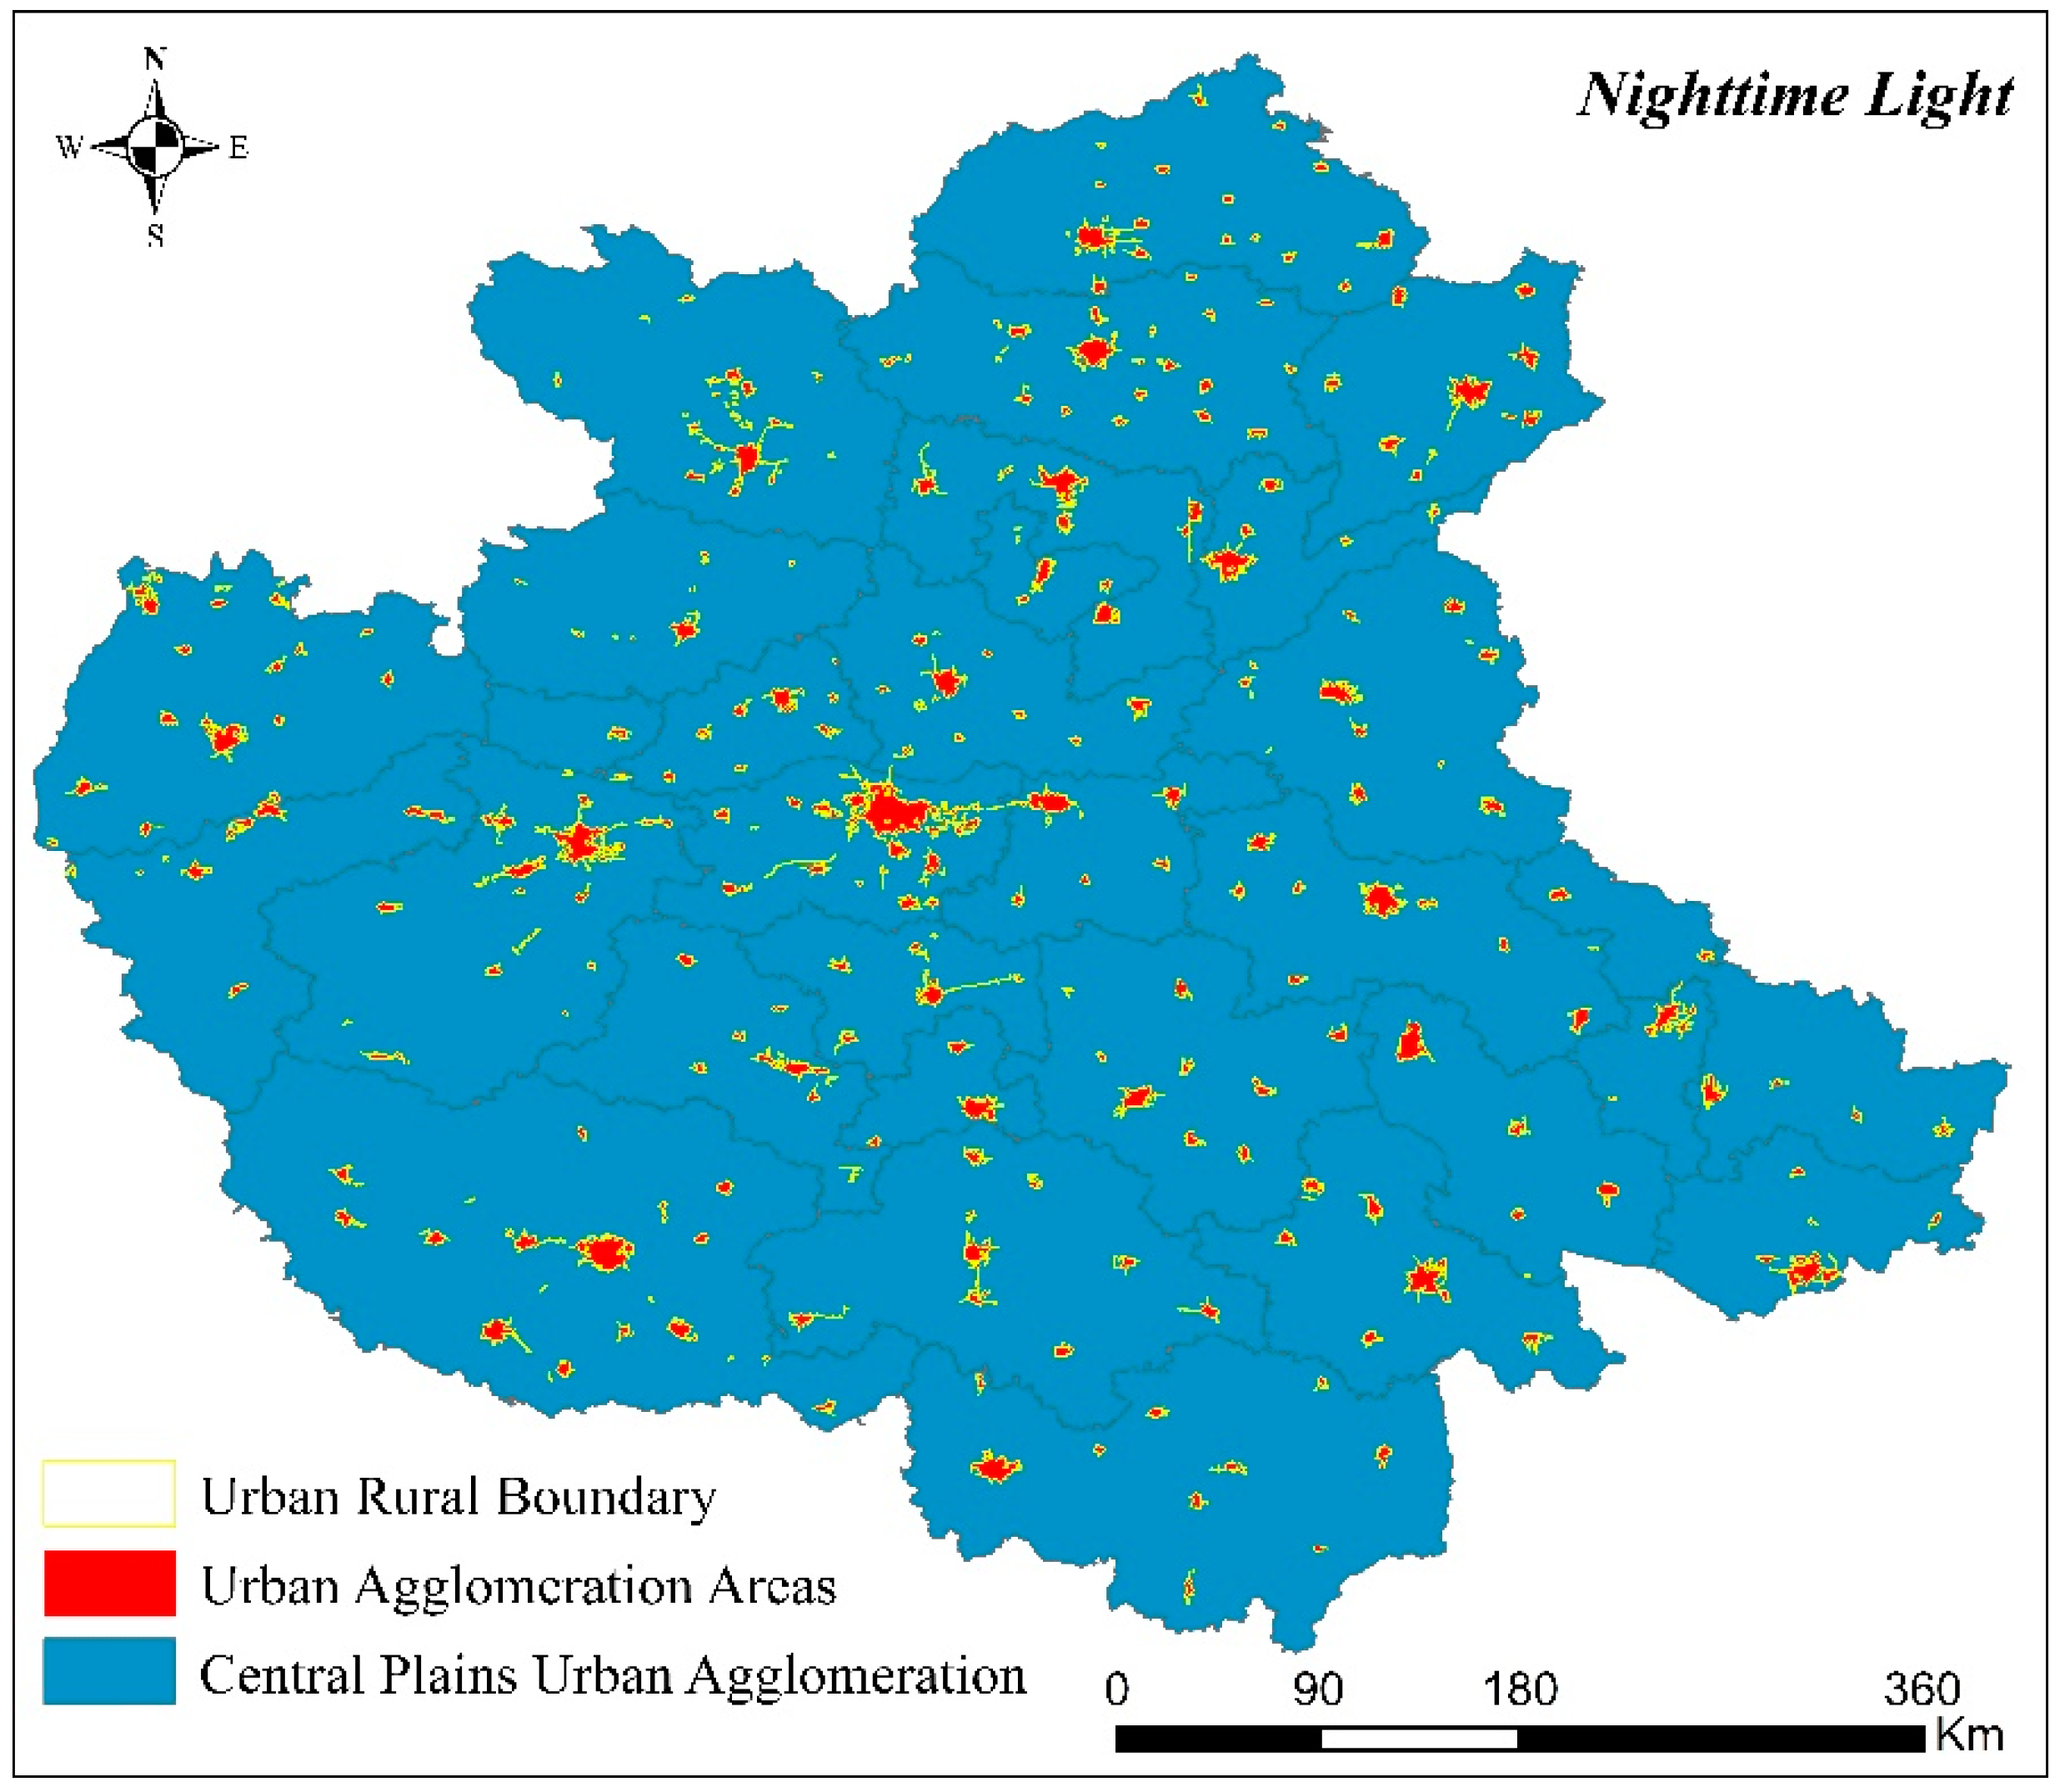
3.2. Spatial Area of CPUA Identified by NPP/VIIRS Data
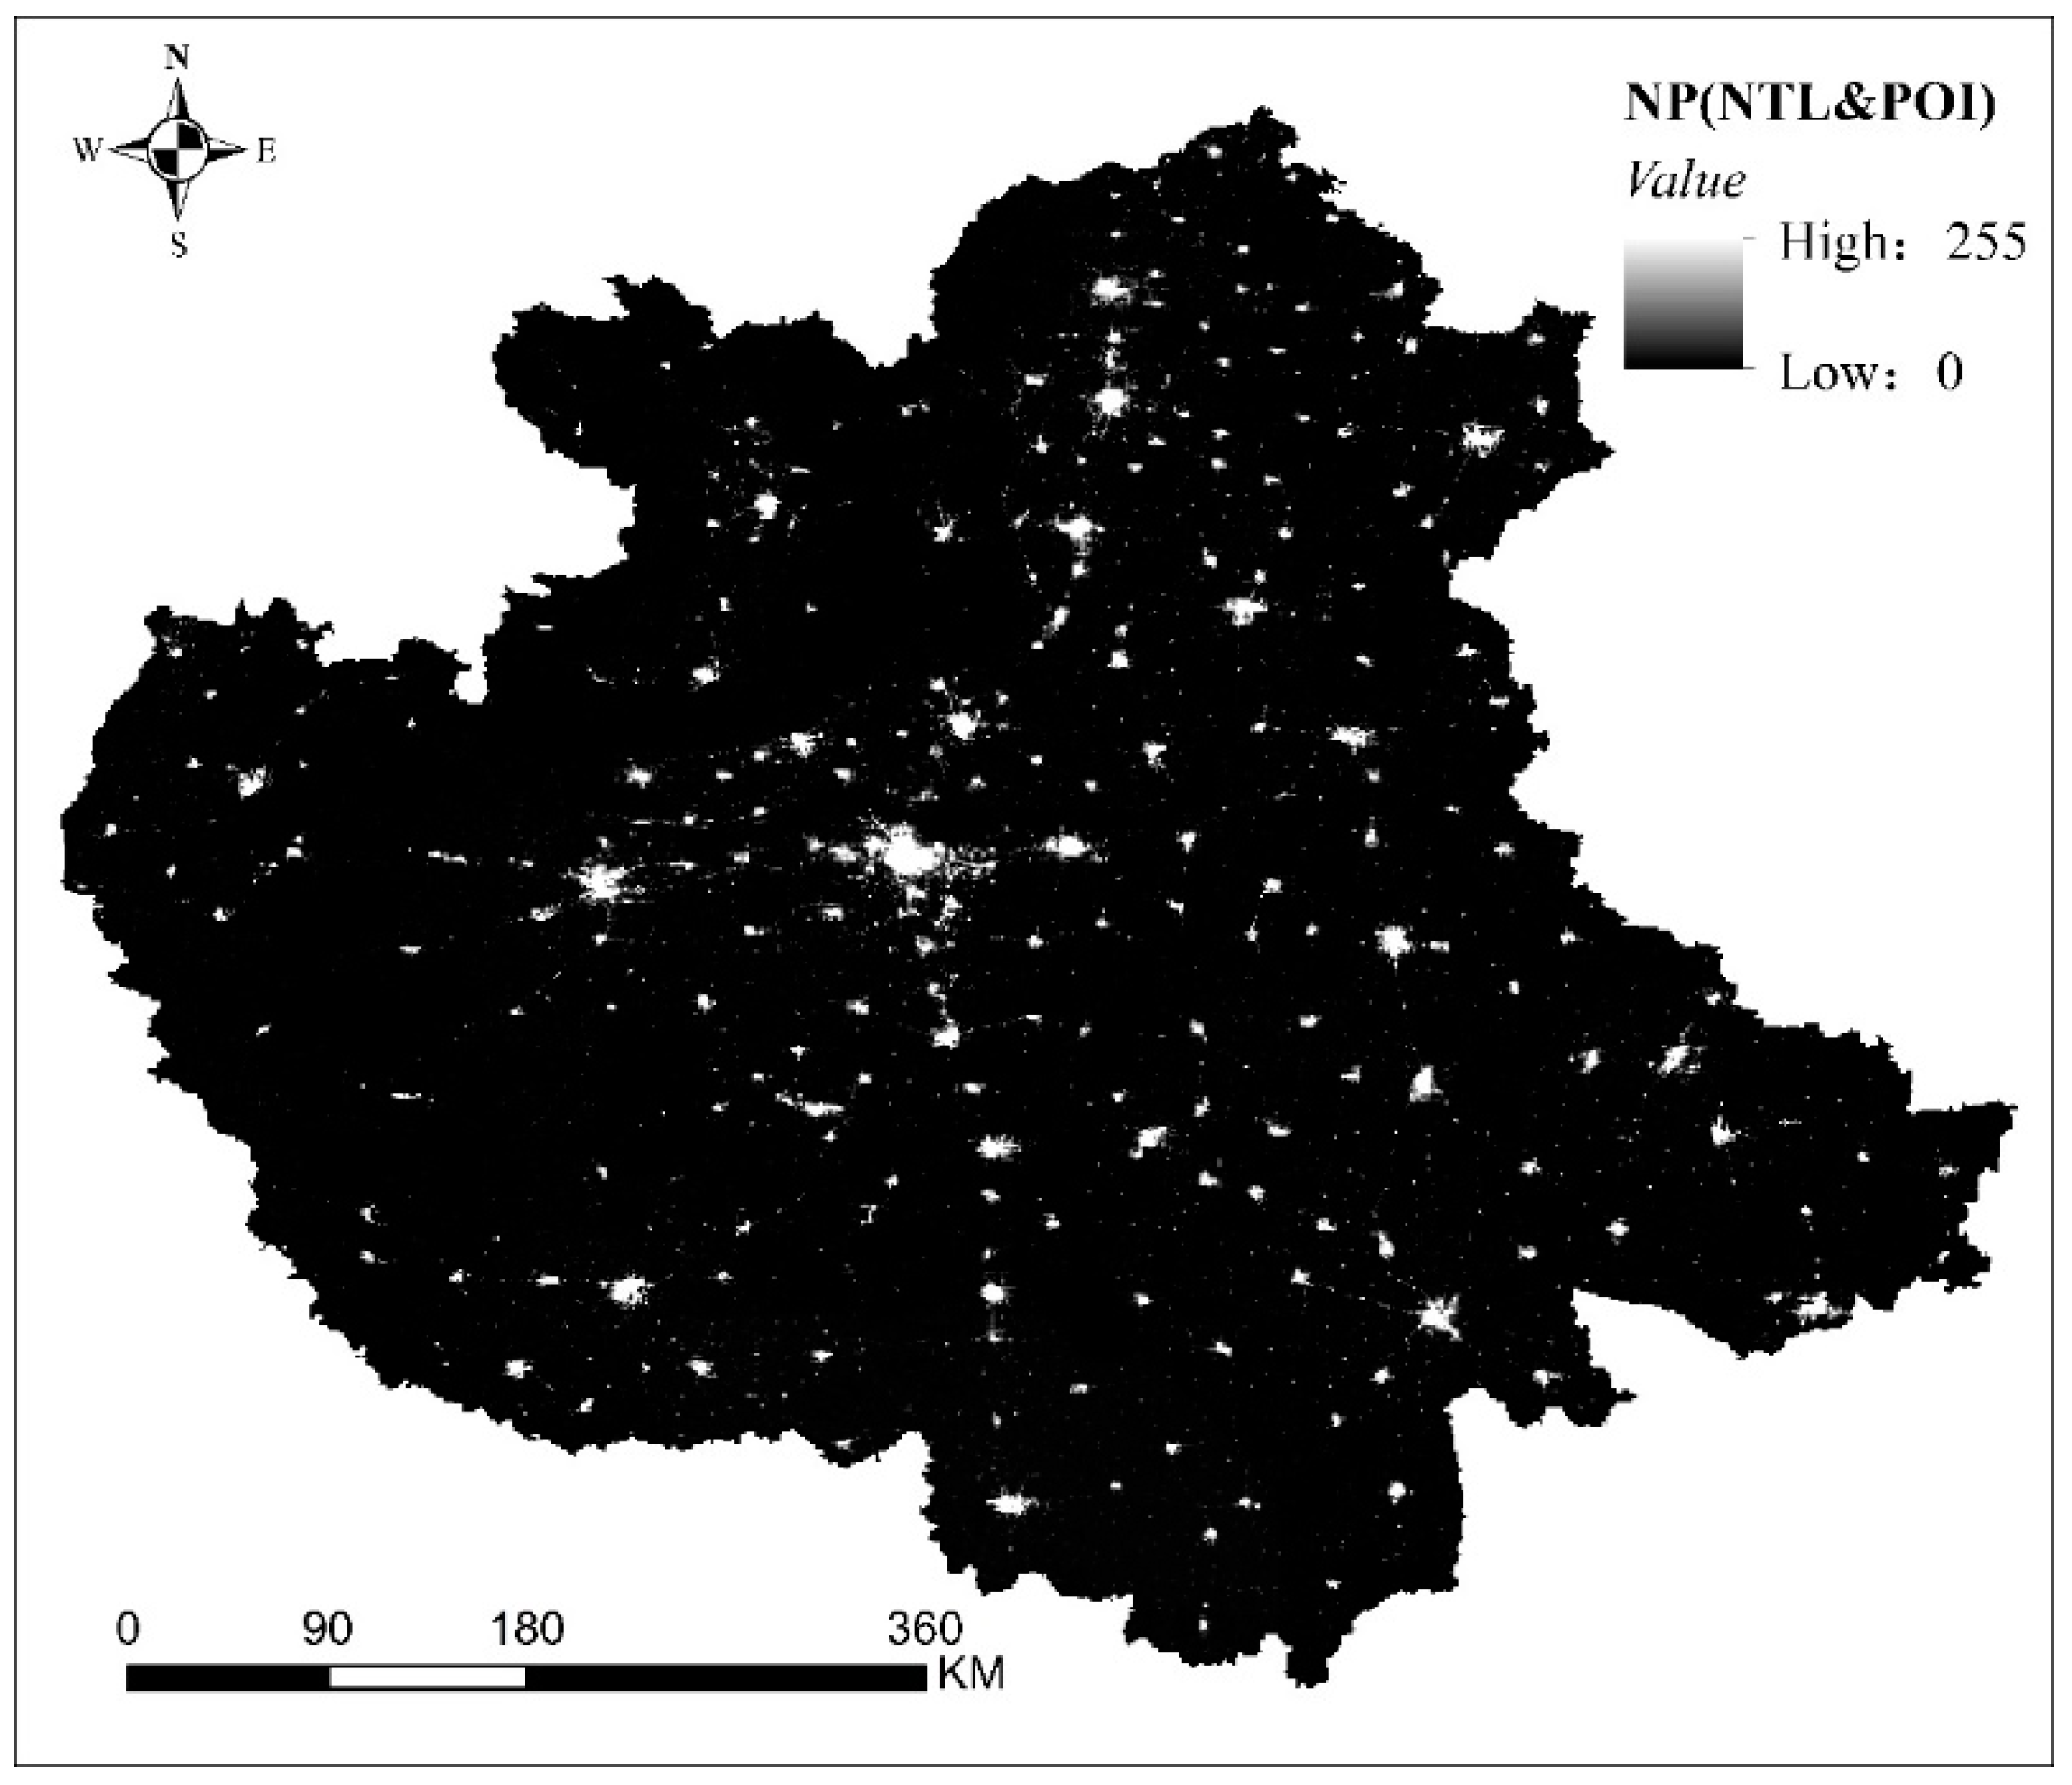
3.3. Spatial Area of CPUA Identified by Data Fusion
3.4. Comparatively Verification of Spatial Area in CPUA Identified by Different Data
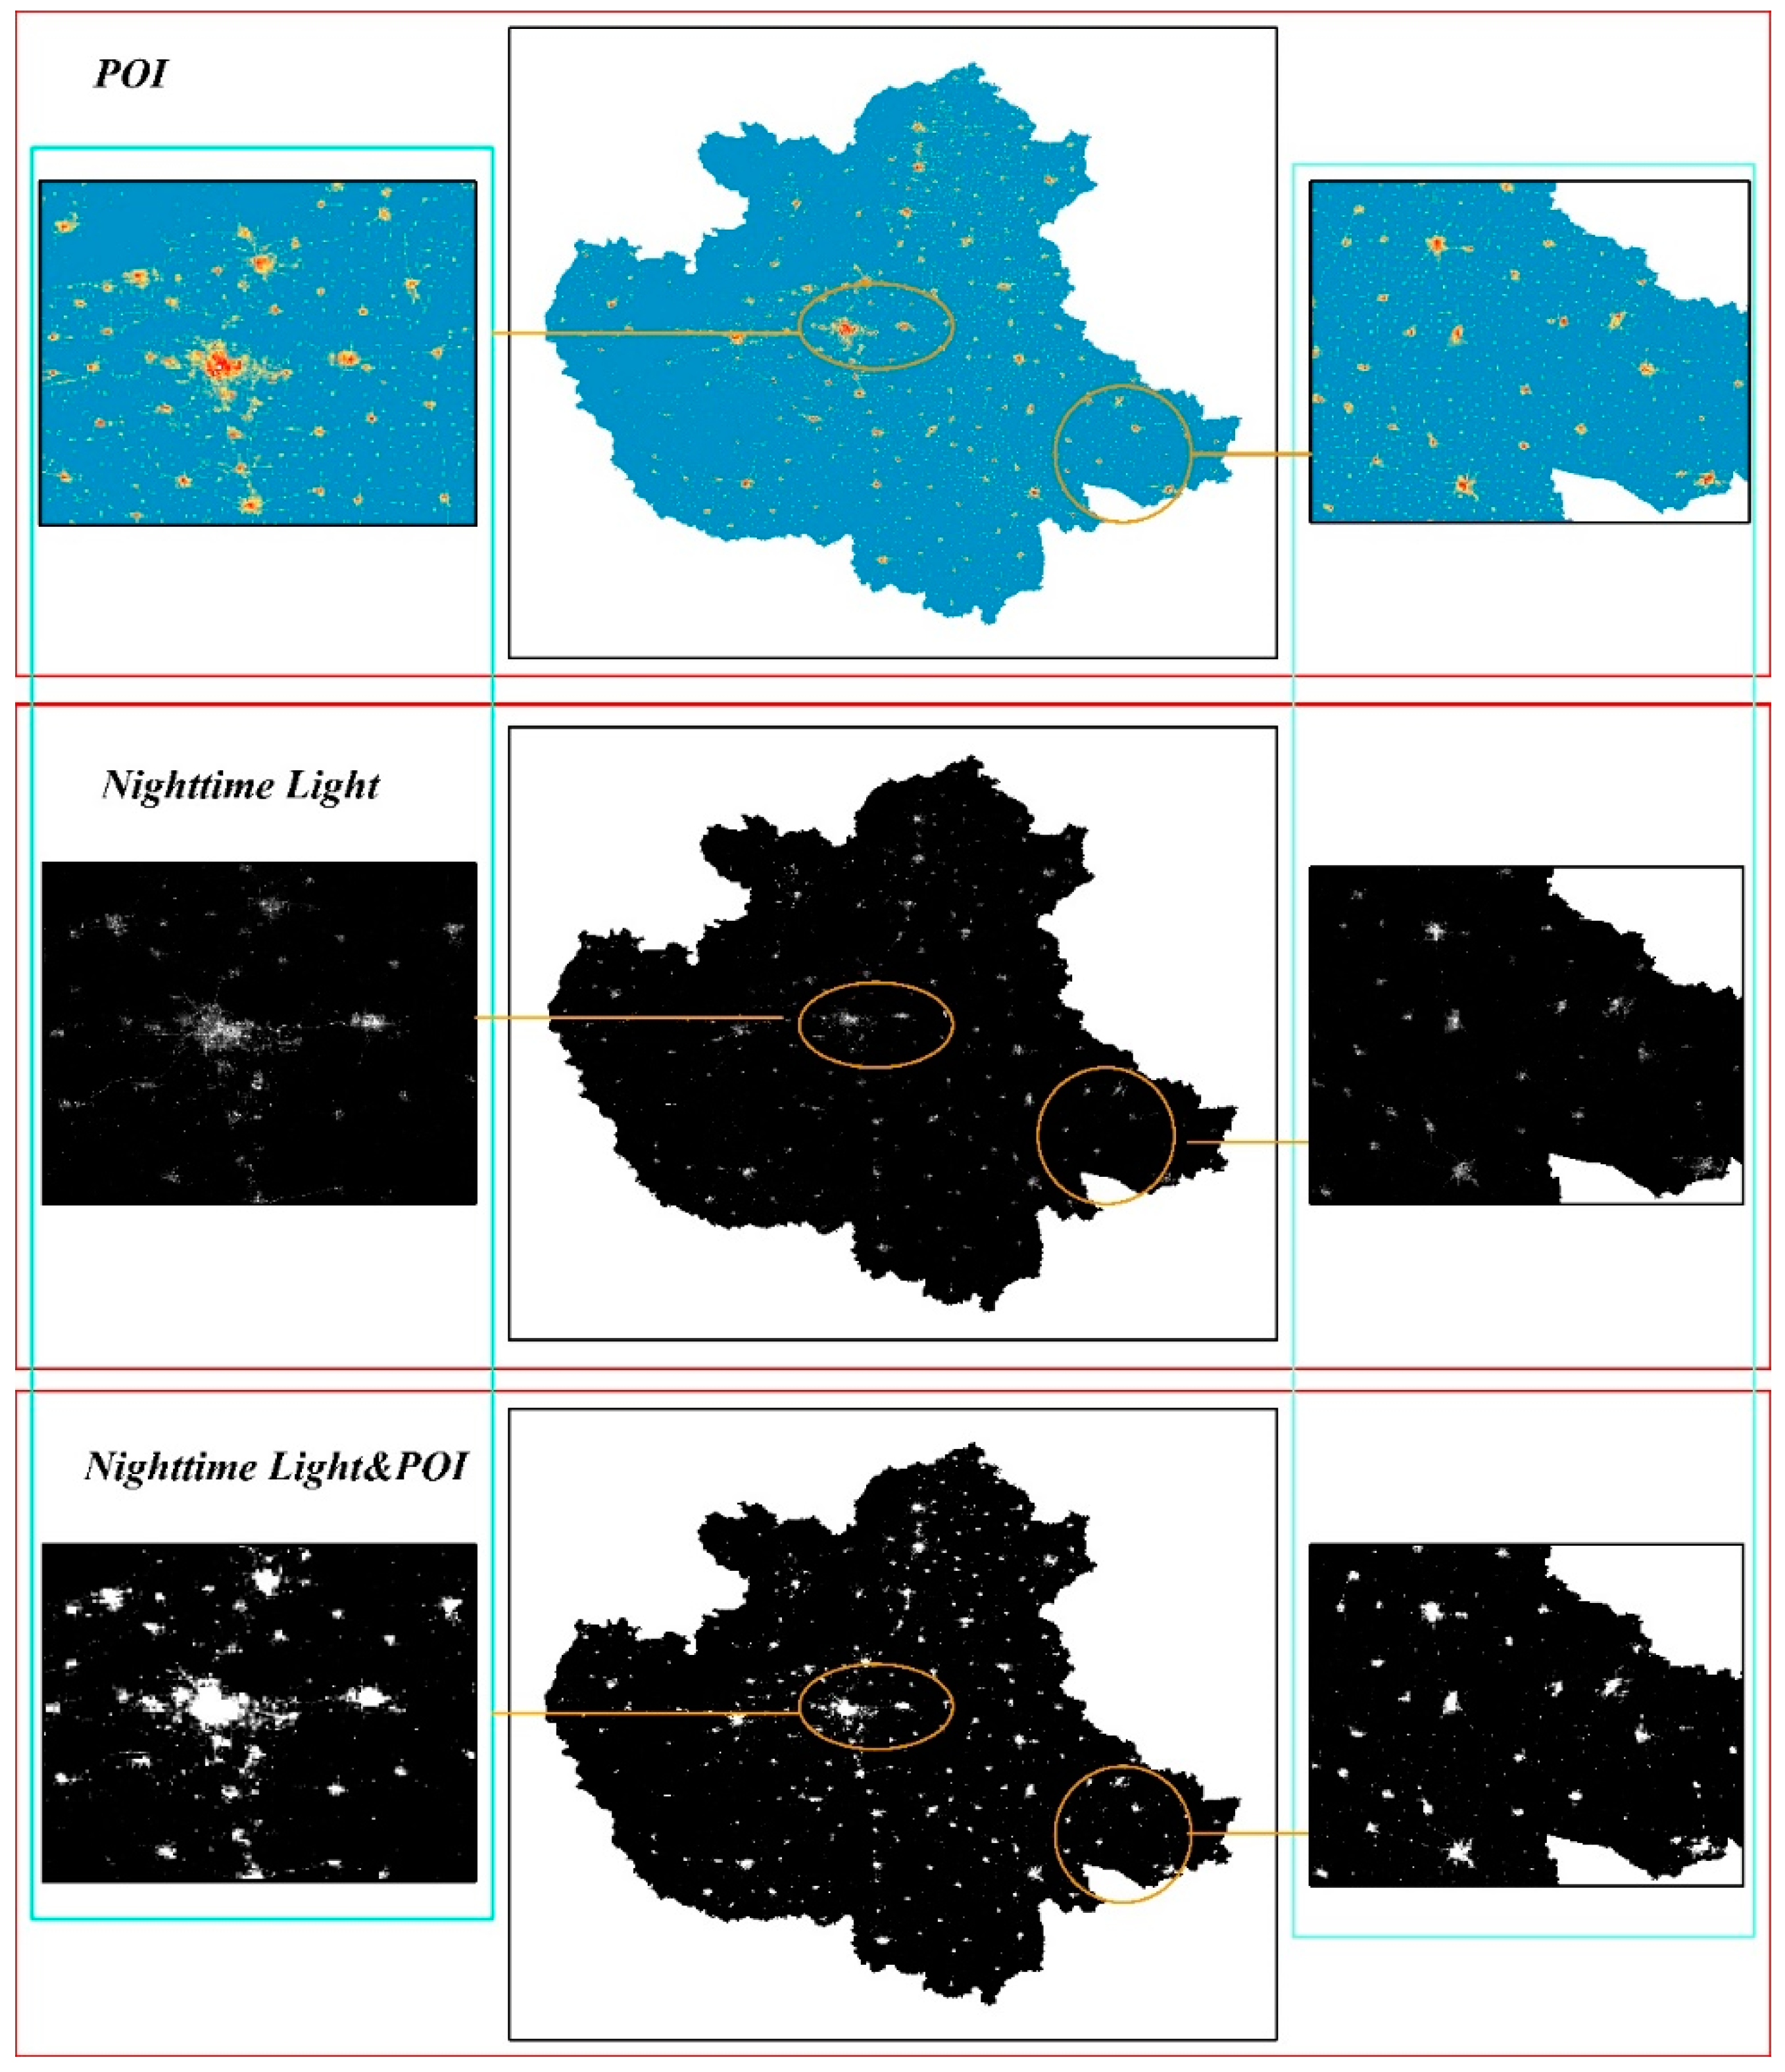
3.4.1. Comparison before and after Data Fusion
3.4.2. Comparative Analysis of Identification Results of Spatial Area in CPUA
3.4.3. Accuracy Verification
4. Discussion
4.1. Study Distribution
4.2. Study Limitations
5. Conclusions
Author Contributions
Funding
Institutional Review Board Statement
Informed Consent Statement
Data Availability Statement
Conflicts of Interest
References
- Koopmans, S.; Ronda, R.; Steeneveld, G.J.; Holtslag, A.A.; Klein Tank, A.M. Quantifying the effect of different urban planning strategies on heat stress for current and future climates in the agglomeration of The Hague (The Netherlands). Atmosphere 2018, 9, 353. [Google Scholar] [CrossRef] [Green Version]
- Rahbarianyazd, R. Cultural Agglomeration in the Urban Context: Creation and Management Approaches. J. Urban Plan. Dev. 2021, 147, 04021055. [Google Scholar] [CrossRef]
- Blazy, R. Planning Problems and the value of the Urban and Natural Landscape Problems in the Silesian Agglomeration. In Proceedings of the IOP Conference Series: Materials Science and Engineering, Perm, Russian, 18–22 February 2019; IOP Publishing: Bristol, UK, 2019; Volume 471, p. 112012. [Google Scholar]
- Chakraborty, S.; Maity, I.; Patel, P.P.; Dadashpoor, H.; Pramanik, S.; Follmann, A.; Novotný, J.; Roy, U. Spatio-temporal patterns of urbanization in the Kolkata Urban Agglomeration: A dynamic spatial territory-based approach. Sustain. Cities Soc. 2021, 67, 102715. [Google Scholar] [CrossRef]
- Dong, L.; Longwu, L.; Zhenbo, W.; Liangkan, C.; Faming, Z. Exploration of coupling effects in the Economy–Society–Environment system in urban areas: Case study of the Yangtze River Delta Urban Agglomeration. Ecol. Indic. 2021, 128, 107858. [Google Scholar] [CrossRef]
- Ahmad, M.; Khan, Z.; Anser, M.K.; Jabeen, G. Do rural-urban migration and industrial agglomeration mitigate the environmental degradation across China’s regional development levels? Sustain. Prod. Consum. 2021, 27, 679–697. [Google Scholar] [CrossRef]
- Veneri, P. City size distribution across the OECD: Does the definition of cities matter? Comput. Environ. Urban Syst. 2016, 59, 86–94. [Google Scholar] [CrossRef]
- Kantakumar, L.N.; Kumar, S.; Schneider, K. SUSM: A scenario-based urban growth simulation model using remote sensing data. Eur. J. Remote Sens. 2019, 52, 26–41. [Google Scholar] [CrossRef] [Green Version]
- Mallick, S.K.; Das, P.; Maity, B.; Rudra, S.; Pramanik, M.; Pradhan, B.; Sahana, M. Understanding future urban growth, urban resilience and sustainable development of small cities using prediction-adaptation-resilience (PAR) approach. Sustain. Cities Soc. 2021, 74, 103196. [Google Scholar] [CrossRef]
- Nickayin, S.S.; Salvati, L.; Coluzzi, R.; Lanfredi, M.; Halbac-Cotoara-Zamfir, R.; Salvia, R.; Quaranta, G.; Alhuseen, A.; Gaburova, L. What happens in the city when long-term urban expansion and (Un) sustainable fringe development occur: The case study of Rome. ISPRS Int. J. Geo-Inf. 2021, 10, 231. [Google Scholar] [CrossRef]
- Møller-Jensen, L.; Allotey, A.N.; Kofie, R.Y.; Yankson, P.W. A comparison of satellite-based estimates of urban agglomeration size for the Accra area. ISPRS Int. J. Geo-Inf. 2020, 9, 79. [Google Scholar] [CrossRef] [Green Version]
- Pick, J.; Sarkar, A.; Rosales, J. Social media use in American counties: Geography and determinants. ISPRS Int. J. Geo-Inf. 2019, 8, 424. [Google Scholar] [CrossRef] [Green Version]
- Kowe, P.; Mutanga, O.; Dube, T. Advancements in the remote sensing of landscape pattern of urban green spaces and vegetation fragmentation. Int. J. Remote Sens. 2021, 42, 3797–3832. [Google Scholar] [CrossRef]
- Roy, B.; Kasemi, N. Monitoring urban growth dynamics using remote sensing and GIS techniques of Raiganj Urban Agglomeration, India. Egypt. J. Remote Sens. Space Sci. 2021, 24, 221–230. [Google Scholar] [CrossRef]
- Morin, E.; Herrault, P.A.; Guinard, Y.; Grandjean, F.; Bech, N. The promising combination of a remote sensing approach and landscape connectivity modelling at a fine scale in urban planning. Ecol. Indic. 2022, 139, 108930. [Google Scholar] [CrossRef]
- Stokes, E.C.; Seto, K.C. Characterizing urban infrastructural transitions for the Sustainable Development Goals using multi-temporal land, population, and nighttime light data. Remote Sens. Environ. 2019, 234, 111430. [Google Scholar] [CrossRef]
- Ortakavak, Z.; Çabuk, S.N.; Cetin, M.; Senyel Kurkcuoglu, M.A.; Cabuk, A. Determination of the nighttime light imagery for urban city population using DMSP-OLS methods in Istanbul. Environ. Monit. Assess. 2020, 192, 790. [Google Scholar] [CrossRef]
- Duque, J.C.; Lozano-Gracia, N.; Patino, J.E.; Restrepo, P.; Velasquez, W.A. Spatiotemporal dynamics of urban growth in Latin American cities: An analysis using nighttime light imagery. Landsc. Urban Plan. 2019, 191, 103640. [Google Scholar] [CrossRef]
- Ghosh, T.; Baugh, K.E.; Elvidge, C.D.; Zhizhin, M.; Poyda, A.; Hsu, F.C. Extending the DMSP Nighttime Lights Time Series beyond 2013. Remote Sens. 2021, 13, 5004. [Google Scholar] [CrossRef]
- Frolking, S.; Milliman, T.; Seto, K.C.; Friedl, M.A. A global fingerprint of macro-scale changes in urban structure from 1999 to 2009. Environ. Res. Lett. 2013, 8, 024004. [Google Scholar] [CrossRef]
- Elvidge, C.D.; Zhizhin, M.; Ghosh, T.; Hsu, F.C.; Taneja, J. Annual time series of global VIIRS nighttime lights derived from monthly averages: 2012 to 2019. Remote Sens. 2021, 13, 922. [Google Scholar] [CrossRef]
- Wang, L.; Fan, H.; Wang, Y. Improving population mapping using Luojia 1-01 nighttime light image and location-based social media data. Sci. Total Environ. 2020, 730, 139148. [Google Scholar] [CrossRef]
- Takahashi, K.I.; Terakado, R.; Nakamura, J.; Adachi, Y.; Elvidge, C.D.; Matsuno, Y. In-use stock analysis using satellite nighttime light observation data. Resour. Conserv. Recycl. 2010, 55, 196–200. [Google Scholar] [CrossRef]
- Mansour, S.; Alahmadi, M.; Atkinson, P.M.; Dewan, A. Forecasting of Built-Up Land Expansion in a Desert Urban Environment. Remote Sens. 2022, 14, 2037. [Google Scholar] [CrossRef]
- Elvidge, C.D.; Zhizhin, M.; Baugh, K.; Hsu, F.C.; Ghosh, T. Extending nighttime combustion source detection limits with short wavelength VIIRS data. Remote Sens. 2019, 11, 395. [Google Scholar] [CrossRef] [Green Version]
- Ghosh, T.; Elvidge, C.D.; Sutton, P.C.; Baugh, K.E.; Ziskin, D.; Tuttle, B.T. Creating a global grid of distributed fossil fuel CO2 emissions from nighttime satellite imagery. Energies 2010, 3, 1895–1913. [Google Scholar] [CrossRef]
- Tripathy, B.R.; Tiwari, V.; Pandey, V.; Elvidge, C.D.; Rawat, J.S.; Sharma, M.P.; Prawasi, R.; Kumar, P. Estimation of urban population dynamics using DMSP-OLS night-time lights time series sensors data. IEEE Sens. J. 2016, 17, 1013–1020. [Google Scholar] [CrossRef]
- Miller, S.D.; Straka, I.I.I.W.; Mills, S.P.; Elvidge, C.D.; Lee, T.F.; Solbrig, J.; Walther, A.; Heidinger, A.K.; Weiss, S.C. Illuminating the capabilities of the suomi national polar-orbiting partnership (NPP) visible infrared imaging radiometer suite (VIIRS) day/night band. Remote Sens. 2013, 5, 6717–6766. [Google Scholar] [CrossRef] [Green Version]
- Merlier, L.; Jacob, J.; Sagaut, P. Lattice-Boltzmann large-eddy simulation of pollutant dispersion in complex urban environment with dense gas effect: Model evaluation and flow analysis. Build. Environ. 2019, 148, 634–652. [Google Scholar] [CrossRef]
- Mehdian, M.; Mirzahossein, H.; Abdi Kordani, A. A Data-Driven Functional Classification of Urban Roadways Based on Geometric Design, Traffic Characteristics, and Land Use Features. J. Adv. Transp. 2022, 2022, 9970464. [Google Scholar] [CrossRef]
- Kanaroglou, P.; Mercado, R.; Maoh, H.; Paez, A.; Scott, D.M.; Newbold, B. Simulation framework for analysis of elderly mobility policies. Transp. Res. Rec. 2008, 2078, 62–71. [Google Scholar] [CrossRef]
- Amani, M.; Ghorbanian, A.; Ahmadi, S.A.; Kakooei, M.; Moghimi, A.; Mirmazloumi, S.M.; Moghaddam, S.H.; Mahdavi, S.; Ghahremanloo, M.; Parsian, S.; et al. Google earth engine cloud computing platform for remote sensing big data applications: A comprehensive review. IEEE J. Sel. Top. Appl. Earth Obs. Remote Sens. 2020, 13, 5326–5350. [Google Scholar] [CrossRef]
- He, X.; Zhou, C.; Zhang, J.; Yuan, X. Using wavelet transforms to fuse nighttime light data and POI big data to extract urban built-up areas. Remote Sens. 2020, 12, 3887. [Google Scholar] [CrossRef]
- He, X.; Zhang, Z.; Yang, Z. Extraction of urban built-up area based on the fusion of night-time light data and point of interest data. R. Soc. Open Sci. 2021, 8, 210838. [Google Scholar] [CrossRef] [PubMed]
- Guo, H.; Liu, H.; Wang, S.; Zhang, Y. An Automatic Urban Function District Division Method Based on Big Data Analysis of POI. J. Inf. Processing Syst. 2021, 17, 645–657. [Google Scholar]
- Lou, G.; Chen, Q.; He, K.; Zhou, Y.; Shi, Z. Using nighttime light data and poi big data to detect the urban centers of hangzhou. Remote Sens. 2019, 11, 1821. [Google Scholar] [CrossRef] [Green Version]
- Zhao, F.; Chu, C.; Liu, R.; Peng, Z.; Du, Q.; Xie, Z.; Sun, Z.; Zeng, H.; Xia, J. Assessing Light Pollution Using POI and Luojia1-01 Night-Time Imagery From a Quantitative Perspective at City Scale. IEEE J. Sel. Top. Appl. Earth Obs. Remote Sens. 2021, 14, 7544–7556. [Google Scholar] [CrossRef]
- Liu, J.; Deng, Y.; Wang, Y.; Huang, H.; Du, Q.; Ren, F. Urban nighttime leisure space mapping with nighttime light images and POI data. Remote Sens. 2020, 12, 541. [Google Scholar] [CrossRef] [Green Version]
- Wang, M.; Song, Y.; Wang, F.; Meng, Z. Boundary extraction of urban built-up area based on luminance value correction of NTL image. IEEE J. Sel. Top. Appl. Earth Obs. Remote Sens. 2021, 14, 7466–7477. [Google Scholar] [CrossRef]
- Zhou, C.; He, X.; Wu, R.; Zhang, G. Using Food Delivery Data to Identify Urban-Rural Areas: A Case Study of Guangzhou, China. Front. Earth Sci. 2022, 10, 860361. [Google Scholar] [CrossRef]
- He, X.; Cao, Y.; Zhou, C. Evaluation of polycentric spatial structure in the urban agglomeration of the pearl river delta (PRD) based on multi-source big data fusion. Remote Sens. 2021, 13, 3639. [Google Scholar] [CrossRef]
- He, X.; Yuan, X.; Zhang, D.; Zhang, R.; Li, M.; Zhou, C. Delineation of urban agglomeration boundary based on multisource big data fusion—A case study of Guangdong–Hong Kong–Macao Greater Bay Area (GBA). Remote Sens. 2021, 13, 1801. [Google Scholar] [CrossRef]
- Yang, X.; Ye, T.; Zhao, N.; Chen, Q.; Yue, W.; Qi, J.; Zeng, B.; Jia, P. Population mapping with multisensor remote sensing images and point-of-interest data. Remote Sens. 2019, 11, 574. [Google Scholar] [CrossRef] [Green Version]
- Zhang, Z.; Zhang, Y.; He, T.; Xiao, R. Urban Vitality and its Influencing Factors: Comparative Analysis Based on Taxi Trajectory Data. IEEE J. Sel. Top. Appl. Earth Obs. Remote Sens. 2022, 15, 5102–5114. [Google Scholar] [CrossRef]
- Hosseinpour, H.; Samadzadegan, F.; Javan, F.D. CMGFNet: A deep cross-modal gated fusion network for building extraction from very high-resolution remote sensing images. ISPRS J. Photogramm. Remote Sens. 2022, 184, 96–115. [Google Scholar] [CrossRef]
- Allies, A.; Olioso, A.; Cappelaere, B.; Boulet, G.; Etchanchu, J.; Barral, H.; Moussa, I.B.; Chazarin, J.P.; Delogu, E.; Issoufou, H.B.; et al. A remote sensing data fusion method for continuous daily evapotranspiration mapping at kilometric scale in Sahelian areas. J. Hydrol. 2022, 607, 127504. [Google Scholar] [CrossRef]
- Peng, J.; Ma, J.; Liu, Q.; Liu, Y.; Li, Y.; Yue, Y. Spatial-temporal change of land surface temperature across 285 cities in China: An urban-rural contrast perspective. Sci. Total Environ. 2018, 635, 487–497. [Google Scholar] [CrossRef] [PubMed]
- Karimi, N.; Ng, K.T.W.; Richter, A. Development and application of an analytical framework for mapping probable illegal dumping sites using nighttime light imagery and various remote sensing indices. Waste Manag. 2022, 143, 195–205. [Google Scholar] [CrossRef]
- Ivan, K.; Holobâcă, I.H.; Benedek, J.; Török, I. VIIRS nighttime light data for income estimation at local level. Remote Sens. 2020, 12, 2950. [Google Scholar] [CrossRef]
- Lin, A.; Sun, X.; Wu, H.; Luo, W.; Wang, D.; Zhong, D.; Wang, Z.; Zhao, L.; Zhu, J. Identifying urban building function by integrating remote sensing imagery and POI data. IEEE J. Sel. Top. Appl. Earth Obs. Remote Sens. 2021, 14, 8864–8875. [Google Scholar] [CrossRef]
- Nguyen, M.T.; Iwai, K.; Matsubara, T.; Kurokawa, T. Acceleration and higher precision by discrete wavelet transform for single image super-resolution using convolutional neural networks. In Proceedings of the 2021 Ninth International Symposium on Computing and Networking Workshops (CANDARW), Matsue, Japan, 23–26 November 2021; IEEE: Piscataway, NJ, USA, 2021; pp. 166–172. [Google Scholar]
- Khan, S.D.; Alarabi, L.; Basalamah, S. Deep Hybrid Network for Land Cover Semantic Segmentation in High-Spatial Resolution Satellite Images. Information 2021, 12, 230. [Google Scholar] [CrossRef]
- Niu, R.; Sun, X.; Tian, Y.; Diao, W.; Chen, K.; Fu, K. Hybrid multiple attention network for semantic segmentation in aerial images. IEEE Trans. Geosci. Remote Sens. 2021, 60, 5603018. [Google Scholar] [CrossRef]
- Jin, C.; Zhang, Y.; Yang, X.; Zhao, N.; Ouyang, Z.; Yue, W. Mapping China’s electronic power consumption using points of interest and remote sensing data. Remote Sens. 2021, 13, 1058. [Google Scholar] [CrossRef]
- Zhou, Y.; He, X.; Zhu, Y. Identification and Evaluation of the Polycentric Urban Structure: An Empirical Analysis Based on Multi-Source Big Data Fusion. Remote Sens. 2022, 14, 2705. [Google Scholar] [CrossRef]
- Ye, T.; Zhao, N.; Yang, X.; Ouyang, Z.; Liu, X.; Chen, Q.; Hu, K.; Yue, W.; Qi, J.; Li, Z.; et al. Improved population mapping for China using remotely sensed and points-of-interest data within a random forests model. Sci. Total Environ. 2019, 658, 936–946. [Google Scholar] [CrossRef] [PubMed]
- Ma, T. An estimate of the pixel-level connection between visible infrared imaging radiometer suite day/night band (VIIRS DNB) nighttime lights and land features across China. Remote Sens. 2018, 10, 723. [Google Scholar] [CrossRef] [Green Version]
- Shah, A.; Ali, K.; Nizami, S.M. Spatio-temporal analysis of urban sprawl in Islamabad, Pakistan during 1979–2019, using remote sensing. GeoJournal 2022, 87, 2935–2948. [Google Scholar] [CrossRef]
- Kucharczyk, M.; Hugenholtz, C.H. Remote sensing of natural hazard-related disasters with small drones: Global trends, biases, and research opportunities. Remote Sens. Environ. 2021, 264, 112577. [Google Scholar] [CrossRef]
- Tarolli, P.; Pijl, A.; Cucchiaro, S.; Wei, W. Slope instabilities in steep cultivation systems: Process classification and opportunities from remote sensing. Land Degrad. Dev. 2021, 32, 1368–1388. [Google Scholar] [CrossRef]
- Nistor, C.; Vîrghileanu, M.; Cârlan, I.; Mihai, B.A.; Toma, L.; Olariu, B. Remote Sensing-Based Analysis of Urban Landscape Change in the City of Bucharest, Romania. Remote Sens. 2021, 13, 2323. [Google Scholar] [CrossRef]
- He, X.; Zhu, Y.; Chang, P.; Zhou, C. Using Tencent User Location Data to Modify Night-Time Light Data for Delineating Urban Agglomeration Boundaries. Front. Environ. Sci. 2022, 10, 860365. [Google Scholar] [CrossRef]


| Data | Urban | Rural | Accuracy | Kappa | |
|---|---|---|---|---|---|
| NTL | Urban | 417 | 88 | 82.90% | 0.6563 |
| Rural | 83 | 412 | |||
| POI | Urban | 401 | 82 | 81.90% | 0.6441 |
| Rural | 99 | 418 | |||
| NTL_POI | Urban | 458 | 51 | 90.70% | 0.8123 |
| Rural | 42 | 449 |
Publisher’s Note: MDPI stays neutral with regard to jurisdictional claims in published maps and institutional affiliations. |
© 2022 by the authors. Licensee MDPI, Basel, Switzerland. This article is an open access article distributed under the terms and conditions of the Creative Commons Attribution (CC BY) license (https://creativecommons.org/licenses/by/4.0/).
Share and Cite
Zhang, S.; Wei, H. Identification of Urban Agglomeration Spatial Range Based on Social and Remote-Sensing Data—For Evaluating Development Level of Urban Agglomeration. ISPRS Int. J. Geo-Inf. 2022, 11, 456. https://doi.org/10.3390/ijgi11080456
Zhang S, Wei H. Identification of Urban Agglomeration Spatial Range Based on Social and Remote-Sensing Data—For Evaluating Development Level of Urban Agglomeration. ISPRS International Journal of Geo-Information. 2022; 11(8):456. https://doi.org/10.3390/ijgi11080456
Chicago/Turabian StyleZhang, Shuai, and Hua Wei. 2022. "Identification of Urban Agglomeration Spatial Range Based on Social and Remote-Sensing Data—For Evaluating Development Level of Urban Agglomeration" ISPRS International Journal of Geo-Information 11, no. 8: 456. https://doi.org/10.3390/ijgi11080456