
Spatial Pattern and Formation Mechanism of Rural Tourism Resources in China: Evidence from 1470 National Leisure Villages


Abstract
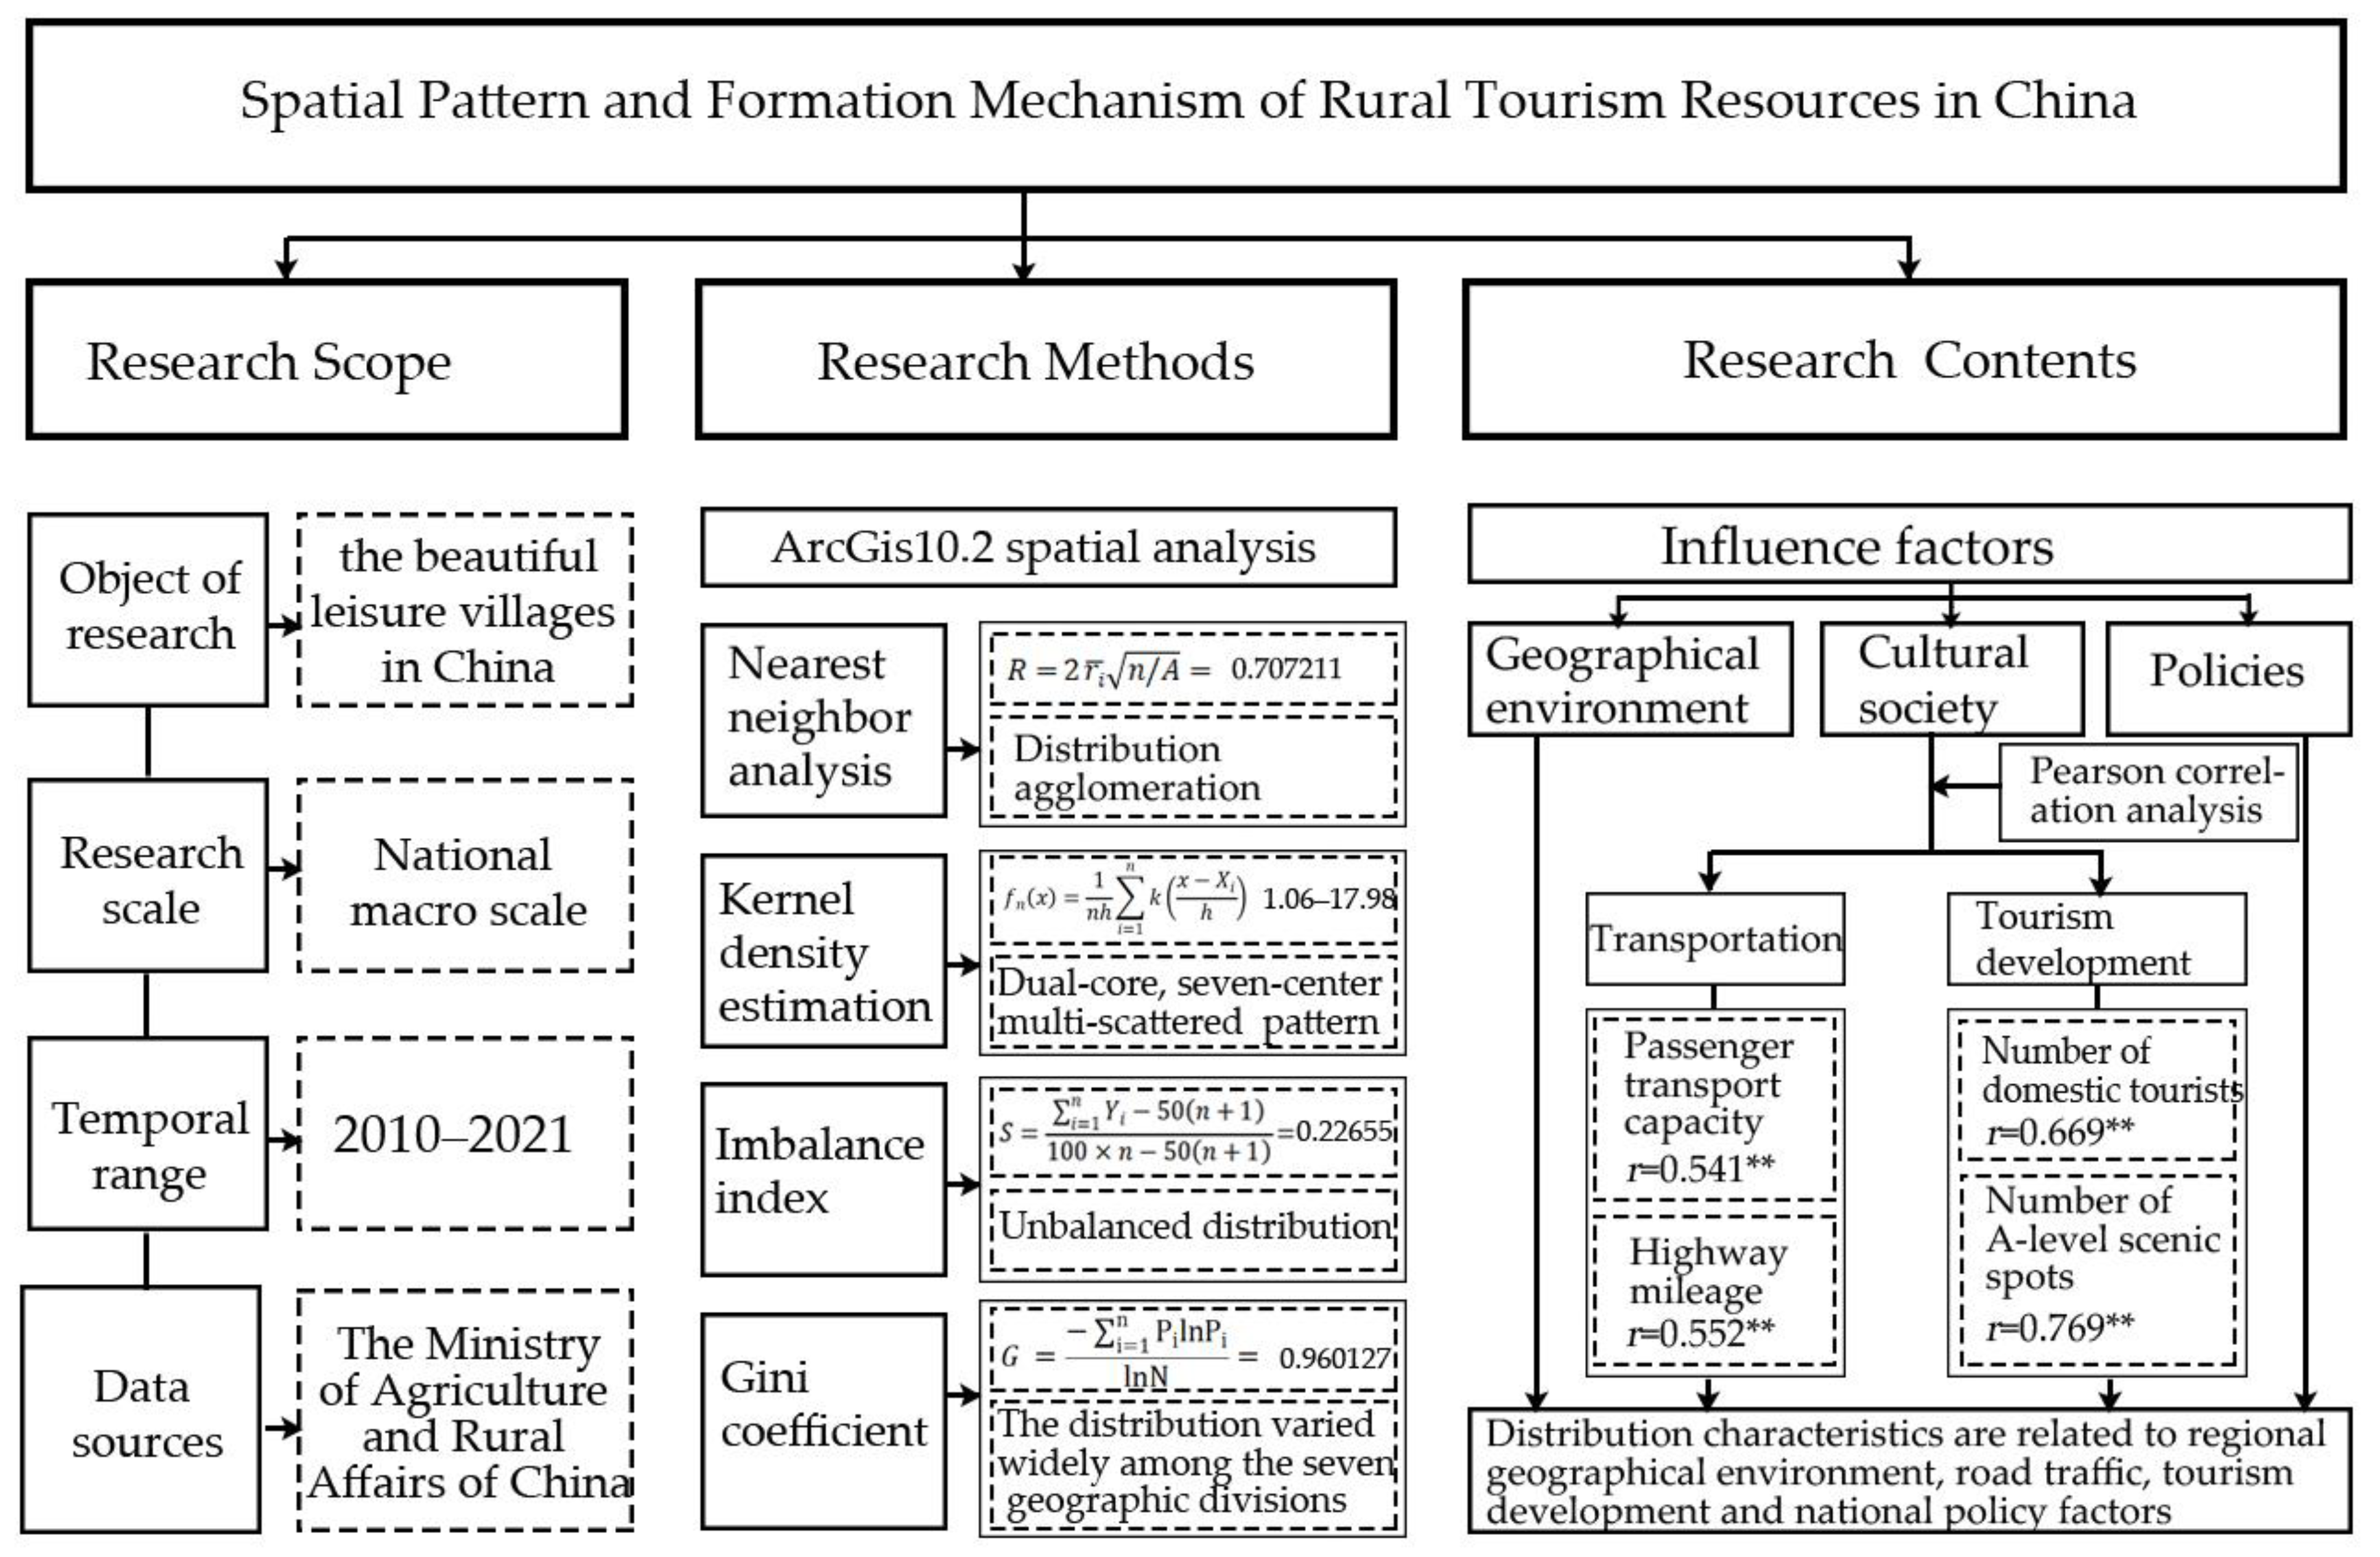
:1. Introduction
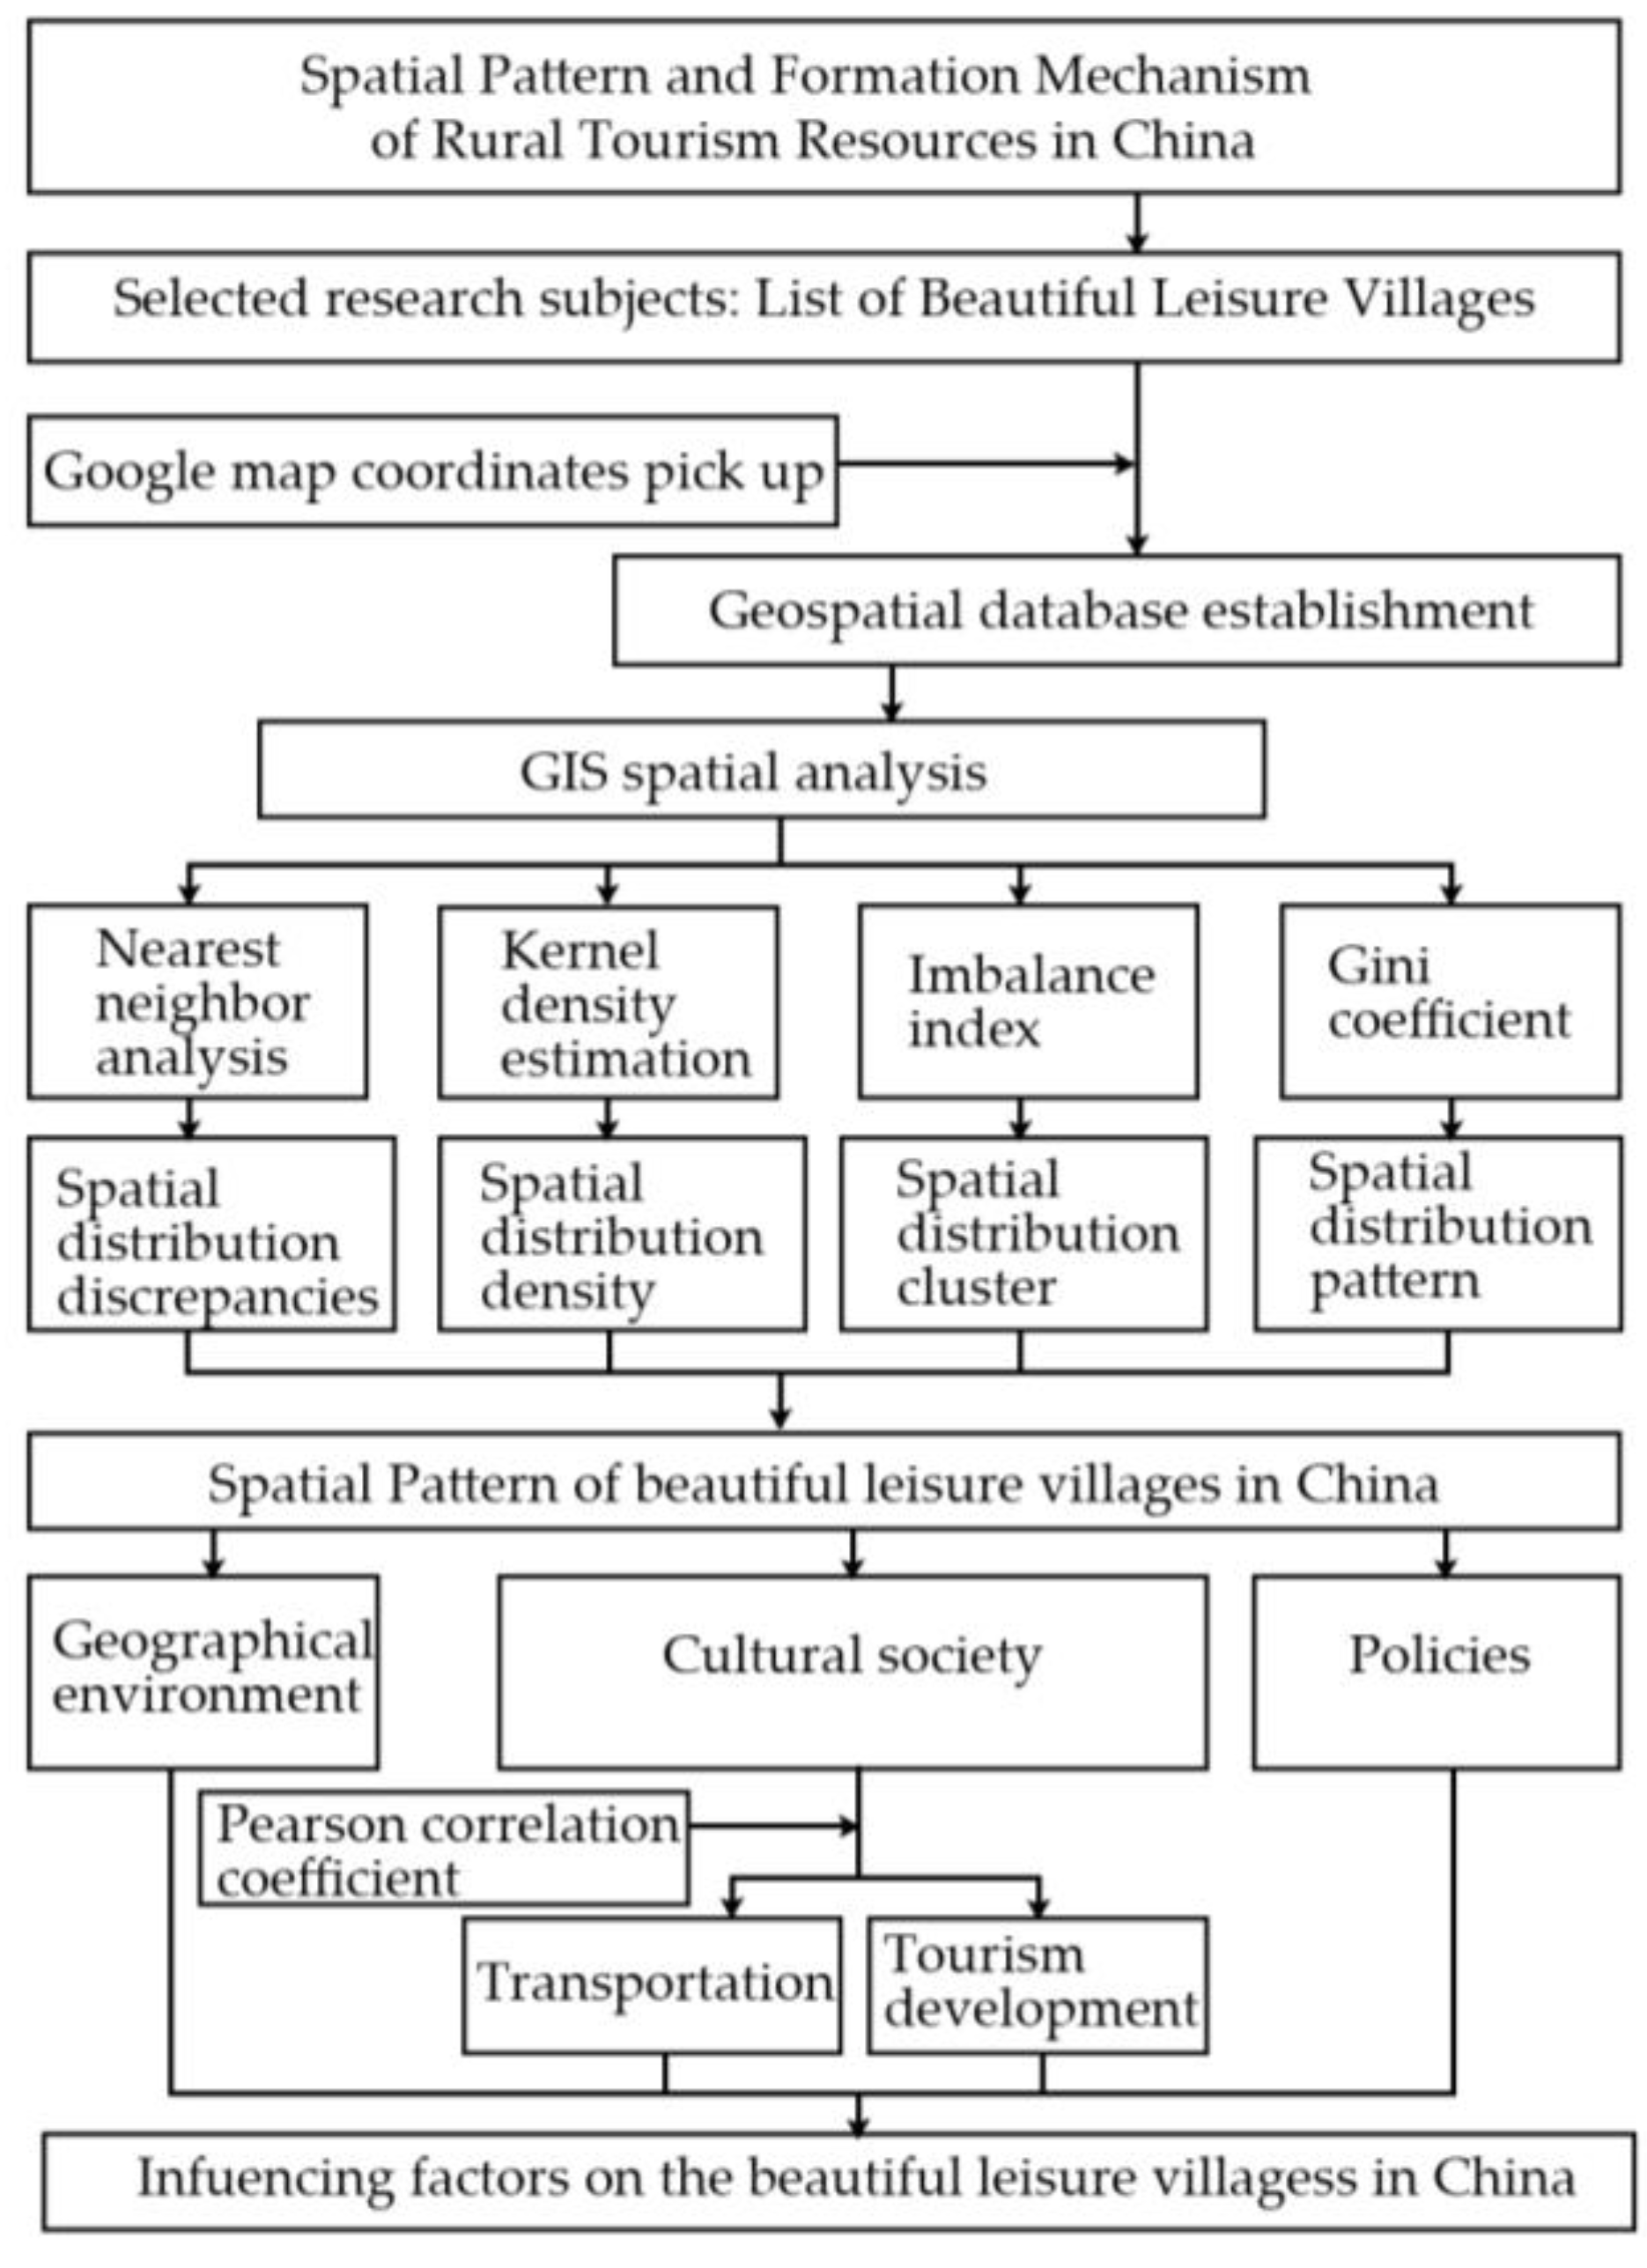
2. Materials and Methods
2.1. Material Sources
2.2. Study Methods
2.2.1. Nearest Neighbor Analysis
2.2.2. Kernel Density Estimation
2.2.3. Imbalance Index
2.2.4. Gini Coefficient
2.2.5. Pearson’s Correlation Coefficient
3. Results
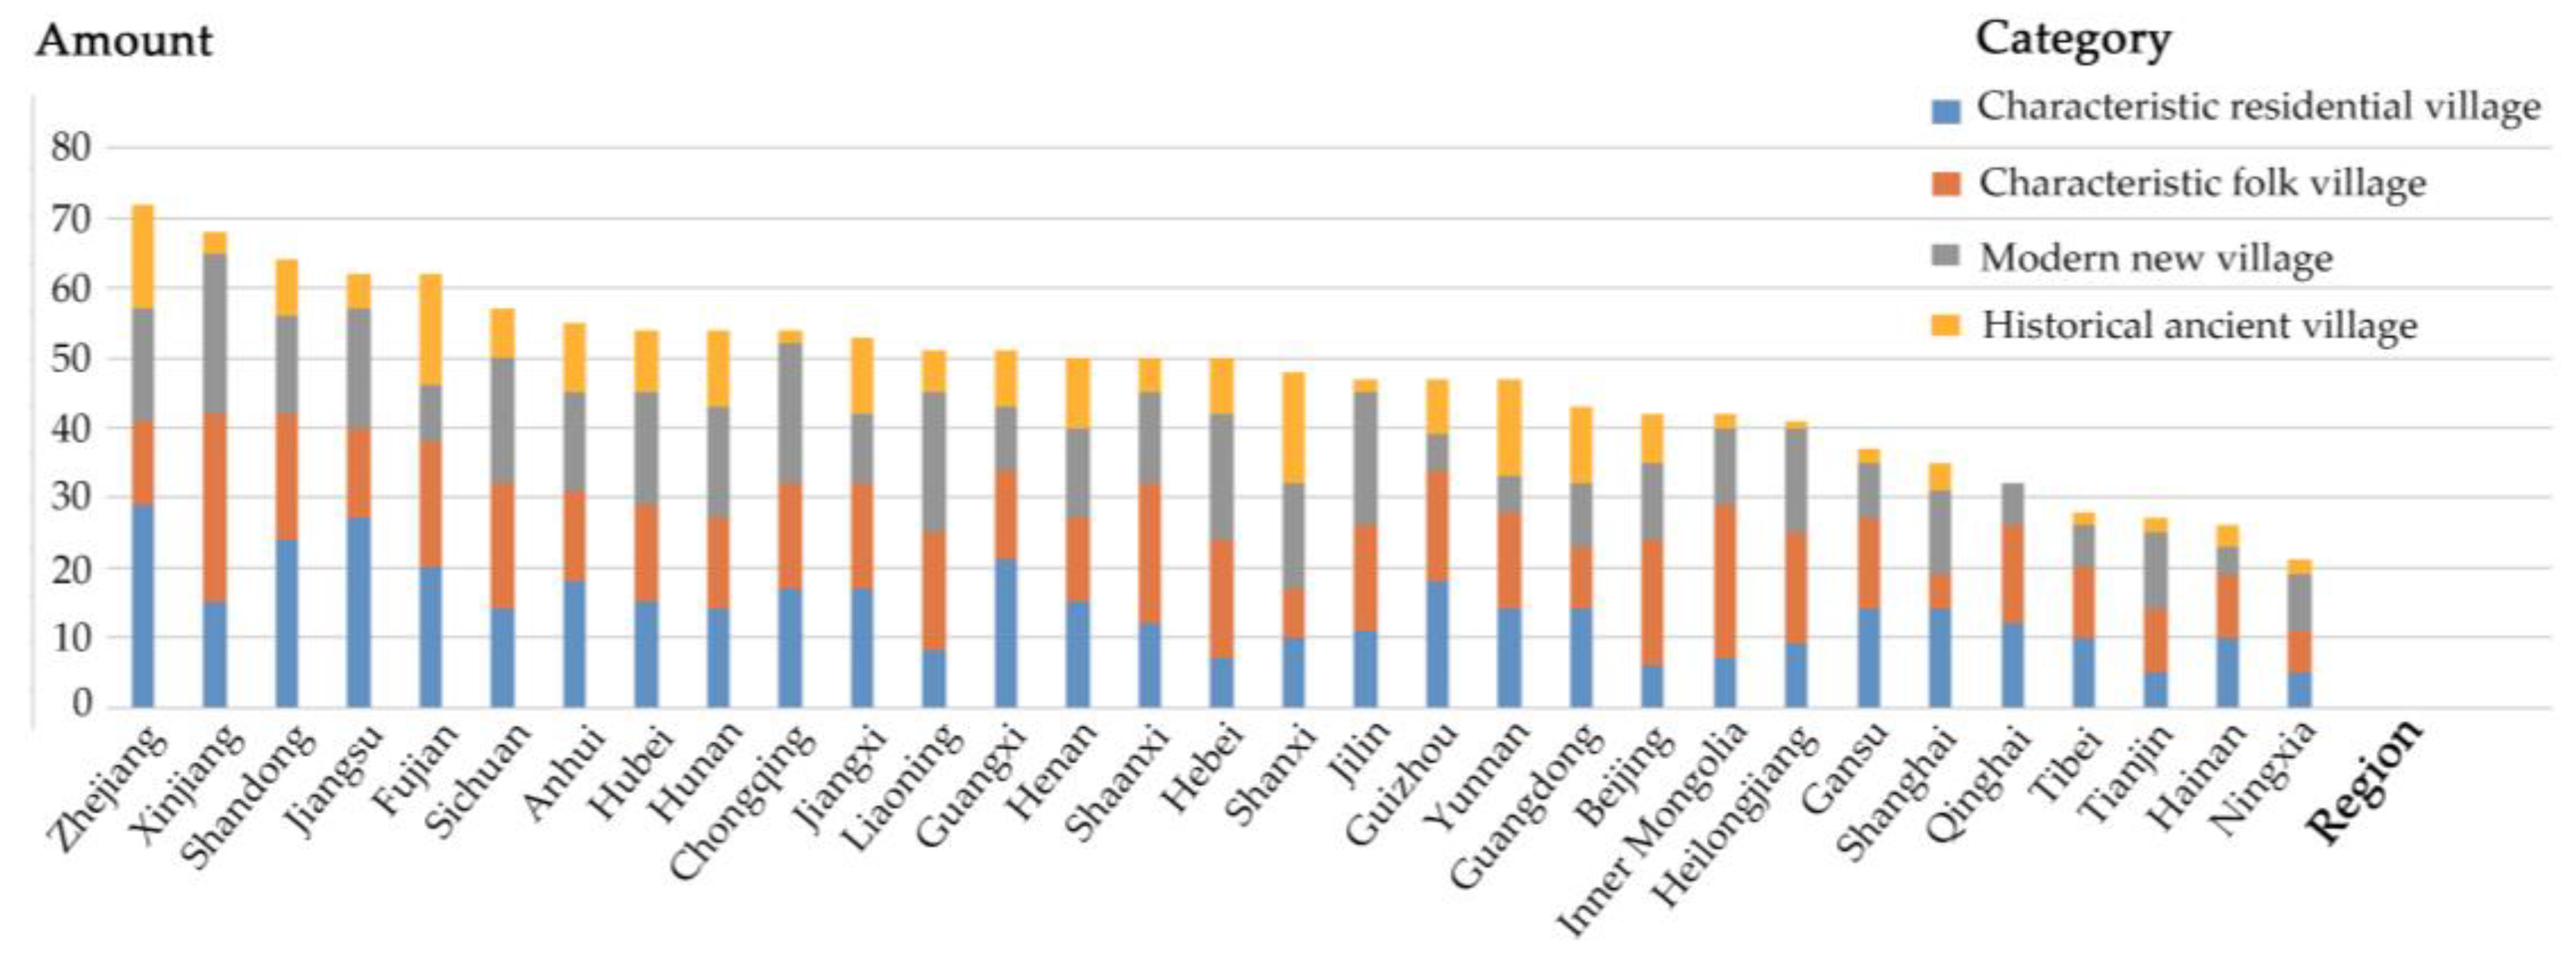
3.1. Overview of the Study Subjects
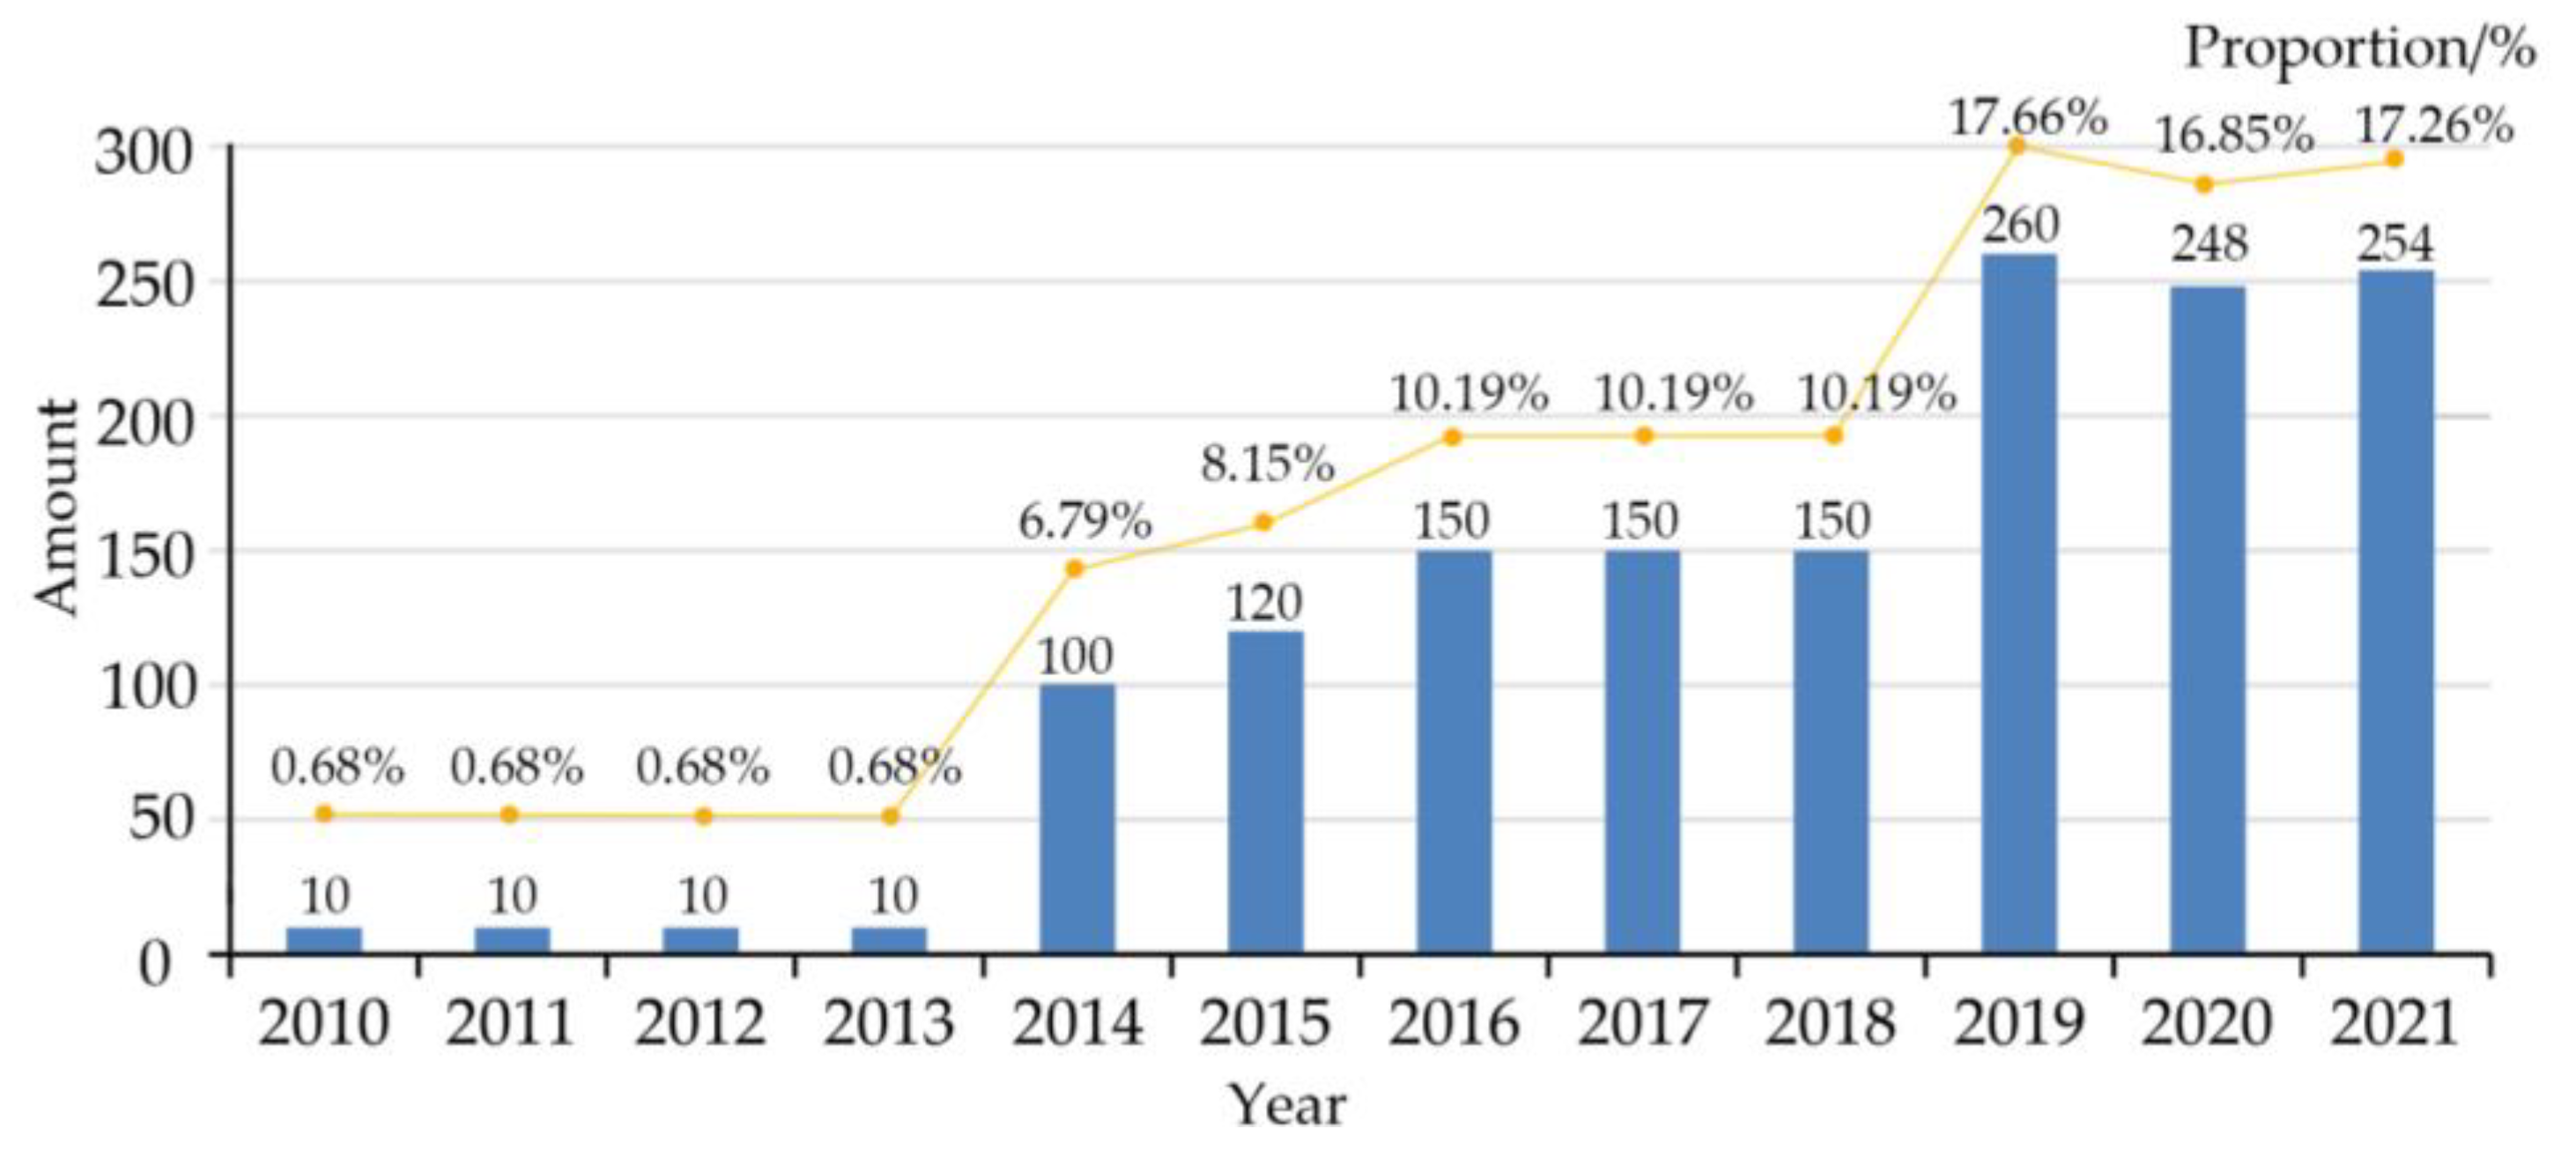
- (1)
- From 2010 to 2013, in the early stage of development, 10 villages were selected every year, and the number of areas and villages involved in the list remained unchanged. Within 4 years, the selection involved 22 provinces and administrative regions. The initial criteria definition was less dimensional, mainly focusing on external conditions such as complete management and facilities. In 2007, the 17th National Congress of the Communist Party of China proposed to “coordinate urban and rural development and promote the construction of a new socialist countryside” [51]. In 2008, Anji County in Zhejiang province formally proposed the “Chinese Beautiful Village” plan, which promoted the development of rural construction in various areas [52].
- (2)
- In 2014–2018, the number of defined villages increased in uniform growth in the middle of development. In 2013, national policy documents first proposed the goal of the new rural construction of “beautiful villages”, promoting protection of the rural ecological environment and the village’s appearance and gradually enriching the types of BLVCs [53]. After 2014, the defined number of BLVCs increased significantly compared with the initial stage and then gradually stabilized at 150 villages every year. In 2018, the 19th National Congress of the Communist Party of China proposed the rural revitalization strategy, which became the guide for rural development in the new era [54].
- (3)
- From 2019 to 2021, the development of BLVCs also entered a new growth stage. Compared with 2018, the defined number increased by 110, nearly three times the growth rate of the second stage. The definition standard tended to improve, and more attention was paid to displaying the villages’ advantages and characteristics.
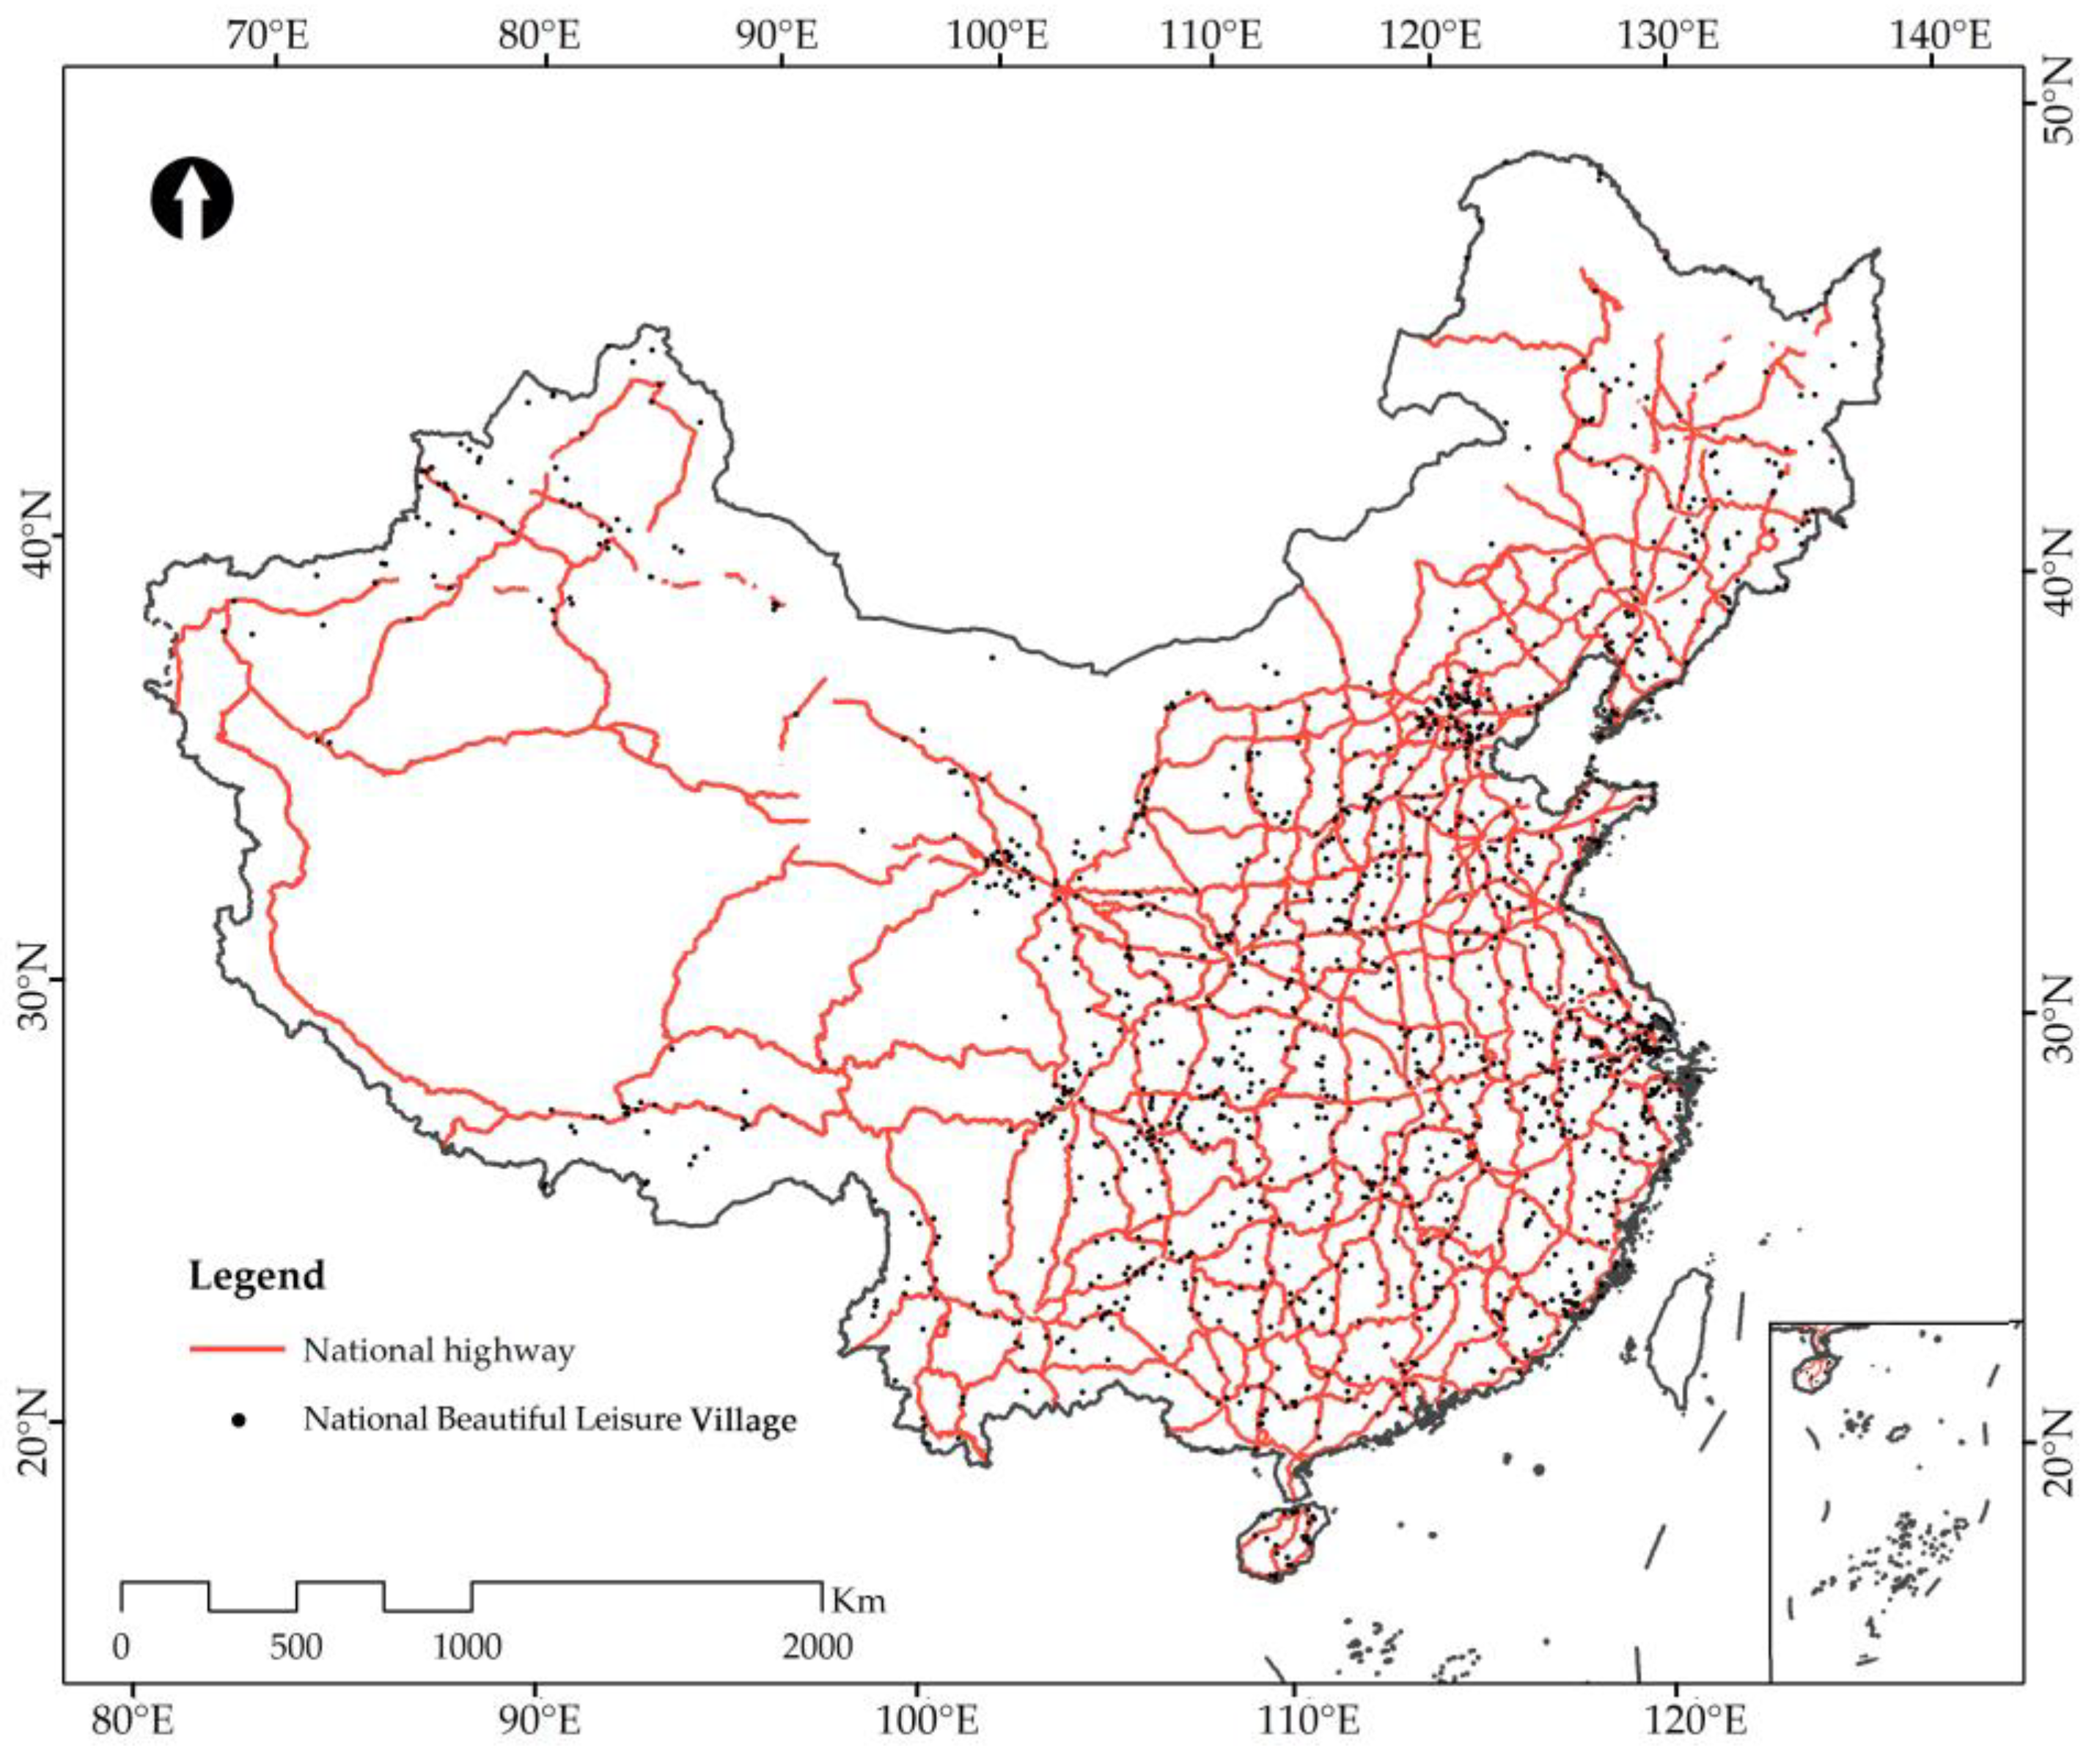
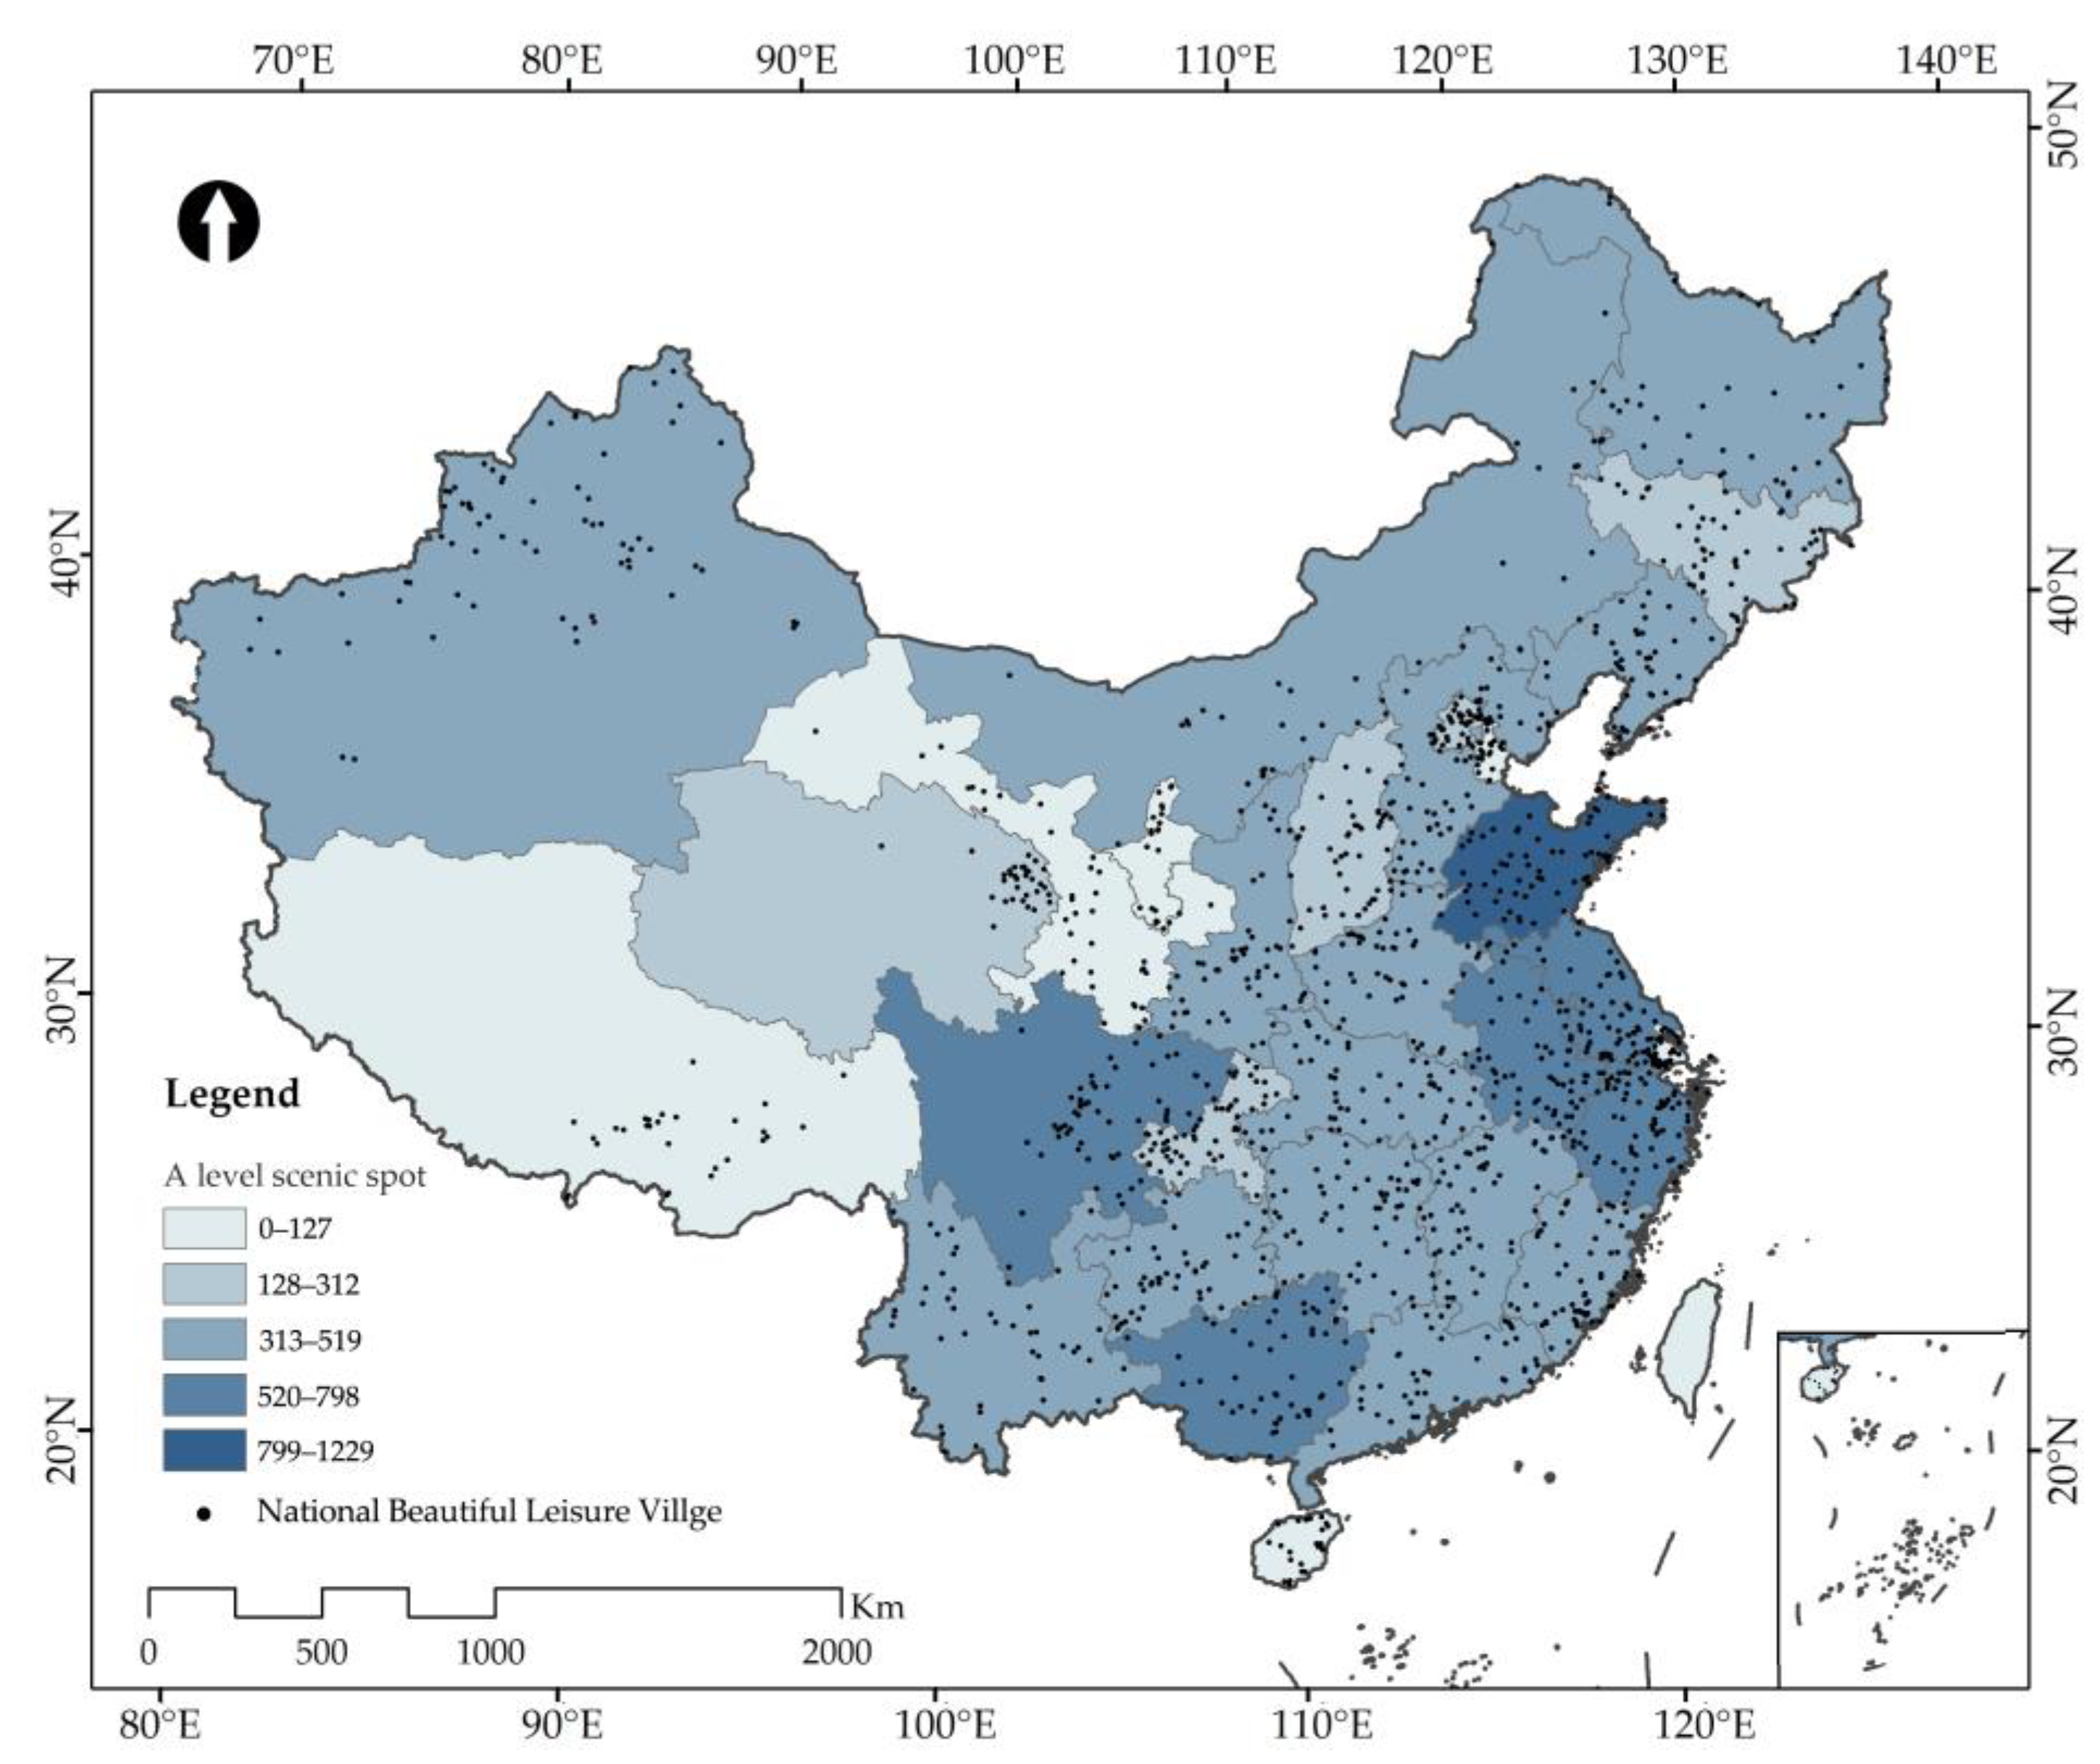
3.2. Spatial Distribution Characteristics
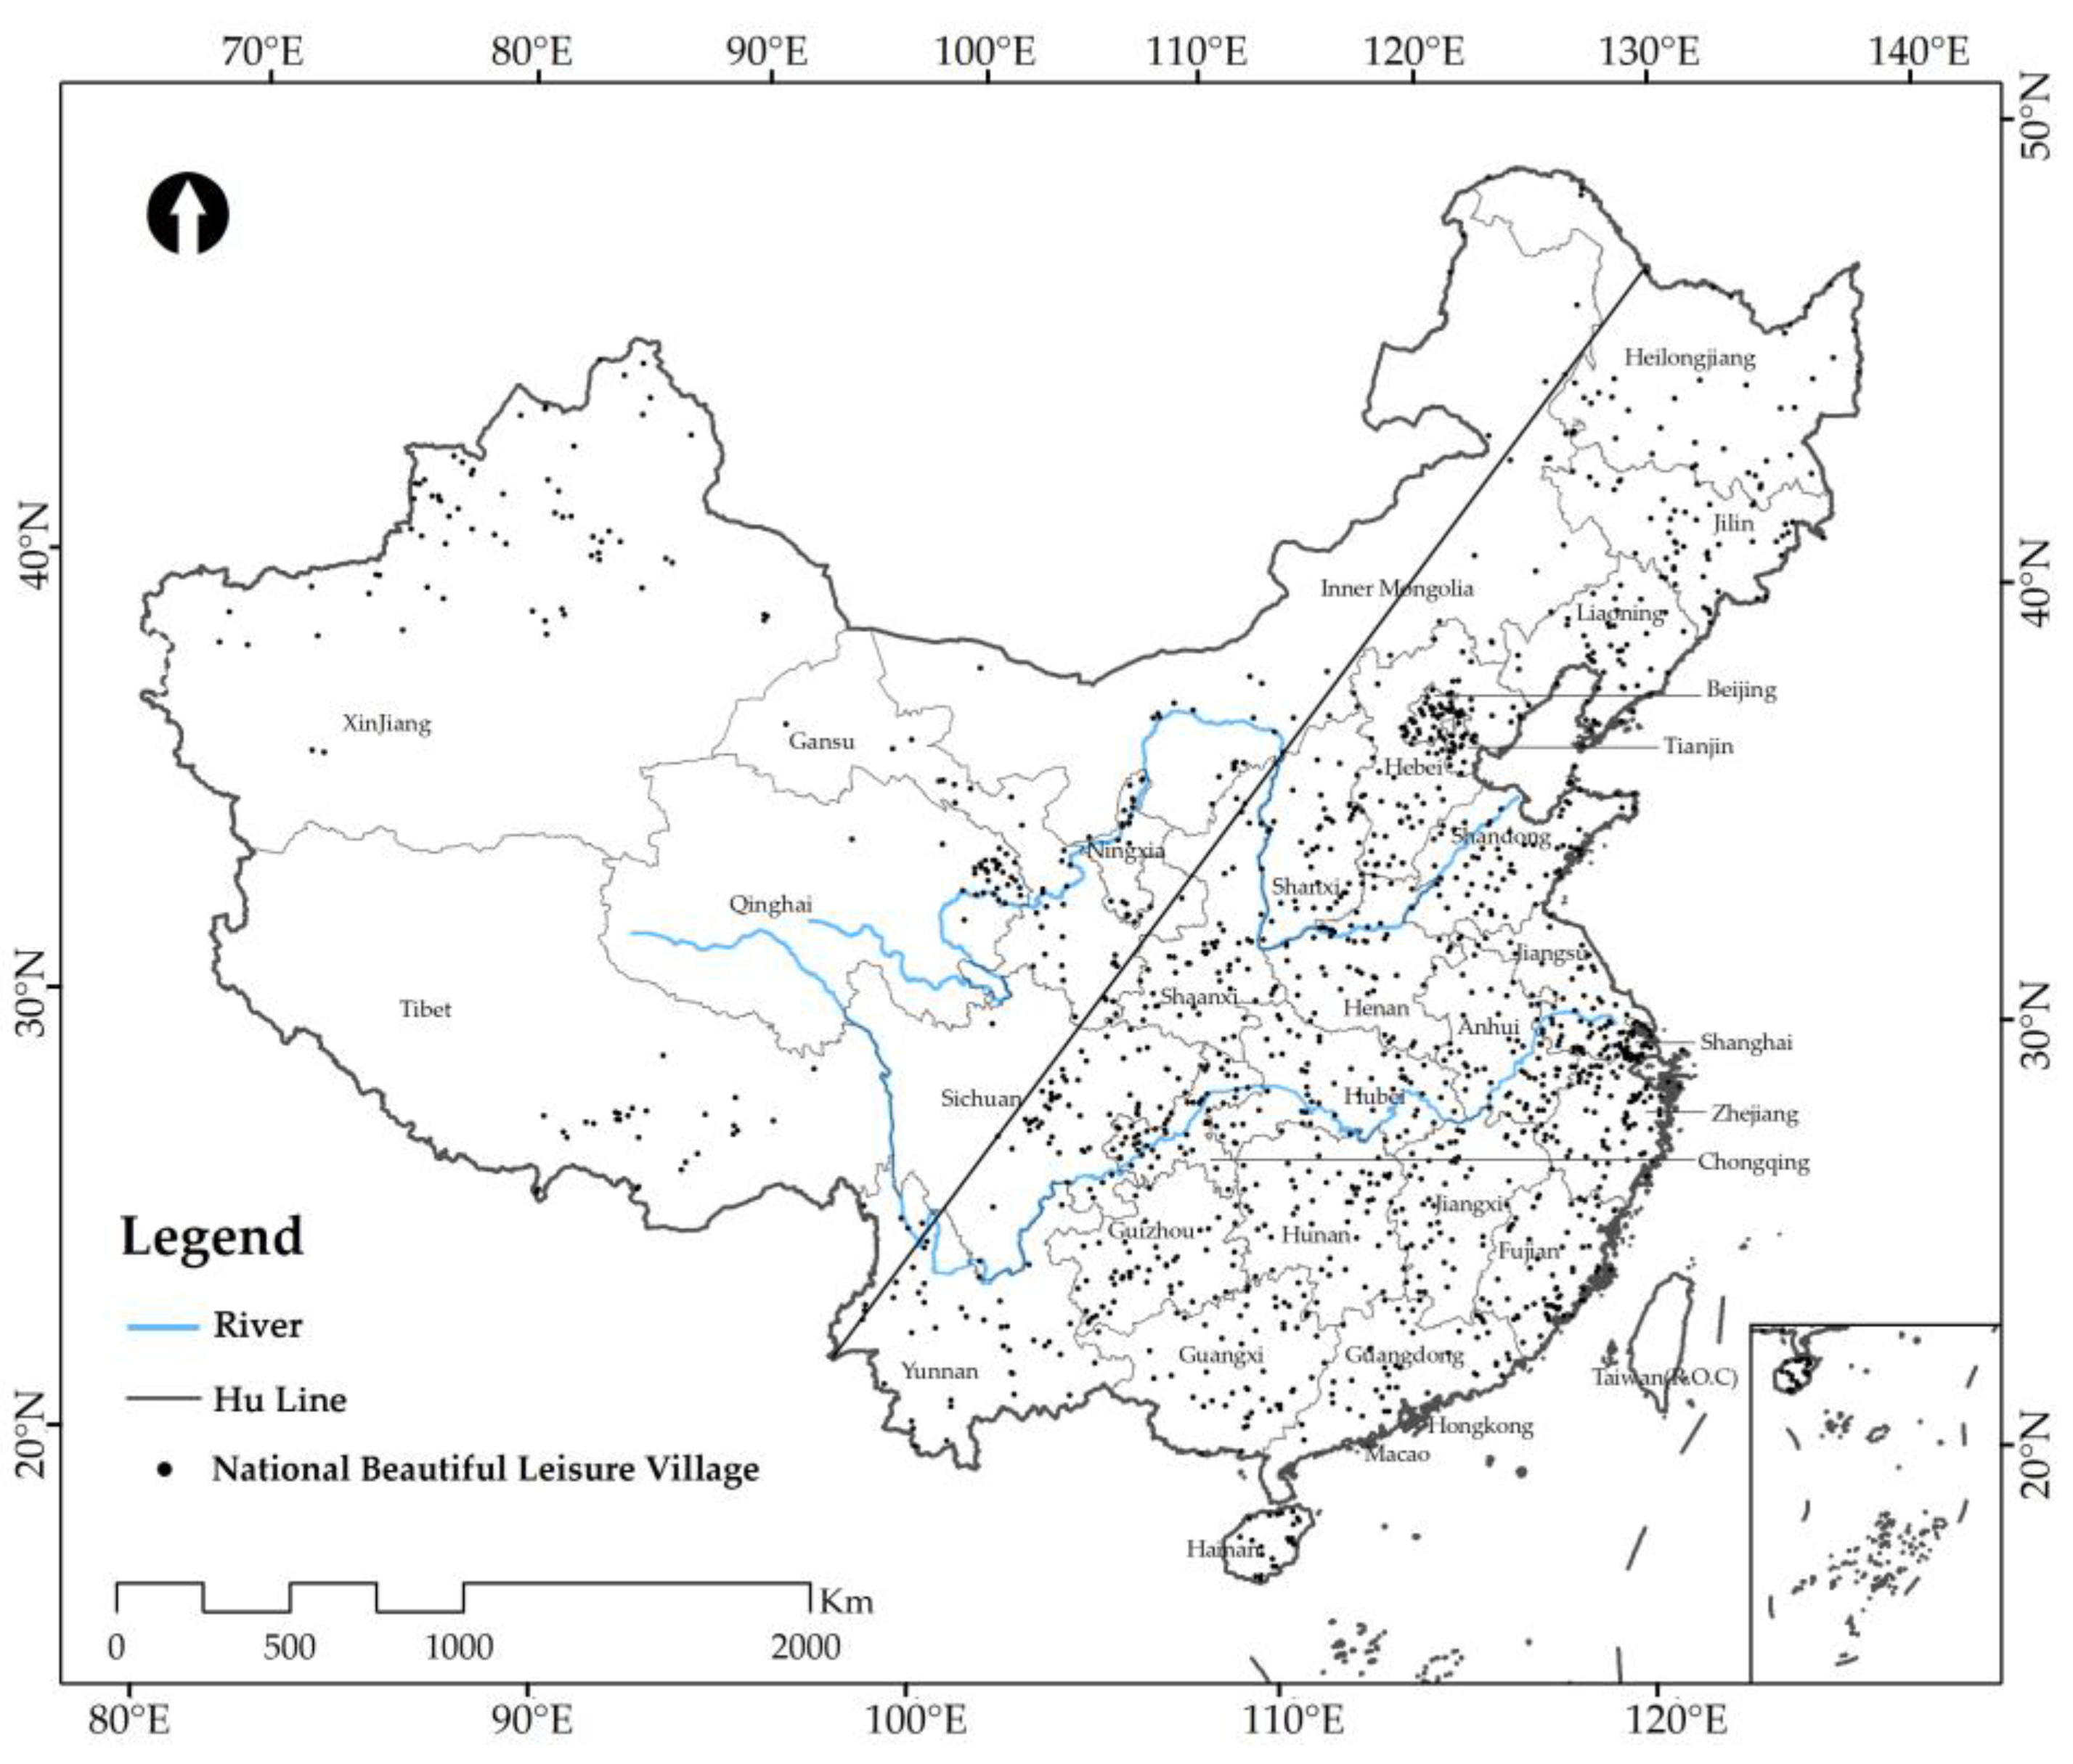
3.2.1. Spatial Distribution Pattern
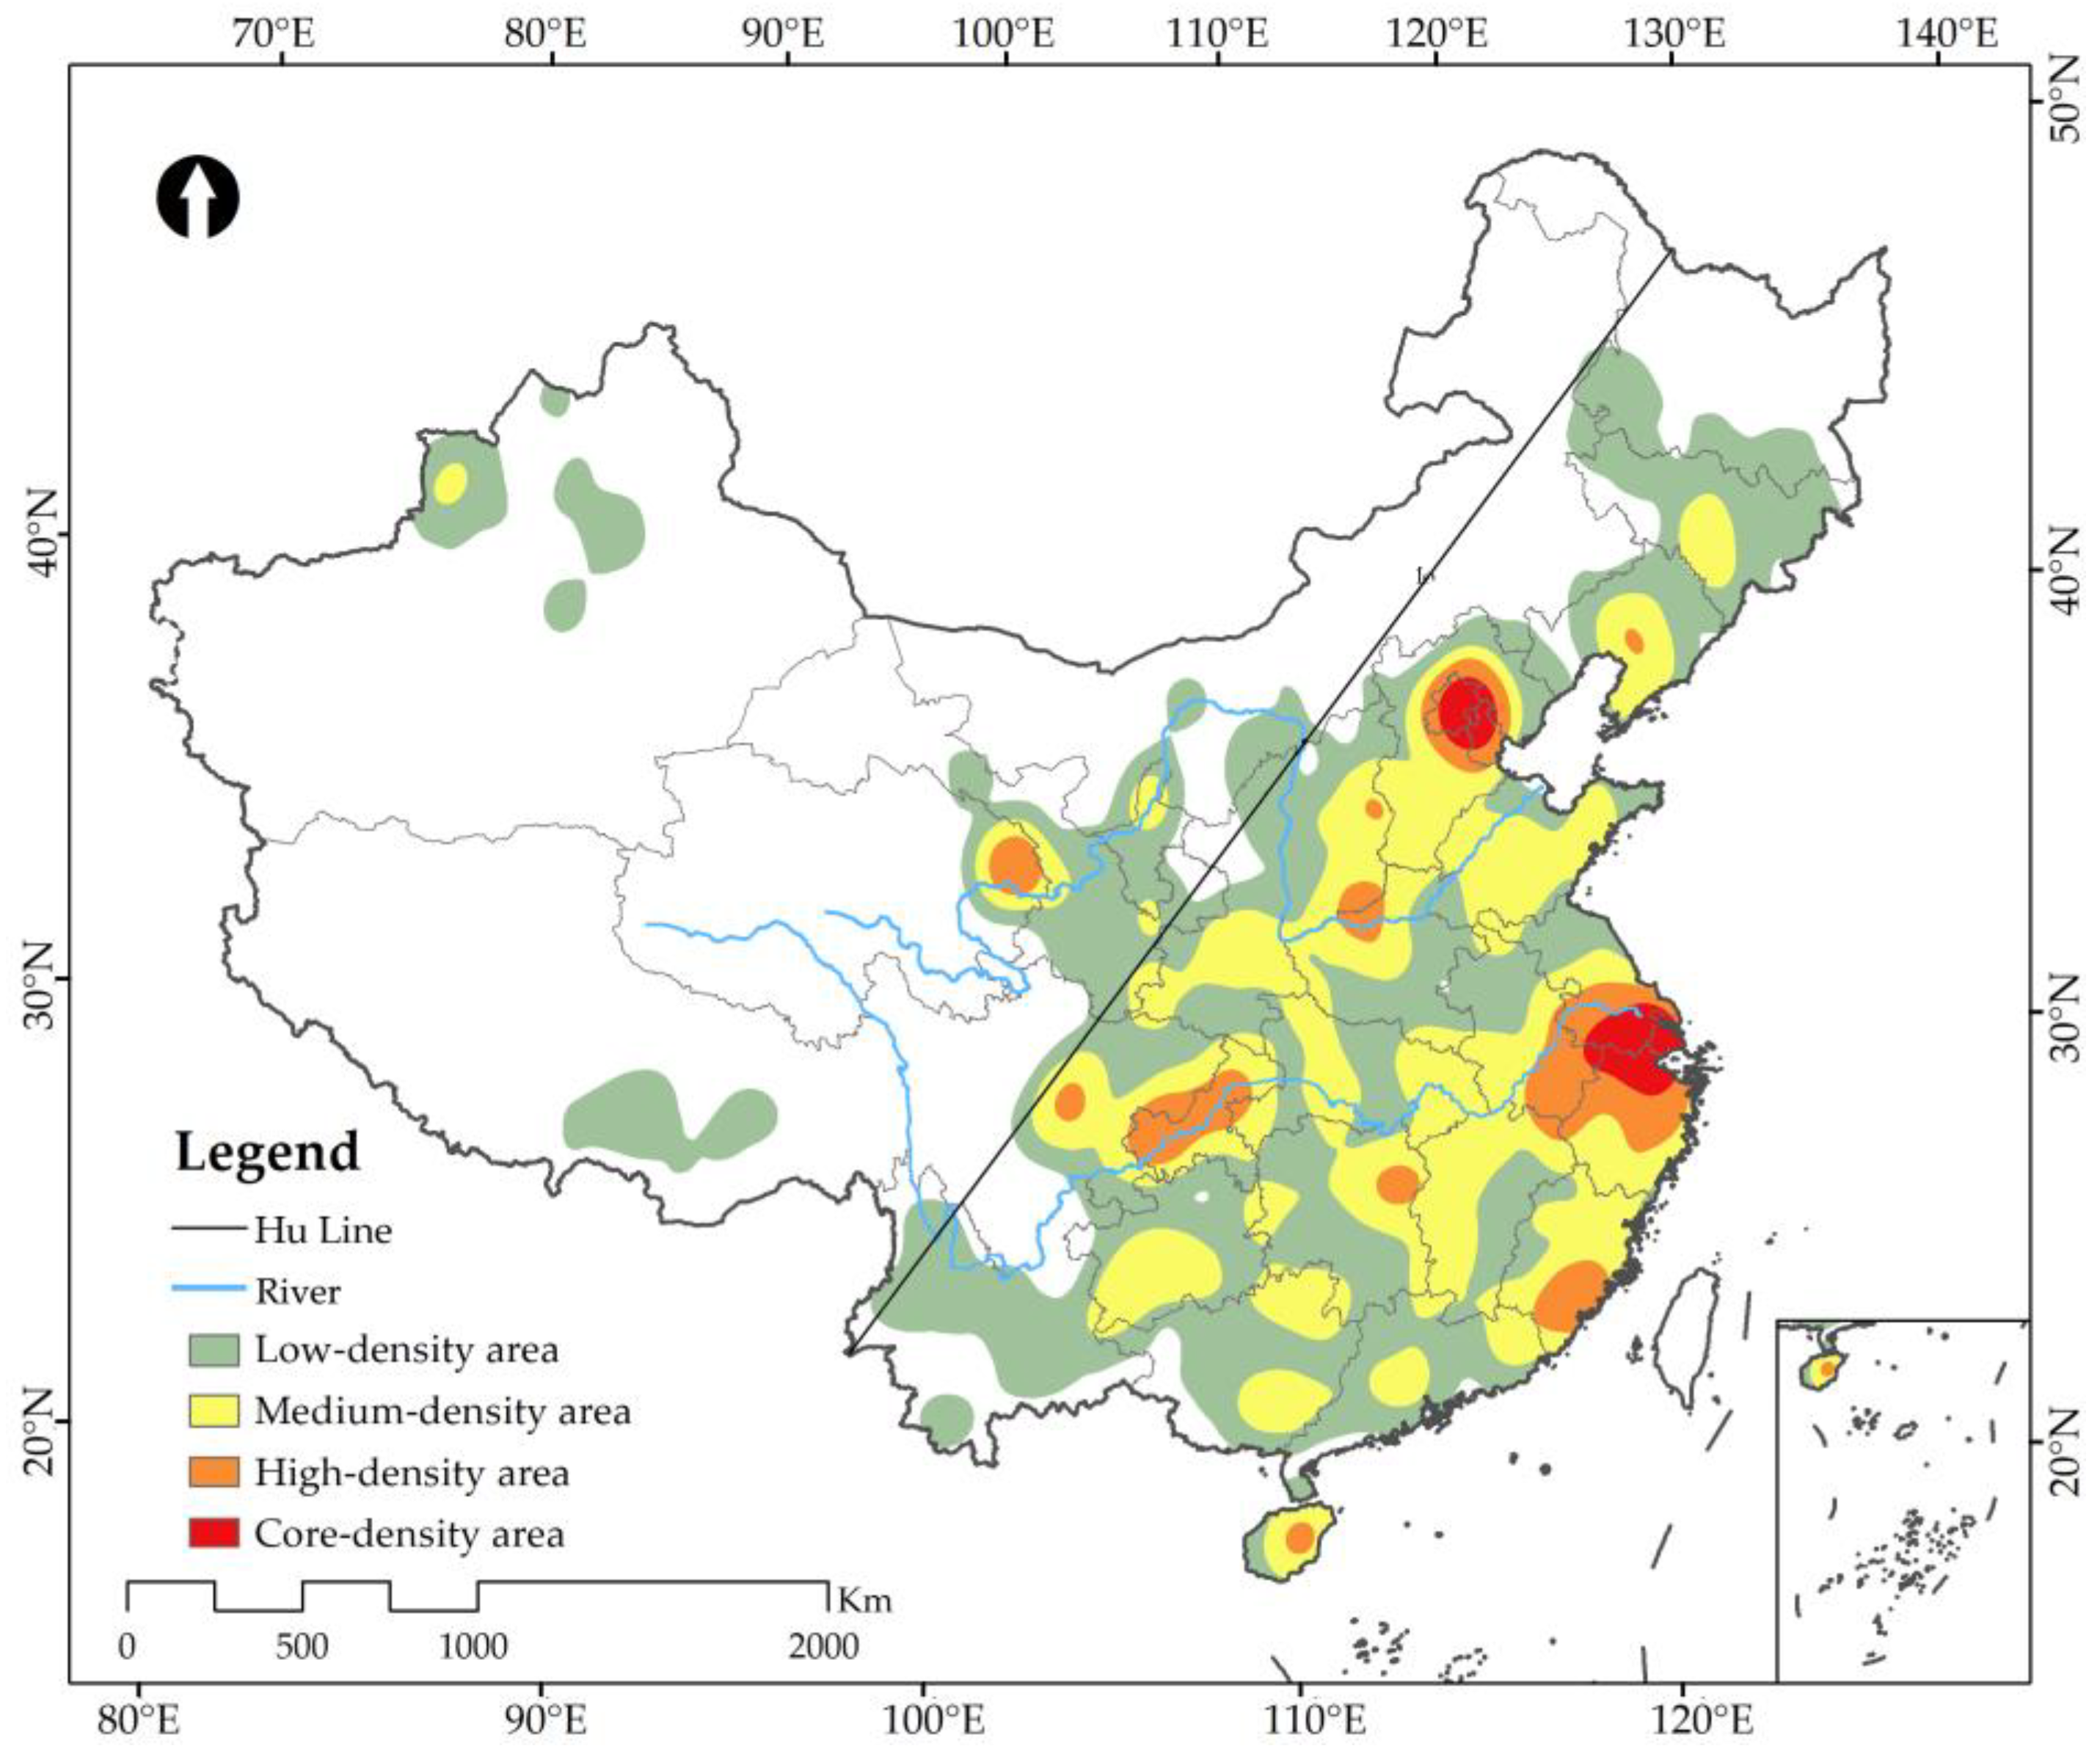
3.2.2. Spatial Distribution Density
- (1)
- “Dual core“ refers to two core density areas: the Yangtze River Delta region bordering Shanghai (35), Zhejiang (72) and Jiangsu (62) as the core, radiating to Anhui (55), and Beijing (42) and Tianjin (27) as the core, which then radiates to Hebei (48). The kernel density index of the core density was between 5.36 and 17.98.
- (2)
- “Seven centers” refers to seven high-density core regions: Chongqing (54) as the center radiating to Sichuan (57), Henan (50) as the center radiating to Shanxi (48), Hunan (54) as the center radiating to Jiangxi (53) and Hubei (54), Qinghai (54) as the center radiating to Gansu (53) and Fujian (63) as the center radiating to Guangdong (43), with the remaining locations of Liaoning (52) and Hainan (26) being two single-center areas. The kernel density index in the high-density region was between 1.06 and 10.09.
- (3)
- “Multiple scattered points” refers to the 11 scattered points distributed in other parts of China, including Shandong (64), Shaanxi (50), Jilin (47), Heilongjiang (41), Guangxi (51), Ningxia (22), Xinjiang (68), Inner Mongolia (42) and Tibet (28). The kernel density indexes of the medium and low densities were between 1.06 and 5.36.
3.2.3. Spatial Distribution Discrepancies
3.2.4. Spatial Distribution Cluster
4. Influence Factors
4.1. Geographical and Environmental Factors
4.2. Transportation Factors
4.3. Tourism Development Factors
5. Discussion
- (1)
- This study microanalyzed the distribution characteristics of BLVCs at the national scale but lacked the relevant direct analysis at the provincial and regional scales.
- (2)
- This study mainly adopted the basic research methods of spatial analysis in the distribution characteristics, limiting the selection of relevant calculation formulas and methods. An in-depth mining of the data and a strengthening of the research methods are the suggested directions for future research.
- (3)
- The characteristics of the rural distribution factors are complex and diverse. Due to the availability of the data, this study only carried out correlation analysis on the social and cultural factors, and the factor selection was not comprehensive. The intersection of factors needs further improvement in later research.
6. Conclusions
- (1)
- By 2021, 1470 BLVCs had been selected in the 31 administrative regions of China. The distribution in each region is uneven, presenting a state of aggregation.
- (2)
- The distribution of BLVCs presents a double-core, seven-center, multiple scattered distribution pattern.
- (3)
- Most BLVCs are located in the southeast, with a clear difference in distribution between the two sides of the Hu line.
- (4)
- From the perspective of the seven geographical divisions, the distribution of BLVCs is the highest in the east and the lowest in the south, with a difference of 19.25%.
- (1)
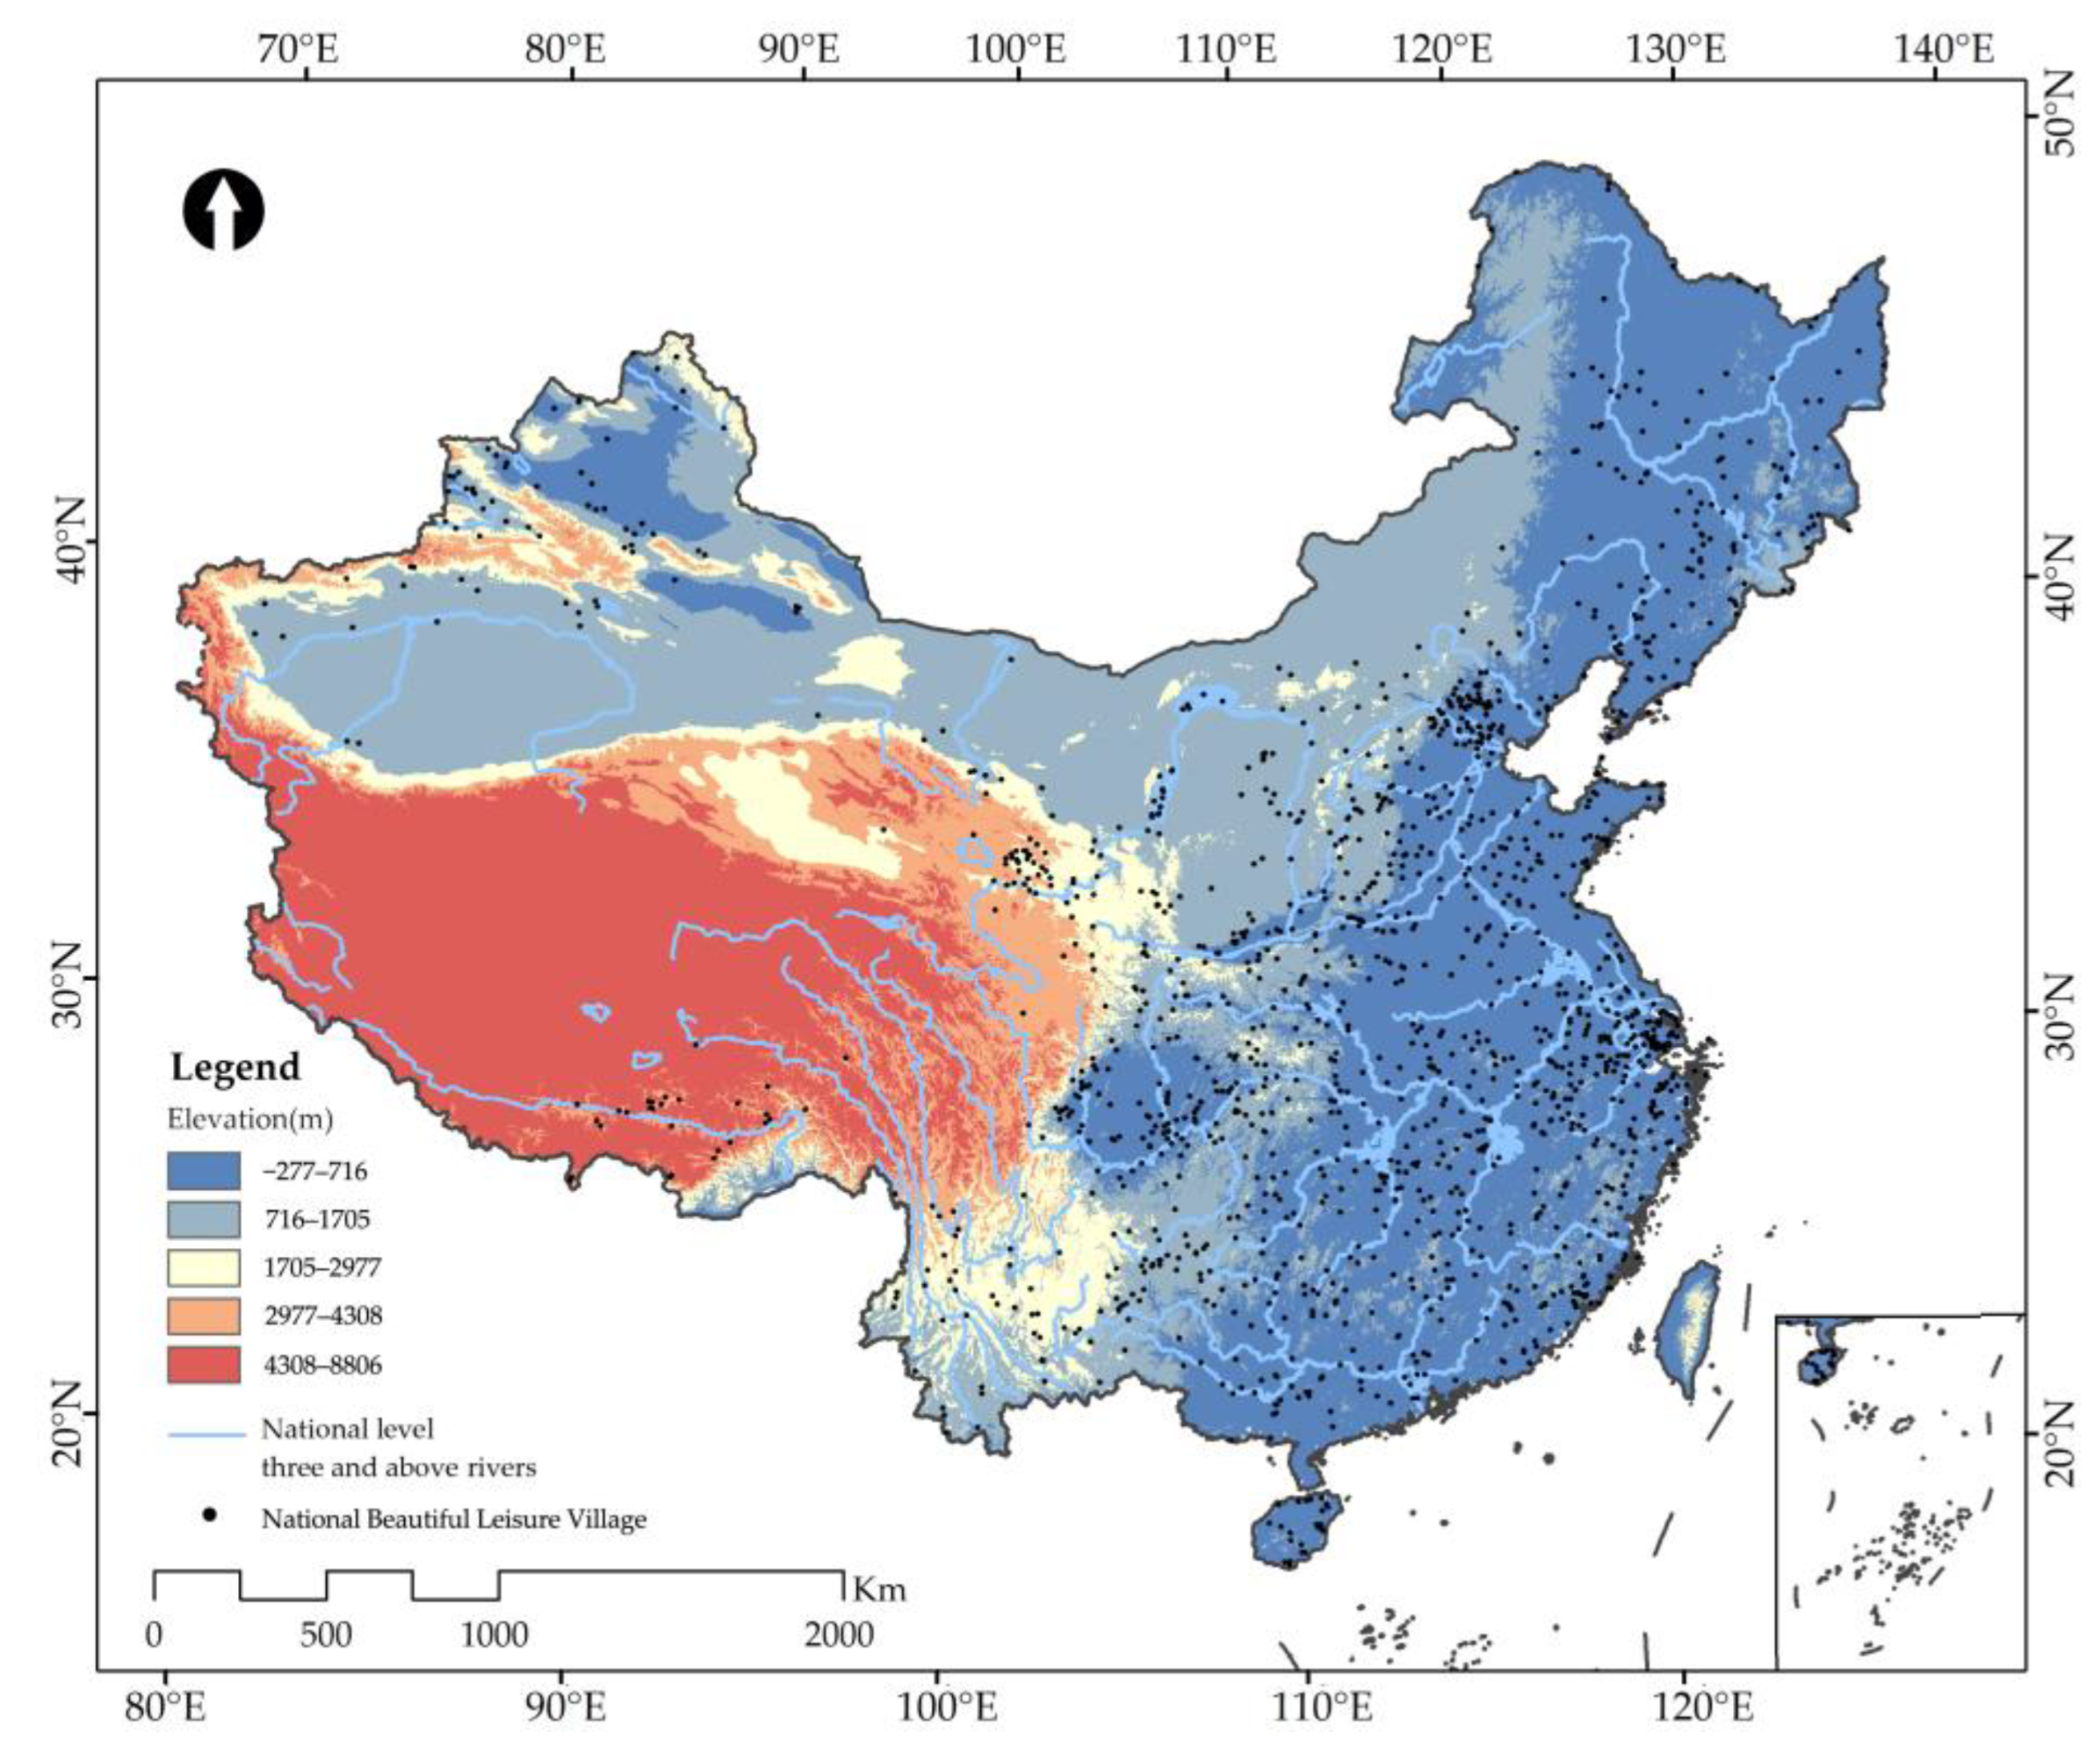
- From the perspective of the geographical environment, BLVCs are mainly concentrated in areas with flat terrain, a suitable climate and sufficient water resources, such as the eastern region.
- (2)
- From the perspective of road traffic, approximately half of the BLVCs are close to convenient road transportation. Accessibility affects the impact of rural development and the attraction of leisure tourism.
- (3)
- From the perspective of tourism development, the development of rich tourism resources and the construction of facilities and service systems have promoted the distribution and development of BLVCs.
- (4)
- From the perspective of policy, to achieve a balanced development of BLVCs in all regions, the national and local governments have strengthened policy guidance and financial support, especially in the northwest inland areas with slow development, such as Xinjiang.
- (1)
- Make full use of local ecological characteristics and resource advantages, and adjust the measures to the local conditions. Pay attention to improving rural ecological quality, maintaining rural scenery and respecting the natural patterns.
- (2)
- Build a tourism transportation network, comprehensively improve the integrity and diversity of tourism transportation facilities, and further enhance the attraction of tourism destinations.
- (3)
- The various regions should improve the facilities supporting rural tourism and comprehensively improve the service capacity and level of rural tourism. Each region should rely on their own cultural and tourism resources to develop the tourism industry creatively, integrating advantageous regional resources and enhancing the effect of industrial agglomeration.
- (4)
- The government should further improve rural policies and increase financial support for rural tourism. Local governments should confront the differences and gaps in regional development, strengthen coordinated development with the surrounding areas and form a win-win strategy of regional linkage and cooperation to optimize the spatial layout.
Author Contributions
Funding
Institutional Review Board Statement
Informed Consent Statement
Data Availability Statement
Conflicts of Interest
References
- Zhang, J.; Cenci, J.; Becue, V. A Preliminary Study on Industrial Landscape Planning and Spatial Layout in Belgium. Heritage 2021, 4, 1375–1387. [Google Scholar] [CrossRef]
- Yang, J.; Yang, R.; Chen, M.-H.; Su, C.-H.J.; Zhi, Y.; Xi, J. Effects of rural revitalization on rural tourism. J. Hosp. Tour. Manag. 2021, 47, 35–45. [Google Scholar] [CrossRef]
- Long, H.; Liu, Y.; Li, X.; Chen, Y. Building new countryside in China: A geographical perspective. Land Use Policy 2010, 27, 457–470. [Google Scholar] [CrossRef]
- Lopes, H.D.S.; Remoaldo, P.; Ribeiro, V. Residents’ perceptions of tourism activity in a rural North-Eastern Portuguese community: A cluster analysis. Bull. Geography. Socio-Econ. Ser. 2019, 46, 119–135. [Google Scholar] [CrossRef] [Green Version]
- Chigbu, U.E. Village renewal as an instrument of rural development: Evidence from Weyarn, Germany. Community Dev. 2012, 43, 209–224. [Google Scholar] [CrossRef]
- Onitsuka, K.; Hoshino, S. Inter-community networks of rural leaders and key people: Case study on a rural revitalization program in Kyoto Prefecture, Japan. J. Rural. Stud. 2018, 61, 123–136. [Google Scholar] [CrossRef]
- Kang, H.-M.; Choi, S.-I.; Jeon, S.-H.; Lee, C.-K.; Kim, H. Revitalization plans for mountain ecological villages in South Korea. Environ. Dev. Sustain. 2021, 23, 17060–17076. [Google Scholar] [CrossRef]
- Yang, X.J. China’s rapid urbanization. Science 2013, 342, 310. [Google Scholar] [CrossRef]
- Liu, Z.; Liu, S.; Jin, H.; Qi, W. Rural population change in China: Spatial differences, driving forces and policy implications. J. Rural. Stud. 2017, 51, 189–197. [Google Scholar] [CrossRef]
- Song, W.; Liu, M. Assessment of decoupling between rural settlement area and rural population in China. Land Use Policy 2014, 39, 331–341. [Google Scholar] [CrossRef]
- Deng, X.; Liang, L.; Wu, F.; Wang, Z.; He, S. A review of the balance of regional development in China from the perspective of development geography. J. Geogr. Sci. 2022, 32, 3–22. [Google Scholar] [CrossRef]
- Zhang, Q.; Lu, L.; Huang, J.; Zhang, X. Uneven development and tourism gentrification in the metropolitan fringe: A case study of Wuzhen Xizha in Zhejiang Province, China. Cities 2022, 121, 103476. [Google Scholar] [CrossRef]
- Gao, X.; Wang, F.; Liu, C.; Luo, T.; Zhang, Y.; Nuti, C. A Review of the Chinese Government Support and Sustainability Assessment for Ecovillage Development with a Global Perspective. Int. Rev. Spat. Plan. Sustain. Dev. 2022, 10, 43–73. [Google Scholar] [CrossRef]
- Hu, X.; Wu, Q.; Xu, W.; Li, Y. Specialty towns in China: Towards a typological policy approach. Land Use Policy 2022, 114, 105933. [Google Scholar] [CrossRef]
- Zhou, Y.; Li, Y.; Xu, C. Land consolidation and rural revitalization in China: Mechanisms and paths. Land Use Policy 2020, 91, 104379. [Google Scholar] [CrossRef]
- Liu, Y.; Lu, S.; Chen, Y. Spatio-temporal change of urban–rural equalized development patterns in China and its driving factors. J. Rural. Stud. 2013, 32, 320–330. [Google Scholar] [CrossRef]
- Gao, J.; Liu, Y.; Chen, J. China’s initiatives towards rural land system reform. Land Use Policy 2020, 94, 104567. [Google Scholar] [CrossRef]
- Choi, E.P.H.; Hui, B.P.H.; Wan, E.Y.F. Depression and anxiety in Hong Kong during COVID-19. Int. J. Environ. Res. Public Health 2020, 17, 3740. [Google Scholar] [CrossRef]
- McNeely, J.A. Nature and COVID-19: The pandemic, the environment, and the way ahead. Ambio 2021, 50, 767–781. [Google Scholar] [CrossRef]
- Jia, Z.; Xu, S.; Zhang, Z.; Cheng, Z.; Han, H.; Xu, H.; Wang, M.; Zhang, H.; Zhou, Y.; Zhou, Z. Association between mental health and community support in lockdown communities during the COVID-19 pandemic: Evidence from rural China. J. Rural. Stud. 2021, 82, 87–97. [Google Scholar] [CrossRef]
- Zhang, T.; Oin, X. The Impact of the Covid-19 on China’s Rural Revitalization. Basic Clin. Pharmacol. Toxicol. 2020, 127, 110–113. [Google Scholar]
- Li, J.; Gong, Y. Spatial location differentiation and development decision optimization of characteristic villages and towns in China. Geogr. Sustain. 2022, 3, 21–31. [Google Scholar] [CrossRef]
- Jaszczak, A.; Kristianova, K.; Pochodyła, E.; Kazak, J.K.; Młynarczyk, K. Revitalization of public spaces in Cittaslow towns: Recent urban redevelopment in Central Europe. Sustainability 2021, 13, 2564. [Google Scholar] [CrossRef]
- Mwesiumo, D.; Halfdanarson, J.; Shlopak, M. Navigating the early stages of a large sustainability-oriented rural tourism development project: Lessons from Træna, Norway. Tour. Manag. 2022, 89, 104456. [Google Scholar] [CrossRef]
- Munton, R. Rural land ownership in the United Kingdom: Changing patterns and future possibilities for land use. Land Use Policy 2009, 26, S54–S61. [Google Scholar] [CrossRef]
- Ma, D.; Li, F.; Li, A. An exploration on the “non original tourism experience” mode based on science and technology. IOP Conf. Ser. Mater. Sci. Eng. 2018, 394, 52036. [Google Scholar] [CrossRef]
- Sun, Y.; Timothy, D.J.; Wang, Y.; Min, Q.; Su, Y. Reflections on agricultural heritage systems and tourism in China. J. China Tour. Res. 2019, 15, 359–378. [Google Scholar] [CrossRef]
- Yehong, S.; Cancan, Y.; Yuexin, C.; Yuxin, S.; Ying, W. Ecological Theory and Practice in Tourism Research in the New Era. J. Resour. Ecol. 2022, 13, 142–160. [Google Scholar] [CrossRef]
- Li, Y.; Zhang, H.; Zhang, D.; Abrahams, R. Mediating urban transition through rural tourism. Ann. Tour. Res. 2019, 75, 152–164. [Google Scholar] [CrossRef]
- Chen, Z.; Liu, Y.; Feng, W.; Li, Y.; Li, L. Study on spatial tropism distribution of rural settlements in the Loess Hilly and Gully Region based on natural factors and traffic accessibility. J. Rural. Stud. 2019, 93, 441–448. [Google Scholar] [CrossRef]
- Gibson, J.; Deng, X.; Boe-Gibson, G.; Rozelle, S.; Huang, J. Which households are most distant from health centers in rural China? Evidence from a GIS network analysis. GeoJournal 2011, 76, 245–255. [Google Scholar] [CrossRef] [Green Version]
- Zhang, A.; Yang, Y.; Chen, T.; Liu, J.; Hu, Y. Exploration of spatial differentiation patterns and related influencing factors for National Key Villages for rural tourism in China in the context of a rural revitalization strategy, using GIS-based overlay analysis. Arab. J. Geosci. 2021, 14, 1–15. [Google Scholar] [CrossRef]
- Zhou, Q.; Chen, J.; van den Bosch, C.C.K.; Zhang, W.; Zhu, L.; Vera, Y.M.R.; Dong, J. Constructing an Aims-Indicators-Methods framework for Green Space System Planning in China. Urban For. Urban Green. 2022, 67, 127437. [Google Scholar] [CrossRef]
- Chen, C.; She, Y.; Chen, Q.; Liu, S. Study on ecological adaptability of traditional village construction in Hainan volcanic areas. J. Asian Archit. Build. Eng. 2022, 1, 1–19. [Google Scholar] [CrossRef] [Green Version]
- Shen, J.; Chou, R.-J. Rural revitalization of Xiamei: The development experiences of integrating tea tourism with ancient village preservation. J. Rural. Stud. 2022, 90, 42–52. [Google Scholar] [CrossRef]
- Wang, W.; Watanabe, M.; Ono, K.; Zhou, D. Exploring Visualisation Methodology of Landscape Design on Rural Tourism in China. Buildings 2022, 12, 64. [Google Scholar] [CrossRef]
- Gao, J.; Wu, B. Revitalizing traditional villages through rural tourism: A case study of Yuanjia Village, Shaanxi Province, China. Tour. Manag. 2017, 63, 223–233. [Google Scholar] [CrossRef]
- Wang, L.-E.; Cheng, S.-K.; Zhong, L.-S.; Mu, S.-L.; Dhruba, B.G.; Ren, G.-Z. Rural tourism development in China: Principles, models and the future. J. Mt. Sci. 2013, 10, 116–129. [Google Scholar] [CrossRef] [Green Version]
- Shen, L.; Jiang, S.; Yuan, H. Critical indicators for assessing the contribution of infrastructure projects to coordinated urban–rural development in China. Habitat Int. 2012, 36, 237–246. [Google Scholar] [CrossRef]
- Shen, Y.; Li, S. Eliminating poverty through development: The dynamic evolution of multidimensional poverty in rural China. Econ. Political Stud. 2022, 10, 1–20. [Google Scholar] [CrossRef]
- Houkai, W. China’s Rural Development in the 14th Five-Year Plan Period. China Econ. 2022, 17, 2–11. [Google Scholar]
- Su, B. Rural tourism in China. Tour. Manag. 2011, 32, 1438–1441. [Google Scholar] [CrossRef]
- Zhang, J.; Cenci, J.; Becue, V.; Koutra, S. Research of the industrial heritage category and spatial density distribution in the Walloon region, Belgium, and Northeast China. In Structural Studies, Repairs and Maintenance of Heritage Architecture XVII & Earthquake Resistant Engineering Structures XIII; WIT Press: Chilworth, UK, 2021; p. 285. [Google Scholar]
- Wang, X.; Zhang, J.; Cenci, J.; Becue, V. Spatial Distribution Characteristics and Influencing Factors of the World Architectural Heritage. Heritage 2021, 4, 2942–2959. [Google Scholar] [CrossRef]
- Zhang, J.; Cenci, J.; Becue, V.; Koutra, S. Analysis of spatial structure and influencing factors of the distribution of national industrial heritage sites in China based on mathematical calculations. Environ. Sci. Pollut. Res. 2022, 9, 27124–27139. [Google Scholar] [CrossRef]
- Zhan, Z.; Cenci, J.; Zhang, J. Frontier of Rural Revitalization in China: A Spatial Analysis of National Rural Tourist Towns. Land 2022, 11, 812. [Google Scholar] [CrossRef]
- Jang, S.; An, Y.; Yi, C.; Lee, S. Assessing the spatial equity of Seoul’s public transportation using the Gini coefficient based on its accessibility. Int. J. Urban Sci. 2017, 21, 91–107. [Google Scholar] [CrossRef]
- Patton, C.; Sawicki, D.; Clark, J. Basic Methods of Policy Analysis and Planning—Pearson eText; Routledge: Oxfordshire, UK, 2015. [Google Scholar]
- Chio, J.T. A Landscape of Travel: The Work of Tourism in Rural Ethnic China; University of Washington Press: Seattle, WA, USA, 2014. [Google Scholar]
- Li, Z.; Zhang, X.; Yang, K.; Singer, R.; Cui, R. Urban and rural tourism under COVID-19 in China: Research on the recovery measures and tourism development. Tour. Rev. 2021, 76, 718–736. [Google Scholar] [CrossRef]
- Looney, K.E. China’s campaign to build a new socialist countryside: Village modernization, peasant councils, and the Ganzhou model of rural development. China Q. 2015, 224, 909–932. [Google Scholar] [CrossRef]
- Lincoln, T.; Madgin, R. The inherent malleability of heritage: Creating China’s beautiful villages. Int. J. Herit. Stud. 2018, 24, 938–953. [Google Scholar] [CrossRef] [Green Version]
- Ye, C.; Ma, X.; Cai, Y.; Gao, F. The countryside under multiple high-tension lines: A perspective on the rural construction of Heping Village, Shanghai. J. Rural. Stud. 2018, 62, 53–61. [Google Scholar] [CrossRef]
- Zhang, D.; Gao, W.; Lv, Y. The Triple Logic and Choice Strategy of Rural Revitalization in the 70 Years since the Founding of the People’s Republic of China, Based on the Perspective of Historical Evolution. Agriculture 2020, 10, 125. [Google Scholar] [CrossRef] [Green Version]
- Zan, Z.; Xijun, H. Urban river landscape design based on regional characteristics-A case study of Jinxi River in Hushan Town. J. Landsc. Res. 2014, 6, 13. [Google Scholar]
- Zhuang, X.; Yao, Y.; Li, J.J. Sociocultural impacts of tourism on residents of world cultural heritage sites in China. Sustainability 2019, 11, 840. [Google Scholar] [CrossRef] [Green Version]
- Kong, X.; Fu, M.; Zhao, X.; Wang, J.; Jiang, P. Ecological effects of land-use change on two sides of the Hu Huanyong Line in China. Land Use Policy 2022, 113, 105895. [Google Scholar] [CrossRef]
- Anqi, D.; Cenci, J.; Zhang, J. Links between the pandemic and urban green spaces, a perspective on spatial indices of landscape garden cities in China. Sustain. Cities Soc. 2022, 85, 104046. [Google Scholar]
- Zhou, G.; He, Y.; Tang, C.; Yu, T.; Xiao, G.; Zhong, T. Dynamic mechanism and present situation of rural settlement evolution in China. J. Geogr. Sci. 2013, 23, 513–524. [Google Scholar] [CrossRef]
- Ma, W.; Tian, W.; Zhou, Q.; Miao, Q. Analysis on the Temporal and Spatial Heterogeneity of Factors Affecting Urbanization Development Based on the GTWR Model: Evidence from the Yangtze River Economic Belt. Complexity 2021, 2021, 1–11. [Google Scholar] [CrossRef]
- Allen, A. Environmental planning and management of the peri-urban interface: Perspectives on an emerging field. Environ. Urban. 2003, 15, 135–148. [Google Scholar] [CrossRef] [Green Version]
- Chen, W.; Zhu, K.; Wu, Q.; Cai, Y.; Lu, Y.; Wei, J. Adaptability evaluation of human settlements in Chengdu based on 3S technology. Environ. Sci. Pollut. Res. 2022, 29, 5988–5999. [Google Scholar] [CrossRef]
- Li, Y.; Zhou, T.; Jiang, G.; Li, G.; Zhou, D.; Luo, Y. Spatial pattern and mechanisms of farmland abandonment in Agricultural and Pastoral Areas of Qingzang Plateau. Geogr. Sustain. 2021, 2, 139–150. [Google Scholar] [CrossRef]
- Buell, P.D.; Anderson, E.; de Pablo Moya, M.; Oskenbay, M. The Eurasian Heartland: Overview of a Link between Worlds. In Crossroads of Cuisine: The Eurasian Heartland, the Silk Roads and Food; Brill: Leiden, The Netherlands, 2020; pp. 7–52. [Google Scholar]
- Chen, J.; Yang, A. Intelligent agriculture and its key technologies based on internet of things architecture. IEEE Access 2019, 7, 77134–77141. [Google Scholar] [CrossRef]
- Nyberg, A.; Rozelle, S. Accelerating China’s Rural Transformation; World Bank Publications: Washington, VA, USA, 1999. [Google Scholar]
- Suichang Promulgation. Available online: https://www.sohu.com/a/293069217_776242 (accessed on 10 June 2022).
- Shakibaei, S.; De Jong, G.C.; Alpkökin, P.; Rashidi, T.H. Impact of the COVID-19 pandemic on travel behavior in Istanbul: A panel data analysis. Sustain. Cities Soc. 2021, 65, 102619. [Google Scholar] [CrossRef] [PubMed]
- Yanbo, Q.; Guanghui, J.; Wenqiu, M.; Zitong, L. How does the rural settlement transition contribute to shaping sustainable rural development? Evidence from Shandong, China. J. Rural. Stud. 2021, 82, 279–293. [Google Scholar] [CrossRef]
- Cao, M.; Xu, D.; Xie, F.; Liu, E.; Liu, S. The influence factors analysis of households’ poverty vulnerability in southwest ethnic areas of China based on the hierarchical linear model: A case study of Liangshan Yi autonomous prefecture. Appl. Geogr. 2016, 66, 144–152. [Google Scholar] [CrossRef]
- Tang, B.-S.; Wong, S.-W.; Lau, M.C.-H. Social impact assessment and public participation in China: A case study of land requisition in Guangzhou. Environ. Impact Assess. Rev. 2008, 28, 57–72. [Google Scholar] [CrossRef]
- Zhao, Y.; Chen, X. Characteristic Town Environment Design Based on Brand Community—A Case Study of the Forest Hot Spring Township in Ninghai. Asian Agric. Res. 2018, 10, 96–100. [Google Scholar]
- Beishuang Promulgation. Available online: https://www.sohu.com/a/383674131_720644 (accessed on 10 June 2022).
- Fengqi, Z.; Jun, S. Deploying an intelligent transportation system in Chongming County, Shanghai. J. Urban Technol. 2010, 17, 39–51. [Google Scholar] [CrossRef]
- Chen, W. The Transformation of Commercialized Rural Service System with Taking Agricultural Informatization as a Breakthrough. In Challenges and Opportunities for Chinese Agriculture; Springer: Berlin/Heidelberg, Germany, 2020; pp. 341–417. [Google Scholar]
- McKercher, B. A chaos approach to tourism. Tour. Manag. 1999, 20, 425–434. [Google Scholar] [CrossRef]
- Buckley, R. Surf tourism and sustainable development in Indo-Pacific Islands. I. The industry and the islands. J. Sustain. Tour. 2002, 10, 405–424. [Google Scholar] [CrossRef] [Green Version]
- Dorobantu, M.R.; Nistoreanu, P. Rural tourism and ecotourism–the main priorities in sustainable development orientations of rural local communities in Romania. Econ. Transdiscipl. Cogn. 2012, XV, 259–266. [Google Scholar]
- Qingshanyijiu. Available online: https://www.meipian.cn/2yksi1u8 (accessed on 10 June 2022).
- Shaoyang Promulgation. Available online: https://www.shaoyang.gov.cn/ (accessed on 10 June 2022).
- Fan, S.; Chan-Kang, C. Road Development, Economic Growth, and Poverty Reduction in China; International Food Policy Research Institute: Washington, VA, USA, 2005; Volume 12.
- Cao, H. Urban–rural income disparity and urbanization: What is the role of spatial distribution of ethnic groups? A case study of Xinjiang Uyghur Autonomous Region in western China. Reg. Stud. 2010, 44, 965–982. [Google Scholar] [CrossRef]
- Szadziewski, H.; Mostafanezhad, M.; Murton, G. Territorialization on tour: The tourist gaze along the Silk Road Economic Belt in Kashgar, China. Geoforum 2022, 128, 135–147. [Google Scholar] [CrossRef]
- Zhou, Y. Drawing on the Experience of Zhejiang Province to Promote the Development of Rural Tourism in Inner Mongolia. In Proceedings of the 3rd International Seminar on Education Innovation and Economic Management (SEIEM 2018), Penang, Malaysia, 29–31 December 2018; pp. 258–261. [Google Scholar]
- Long, H.; Ma, L.; Zhang, Y.; Qu, L. Multifunctional rural development in China: Pattern, process and mechanism. Habitat Int. 2022, 121, 102530. [Google Scholar] [CrossRef]
- Kelamayi Promulgation. Available online: https://www.sohu.com/a/502669954_121119059 (accessed on 10 June 2022).
- Lv, P.; Zhang, Y.; Meng, X.-Z.; Xu, Y.-L.; Li, Z.-J.; Duan, W.; Zhai, X.-J. Research on the Reform Mode of Rural Power Grid Construction under the Background of Rural Revitalization. In Proceedings of the 2020 5th International Conference on Mechanical, Control and Computer Engineering (ICMCCE), Harbin, China, 25–27 December 2020; pp. 135–138. [Google Scholar]


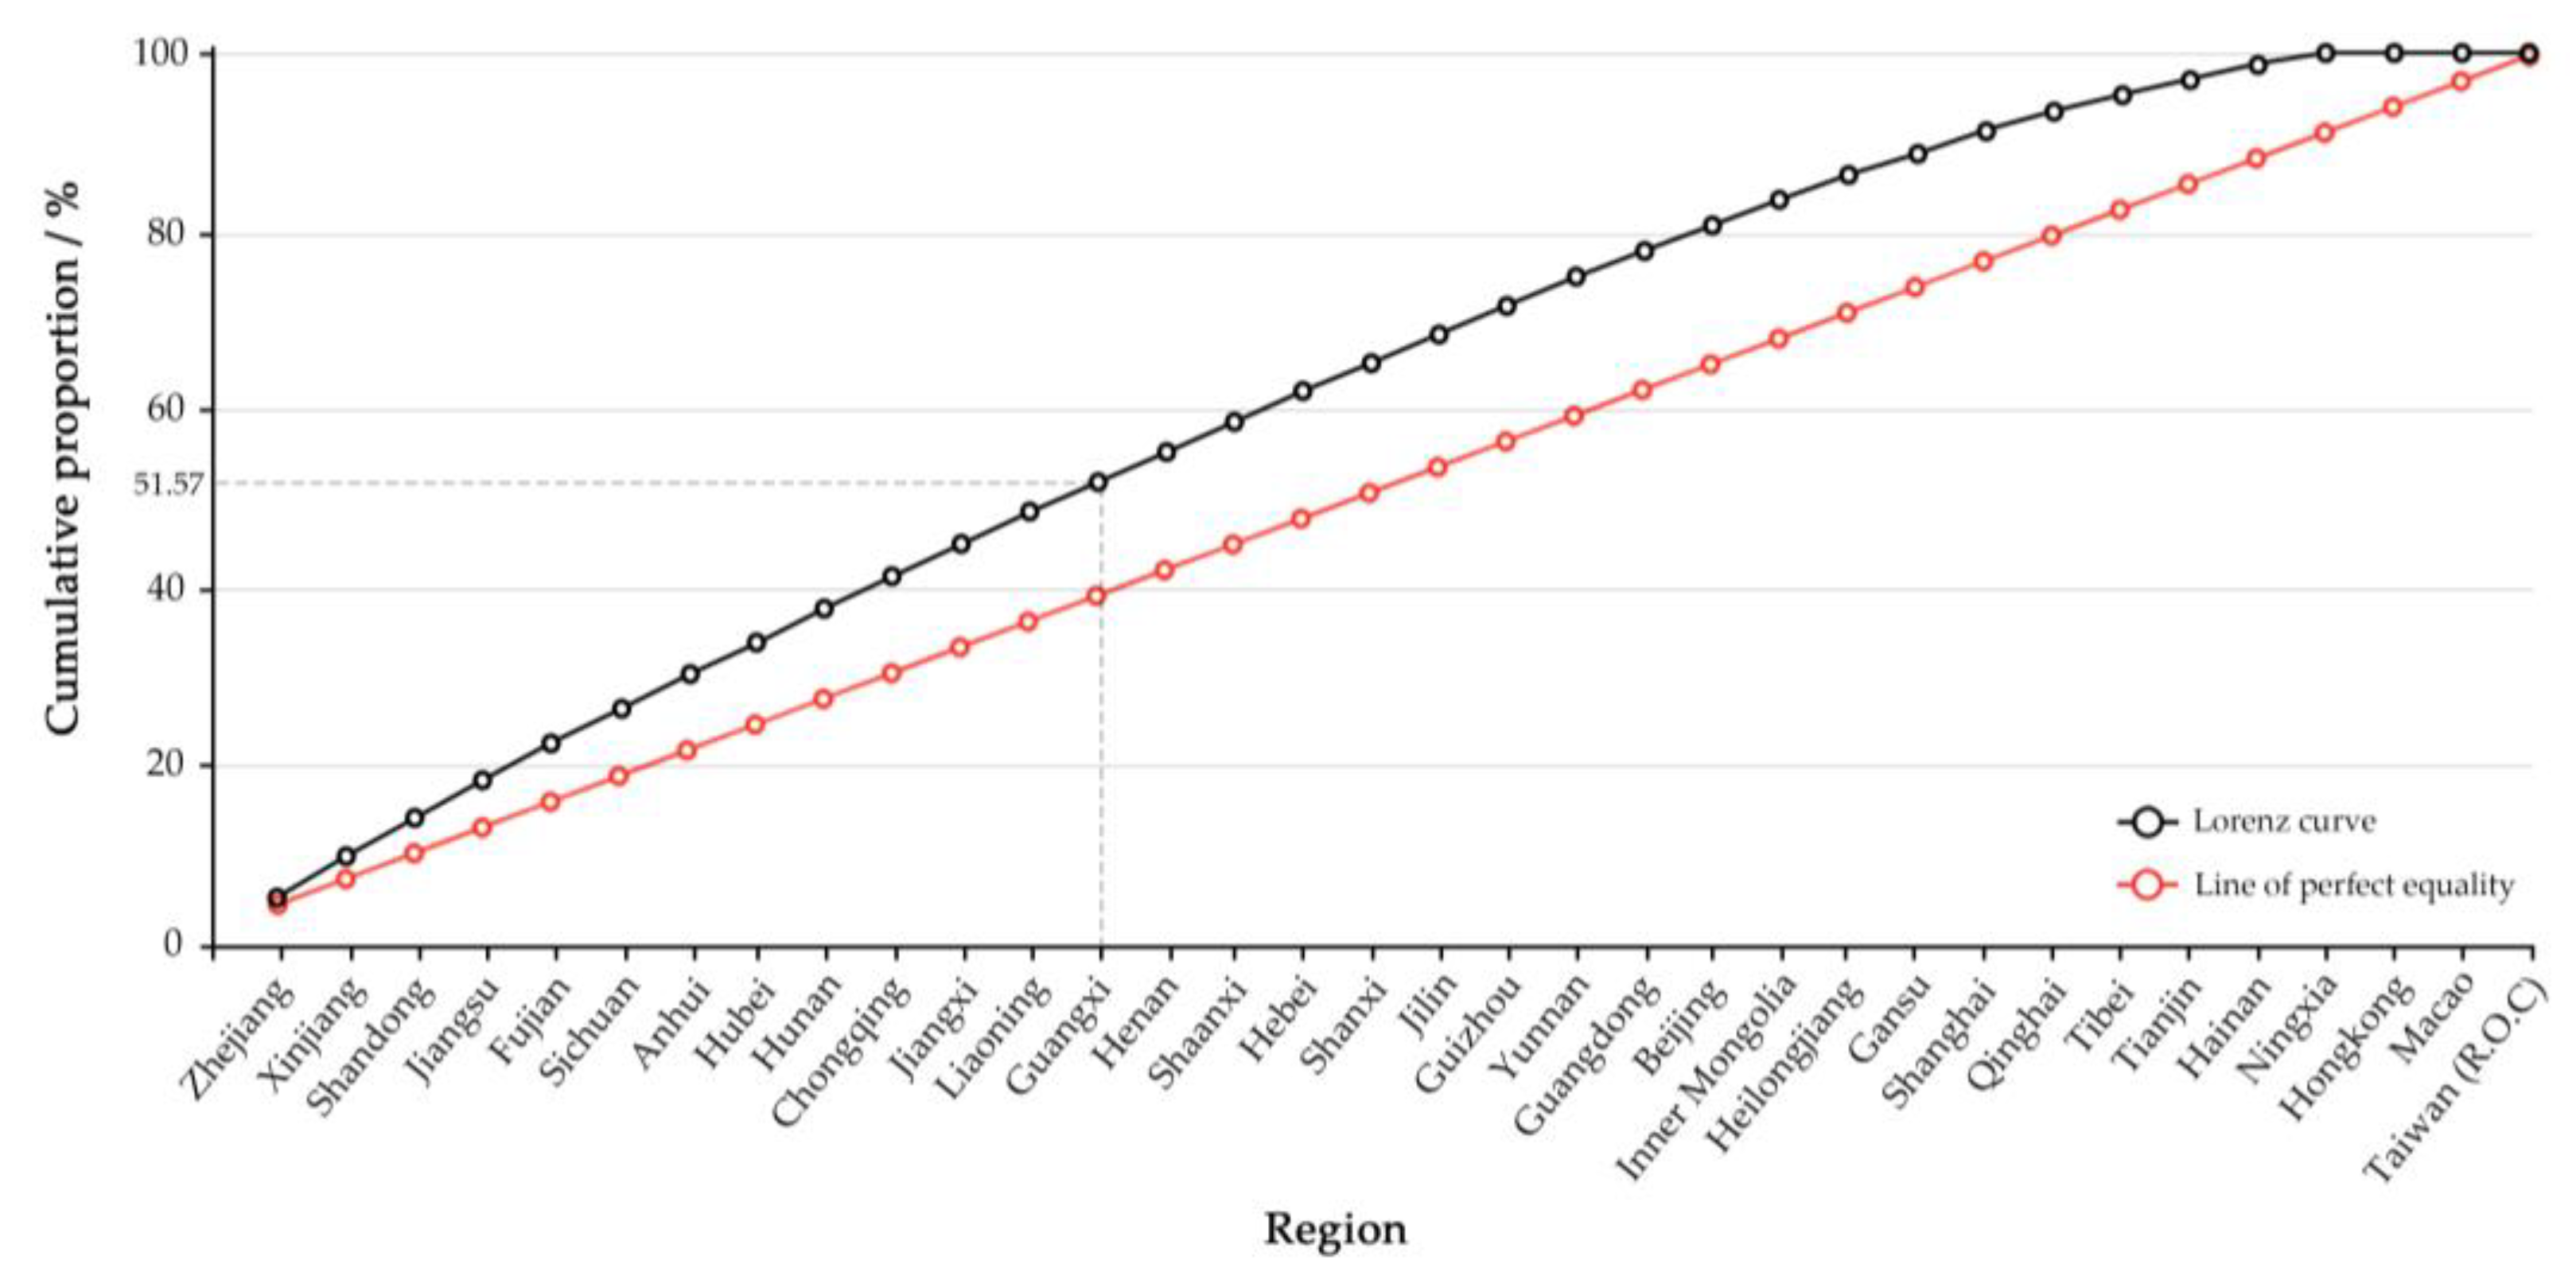
| No | Administrative Region | Amount | Proportion (%) | Cumulative Proportion (%) |
|---|---|---|---|---|
| 1 | Zhejiang | 72 | 4.90% | 4.90% |
| 2 | Xinjiang | 68 | 4.63% | 9.53% |
| 3 | Shandong | 64 | 4.35% | 13.88% |
| 4 | Jiangsu | 62 | 4.22% | 18.10% |
| 5 | Fujian | 62 | 4.22% | 22.31% |
| 6 | Sichuan | 57 | 3.88% | 26.19% |
| 7 | Anhui | 55 | 3.74% | 29.93% |
| 8 | Hubei | 54 | 3.67% | 33.61% |
| 9 | Hunan | 54 | 3.67% | 37.28% |
| 10 | Chongqing | 54 | 3.67% | 40.95% |
| 11 | Jiangxi | 53 | 3.61% | 44.56% |
| 12 | Liaoning | 52 | 3.54% | 48.10% |
| 13 | Guangxi | 51 | 3.47% | 51.57% |
| 14 | Henan | 50 | 3.40% | 54.97% |
| 15 | Shaanxi | 50 | 3.40% | 58.37% |
| 16 | Hebei | 48 | 3.27% | 61.63% |
| 17 | Shanxi | 48 | 3.27% | 64.90% |
| 18 | Jilin | 47 | 3.20% | 68.10% |
| 19 | Guizhou | 47 | 3.20% | 71.29% |
| 20 | Yunnan | 47 | 3.20% | 74.49% |
| 21 | Guangdong | 43 | 2.93% | 77.42% |
| 22 | Beijing | 42 | 2.86% | 80.27% |
| 23 | Inner Mongolia | 42 | 2.86% | 83.13% |
| 24 | Heilongjiang | 41 | 2.79% | 85.92% |
| 25 | Gansu | 37 | 2.52% | 88.44% |
| 26 | Shanghai | 35 | 2.38% | 90.82% |
| 27 | Qinghai | 32 | 2.18% | 93.00% |
| 28 | Tibet | 28 | 1.90% | 94.90% |
| 29 | Tianjin | 27 | 1.84% | 96.74% |
| 30 | Hainan | 26 | 1.77% | 98.51% |
| 31 | Ningxia | 22 | 1.50% | 100.00% |
| 32 | Hongkong | 0 | 0.00% | 100.00% |
| 33 | Macao | 0 | 0.00% | 100.00% |
| 34 | Taiwan (the Republic of China) | 0 | 0.00% | 100.00% |
| Total | 1470 | 100.00% | 100.00% |
| Density Classification | Administrative Region | Amount | Kernel Density Zone |
|---|---|---|---|
| Core density | * Beijing | 42 | 10.09–17.98 |
| * Tianjin | 27 | 10.09–17.98 | |
| Hebei | 48 | 5.36–10.09 | |
| * Shanghai | 35 | 10.09–17.98 | |
| * Zhejiang | 72 | 10.09–17.98 | |
| * Jiangsu | 62 | 10.09–17.98 | |
| Anhui | 55 | 5.36–10.09 | |
| High density | * Chongqing | 54 | 5.36–10.09 |
| Sichuan | 57 | 5.36–10.09 | |
| * Henan | 50 | 5.36–10.09 | |
| Shanxi | 48 | 5.36–10.09 | |
| * Hunan | 54 | 5.36–10.09 | |
| Jiangxi | 53 | 2.89–5.36 | |
| Hubei | 54 | 2.89–5.36 | |
| * Qinghai | 32 | 5.36–10.09 | |
| Gansu | 37 | 1.06–2.89 | |
| * Fujian | 62 | 5.36–10.09 | |
| Guangdong | 43 | 2.89–5.36 | |
| * Liaoning | 52 | 2.89–5.36 | |
| * Hainan | 26 | 5.36–10.09 | |
| Medium density | Shandong | 64 | 2.89–5.36 |
| Shaanxi | 50 | 2.89–5.36 | |
| Jilin | 47 | 2.89–5.36 | |
| Heilongjiang | 41 | 1.06–2.89 | |
| Guizhou | 47 | 2.89–5.36 | |
| Yunnan | 47 | 1.06–2.89 | |
| Guangxi | 51 | 2.89–5.36 | |
| Ningxia | 22 | 2.89–5.36 | |
| Xinjiang | 68 | 2.89–5.37 | |
| Low density | Inner Mongolia | 42 | 1.06–2.89 |
| Tibet | 28 | 1.06–2.89 |
| No | Administrative Division | Amount | Proportion (%) | Cumulative Proportion (%) |
|---|---|---|---|---|
| 1 | East (Shanghai, Jiangsu, Zhejiang, Anhui, Jiangxi, Shandong, Fujian, Taiwan (R.O.C.)) | 403 | 27.41% | 27.41% |
| 2 | Southwest (Chongqing, Sichuan, Guizhou, Yunnan, Tibet) | 233 | 15.85% | 43.27% |
| 3 | Northwest (Shaanxi, Gansu, Qinghai, Ningxia, Xinjiang) | 209 | 14.22% | 57.48% |
| 4 | North (Beijing, Tianjin, Shanxi, Hebei, Inner Mongolia) | 207 | 14.08% | 71.56% |
| 5 | Central (Henan, Hubei, Hunan) | 158 | 10.75% | 82.31% |
| 6 | Northeast (Heilongjiang, Jilin, Liaoning) | 140 | 9.52% | 91.84% |
| 7 | South (Guangdong, Guangxi, Hainan, Hong Kong, Macao) | 120 | 8.16% | 100.00% |
| Total | 1470 | 100.00% | 100.00% |
| Factor | Metric | Coefficient | The Number of Rural Villages | Characteristic Residential Village | Characteristic Folk Custom Village | Modern New Village | Historical Ancient Village |
|---|---|---|---|---|---|---|---|
| Community economy | Per capita disposable income of the residents | Pearson correlation | 0.03 | 0.132 | −0.045 | −0.147 | 0.18 |
| Sig. (2-tailed) | 0.871 | 0.477 | 0.812 | 0.43 | 0.332 | ||
| GDP per capita | Pearson correlation | 0.077 | 0.171 | −0.026 | −0.179 | 0.206 | |
| Sig. (2-tailed) | 0.681 | 0.357 | 0.891 | 0.337 | 0.267 | ||
| Third industry value | Pearson correlation | 0.461 ** | 0.388 * | −0.076 | 0.024 | 0.302 | |
| Sig. (2-tailed) | 0.009 | 0.031 | 0.684 | 0.898 | 0.098 | ||
| Agricultural level | Agricultural output value | Pearson correlation | 0.563 ** | 0.365 * | 0.05 | 0.439 * | 0.078 |
| Sig. (2-tailed) | 0.001 | 0.043 | 0.791 | 0.013 | 0.677 | ||
| Farmland area | Pearson correlation | 0.214 | 0.029 | 0.125 | 0.466 ** | −0.287 | |
| Sig. (2-tailed) | 0.248 | 0.876 | 0.502 | 0.008 | 0.117 | ||
| Transportation | Passenger volume | Pearson correlation | 0.541 ** | 0.27 | −0.146 | 0.164 | 0.322 |
| Sig. (2-tailed) | 0.002 | 0.143 | 0.433 | 0.378 | 0.077 | ||
| Highway mileage | Pearson correlation | 0.552 ** | 0.319 | 0.06 | 0.452* | −0.046 | |
| Sig. (2-tailed) | 0.001 | 0.08 | 0.748 | 0.011 | 0.807 | ||
| Cultural resources | Number of intangible cultural heritage resources | Pearson correlation | 0.664 ** | 0.607 ** | 0.14 | 0.04 | 0.472 ** |
| Sig. (2-tailed) | 0 | 0 | 0.452 | 0.829 | 0.007 | ||
| Ethnic minority population | Pearson correlation | 0.17 | 0.119 | 0.360 * | −0.121 | −0.024 | |
| Sig. (2-tailed) | 0.361 | 0.525 | 0.047 | 0.516 | 0.899 | ||
| Tourism development | Number of domestic tourists | Pearson correlation | 0.669 ** | 0.483 ** | −0.153 | 0.234 | 0.469 ** |
| Sig. (2-tailed) | 0 | 0.006 | 0.411 | 0.204 | 0.008 | ||
| Number of A-level scenic spots | Pearson correlation | 0.769 ** | 0.663 ** | 0.124 | 0.271 | 0.264 | |
| Sig. (2-tailed) | 0 | 0 | 0.506 | 0.141 | 0.151 | ||
| Customer source market | Urban population | Pearson correlation | 0.429 * | 0.293 | −0.101 | 0.163 | 0.214 |
| Sig. (2-tailed) | 0.016 | 0.109 | 0.59 | 0.381 | 0.247 | ||
| Proportion of urban population at the end of the year | Pearson correlation | −0.016 | −0.01 | −0.079 | 0.103 | 0.046 | |
| Sig. (2-tailed) | 0.931 | 0.956 | 0.672 | 0.583 | 0.805 |
| River Level | Buffer (km) | Amount | Proportion (%) |
|---|---|---|---|
| Level 3 and above | 20 km | 444 | 30.20% |
| Level 4 | 10 km | 237 | 16.12% |
| Level 5 | 10 km | 429 | 29.18% |
| Total | 1110 | 75.50% |
| The Nearest Road Distance (m) | Amount | Proportion (%) |
|---|---|---|
| 1000 | 674 | 45.85% |
| 1000–2000 | 245 | 16.67% |
| 2000–3000 | 152 | 10.34% |
| 3000 | 399 | 27.14% |
| No | Function | Index |
|---|---|---|
| 1 | The nearest neighbor index | = 0.707211 |
| 2 | Kernel density estimation | 1.06–17.98 |
| 3 | Imbalance | = 0.226552 |
| 4 | Gini coefficient | G = 0.960127, C = 0.039873 |
Publisher’s Note: MDPI stays neutral with regard to jurisdictional claims in published maps and institutional affiliations. |
© 2022 by the authors. Licensee MDPI, Basel, Switzerland. This article is an open access article distributed under the terms and conditions of the Creative Commons Attribution (CC BY) license (https://creativecommons.org/licenses/by/4.0/).
Share and Cite
Xie, Y.; Meng, X.; Cenci, J.; Zhang, J. Spatial Pattern and Formation Mechanism of Rural Tourism Resources in China: Evidence from 1470 National Leisure Villages. ISPRS Int. J. Geo-Inf. 2022, 11, 455. https://doi.org/10.3390/ijgi11080455
Xie Y, Meng X, Cenci J, Zhang J. Spatial Pattern and Formation Mechanism of Rural Tourism Resources in China: Evidence from 1470 National Leisure Villages. ISPRS International Journal of Geo-Information. 2022; 11(8):455. https://doi.org/10.3390/ijgi11080455
Chicago/Turabian StyleXie, Yuchen, Xiangzhuang Meng, Jeremy Cenci, and Jiazhen Zhang. 2022. "Spatial Pattern and Formation Mechanism of Rural Tourism Resources in China: Evidence from 1470 National Leisure Villages" ISPRS International Journal of Geo-Information 11, no. 8: 455. https://doi.org/10.3390/ijgi11080455