
Spatiotemporal Evolution of the Urban Thermal Environment Effect and Its Influencing Factors: A Case Study of Beijing, China

 ,
,
Abstract
:1. Introduction
2. Materials and Methods
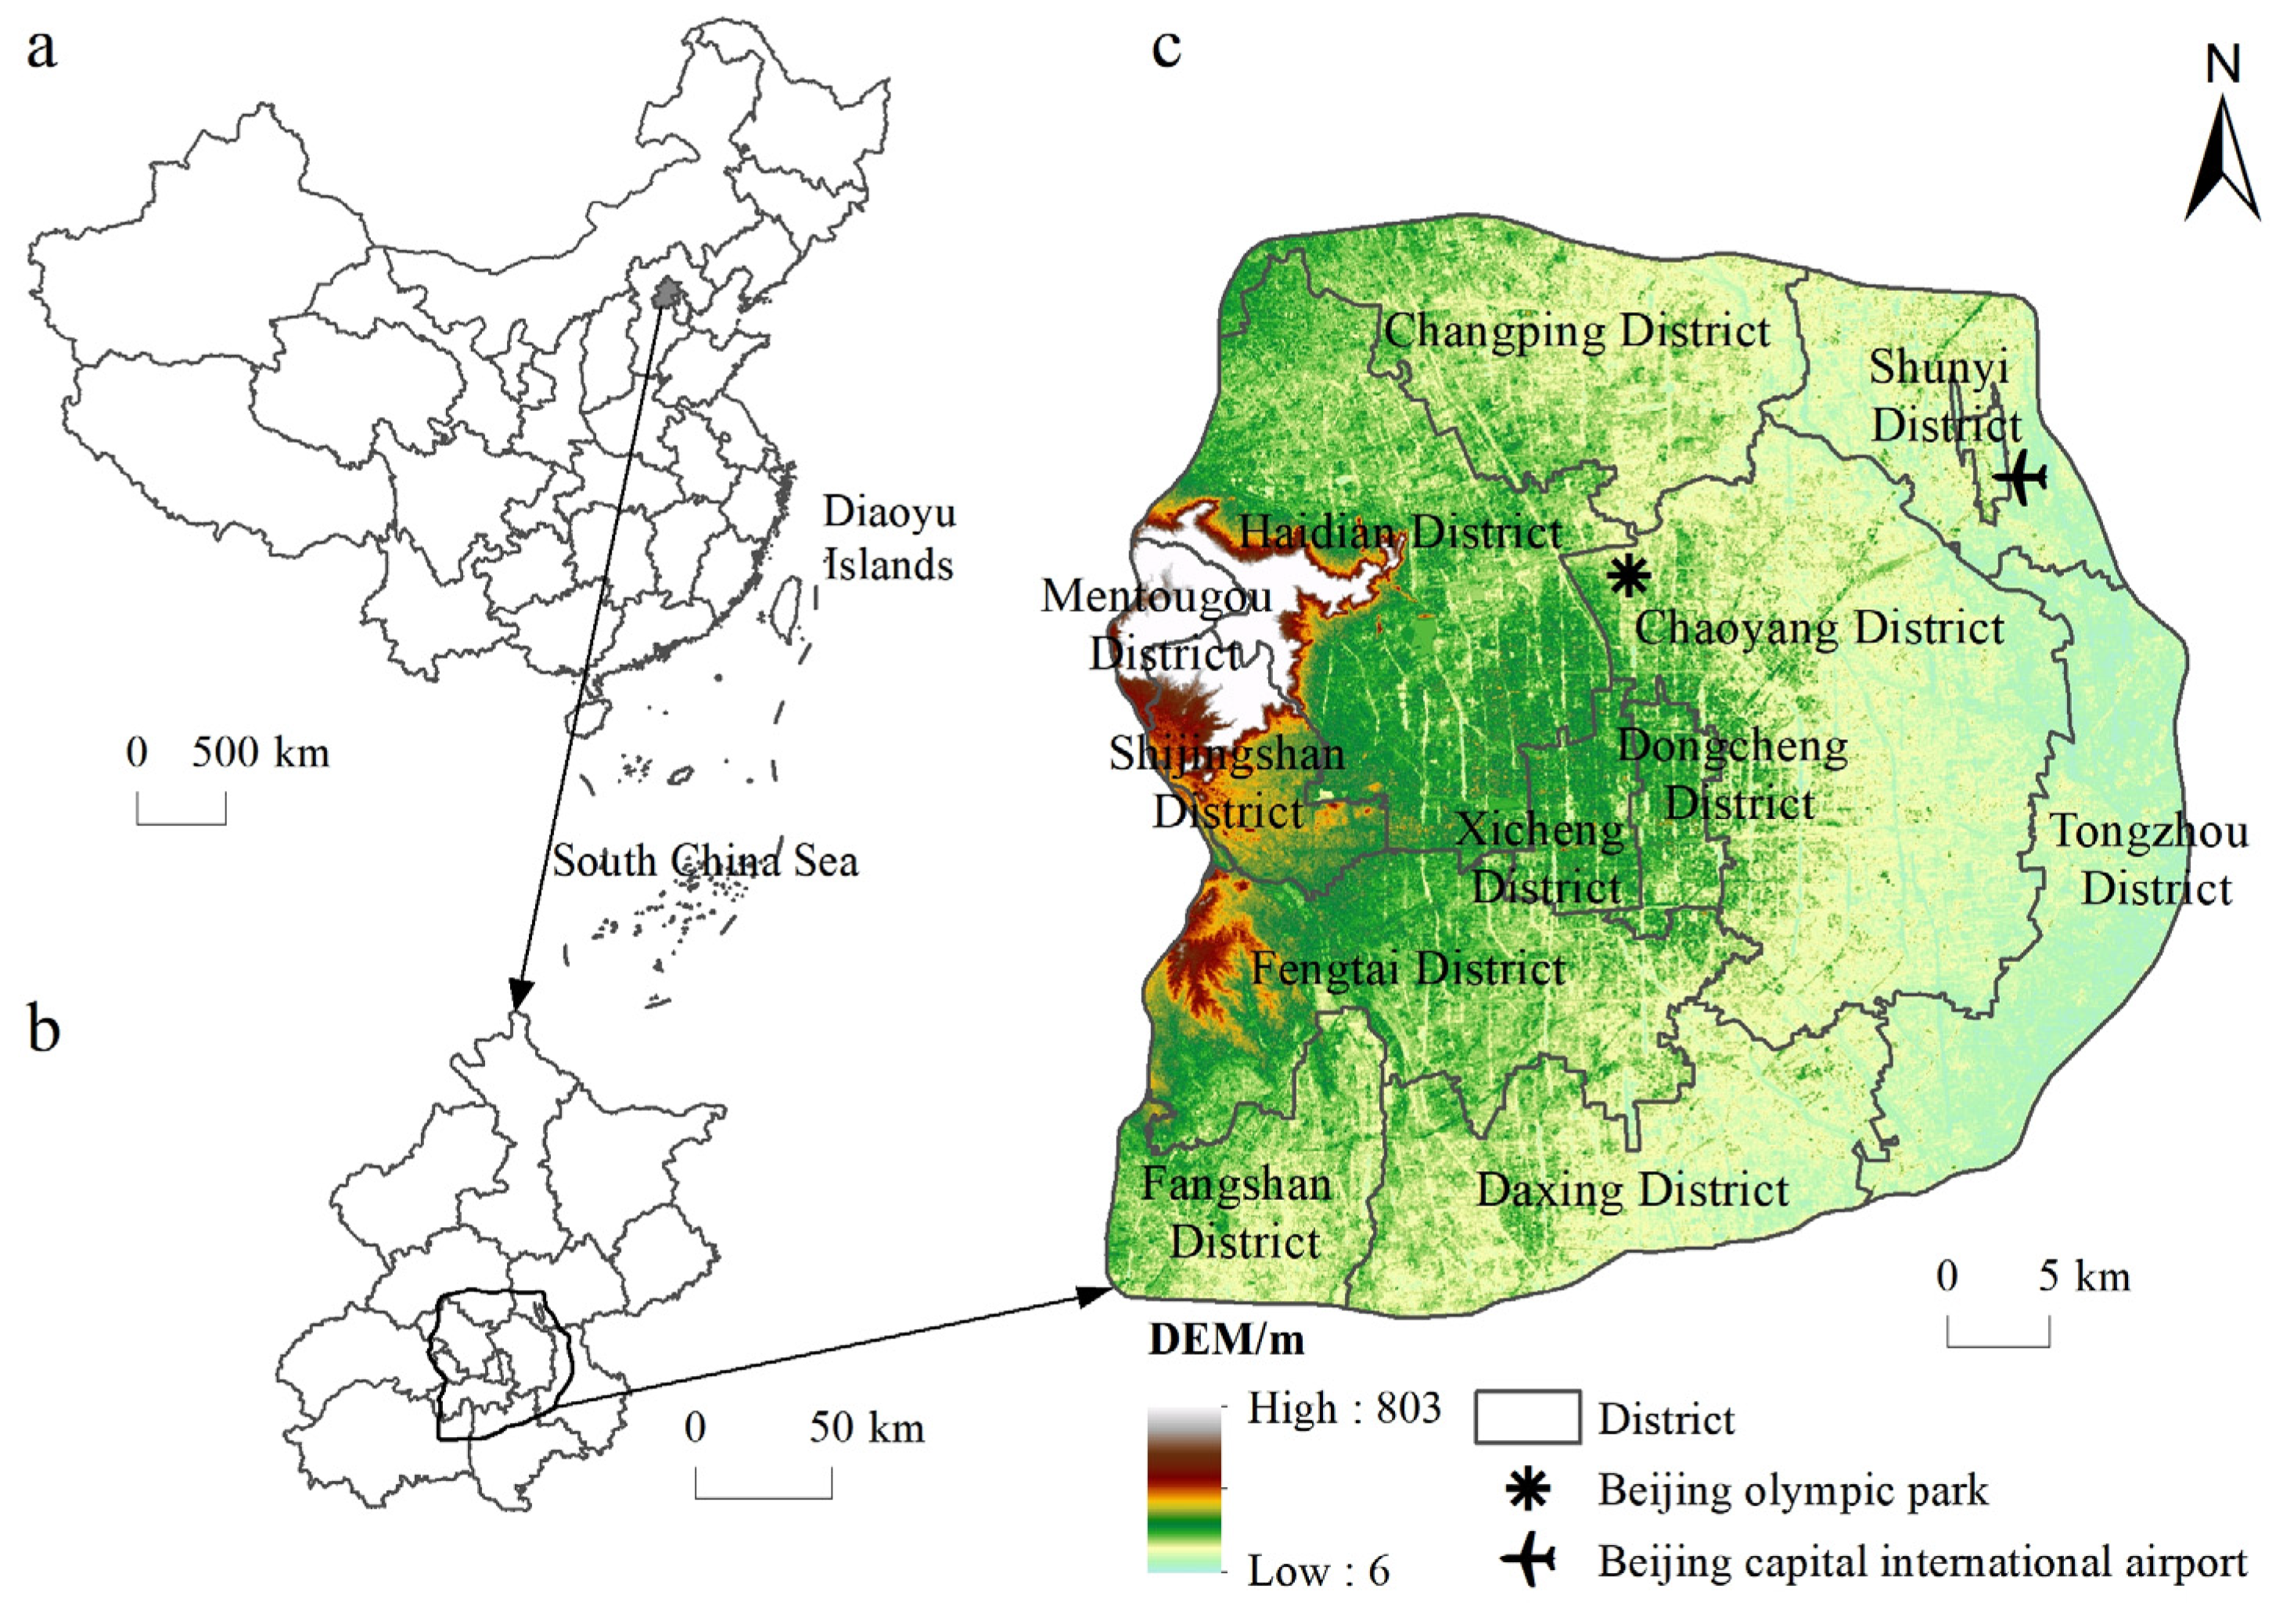
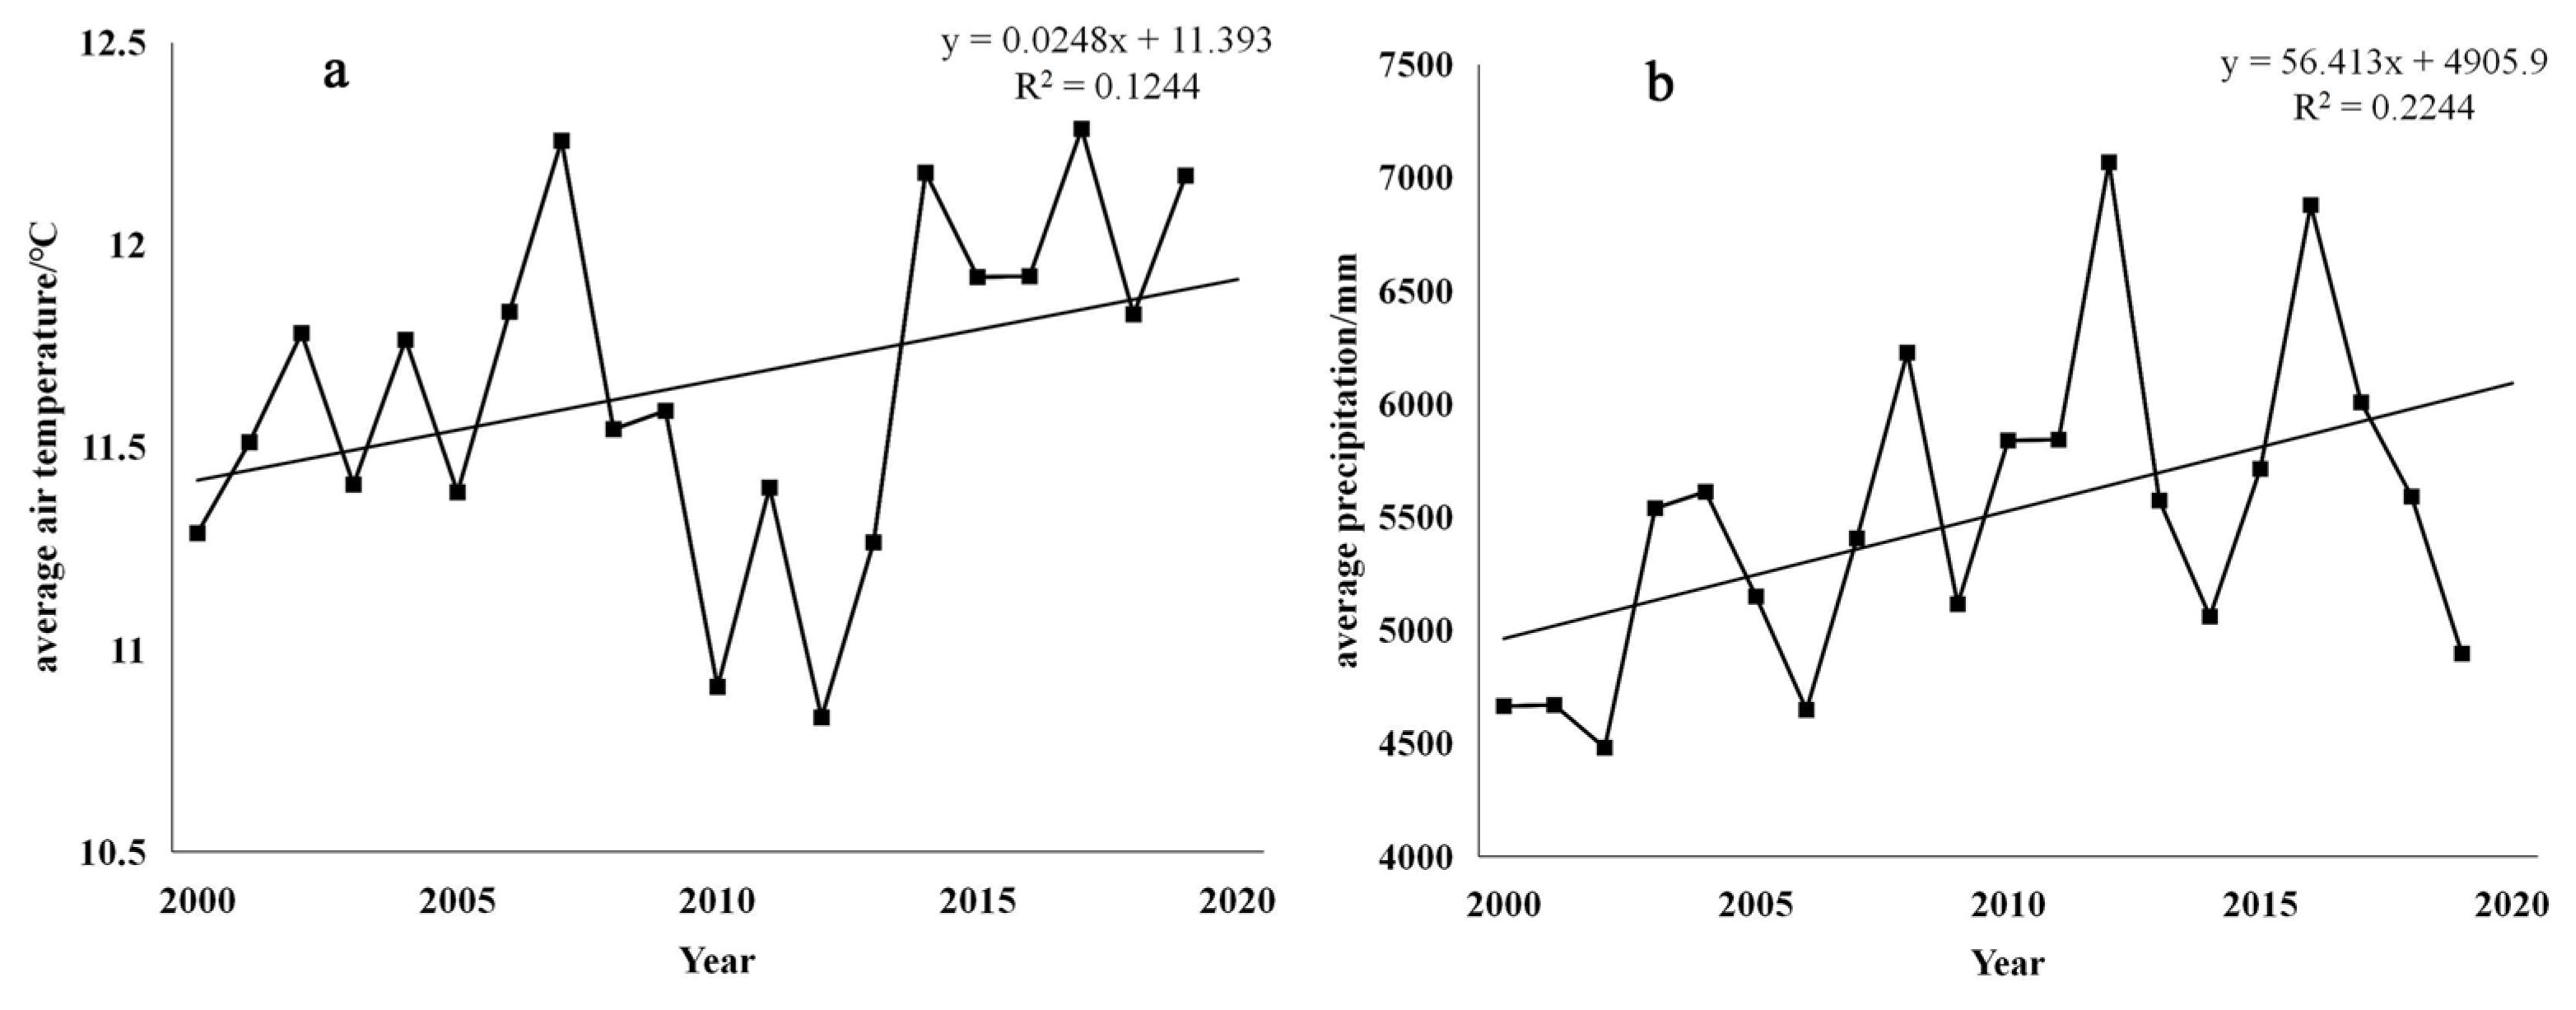
2.1. Study Area
2.2. Data Sources
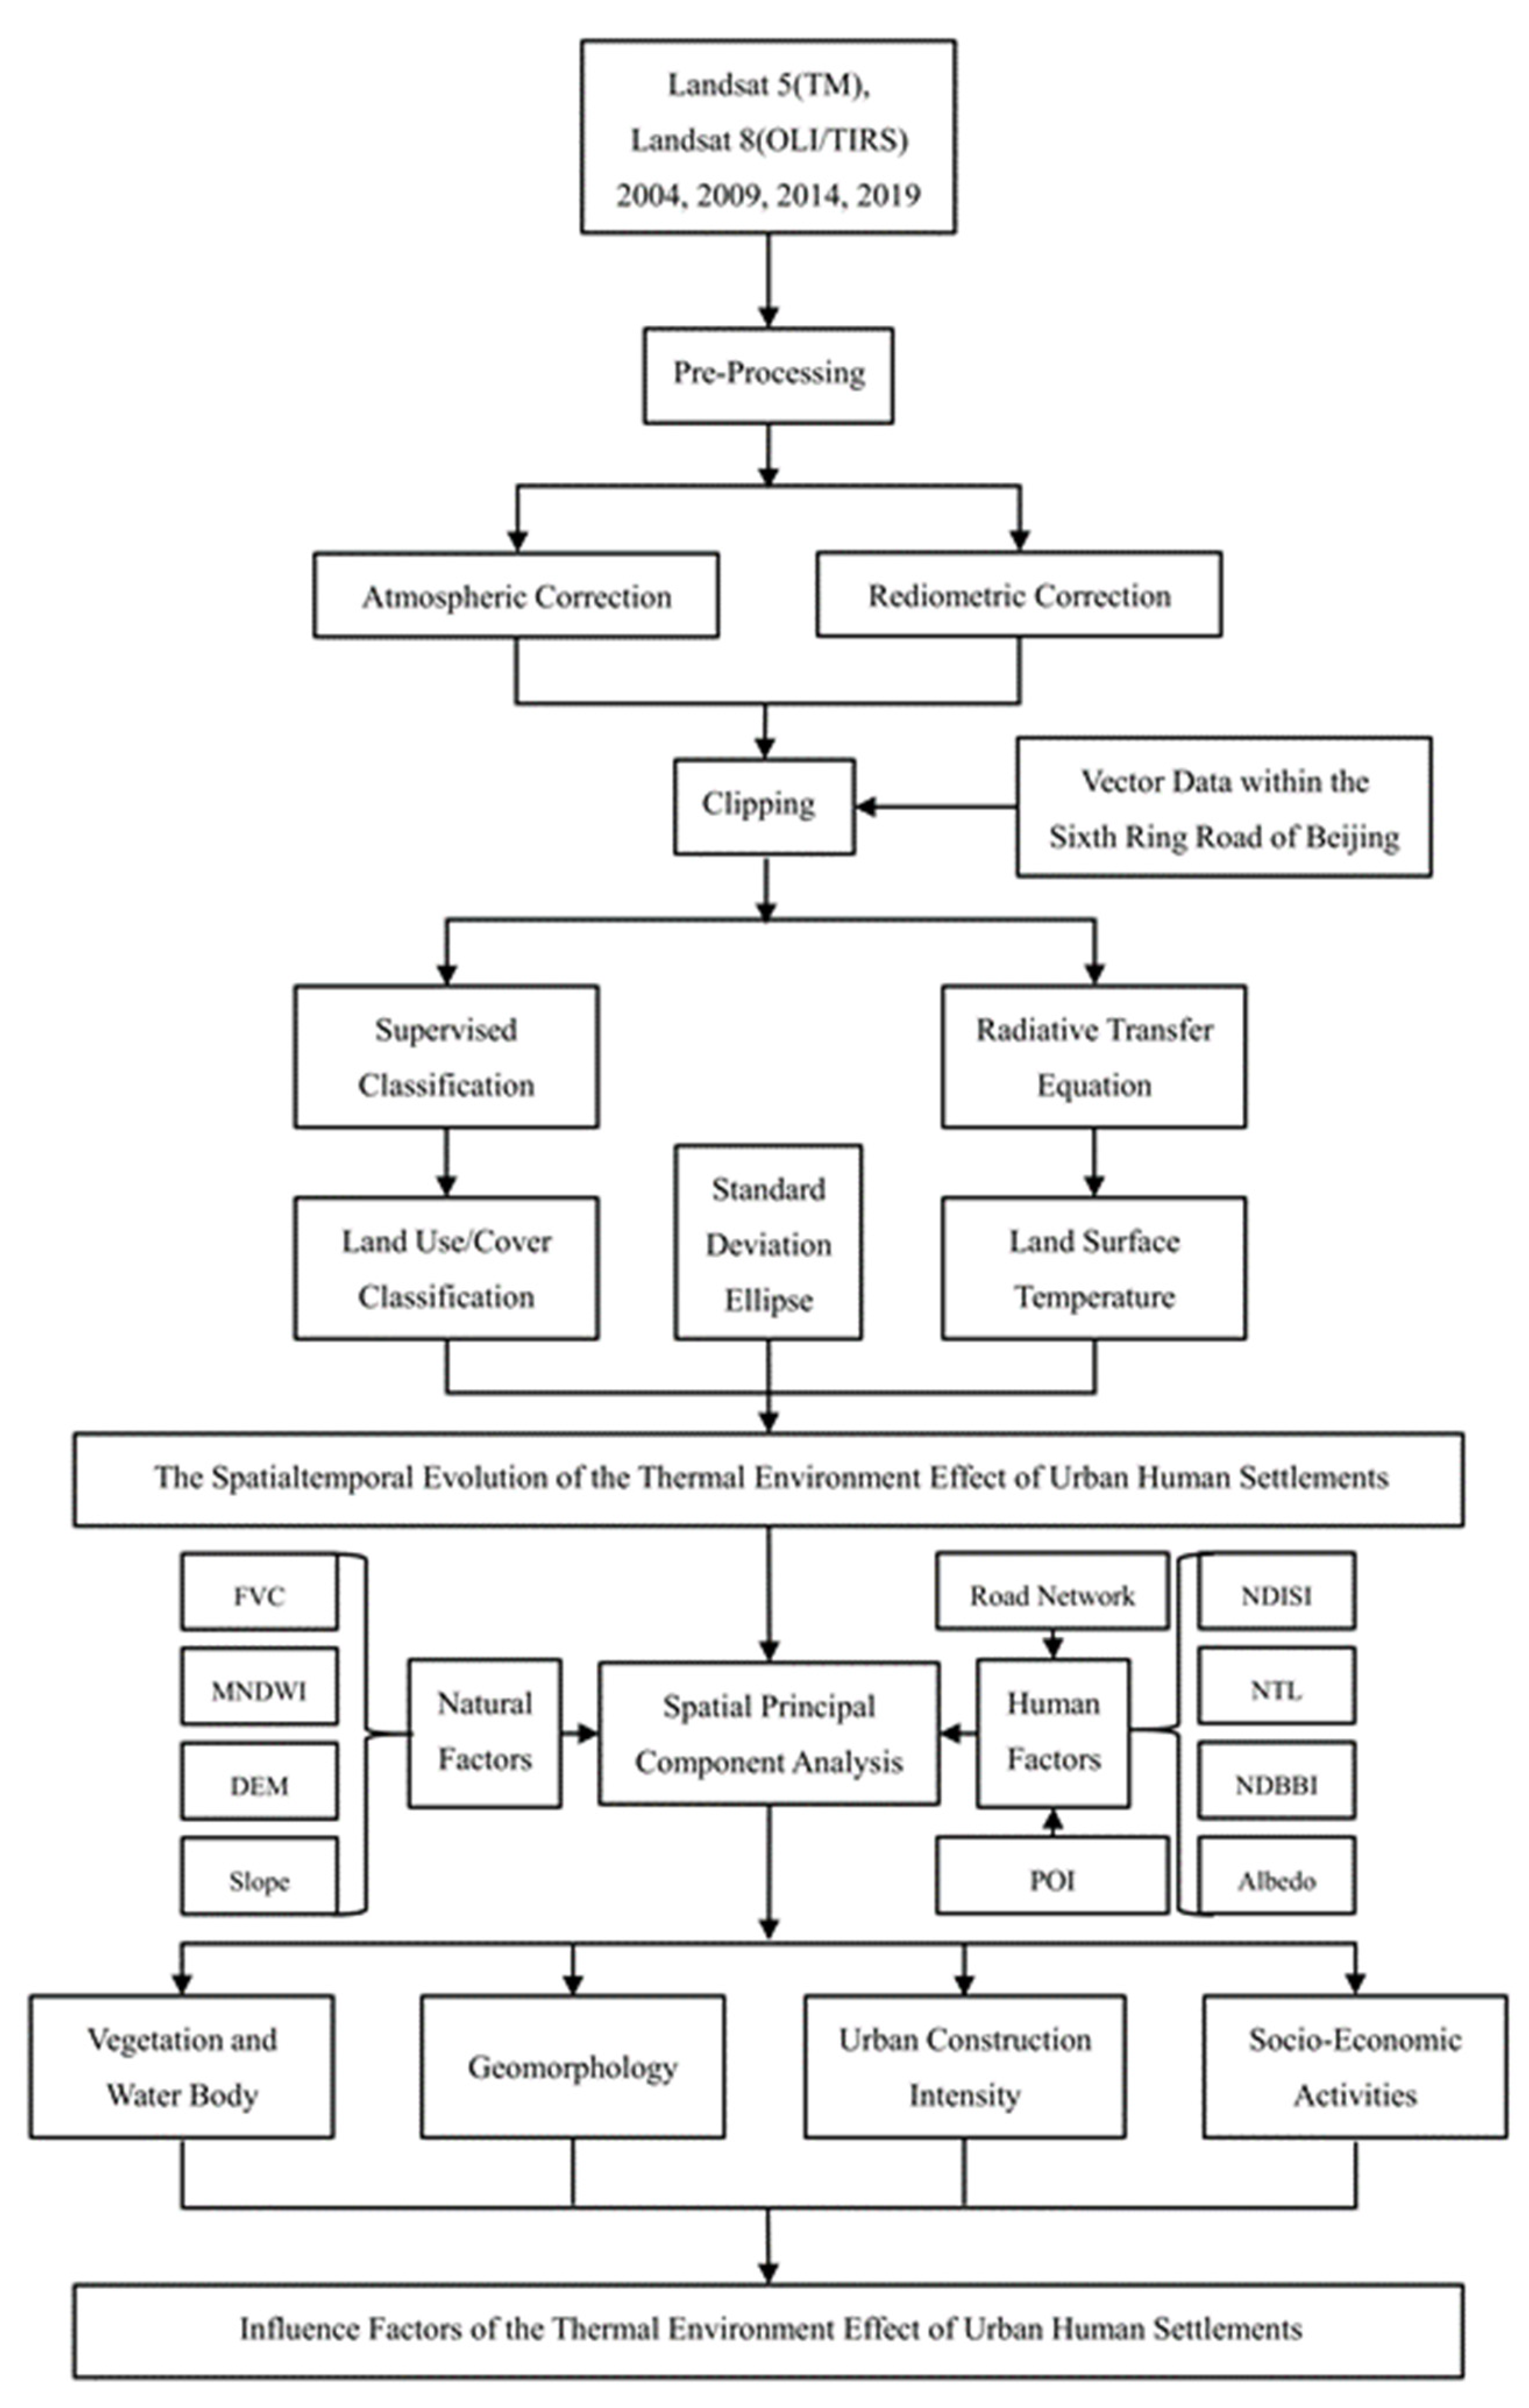
2.3. Methods
2.3.1. Retrieval of Surface Temperature
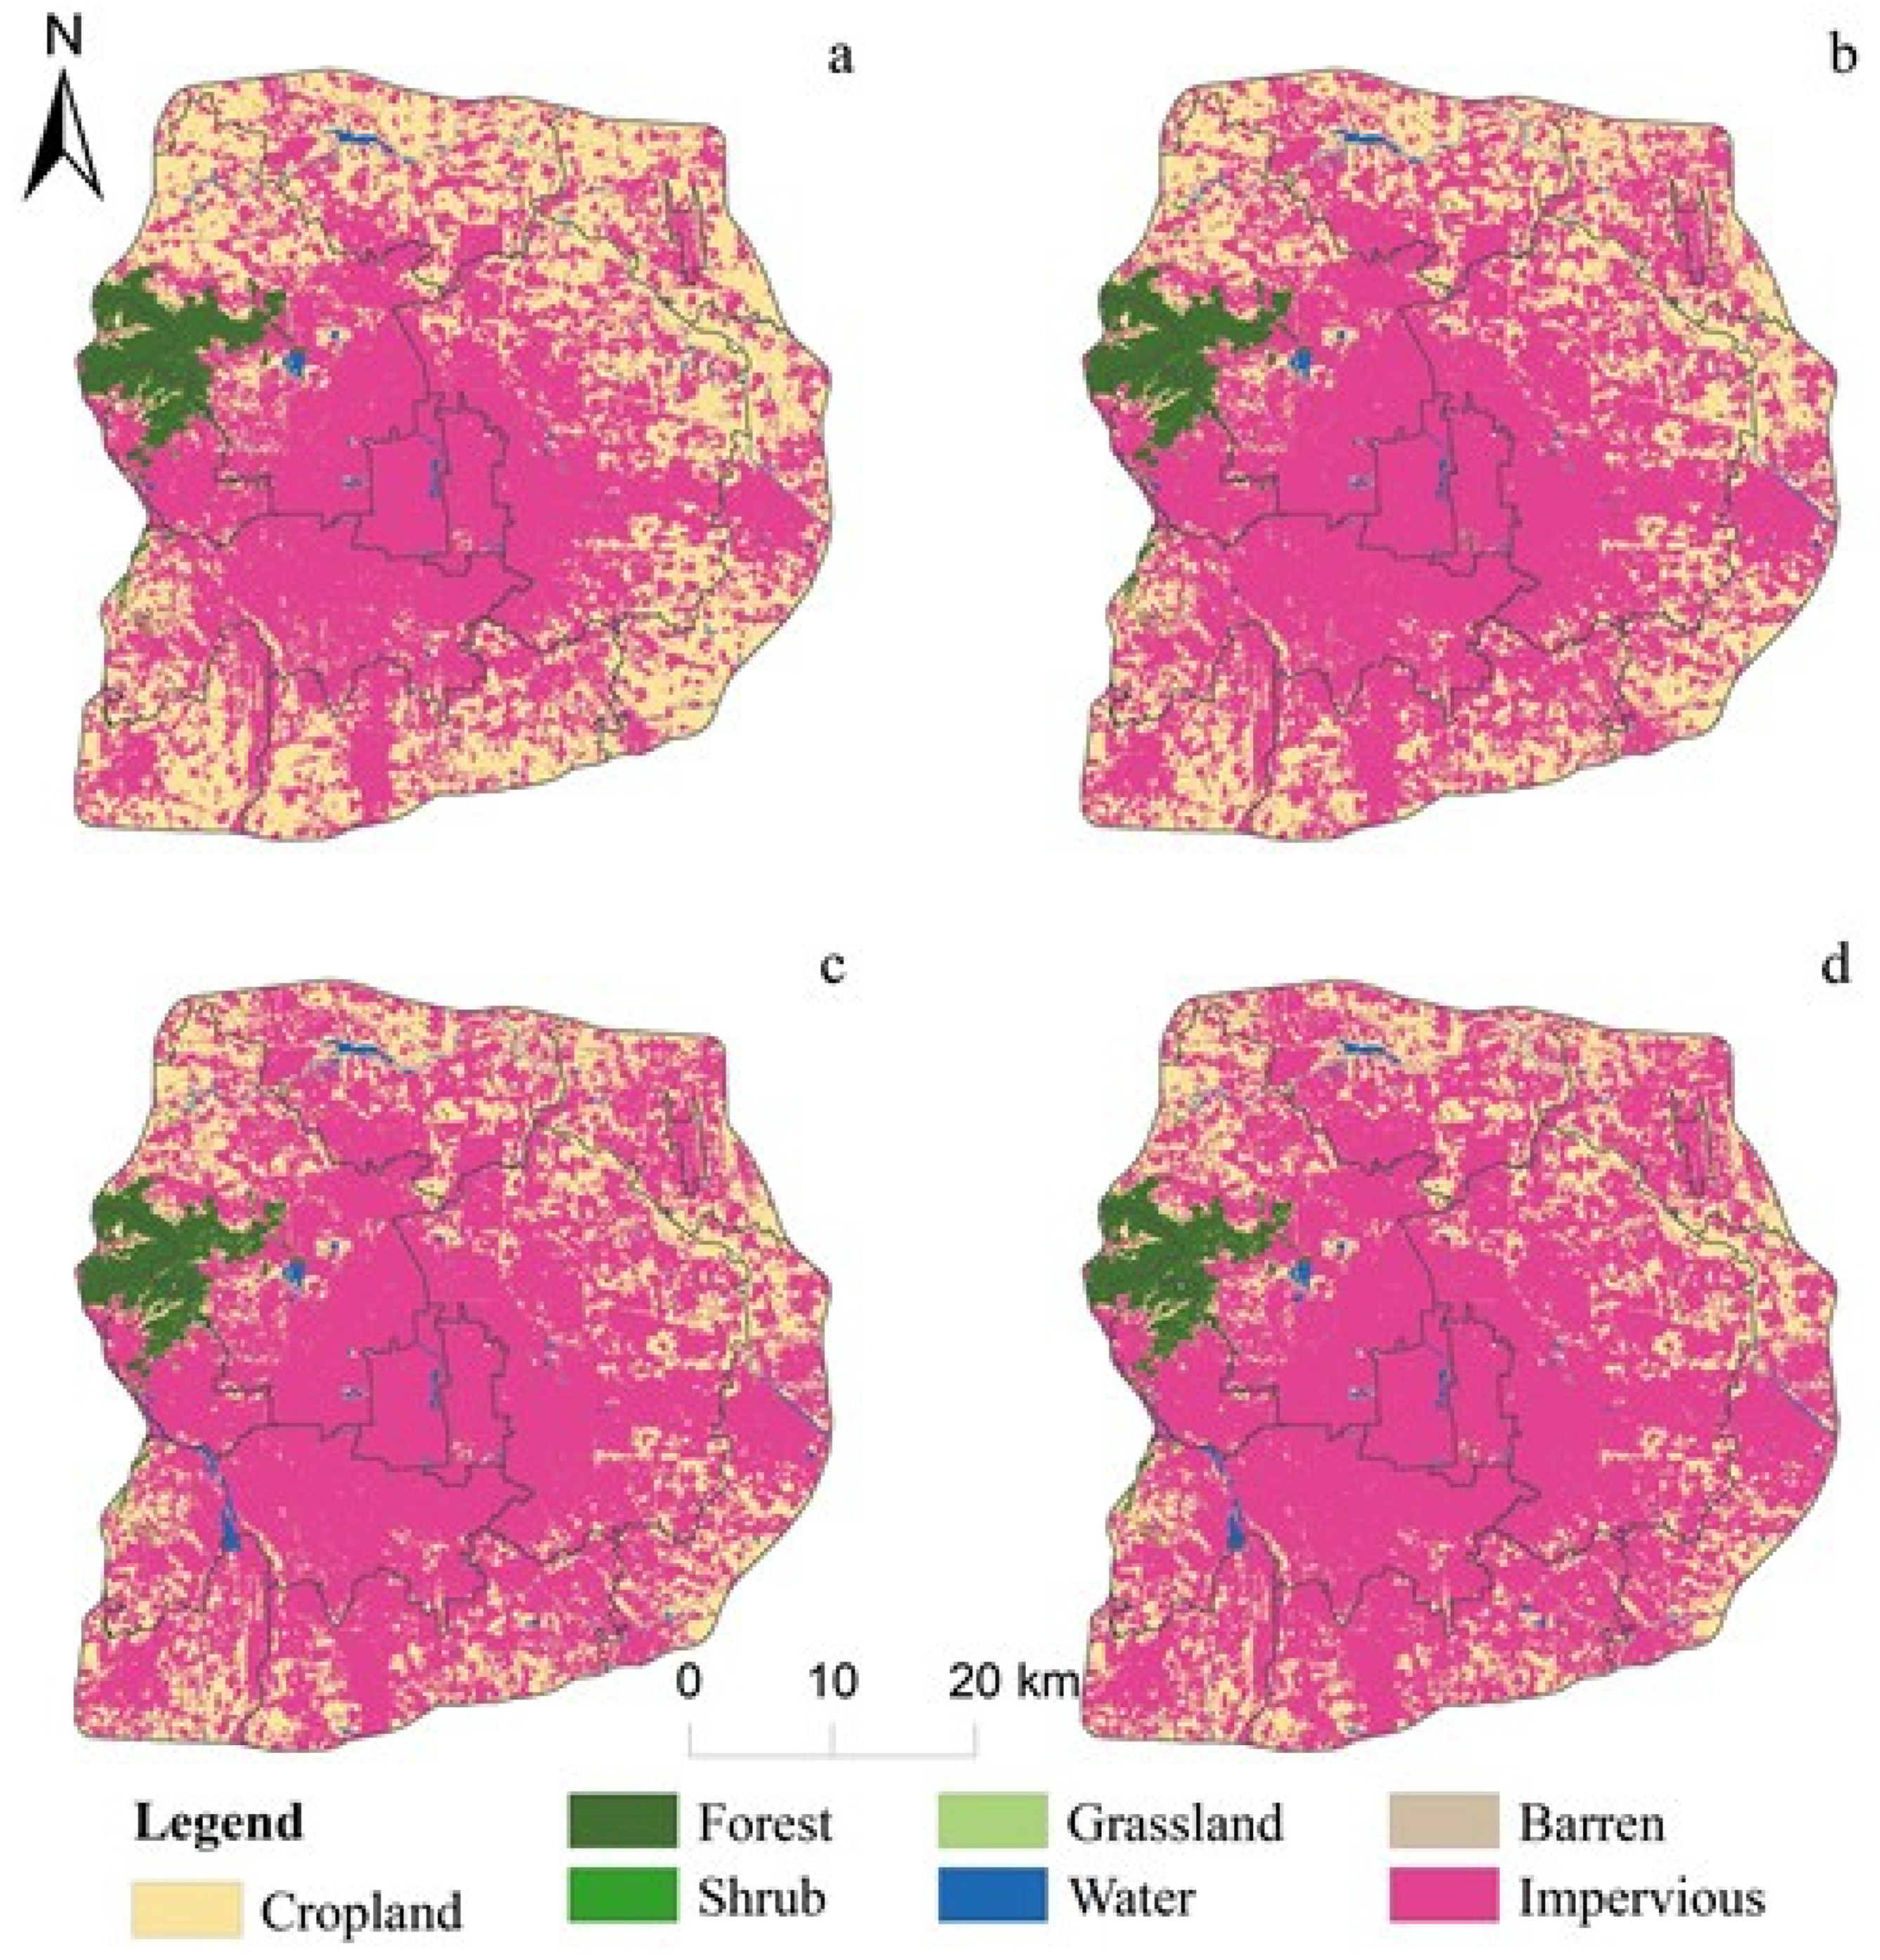
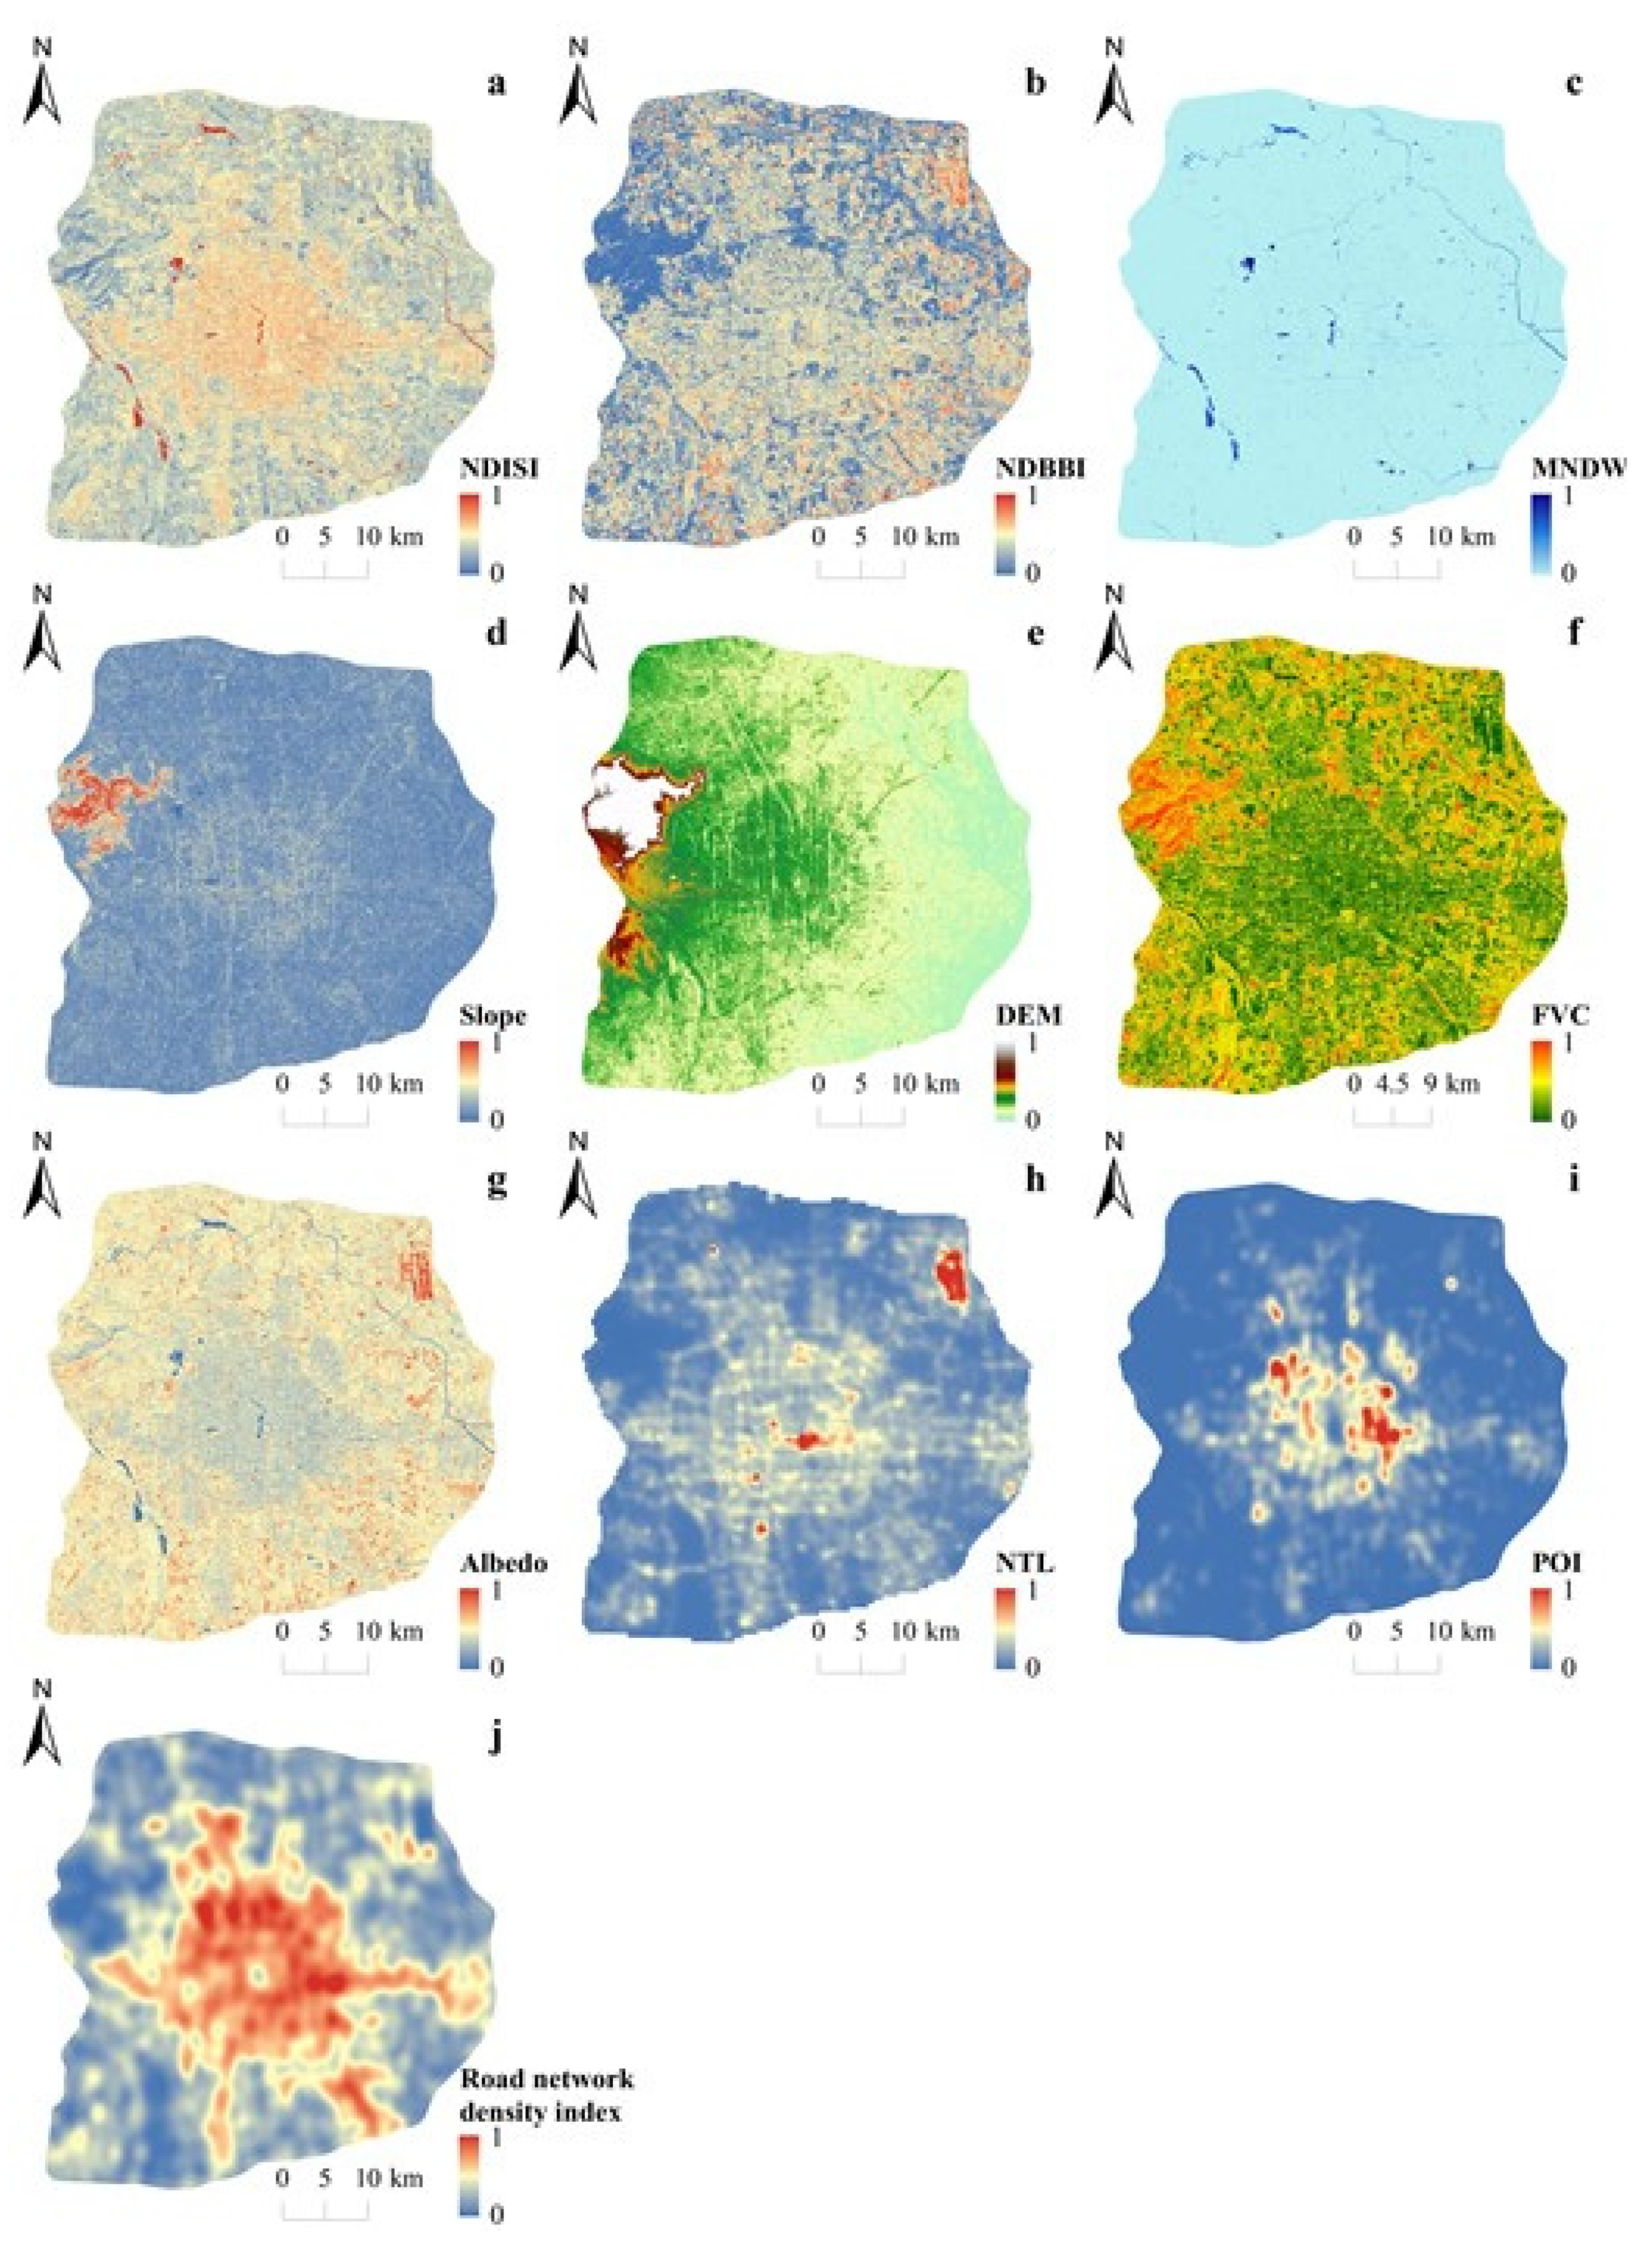
2.3.2. Acquisition of Surface Information
2.3.3. Spatial PCA
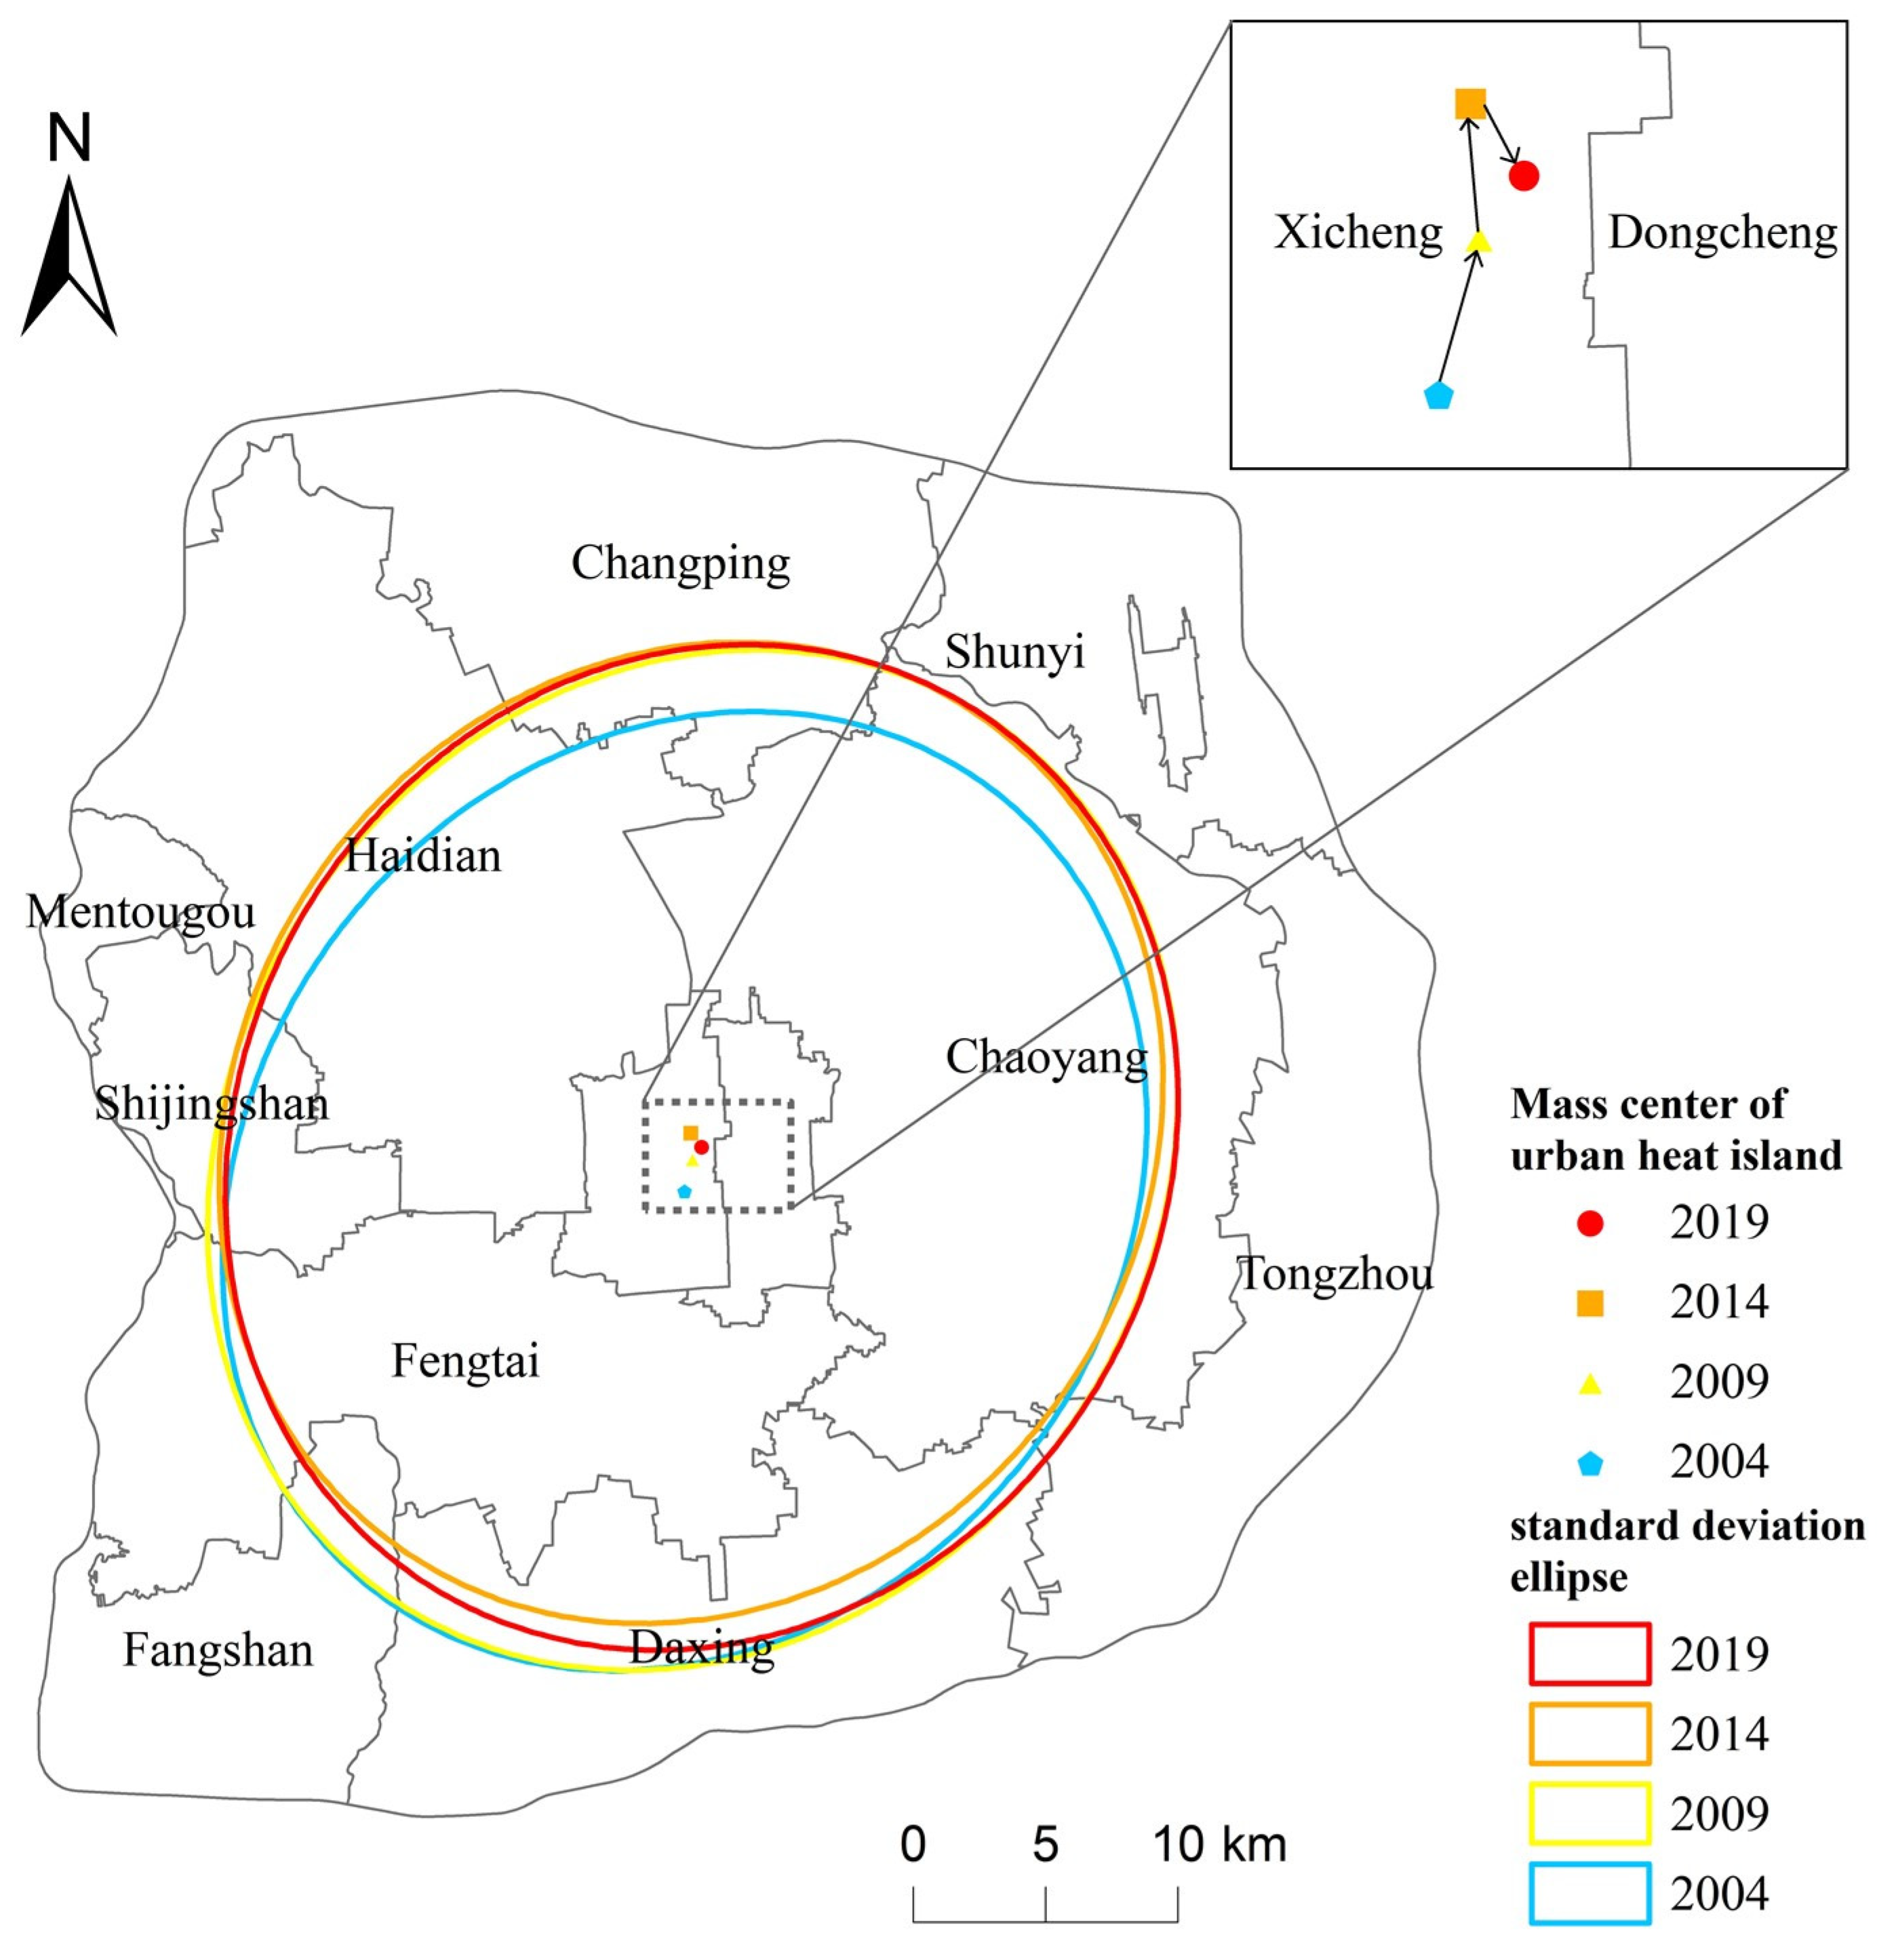
2.3.4. SDE
3. Results
3.1. Evolution of the Urban Thermal Environmental Effect
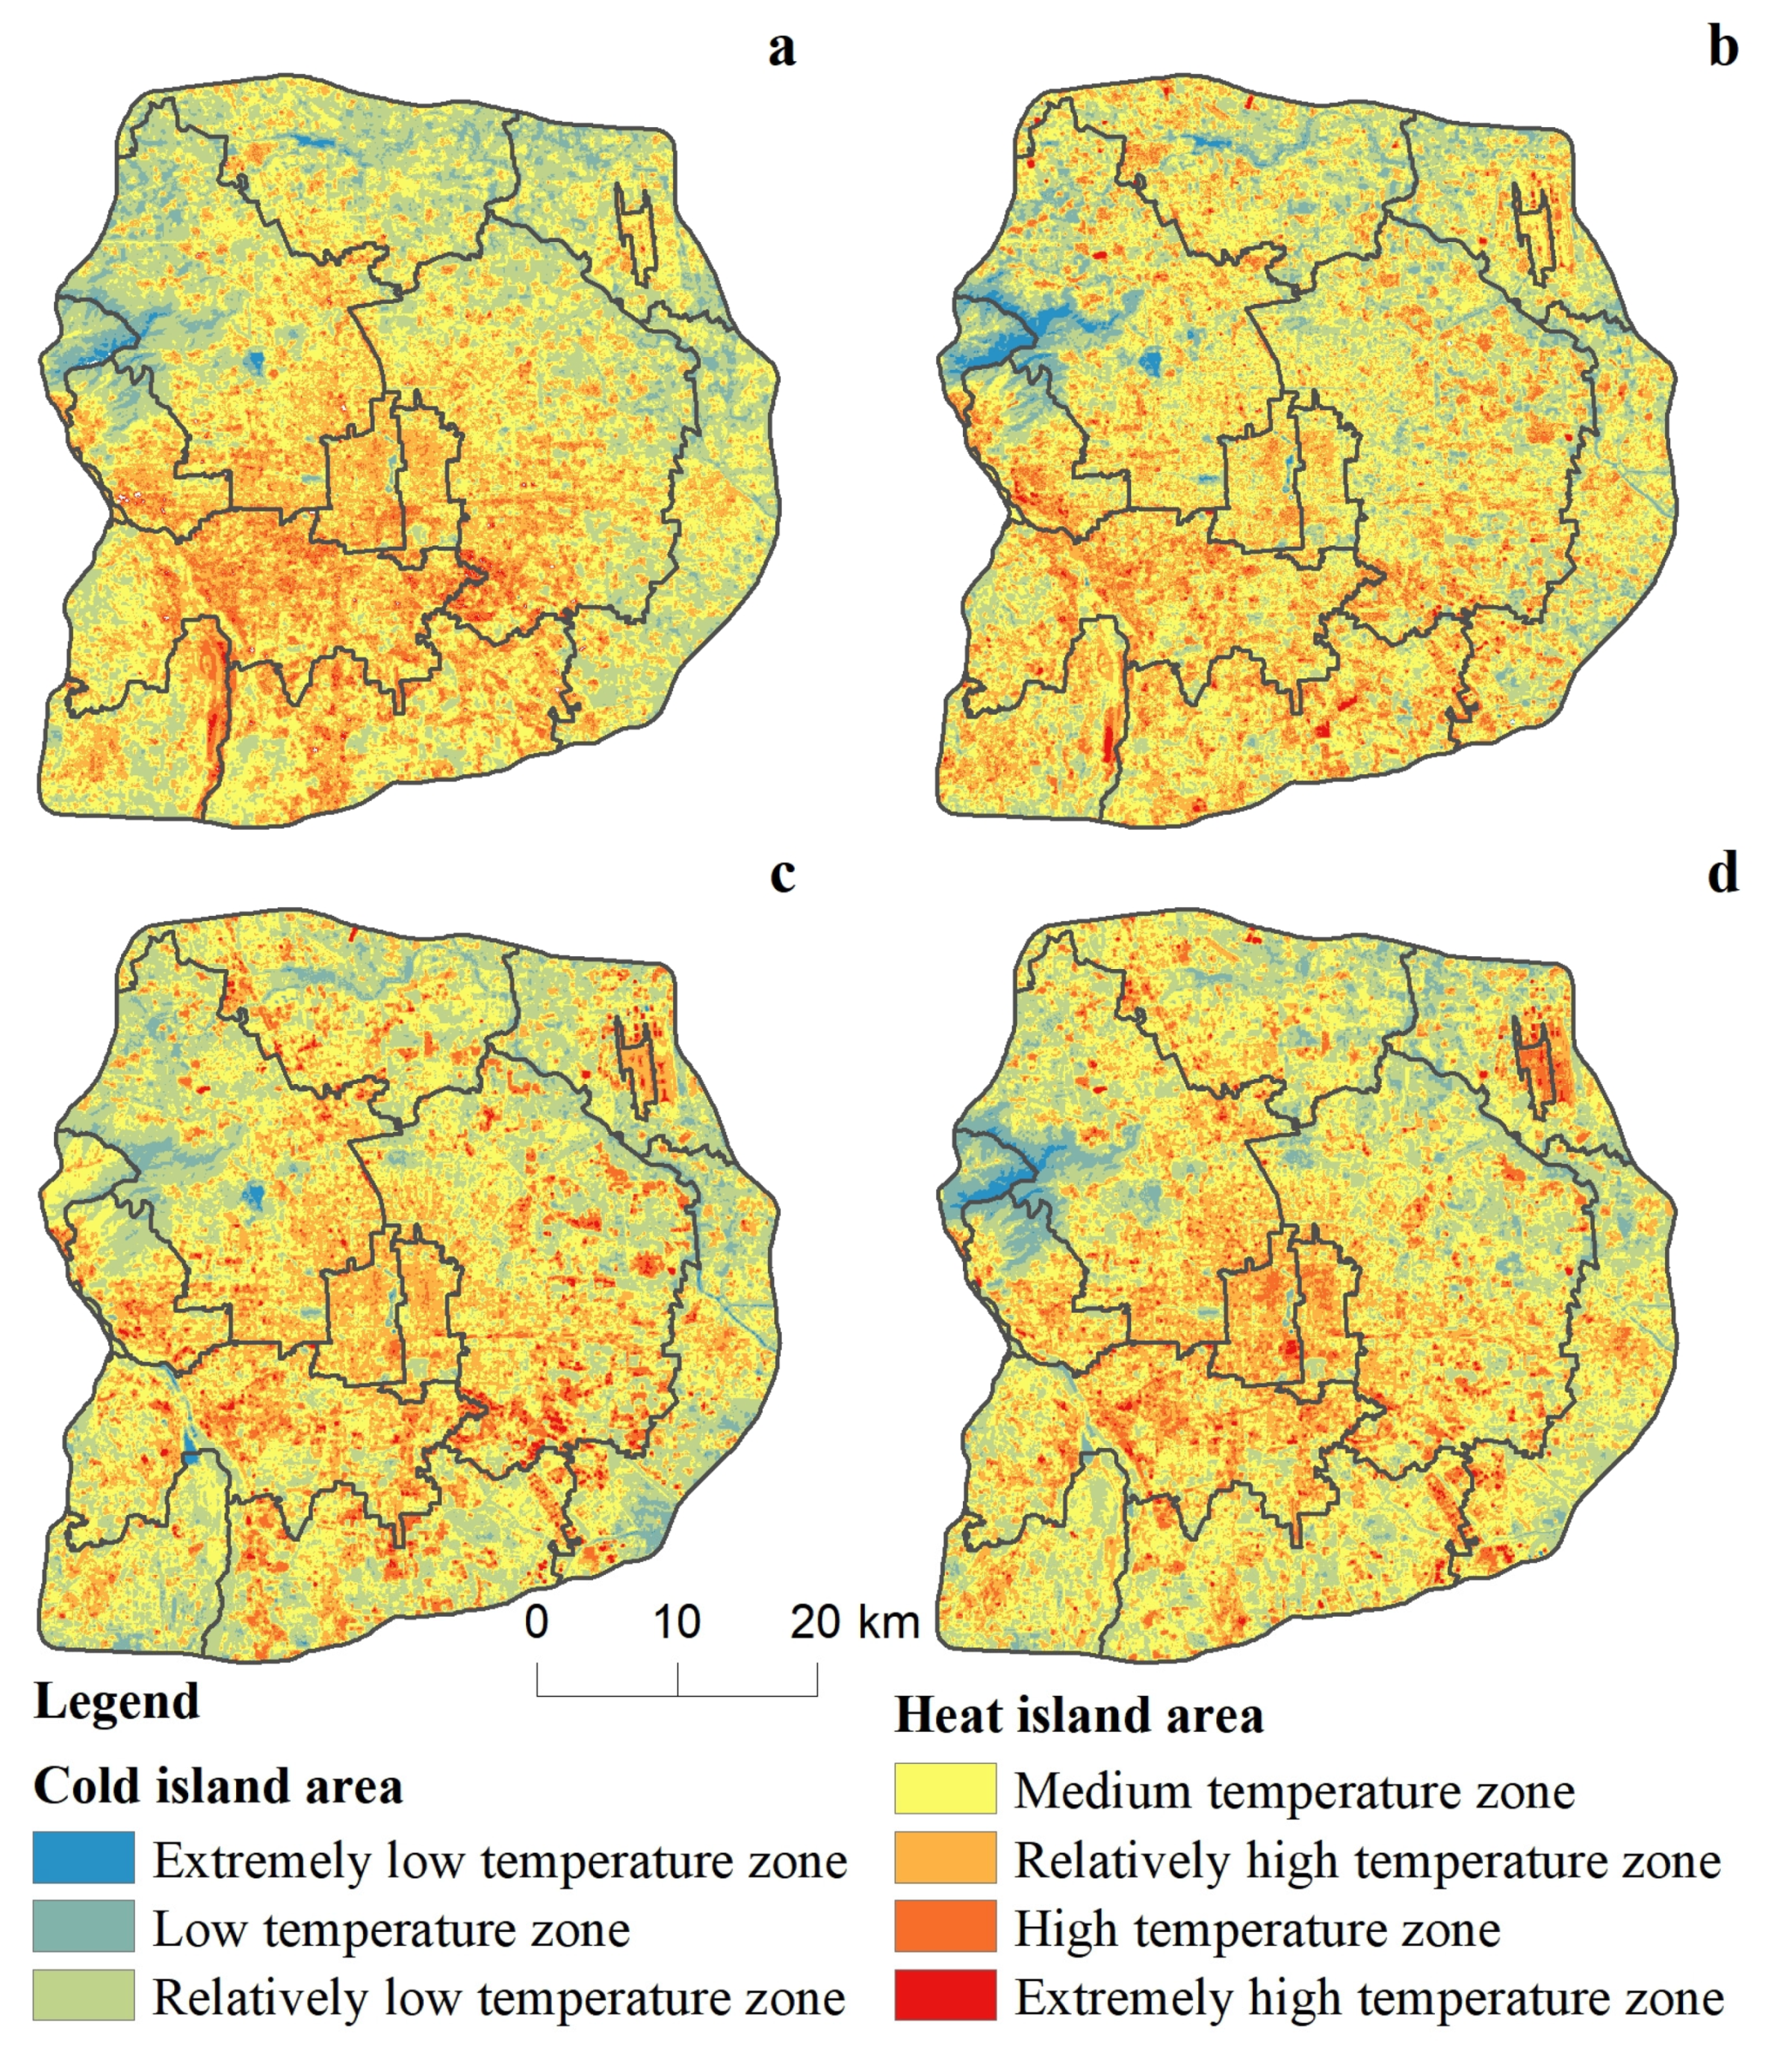
3.1.1. Spatial Distribution of the Urban Thermal Environment
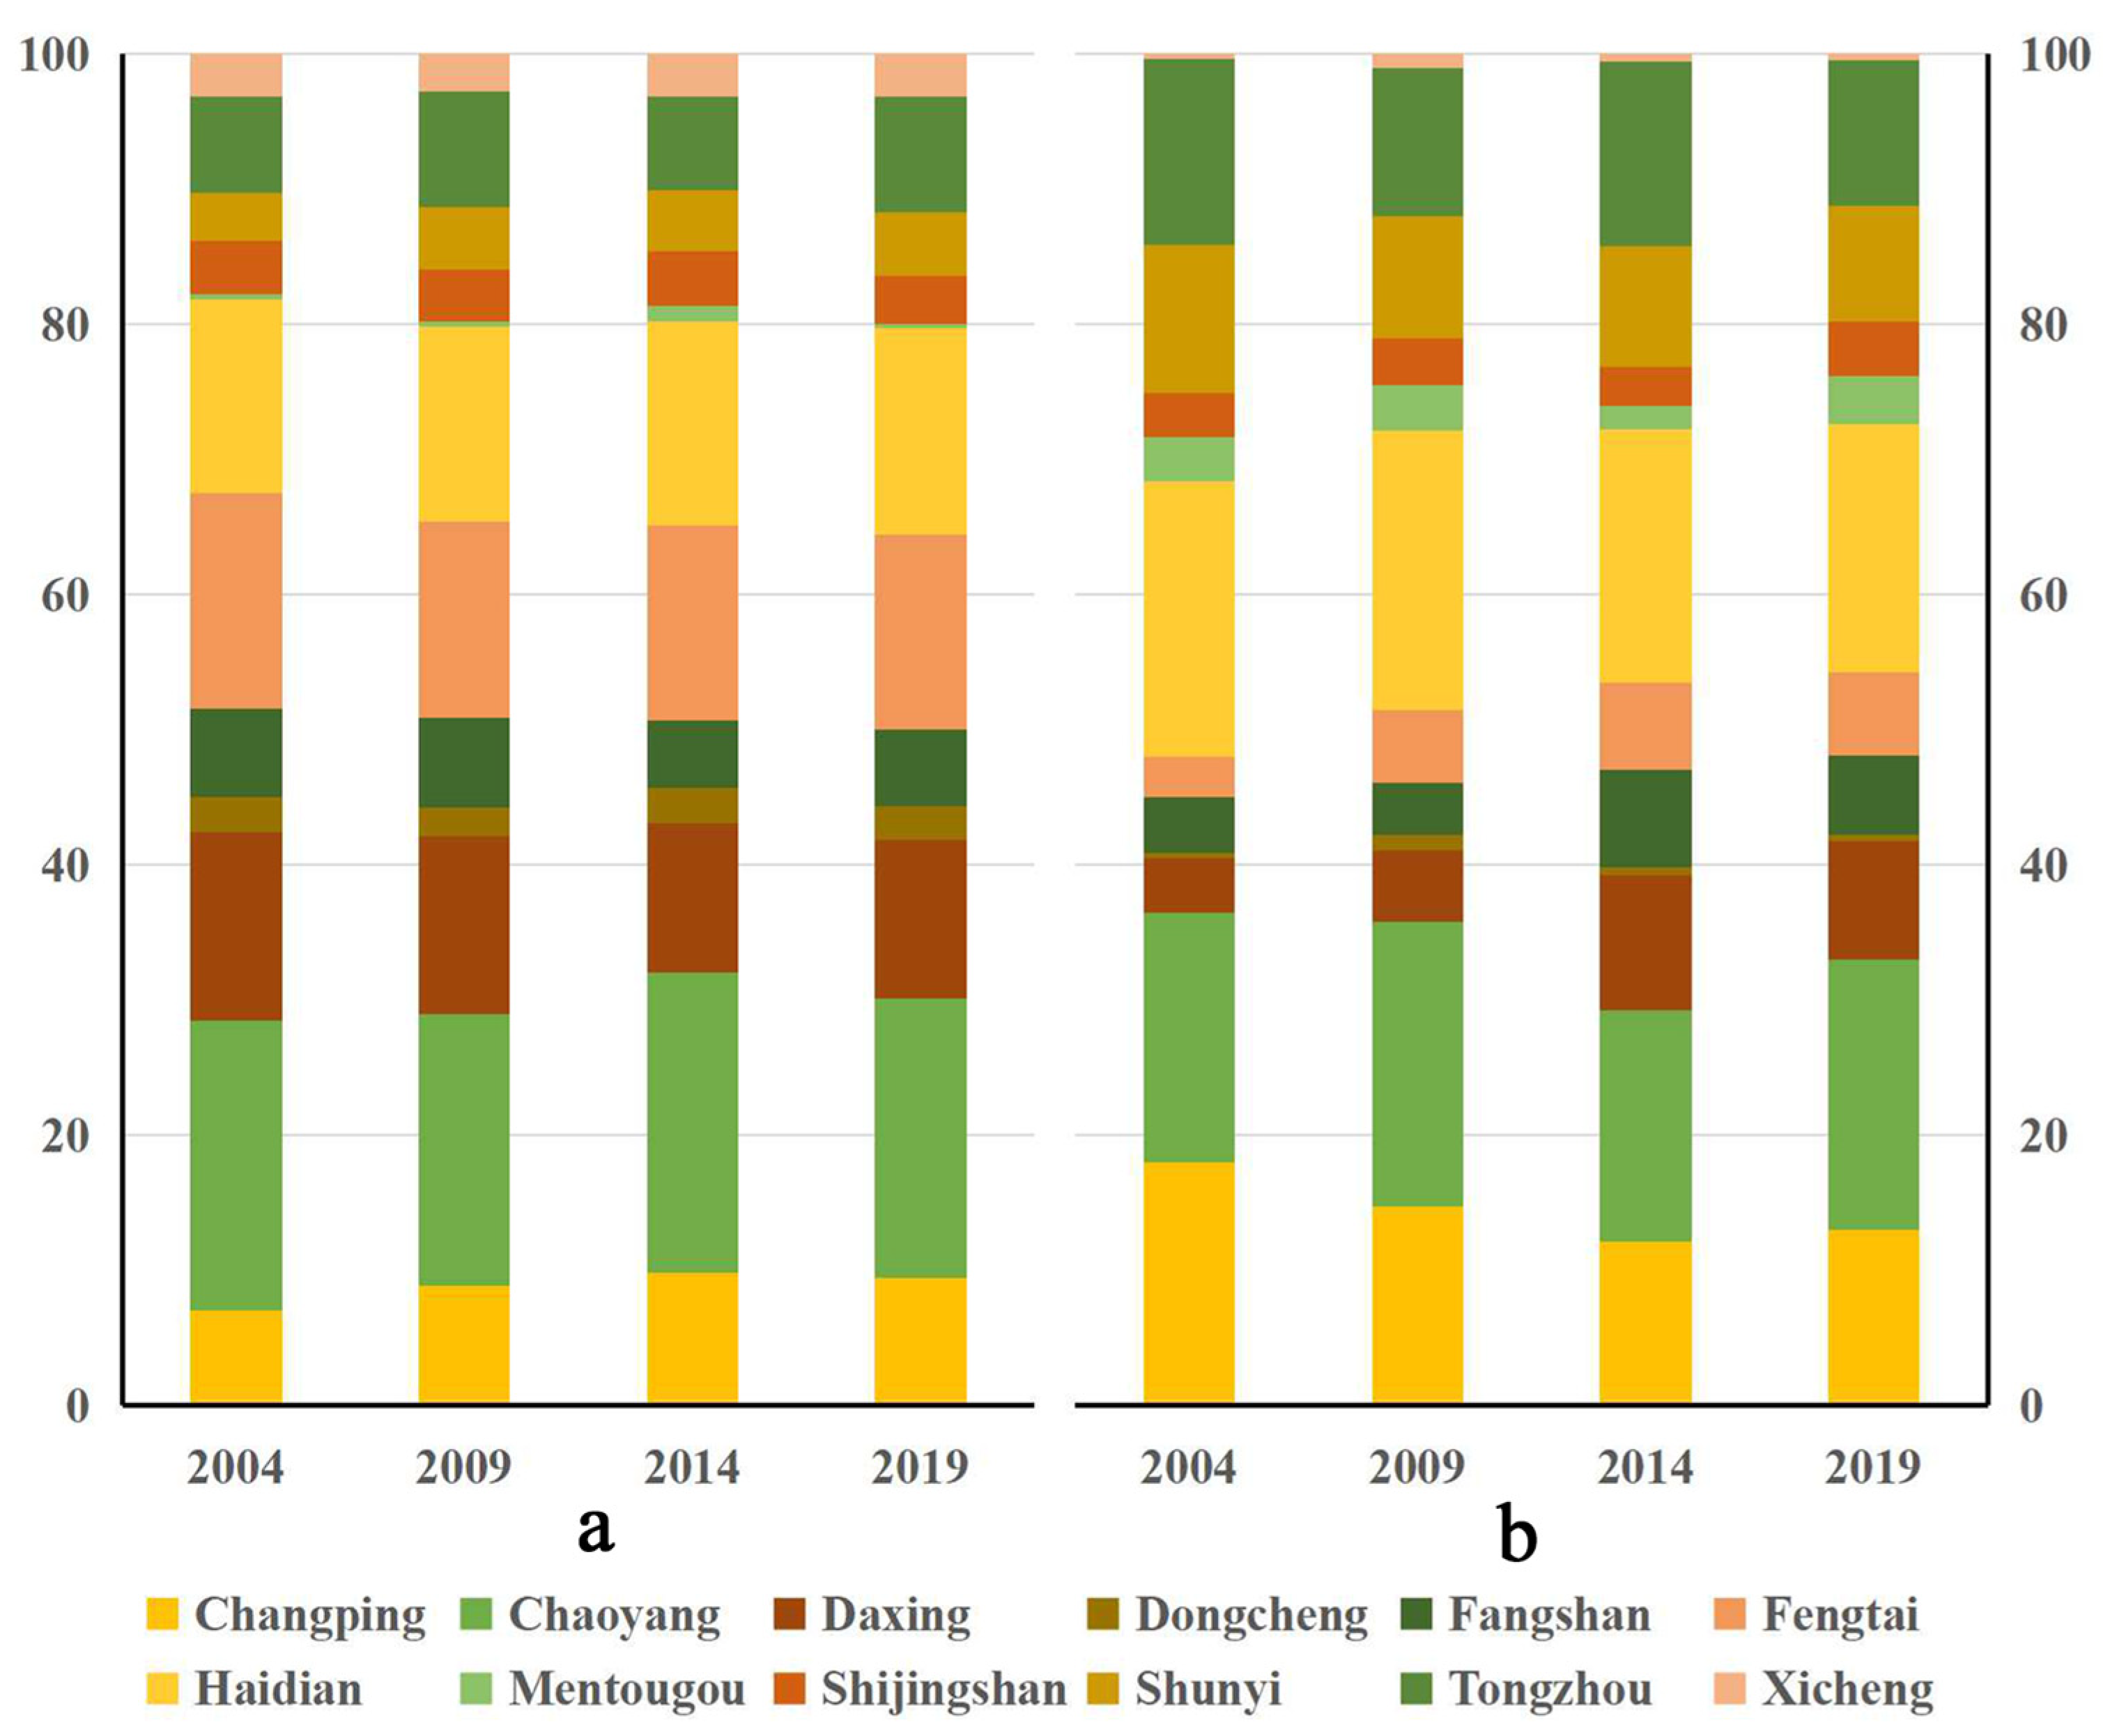
3.1.2. Temporal Evolution of the Urban Thermal Environment
3.2. Influencing Factors on the Urban Thermal Environment
3.2.1. Correlation Analysis of Influencing Factors
3.2.2. Spatial PCA
3.2.3. Relationship between Principal Component Simulation and LST
4. Discussion
4.1. Result Analysis
4.2. Recommendations for Sustainable Development
4.3. Limitations
5. Conclusions
Author Contributions
Funding
Data Availability Statement
Acknowledgments
Conflicts of Interest
References
- Park, R.E.; Park, R.E. The City: Suggestions for the Investigation of Human Behavior in the City Environment. Am. J. Sociol. 1915, 20, 577–612. [Google Scholar] [CrossRef] [Green Version]
- Voogt, J.A.; Oke, T.R. Thermal remote sensing of urban climates. Remote Sens. Environ. 2003, 86, 370–384. [Google Scholar] [CrossRef]
- Li, W.; Cao, Q.; Lang, K.; Wu, J. Linking potential heat source and sink to urban heat island: Heterogeneous effects of landscape pattern on land surface temperature. Sci. Total Environ. 2017, 586, 457–465. [Google Scholar] [CrossRef]
- Zhang, X.; Estoque, R.C.; Murayama, Y. An urban heat island study in Nanchang City, China based on land surface temperature and social-ecological variables. Sustain. Cities Soc. 2017, 32, 557–568. [Google Scholar] [CrossRef]
- Deilami, K.; Kamruzzaman, M.; Liu, Y. Urban heat island effect: A systematic review of spatio-temporal factors, data, methods, and mitigation measures. Int. J. Appl. Earth Obs. Geoinf. 2018, 67, 30–42. [Google Scholar] [CrossRef]
- Kuang, W.; Chi, W.; Lu, D.; Dou, Y. A comparative analysis of megacity expansions in China and the U.S.: Patterns, rates and driving forces. Landsc. Urban Plan. 2014, 132, 121–135. [Google Scholar] [CrossRef]
- Zhou, D.; Xiao, J.; Bonafoni, S.; Berger, C.; Deilami, K.; Zhou, Y.; Frolking, S.; Yao, R.; Qiao, Z.; Sobrino, J.A. Satellite Remote Sensing of Surface Urban Heat Islands: Progress, Challenges, and Perspectives. Remote Sens. 2019, 11, 48. [Google Scholar] [CrossRef] [Green Version]
- Luo, X.; Yang, J.; Sun, W.; He, B. Suitability of human settlements in mountainous areas from the perspective of ventilation: A case study of the main urban area of Chongqing. J. Clean. Prod. 2021, 310, 127467. [Google Scholar] [CrossRef]
- Lai, L.-W.; Cheng, W.-L. Air quality influenced by urban heat island coupled with synoptic weather patterns. Sci. Total Environ. 2009, 407, 2724–2733. [Google Scholar] [CrossRef]
- Zhao, C.; Jensen, J.L.R.; Weng, Q.; Currit, N.; Weaver, R. Use of Local Climate Zones to investigate surface urban heat islands in Texas. GIScience Remote Sens. 2020, 57, 1083–1101. [Google Scholar] [CrossRef]
- Liu, Y.; Li, Q.; Yang, L.; Mu, K.; Zhang, M.; Liu, J. Urban heat island effects of various urban morphologies under regional climate conditions. Sci. Total Environ. 2020, 743, 140589. [Google Scholar] [CrossRef] [PubMed]
- Yang, X.; Peng, L.L.H.; Jiang, Z.; Chen, Y.; Yao, L.; He, Y.; Xu, T. Impact of urban heat island on energy demand in buildings: Local climate zones in Nanjing. Appl. Energy 2020, 260, 114279. [Google Scholar] [CrossRef]
- Ren, J.; Yang, J.; Zhang, Y.; Xiao, X.; Xia, J.C.; Li, X.; Wang, S. Exploring thermal comfort of urban buildings based on local climate zones. J. Clean. Prod. 2022, 340, 130744. [Google Scholar] [CrossRef]
- Yang, J.; Wang, Y.; Xiao, X.; Jin, C.; Xia, J.; Li, X. Spatial differentiation of urban wind and thermal environment in different grid sizes. Urban Clim. 2019, 28, 100458. [Google Scholar] [CrossRef]
- Zhao, Z.; Sharifi, A.; Dong, X.; Shen, L.; He, B.-J. Spatial Variability and Temporal Heterogeneity of Surface Urban Heat Island Patterns and the Suitability of Local Climate Zones for Land Surface Temperature Characterization. Remote Sens. 2021, 13, 4338. [Google Scholar] [CrossRef]
- Liu, M.; Zhang, D.; Pietzarka, U.; Roloff, A. Assessing the adaptability of urban tree species to climate change impacts: A case study in Shanghai. Urban For. Urban Green. 2021, 62, 127186. [Google Scholar] [CrossRef]
- Nasrollahi, N.; Ghosouri, A.; Khodakarami, J.; Taleghani, M. Heat-Mitigation Strategies to Improve Pedestrian Thermal Comfort in Urban Environments: A Review. Sustainability 2020, 12, 10000. [Google Scholar] [CrossRef]
- Yang, J.; Wang, Y.; Xiu, C.; Xiao, X.; Xia, J.; Jin, C. Optimizing local climate zones to mitigate urban heat island effect in human settlements. J. Clean. Prod. 2020, 275, 123767. [Google Scholar] [CrossRef]
- Biardeau, L.T.; Davis, L.W.; Gertler, P.; Wolfram, C. Heat exposure and global air conditioning. Nat. Sustain. 2020, 3, 25–28. [Google Scholar] [CrossRef]
- Bai, X.; Dawson, R.; Ürge-Vorsatz, D.; Delgado, G.C.; Barau, A.S.; Dhakal, S.; Dodman, D.; Leonardsen, L.; Masson-Delmotte, V.; Roberts, D.C.; et al. Six research priorities for cities and climate change. Nature 2018, 555, 23–25. [Google Scholar] [CrossRef]
- He, B.-J.; Zhao, D.; Xiong, K.; Qi, J.; Ulpiani, G.; Pignatta, G.; Prasad, D.; Jones, P. A Framework for Addressing Urban Heat Challenges and Associated Adaptive Behavior by the Public and the Issue of Willingness to Pay for Heat Resilient Infrastructure in Chongqing, China. Sustain. Cities Soc. 2021, 75, 103361. [Google Scholar] [CrossRef]
- Xie, P.; Yang, J.; Sun, W.; Xiao, X.; Xia, J. Urban scale ventilation analysis based on neighborhood normalized current model. Sustain. Cities Soc. 2022, 80, 103746. [Google Scholar] [CrossRef]
- Chen, Y.; Yang, J.; Yang, R.; Xiao, X.; Xia, J. Contribution of urban functional zones to the spatial distribution of urban thermal environment. Build. Environ. 2022, 216, 109000. [Google Scholar] [CrossRef]
- Estoque, R.C.; Murayama, Y.; Myint, S.W. Effects of landscape composition and pattern on land surface temperature: An urban heat island study in the megacities of Southeast Asia. Sci. Total Environ. 2017, 577, 349–359. [Google Scholar] [CrossRef] [PubMed]
- Yu, H.; Yang, J.; Li, T.; Jin, Y.; Sun, D. Morphological and functional polycentric structure assessment of megacity: An integrated approach with spatial distribution and interaction. Sustain. Cities Soc. 2022, 80, 103800. [Google Scholar] [CrossRef]
- Shen, Z.J.; Zeng, J. Spatial relationship of urban development to land surface temperature in three cities of southern Fujian. Acta Geogr. Sin. 2021, 76, 566–583. [Google Scholar] [CrossRef]
- Umezaki, A.S.; Ribeiro, F.N.D.; De Oliveira, A.P.; Soares, J.; De Miranda, R.M. Numerical characterization of spatial and temporal evolution of summer urban heat island intensity in São Paulo, Brazil. Urban Clim. 2020, 32, 100615. [Google Scholar] [CrossRef]
- Shi, Y.; Xiang, Y.; Zhang, Y. Urban Design Factors Influencing Surface Urban Heat Island in the High-Density City of Guangzhou Based on the Local Climate Zone. Sensors 2019, 19, 3459. [Google Scholar] [CrossRef] [Green Version]
- Wang, Y.; Du, H.; Xu, Y.; Lu, D.; Wang, X.; Guo, Z. Temporal and spatial variation relationship and influence factors on surface urban heat island and ozone pollution in the Yangtze River Delta, China. Sci. Total Environ. 2018, 631–632, 921–933. [Google Scholar] [CrossRef]
- Nelson, F.E.; Anisimov, O.A.; Shiklomanov, N.I. Subsidence risk from thawing permafrost. Nature 2001, 410, 889–890. [Google Scholar] [CrossRef]
- Yang, J.; Yang, Y.; Sun, D.; Jin, C.; Xiao, X. Influence of urban morphological characteristics on thermal environment. Sustain. Cities Soc. 2021, 72, 103045. [Google Scholar] [CrossRef]
- Peng, J.; Jia, J.; Liu, Y.; Li, H.; Wu, J. Seasonal contrast of the dominant factors for spatial distribution of land surface temperature in urban areas. Remote Sens. Environ. 2018, 215, 255–267. [Google Scholar] [CrossRef]
- Li, L.; Zha, Y.; Wang, R. Relationship of surface urban heat island with air temperature and precipitation in global large cities. Ecol. Indic. 2020, 117, 106683. [Google Scholar] [CrossRef]
- Li, H.; Zhou, Y.; Wang, X.; Zhou, X.; Zhang, H.; Sodoudi, S. Quantifying urban heat island intensity and its physical mechanism using WRF/UCM. Sci. Total Environ. 2019, 650, 3110–3119. [Google Scholar] [CrossRef]
- Du, H.; Cai, Y.; Zhou, F.; Jiang, H.; Jiang, W.; Xu, Y. Urban blue-green space planning based on thermal environment simulation: A case study of Shanghai, China. Ecol. Indic. 2019, 106, 105501. [Google Scholar] [CrossRef]
- Kazak, J.K. The Use of a Decision Support System for Sustainable Urbanization and Thermal Comfort in Adaptation to Climate Change Actions—The Case of the Wrocław Larger Urban Zone (Poland). Sustainability 2018, 10, 1083. [Google Scholar] [CrossRef] [Green Version]
- Shorabeh, S.N.; Hamzeh, S.; Shahraki, S.Z.; Firozjaei, M.K.; Arsanjani, J.J. Modelling the intensity of surface urban heat island and predicting the emerging patterns: Landsat multi-temporal images and Tehran as case study. Int. J. Remote Sens. 2020, 41, 7400–7426. [Google Scholar] [CrossRef]
- Liu, W.; Meng, Q.; Allam, M.; Zhang, L.; Hu, D.; Menenti, M. Driving Factors of Land Surface Temperature in Urban Agglomerations: A Case Study in the Pearl River Delta, China. Remote Sens. 2021, 13, 2858. [Google Scholar] [CrossRef]
- Chen, X.-L.; Zhao, H.-M.; Li, P.-X.; Yin, Z.-Y. Remote sensing image-based analysis of the relationship between urban heat island and land use/cover changes. Remote Sens. Environ. 2006, 104, 133–146. [Google Scholar] [CrossRef]
- Derdouri, A.; Wang, R.; Murayama, Y.; Osaragi, T. Understanding the Links between LULC Changes and SUHI in Cities: Insights from Two-Decadal Studies (2001–2020). Remote Sens. 2021, 13, 3654. [Google Scholar] [CrossRef]
- Yao, L.; Li, T.; Xu, M.; Xu, Y. How the landscape features of urban green space impact seasonal land surface temperatures at a city-block-scale: An urban heat island study in Beijing, China. Urban For. Urban Green. 2020, 52, 126704. [Google Scholar] [CrossRef]
- Singh, P.; Kikon, N.; Verma, P. Impact of land use change and urbanization on urban heat island in Lucknow city, Central India. A remote sensing based estimate. Sustain. Cities Soc. 2017, 32, 100–114. [Google Scholar] [CrossRef]
- Dai, Z.; Guldmann, J.-M.; Hu, Y. Spatial regression models of park and land-use impacts on the urban heat island in central Beijing. Sci. Total Environ. 2018, 626, 1136–1147. [Google Scholar] [CrossRef]
- Morabito, M.; Crisci, A.; Guerri, G.; Messeri, A.; Congedo, L.; Munafò, M. Surface urban heat islands in Italian metropolitan cities: Tree cover and impervious surface influences. Sci. Total Environ. 2021, 751, 142334. [Google Scholar] [CrossRef] [PubMed]
- Meng, Q.; Zhang, L.; Sun, Z.; Meng, F.; Wang, L.; Sun, Y. Characterizing spatial and temporal trends of surface urban heat island effect in an urban main built-up area: A 12-year case study in Beijing, China. Remote Sens. Environ. 2018, 204, 826–837. [Google Scholar] [CrossRef]
- Yuan, F.; Bauer, M.E. Comparison of impervious surface area and normalized difference vegetation index as indicators of surface urban heat island effects in Landsat imagery. Remote Sens. Environ. 2007, 106, 375–386. [Google Scholar] [CrossRef]
- Li, Y.; Sun, Y.; Li, J.; Gao, C. Socioeconomic drivers of urban heat island effect: Empirical evidence from major Chinese cities. Sustain. Cities Soc. 2020, 63, 102425. [Google Scholar] [CrossRef]
- Dewan, A.; Kiselev, G.; Botje, D.; Mahmud, G.I.; Bhuian, H.; Hassan, Q.K. Surface urban heat island intensity in five major cities of Bangladesh: Patterns, drivers and trends. Sustain. Cities Soc. 2021, 71, 102926. [Google Scholar] [CrossRef]
- Portela, C.I.; Massi, K.G.; Rodrigues, T.; Alcântara, E. Impact of urban and industrial features on land surface temperature: Evidences from satellite thermal indices. Sustain. Cities Soc. 2020, 56, 102100. [Google Scholar] [CrossRef]
- Gewers, F.L.; Ferreira, G.R.; De Arruda, H.F.; Silva, F.N.; Comin, C.H.; Amancio, D.R.; Costa, L.D.F. Principal Component Analysis: A Natural Approach to Data Exploration. ACM Comput. Surv. 2022, 54, 1–34. [Google Scholar] [CrossRef]
- Zhou, W.; Huang, G.; Cadenasso, M.L. Does spatial configuration matter? Understanding the effects of land cover pattern on land surface temperature in urban landscapes. Landsc. Urban Plan. 2011, 102, 54–63. [Google Scholar] [CrossRef]
- Maimaitiyiming, M.; Ghulam, A.; Tiyip, T.; Pla, F.; Latorre-Carmona, P.; Halik, Ü.; Sawut, M.; Caetano, M. Effects of green space spatial pattern on land surface temperature: Implications for sustainable urban planning and climate change adaptation. ISPRS J. Photogramm. Remote Sens. 2014, 89, 59–66. [Google Scholar] [CrossRef] [Green Version]
- Jin, D.D.; Gong, Z.N. Algorithms Comparison of Land Surface Temperature Retrieval from Landsat Series Data:A Case Study in Qiqihar, China. Remote Sens. Technol. Appl. 2018, 33, 830–841. [Google Scholar] [CrossRef]
- Liu, G.; Zhang, Q.; Li, G.; Doronzo, D.M. Response of land cover types to land surface temperature derived from Landsat-5 TM in Nanjing Metropolitan Region, China. Environ. Earth Sci. 2016, 75, 1386. [Google Scholar] [CrossRef]
- Xiong, Y.; Zhang, F. Effect of human settlements on urban thermal environment and factor analysis based on multi-source data: A case study of Changsha city. J. Geogr. Sci. 2021, 31, 819–838. [Google Scholar] [CrossRef]
- Musse, M.A.; Barona, D.A.; Rodriguez, L.M.S. Urban environmental quality assessment using remote sensing and census data. Int. J. Appl. Earth Obs. Geoinf. 2018, 71, 95–108. [Google Scholar] [CrossRef]
- Wu, Z.J.; Zhao, S.H. A Study of Enhanced Index based-Built up-Index Based on Landsat TM Imagery. Remote Sens. Land Resour. 2012, 24, 50–55. [Google Scholar] [CrossRef]
- Fan, X.L.; Yan, H.B.; Qu, Y. Comparison and validation of the methods for estimating surface albedo from HJ-1 A/B CCD data. Remote Sens. Nat. Resour. 2019, 31, 123–131. [Google Scholar] [CrossRef]
- Pan, J.-H.; Liu, X. Assessment of landscape ecological security and optimization of landscape pattern based on spatial principal component analysis and resistance model in arid inland area: A case study of Ganzhou District, Zhangye City, Northwest China. Ying Yong Sheng Tai Xue Bao J. Appl. Ecol. 2015, 26, 3126–3136. [Google Scholar]
- Lefever, D.W. Measuring Geographic Concentration by Means of the Standard Deviational Ellipse. Am. J. Sociol. 1926, 32, 88–94. [Google Scholar] [CrossRef]
- Zhao, Z.Q. Global Statistics of Spatial Distribution: A Literature Review. Prog. Geogr. 2009, 28, 1–8. [Google Scholar] [CrossRef]
- Yang, Y.; Ma, M.; Zhu, X.; Ge, W. Research on spatial characteristics of metropolis development using nighttime light data: NTL based spatial characteristics of Beijing. PLoS ONE 2020, 15, e0242663. [Google Scholar] [CrossRef] [PubMed]
- Li, Z.; Wu, F.; Ma, H.; Xu, Z.; Wang, S. Spatiotemporal Evolution and Relationship between Night Time Light and Land Surface Temperature: A Case Study of Beijing, China. Land 2022, 11, 548. [Google Scholar] [CrossRef]
- Qiao, Z.; Huang, N.Y.; Xu, X.L.; Sun, Z.Y.; Wu, C.; Yang, J. Spatio-temporal pattern and evolution of the urban thermal landscape in metropolitan Beijing between 2003 and 2017. Acta Geogr. Sin. 2019, 74, 475–489. [Google Scholar] [CrossRef]
- Chen, W.; Zhang, Y.; Pengwang, C.; Gao, W. Evaluation of Urbanization Dynamics and its Impacts on Surface Heat Islands: A Case Study of Beijing, China. Remote Sens. 2017, 9, 453. [Google Scholar] [CrossRef] [Green Version]
- Chen, W.; Zhang, Y.; Gao, W.; Zhou, D. The Investigation of Urbanization and Urban Heat Island in Beijing Based on Remote Sensing. Procedia Soc. Behav. Sci. 2016, 216, 141–150. [Google Scholar] [CrossRef] [Green Version]
- Yang, L.; Yu, K.; Ai, J.; Liu, Y.; Yang, W.; Liu, J. Dominant Factors and Spatial Heterogeneity of Land Surface Temperatures in Urban Areas: A Case Study in Fuzhou, China. Remote Sens. 2022, 14, 1266. [Google Scholar] [CrossRef]
- Chen, L.; Wang, X.; Cai, X.; Yang, C.; Lu, X. Combined Effects of Artificial Surface and Urban Blue-Green Space on Land Surface Temperature in 28 Major Cities in China. Remote Sens. 2022, 14, 448. [Google Scholar] [CrossRef]
- Kyriakodis, G.-E.; Santamouris, M. Using reflective pavements to mitigate urban heat island in warm climates—Results from a large scale urban mitigation project. Urban Clim. 2018, 24, 326–339. [Google Scholar] [CrossRef]
- Middel, A.; Turner, V.K.; Schneider, F.A.; Zhang, Y.; Stiller, M. Solar reflective pavements—A policy panacea to heat mitigation? Environ. Res. Lett. 2020, 15, 064016. [Google Scholar] [CrossRef]
- Kousis, I.; Fabiani, C.; Gobbi, L.; Pisello, A.L. Phosphorescent-based pavements for counteracting urban overheating—A proof of concept. Sol. Energy 2020, 202, 540–552. [Google Scholar] [CrossRef]
- Susca, T.; Gaffin, S.R.; Dell’Osso, G.R. Positive effects of vegetation: Urban heat island and green roofs. Environ. Pollut. 2011, 159, 2119–2126. [Google Scholar] [CrossRef] [PubMed]
- Dong, J.; Lin, M.; Zuo, J.; Lin, T.; Liu, J.; Sun, C.; Luo, J. Quantitative study on the cooling effect of green roofs in a high-density urban Area—A case study of Xiamen, China. J. Clean. Prod. 2020, 255, 120152. [Google Scholar] [CrossRef]
- Doulos, L.; Santamouris, M.; Livada, I. Passive cooling of outdoor urban spaces. The role of materials. Sol. Energy 2004, 77, 231–249. [Google Scholar] [CrossRef]
- Lei, J.; Kumarasamy, K.; Zingre, K.T.; Yang, J.; Wan, M.P.; Yang, E.-H. Cool colored coating and phase change materials as complementary cooling strategies for building cooling load reduction in tropics. Appl. Energy 2017, 190, 57–63. [Google Scholar] [CrossRef]
- Azhdari, A.; Soltani, A.; Alidadi, M. Urban morphology and landscape structure effect on land surface temperature: Evidence from Shiraz, a semi-arid city. Sustain. Cities Soc. 2018, 41, 853–864. [Google Scholar] [CrossRef]
- Chen, M.; Dai, F.; Yang, B.; Zhu, S. Effects of neighborhood green space on PM2.5 mitigation: Evidence from five megacities in China. Build. Environ. 2019, 156, 33–45. [Google Scholar] [CrossRef]
- Yao, X.; Yu, K.; Zeng, X.; Lin, Y.; Ye, B.; Shen, X.; Liu, J. How can urban parks be planned to mitigate urban heat island effect in “Furnace cities”? An accumulation perspective. J. Clean. Prod. 2022, 330, 129852. [Google Scholar] [CrossRef]
- Du, J.; Xiang, X.; Zhao, B.; Zhou, H. Impact of urban expansion on land surface temperature in Fuzhou, China using Landsat imagery. Sustain. Cities Soc. 2020, 61, 102346. [Google Scholar] [CrossRef]


| Name of the Data | Data Identification | Time | Data Source |
|---|---|---|---|
| Landsat 4-5 TM | LT51230322004252BJC00 | 8 September 2004 | http://www.gscloud.cn/ (accessed on 3 October 2021) |
| Landsat 4-5 TM | LT51230322009265IKR00 | 22 September 2009 | |
| Landsat 8 OLI_TIRS | LC81230322014247LGN01 | 4 September 2014 | |
| Landsat 8 OLI_TIRS | LC81230322019261LGN00 | 18 September 2019 | |
| DEM | ASTGTM_N39E116 | —— | |
| Road network | —— | 2020 | https://www.openstreetmap.org/ (accessed on 3 October 2021) |
| POI | —— | 2020 | https://map.baidu.com/ (accessed on 3 October 2021) |
| NPP/VIIRS nighttime light data | —— | —— | http://www.ngdc.noaa.gov/ (accessed on 3 October 2021) |
| Temperature Grade | Extremely Low Temperature | Low Temperature | Relatively Low Temperature | Medium Temperature | Relatively High Temperature | High Temperature | Extremely High Temperature |
|---|---|---|---|---|---|---|---|
| Temperature region | T < u − 2.5std | u − 2.5std ≤ T < u − 1.5std | u − 1.5std ≤ T < u − 0.5std | u − 0.5std ≤ T < u + 0.5std | u + 0.5std ≤ T < u + 1.5std | u + 1.5std ≤ T < u + 2.5std | T ≥ u + 2.5std |
| Category | 2004 | 2009 | 2014 | 2019 | ||||
|---|---|---|---|---|---|---|---|---|
| Cold Island Area | Heat Island Area | Cold Island Area | Heat Island Area | Cold Island Area | Heat Island Area | Cold Island Area | Heat Island Area | |
| Changping | 18.07 | 7.04 | 14.72 | 8.85 | 12.2 | 9.84 | 13.01 | 9.51 |
| Chaoyang | 18.45 | 21.44 | 21.13 | 20.17 | 17.06 | 22.25 | 20.05 | 20.67 |
| Daxing | 3.98 | 13.99 | 5.24 | 13.12 | 10.06 | 11.06 | 8.75 | 11.65 |
| Dongcheng | 0.41 | 2.55 | 1.19 | 2.15 | 0.53 | 2.54 | 0.49 | 2.51 |
| Fangshan | 4.13 | 6.53 | 3.85 | 6.58 | 7.17 | 5.00 | 5.78 | 5.73 |
| Fengtai | 2.98 | 15.97 | 5.36 | 14.52 | 6.49 | 14.44 | 6.19 | 14.37 |
| Haidian | 20.39 | 14.34 | 20.64 | 14.42 | 18.72 | 15.07 | 18.35 | 15.35 |
| Mentougou | 3.28 | 0.41 | 3.38 | 0.45 | 1.71 | 1.16 | 3.55 | 0.29 |
| Shijingshan | 3.27 | 3.92 | 3.52 | 3.79 | 2.92 | 4.11 | 4.10 | 3.51 |
| Shunyi | 10.9 | 3.57 | 8.96 | 4.65 | 8.91 | 4.43 | 8.50 | 4.75 |
| Tongzhou | 13.78 | 7.11 | 10.96 | 8.55 | 13.74 | 6.96 | 10.81 | 8.56 |
| Xicheng | 0.36 | 3.13 | 1.05 | 2.75 | 0.49 | 3.14 | 0.42 | 3.10 |
| Sum | 100.00 | 100.00 | 100.00 | 100.00 | 100.00 | 100.00 | 100.00 | 100.00 |
| Year | Standard Deviation Elliptic Parameter | ||||
|---|---|---|---|---|---|
| Center of Inertia | Directivity | Discreteness | Azimuth (°) | Oblateness | |
| 2004 | (116.373, 39.903) | 0.208 | 0.159 | 73.157 | 0.236 |
| 2009 | (116.376, 39.914) | 0.218 | 0.170 | 74.113 | 0.220 |
| 2014 | (116.375, 39.923) | 0.211 | 0.165 | 77.675 | 0.218 |
| 2019 | (116.380, 39.918) | 0.212 | 0.169 | 77.715 | 0.203 |
| Year | Extremely Low Temperature | Low Temperature | Relatively Low Temperature | Medium Temperature | Relatively High Temperature | High Temperature | Extremely High Temperature | |||||||
|---|---|---|---|---|---|---|---|---|---|---|---|---|---|---|
| Area (km2) | Proportion (%) | Area (km2) | Proportion (%) | Area (km2) | Proportion (%) | Area (km2) | Proportion (%) | Area (km2) | Proportion (%) | Area (km2) | Proportion (%) | Area (km2) | Proportion (%) | |
| 2004 | 5.95 | 0.26 | 106.03 | 4.68 | 632.60 | 27.89 | 786.42 | 34.67 | 588.65 | 25.95 | 139.67 | 6.16 | 8.77 | 0.39 |
| 2009 | 19.61 | 0.86 | 130.82 | 5.77 | 547.68 | 24.15 | 857.36 | 37.80 | 589.37 | 25.98 | 112.45 | 4.96 | 10.81 | 0.48 |
| 2014 | 4.16 | 0.18 | 88.88 | 3.92 | 687.27 | 30.30 | 801.74 | 35.35 | 516.02 | 22.75 | 147.85 | 6.52 | 22.16 | 0.98 |
| 2019 | 9.63 | 0.42 | 117.84 | 5.19 | 611.44 | 26.96 | 830.47 | 36.62 | 540.73 | 23.84 | 142.12 | 6.27 | 15.86 | 0.70 |
| Category (Temperature Zone) | Changping | Chaoyang | Daxing | |||||||||
|---|---|---|---|---|---|---|---|---|---|---|---|---|
| 2004 | 2009 | 2014 | 2019 | 2004 | 2009 | 2014 | 2019 | 2004 | 2009 | 2014 | 2019 | |
| Extremely low temperature | 0.56 | 0.58 | 0.02 | 0.00 | 0.00 | 0.04 | 0.02 | 0.00 | 0.00 | 0.02 | 0.04 | 0.00 |
| Low temperature | 7.84 | 8.45 | 4.94 | 5.59 | 2.38 | 4.61 | 2.42 | 3.87 | 0.09 | 0.67 | 1.08 | 1.11 |
| Relatively low temperature | 47.18 | 33.27 | 34.37 | 34.10 | 27.16 | 26.96 | 26.18 | 27.96 | 12.07 | 14.30 | 31.10 | 25.45 |
| Medium temperature | 32.79 | 36.11 | 38.22 | 39.11 | 37.00 | 39.19 | 35.77 | 38.05 | 41.49 | 41.61 | 36.19 | 44.43 |
| Relatively high temperature | 10.79 | 18.80 | 16.58 | 17.09 | 27.38 | 24.37 | 24.06 | 22.92 | 34.92 | 34.61 | 20.74 | 21.58 |
| High temperature | 0.79 | 2.42 | 5.15 | 3.62 | 5.66 | 4.58 | 9.88 | 6.60 | 10.87 | 7.78 | 9.73 | 6.48 |
| Extremely high temperature | 0.05 | 0.37 | 0.72 | 0.49 | 0.42 | 0.25 | 1.67 | 0.60 | 0.56 | 1.01 | 1.12 | 0.95 |
| Category (Temperature Zone) | Dongcheng | Fangshan | Fengtai | |||||||||
| 2004 | 2009 | 2014 | 2019 | 2004 | 2009 | 2014 | 2019 | 2004 | 2009 | 2014 | 2019 | |
| Extremely low temperature | 0.00 | 0.02 | 0.00 | 0.00 | 0.00 | 0.00 | 0.45 | 0.00 | 0.01 | 0.02 | 0.39 | 0.00 |
| Low temperature | 0.33 | 2.31 | 0.31 | 0.26 | 0.58 | 0.91 | 4.02 | 2.06 | 0.05 | 0.58 | 0.95 | 1.00 |
| Relatively low temperature | 6.92 | 17.26 | 9.52 | 8.28 | 22.95 | 19.59 | 38.39 | 30.62 | 8.28 | 13.4 | 17.69 | 16.18 |
| Medium temperature | 32.83 | 45.86 | 33.17 | 28.77 | 38.55 | 38.76 | 40.91 | 43.87 | 33.60 | 38.13 | 40.62 | 37.77 |
| Relatively high temperature | 51.34 | 33.1 | 51.13 | 49.33 | 27.74 | 33.53 | 14.10 | 20.61 | 42.05 | 38.36 | 30.79 | 33.46 |
| High temperature | 8.53 | 1.42 | 5.66 | 13.17 | 9.21 | 6.06 | 1.89 | 2.56 | 15.30 | 9.01 | 8.46 | 10.49 |
| Extremely high temperature | 0.05 | 0.03 | 0.21 | 0.19 | 0.97 | 1.15 | 0.24 | 0.28 | 0.71 | 0.50 | 1.10 | 1.10 |
| Category (Temperature Zone) | Haidian | Mentougou | Shijingshan | |||||||||
| 2004 | 2009 | 2014 | 2019 | 2004 | 2009 | 2014 | 2019 | 2004 | 2009 | 2014 | 2019 | |
| Extremely low temperature | 0.50 | 2.80 | 0.37 | 1.03 | 8.42 | 22.04 | 0.20 | 17.89 | 0.00 | 0.12 | 0.04 | 0.16 |
| Low temperature | 8.21 | 10.34 | 5.71 | 8.29 | 35.02 | 32.79 | 6.65 | 42.48 | 5.73 | 7.98 | 1.55 | 15.56 |
| Relatively low temperature | 32.22 | 25.57 | 33.30 | 27.20 | 35.96 | 21.82 | 36.69 | 24.95 | 23.20 | 20.99 | 25.56 | 20.27 |
| Medium temperature | 32.54 | 37.93 | 33.50 | 33.21 | 11.25 | 12.63 | 42.83 | 9.01 | 30.31 | 31.83 | 35.71 | 31.44 |
| Relatively high temperature | 23.20 | 19.96 | 22.88 | 24.80 | 8.48 | 8.14 | 10.27 | 4.09 | 32.77 | 29.28 | 29.25 | 27.09 |
| High temperature | 3.17 | 3.11 | 3.84 | 5.07 | 0.87 | 2.57 | 3.06 | 1.55 | 7.22 | 8.77 | 6.72 | 4.84 |
| Extremely high temperature | 0.16 | 0.29 | 0.40 | 0.40 | 0.00 | 0.01 | 0.30 | 0.03 | 0.77 | 1.03 | 1.18 | 0.64 |
| Category (Temperature Zone) | Shunyi | Tongzhou | Xicheng | |||||||||
| 2004 | 2009 | 2014 | 2019 | 2004 | 2009 | 2014 | 2019 | 2004 | 2009 | 2014 | 2019 | |
| Extremely low temperature | 0.01 | 0.11 | 0.08 | 0.02 | 0.03 | 0.08 | 0.31 | 0.03 | 0.07 | 0.63 | 0.16 | 0.09 |
| Low temperature | 11.78 | 8.96 | 6.00 | 8.96 | 5.29 | 6.53 | 9.89 | 3.75 | 1.58 | 2.54 | 1.86 | 1.27 |
| Relatively low temperature | 48.00 | 36.90 | 45.17 | 37.3 | 43.25 | 29.49 | 40.58 | 34.03 | 3.72 | 11.28 | 5.57 | 4.78 |
| Medium temperature | 30.76 | 34.44 | 27.92 | 29.37 | 36.61 | 37.78 | 29.64 | 38.94 | 25.94 | 43.72 | 30.97 | 21.75 |
| Relatively high temperature | 8.97 | 17.19 | 15.75 | 17.35 | 13.71 | 22.31 | 15.09 | 18.57 | 57.52 | 38.60 | 54.45 | 53.04 |
| High temperature | 0.47 | 1.99 | 3.96 | 6.15 | 1.03 | 3.56 | 3.62 | 3.87 | 11.02 | 3.17 | 6.90 | 17.49 |
| Extremely high temperature | 0.01 | 0.41 | 1.12 | 0.85 | 0.08 | 0.25 | 0.87 | 0.81 | 0.15 | 0.06 | 0.09 | 1.58 |
| First-Level Indicators | Second-Level Indicators | Third-Level Indicators |
|---|---|---|
| Natural factors | Vegetation and water body | FVC |
| MNDWI | ||
| Geomorphology | DEM | |
| Slope | ||
| Human factors | Urban construction intensity | NDISI |
| NTL | ||
| NDBBI | ||
| Albedo | ||
| Socioeconomic activities | Road network density index | |
| POI |
| Index | NDISI | NDIBBI | MNDWI | Slope | DEM | FVC | Albedo | NTL | POI | Road Network Density Index |
|---|---|---|---|---|---|---|---|---|---|---|
| Pearson correlation coefficient | 0.308 ** | 0.706 ** | −0.128 ** | −0.177 ** | −0.295 ** | −0.734 ** | 0.096 * | 0.363 ** | 0.335 ** | 0.434 ** |
| Component | Initial Eigenvalue | The Load Sum of Squares | ||||
|---|---|---|---|---|---|---|
| Eigenvalue | Contribution Rate (%) | Cumulative Contribution Rate (%) | Eigenvalue | Contribution Rate (%) | Cumulative Contribution Rate (%) | |
| 1 | 3.29 | 32.87 | 32.87 | 3.29 | 32.87 | 32.87 |
| 2 | 1.96 | 19.59 | 52.47 | 1.96 | 19.59 | 52.47 |
| 3 | 1.57 | 15.70 | 68.17 | 1.57 | 15.70 | 68.17 |
| 4 | 1.19 | 11.88 | 80.05 | 1.19 | 11.88 | 80.05 |
| 5 | 0.71 | 7.13 | 87.17 | |||
| 6 | 0.53 | 5.31 | 92.48 | |||
| 7 | 0.40 | 4.00 | 96.48 | |||
| 8 | 0.22 | 2.23 | 98.70 | |||
| 9 | 0.11 | 1.15 | 99.85 | |||
| 10 | 0.01 | 0.15 | 100 | |||
| 1 | 2 | 3 | 4 | |
|---|---|---|---|---|
| NDISI | 0.247 | 0.238 | −0.146 | 0.057 |
| NDBBI | 0.138 | −0.331 | −0.029 | 0.467 |
| MNDWI | 0.100 | 0.217 | −0.333 | 0.151 |
| Slope | −0.059 | 0.222 | 0.390 | 0.376 |
| DEM | −0.095 | 0.265 | 0.283 | 0.403 |
| FVC | −0.231 | 0.163 | 0.101 | −0.419 |
| Albedo | −0.166 | −0.367 | 0.128 | 0.101 |
| NTL | 0.149 | −0.122 | 0.269 | −0.166 |
| POI | 0.207 | 0.016 | 0.326 | −0.177 |
| Road network density index | 0.235 | −0.024 | 0.256 | −0.221 |
| Impact Factors | Coefficient | Standard Error | T | p |
|---|---|---|---|---|
| Constant | 29.87 *** | 0.07 | 426.47 | 0.000 |
| 1 | 1.70 *** | 0.07 | 24.19 | 0.000 |
| 2 | −1.50 *** | 0.07 | −21.33 | 0.000 |
| 3 | 0.24 *** | 0.07 | 3.38 | 0.001 |
| 4 | 0.71 *** | 0.07 | 10.19 | 0.000 |
| R2 | 0.66 | F | 288.84 | 0.000 |
Publisher’s Note: MDPI stays neutral with regard to jurisdictional claims in published maps and institutional affiliations. |
© 2022 by the authors. Licensee MDPI, Basel, Switzerland. This article is an open access article distributed under the terms and conditions of the Creative Commons Attribution (CC BY) license (https://creativecommons.org/licenses/by/4.0/).
Share and Cite
Ren, Z.; Li, Z.; Wu, F.; Ma, H.; Xu, Z.; Jiang, W.; Wang, S.; Yang, J. Spatiotemporal Evolution of the Urban Thermal Environment Effect and Its Influencing Factors: A Case Study of Beijing, China. ISPRS Int. J. Geo-Inf. 2022, 11, 278. https://doi.org/10.3390/ijgi11050278
Ren Z, Li Z, Wu F, Ma H, Xu Z, Jiang W, Wang S, Yang J. Spatiotemporal Evolution of the Urban Thermal Environment Effect and Its Influencing Factors: A Case Study of Beijing, China. ISPRS International Journal of Geo-Information. 2022; 11(5):278. https://doi.org/10.3390/ijgi11050278
Chicago/Turabian StyleRen, Ziqi, Zhe Li, Feng Wu, Huiqiang Ma, Zhanjun Xu, Wei Jiang, Shaohua Wang, and Jun Yang. 2022. "Spatiotemporal Evolution of the Urban Thermal Environment Effect and Its Influencing Factors: A Case Study of Beijing, China" ISPRS International Journal of Geo-Information 11, no. 5: 278. https://doi.org/10.3390/ijgi11050278