
Quantification of Spatial Association between Commercial and Residential Spaces in Beijing Using Urban Big Data


Abstract
:1. Introduction
2. Materials and Methods
2.1. Materials
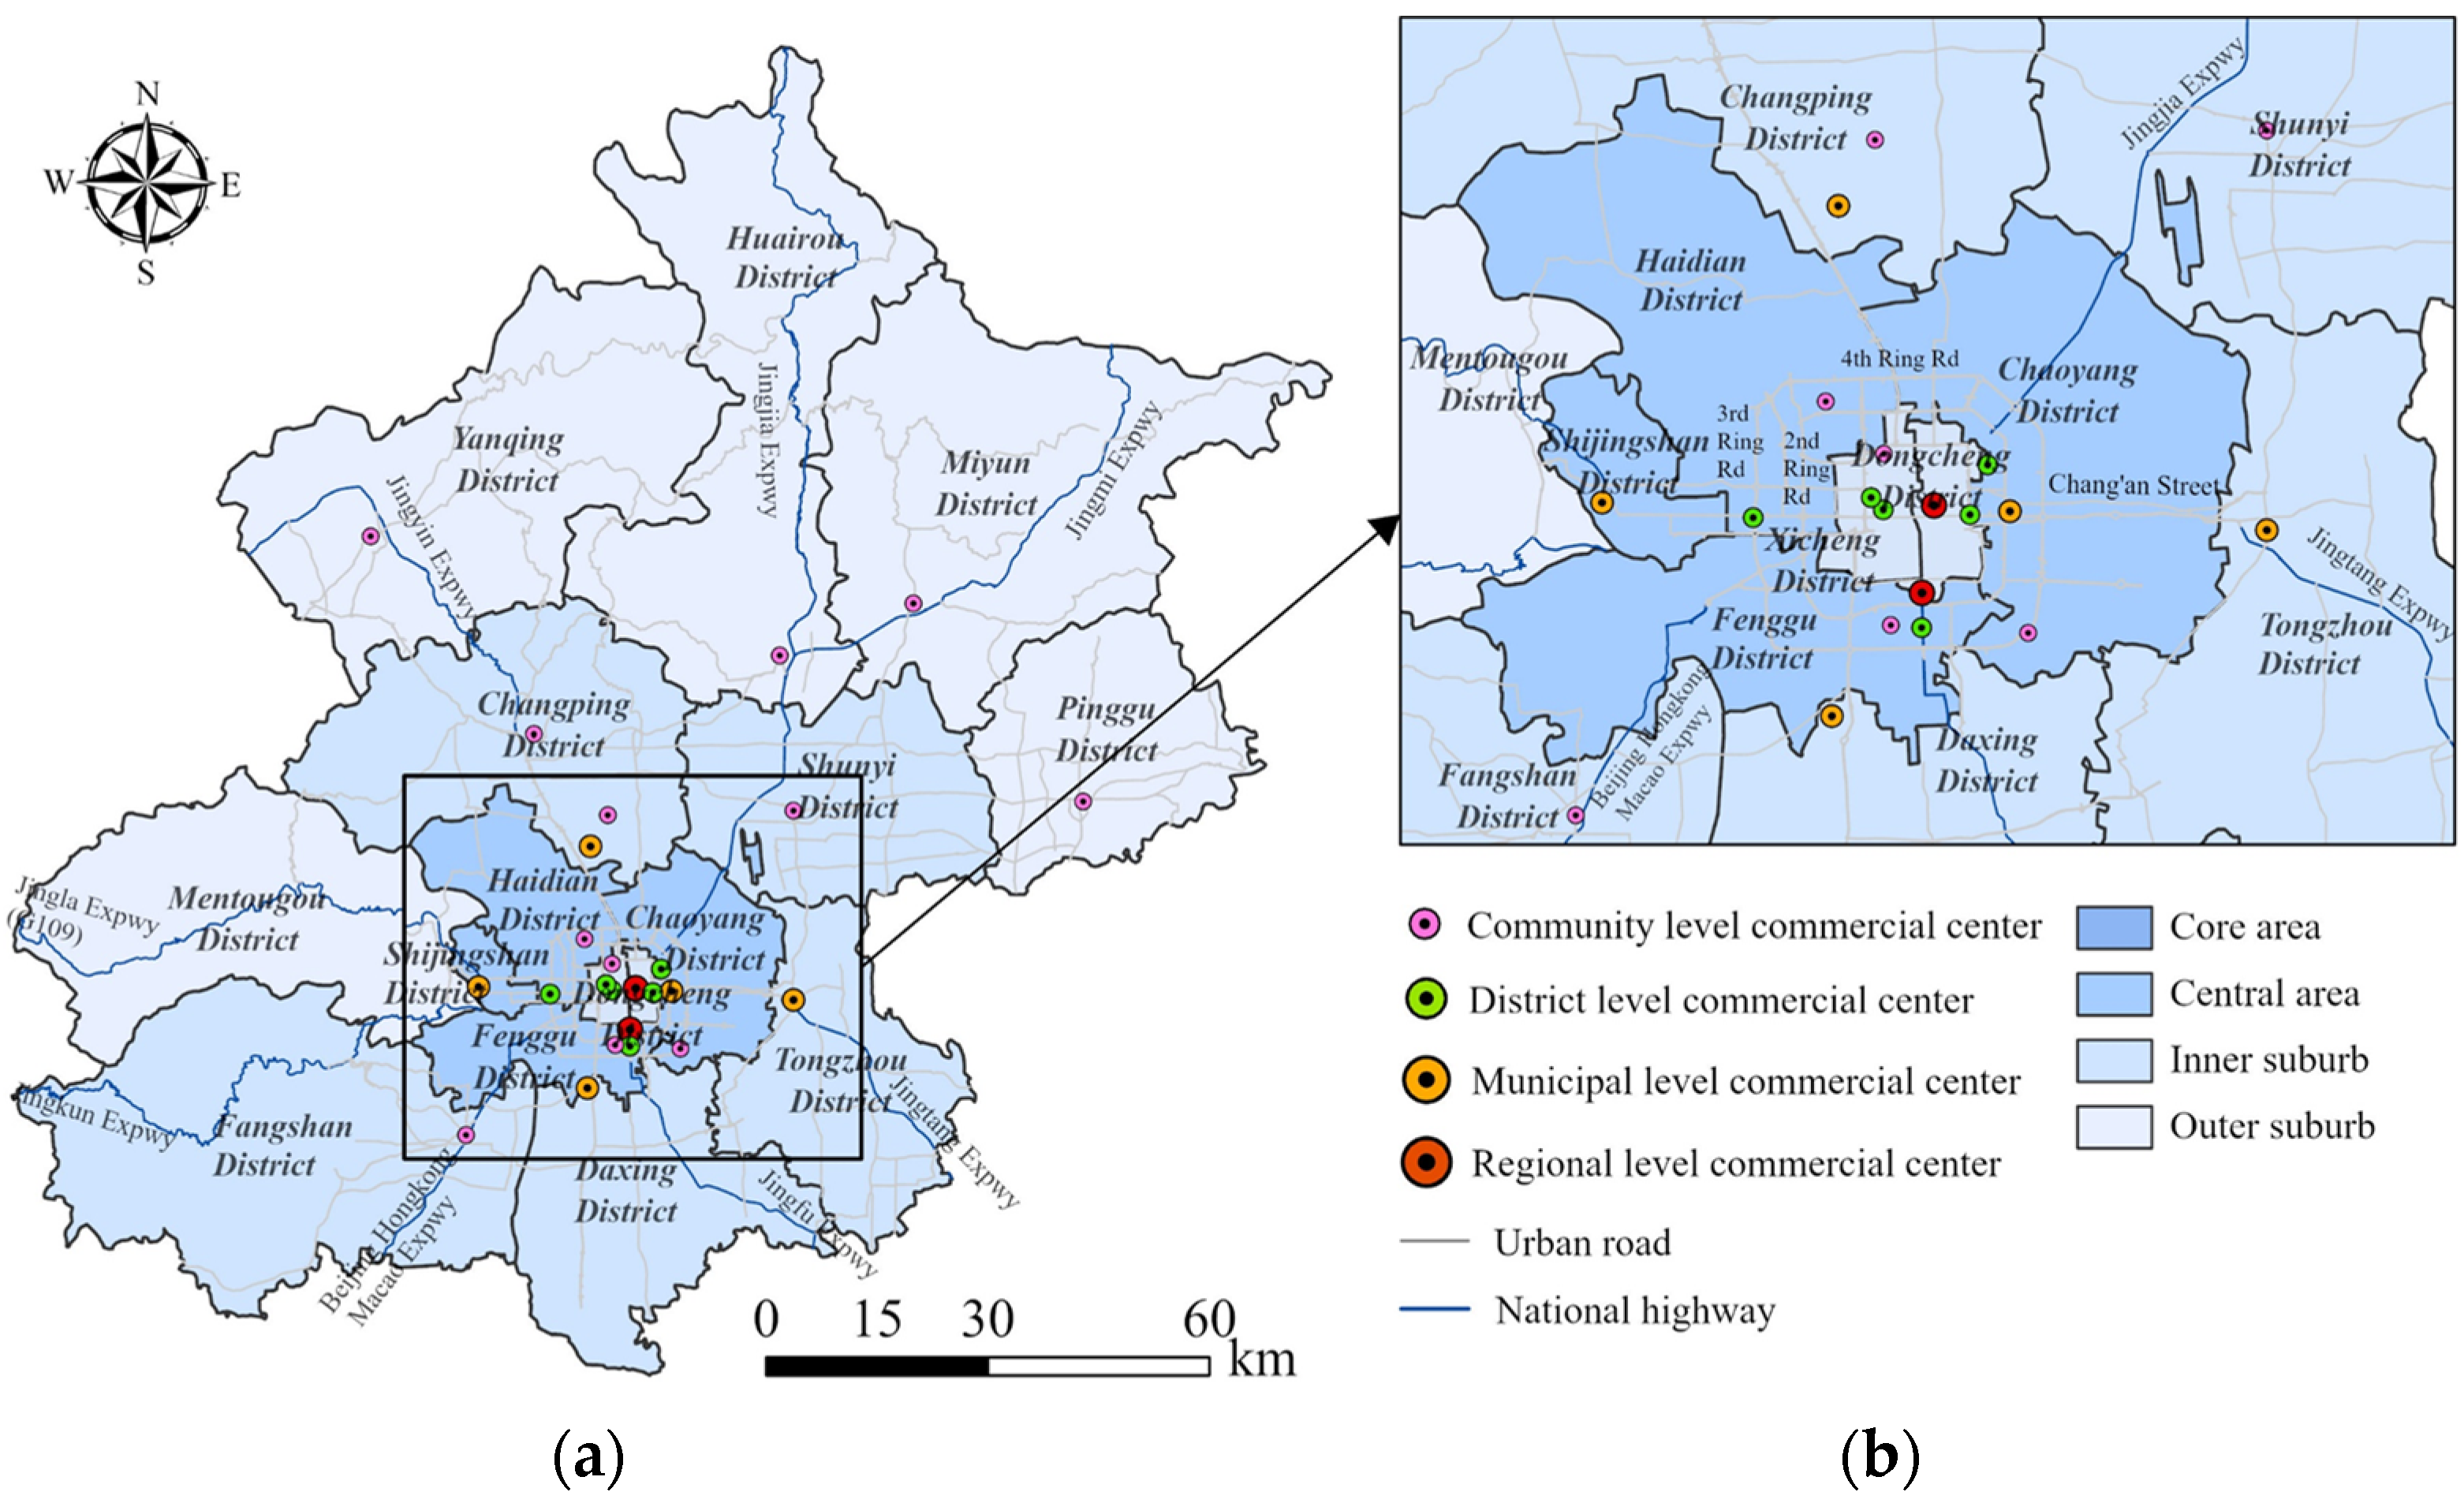
2.1.1. Study Area
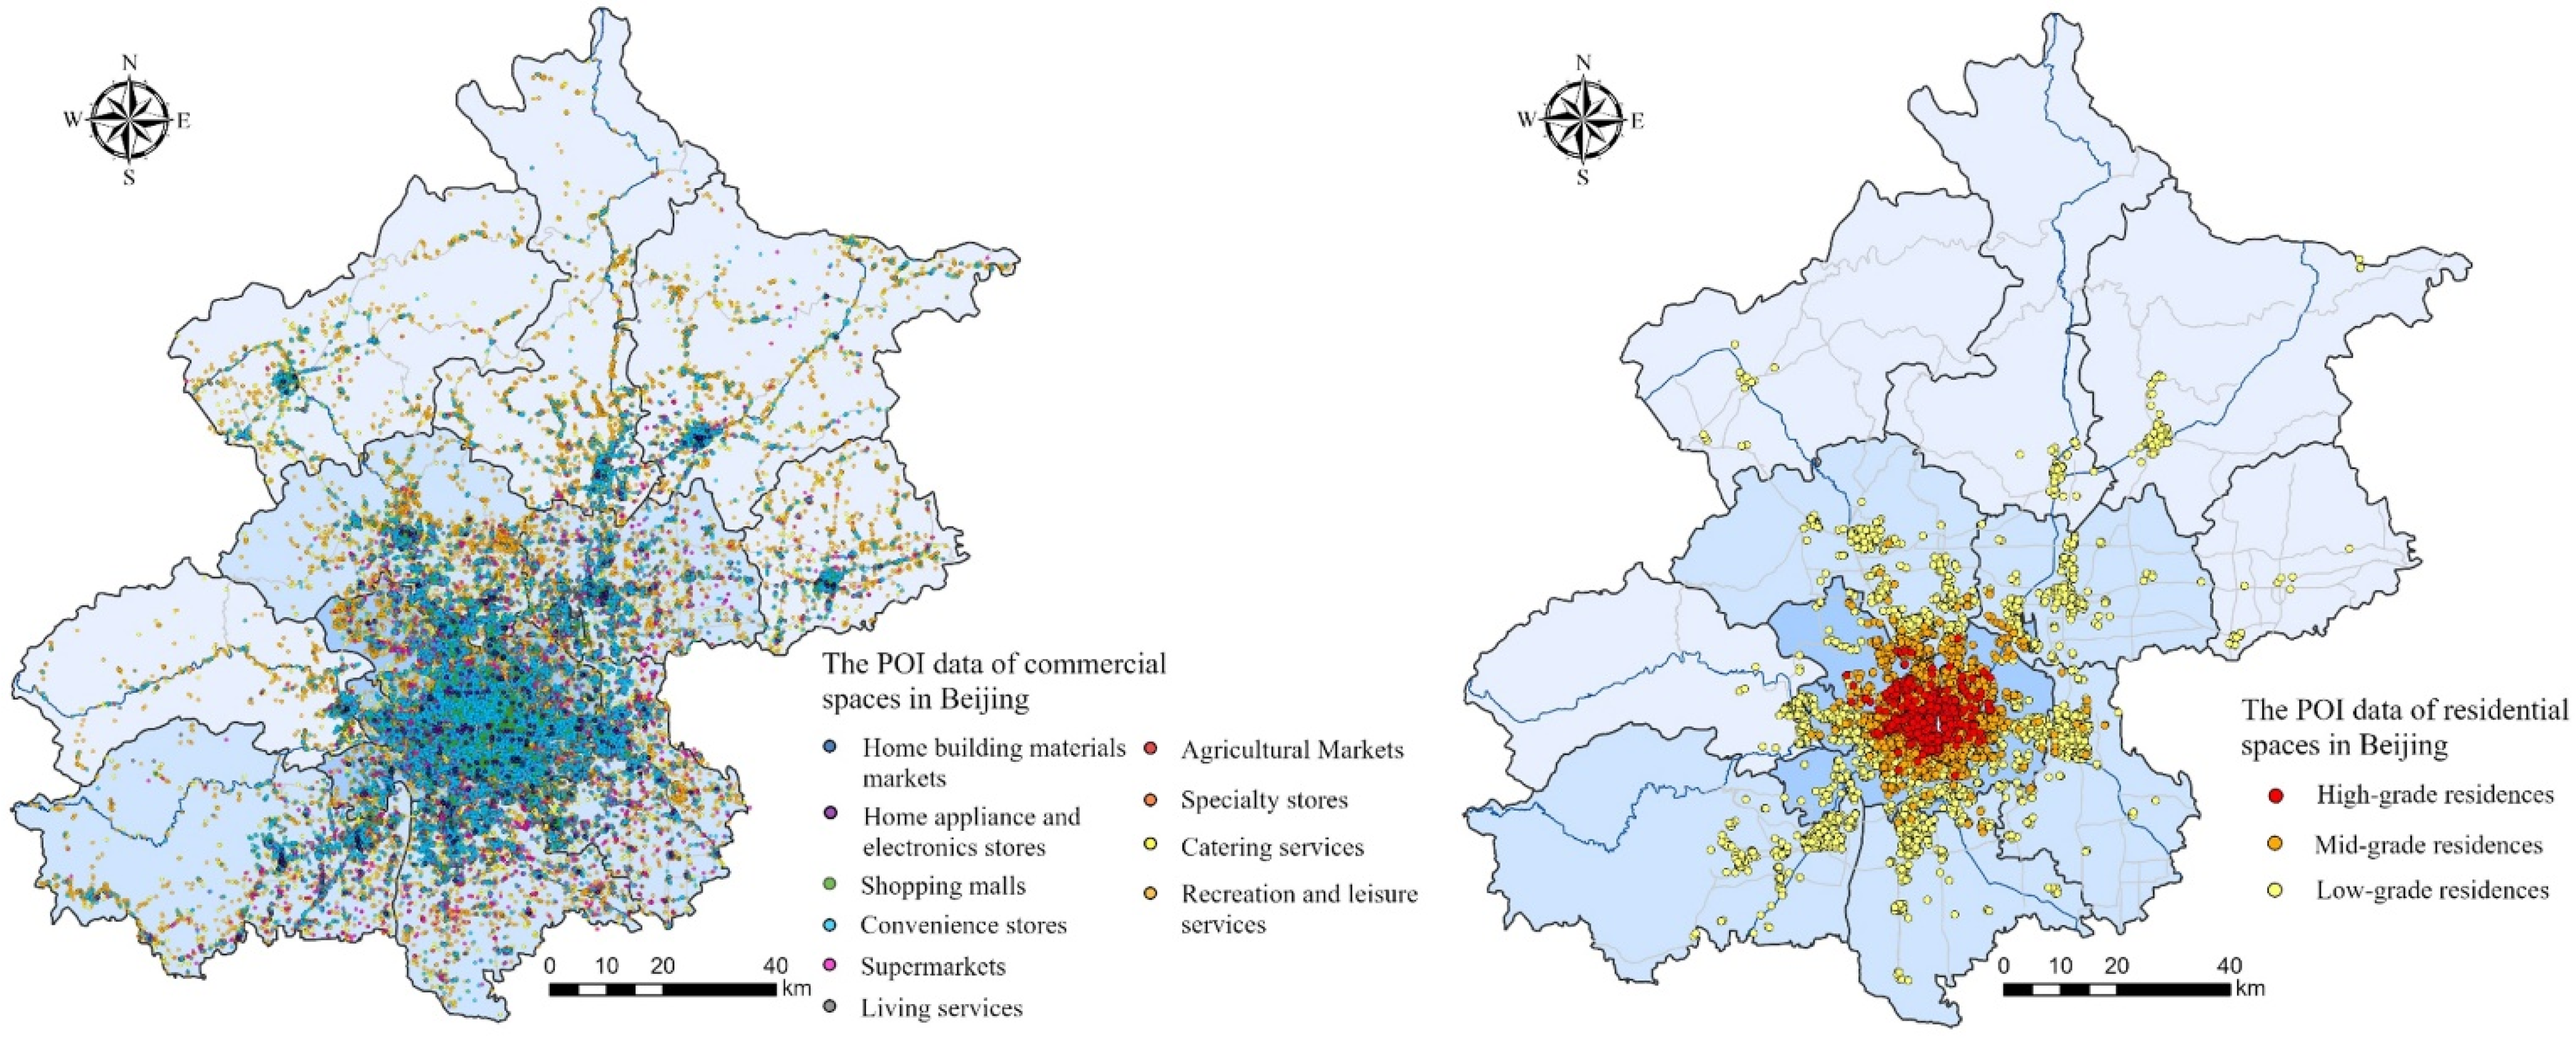
2.1.2. Data
2.2. Methods
2.2.1. Average Nearest Neighbor Distance
2.2.2. Kernel Density Estimation
2.2.3. Spatial Correlation
2.2.4. Honeycomb Grid Analysis
3. Spatial Structure of Commercial and Residential Spaces
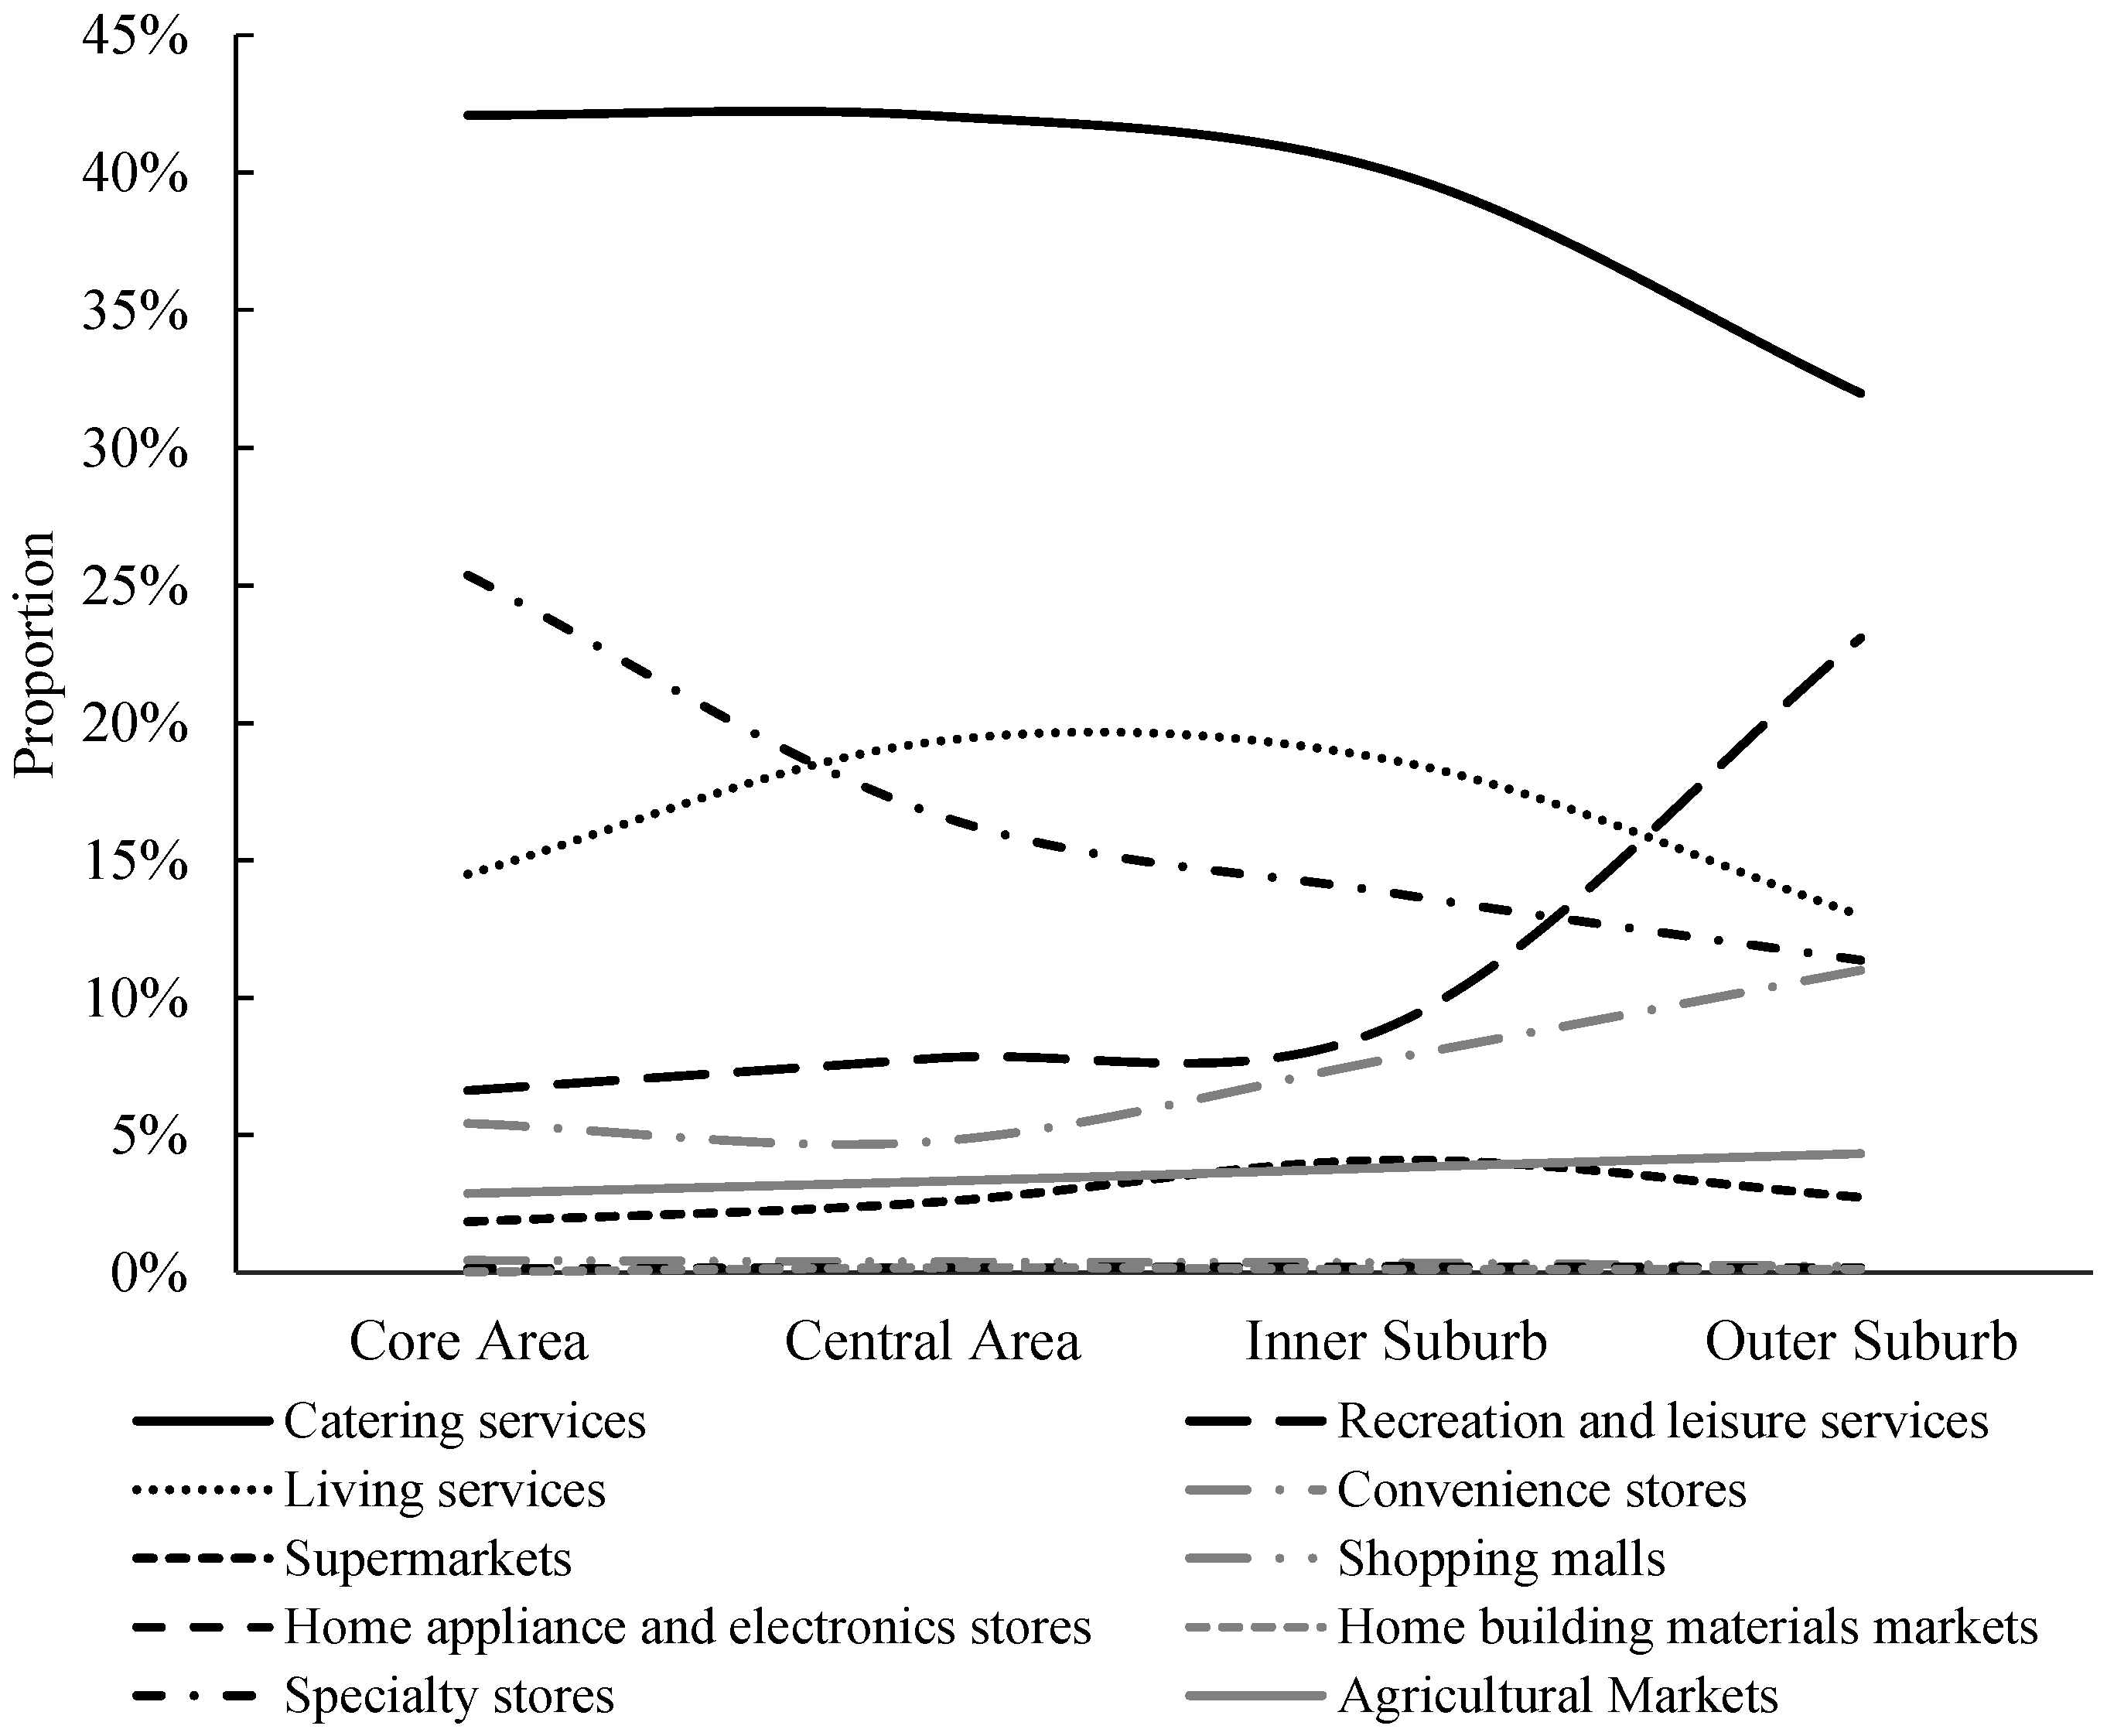
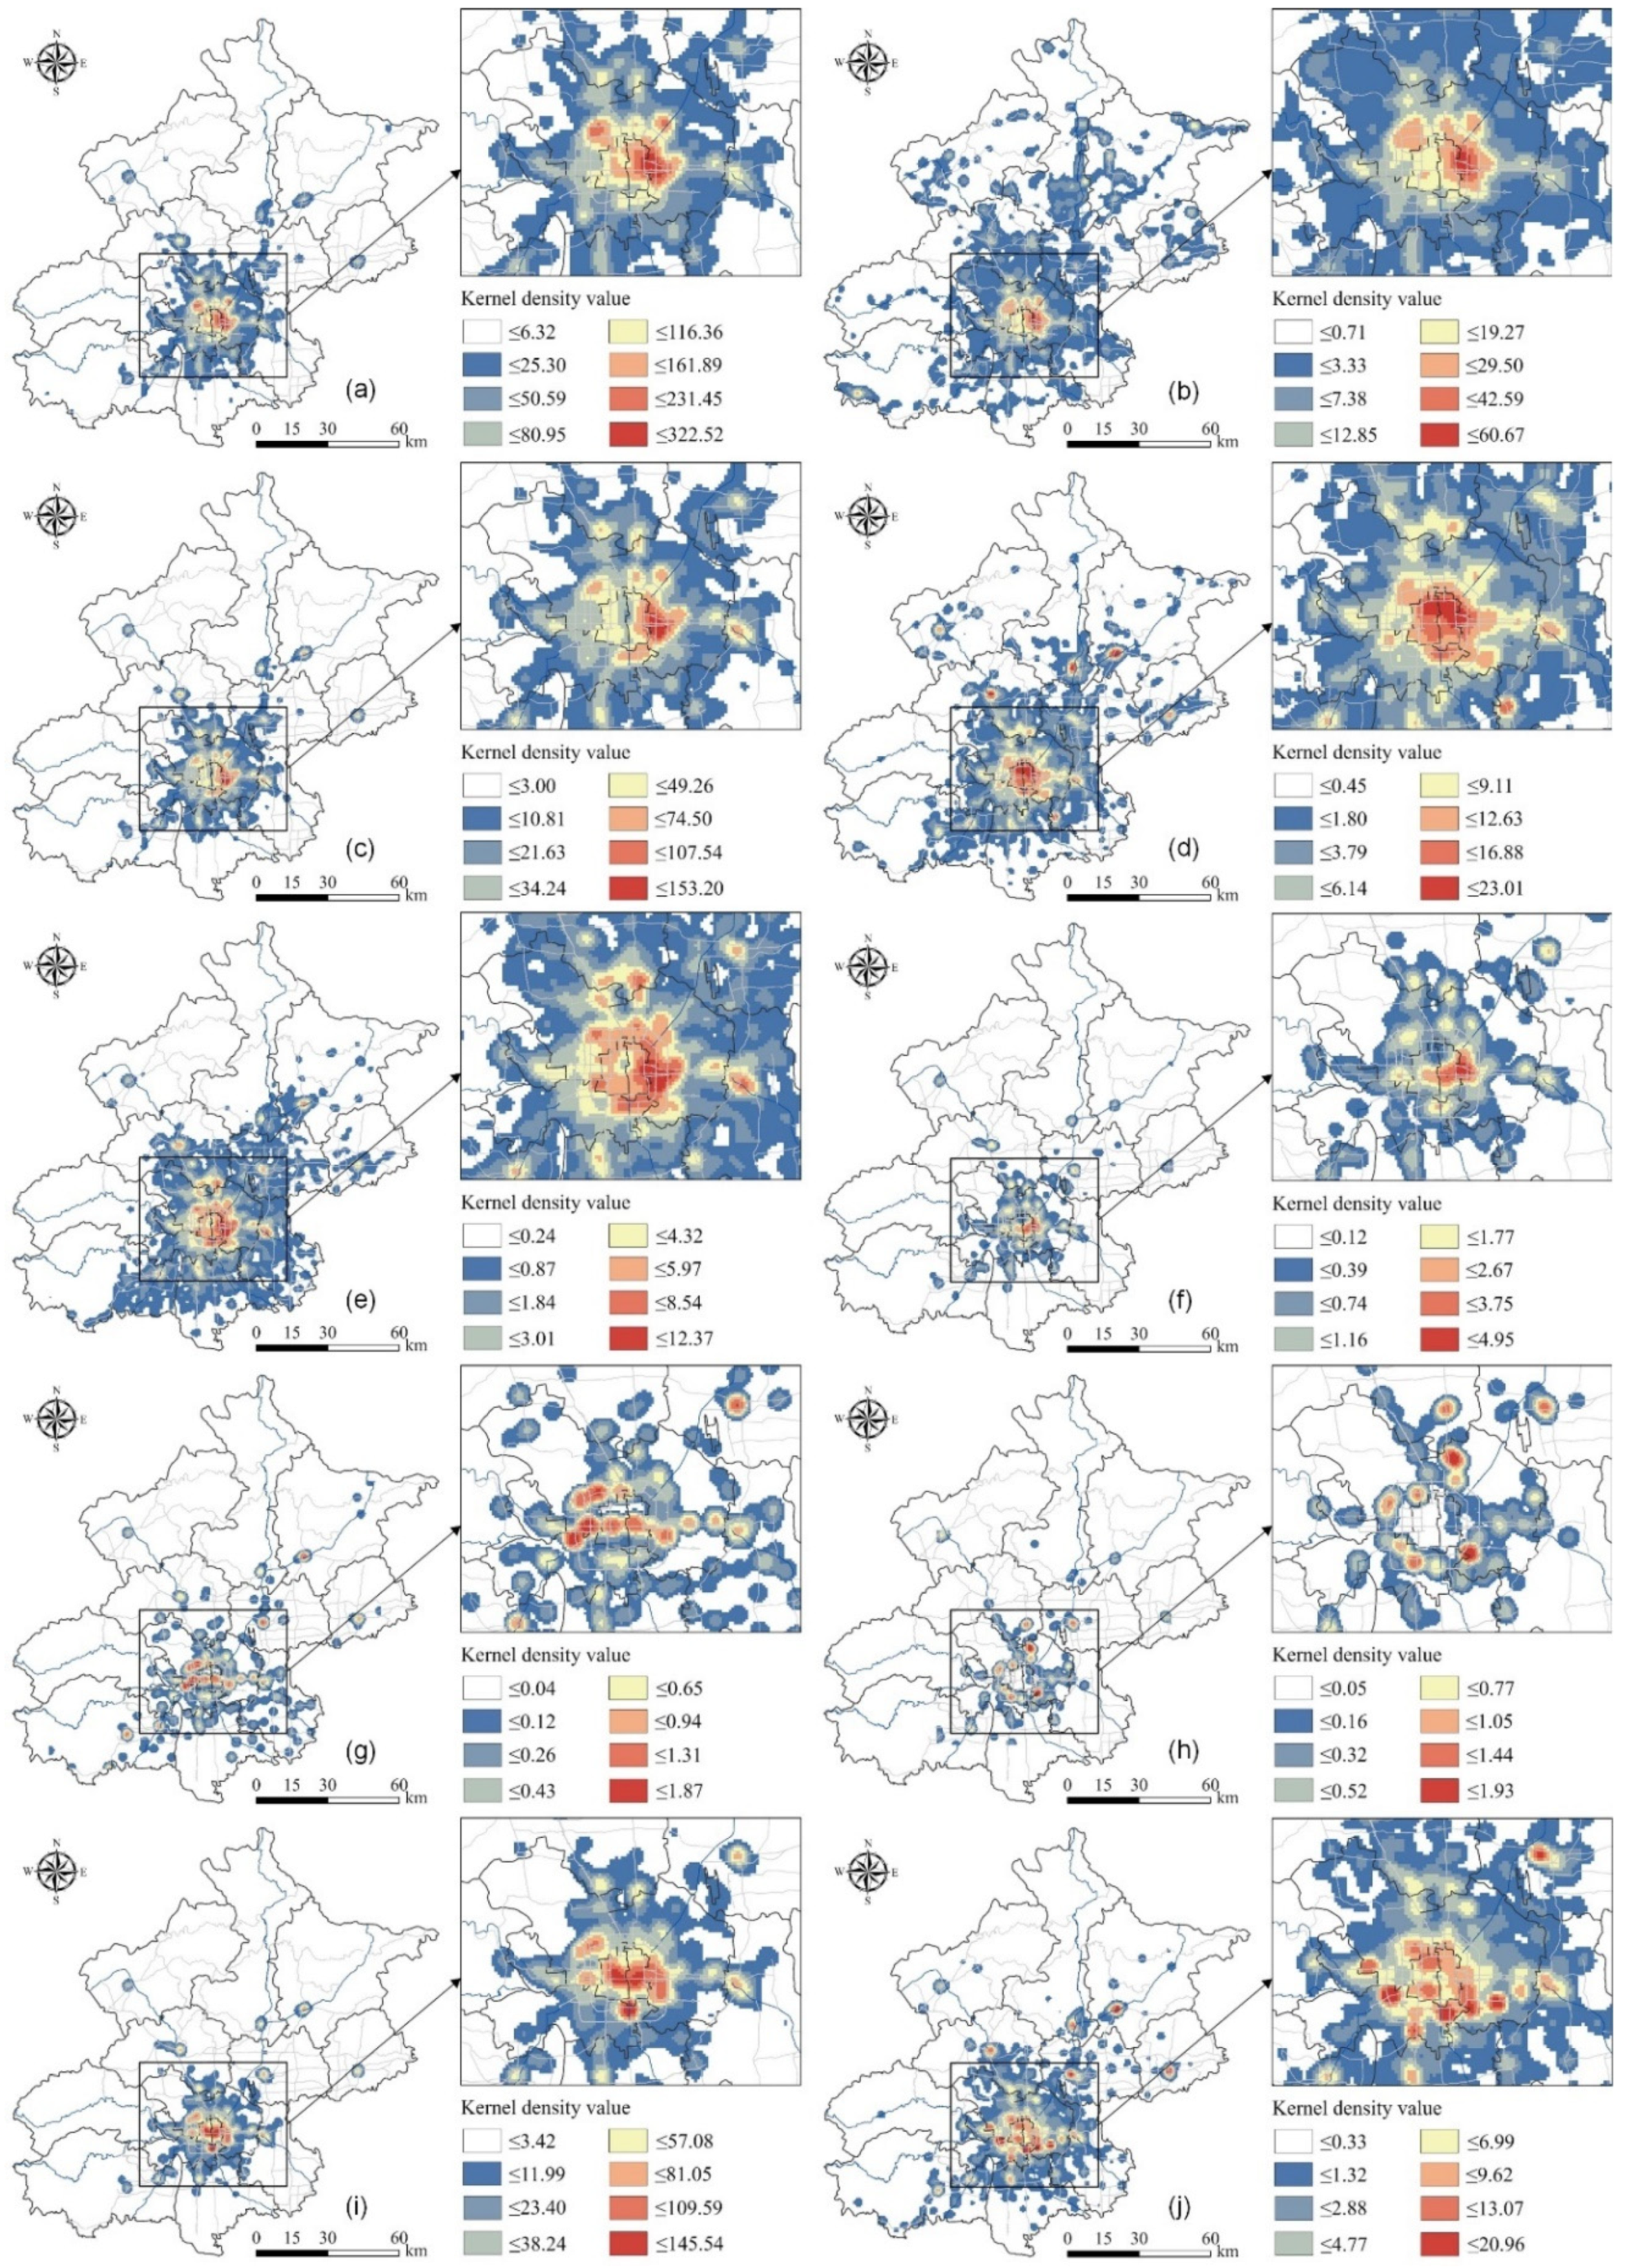
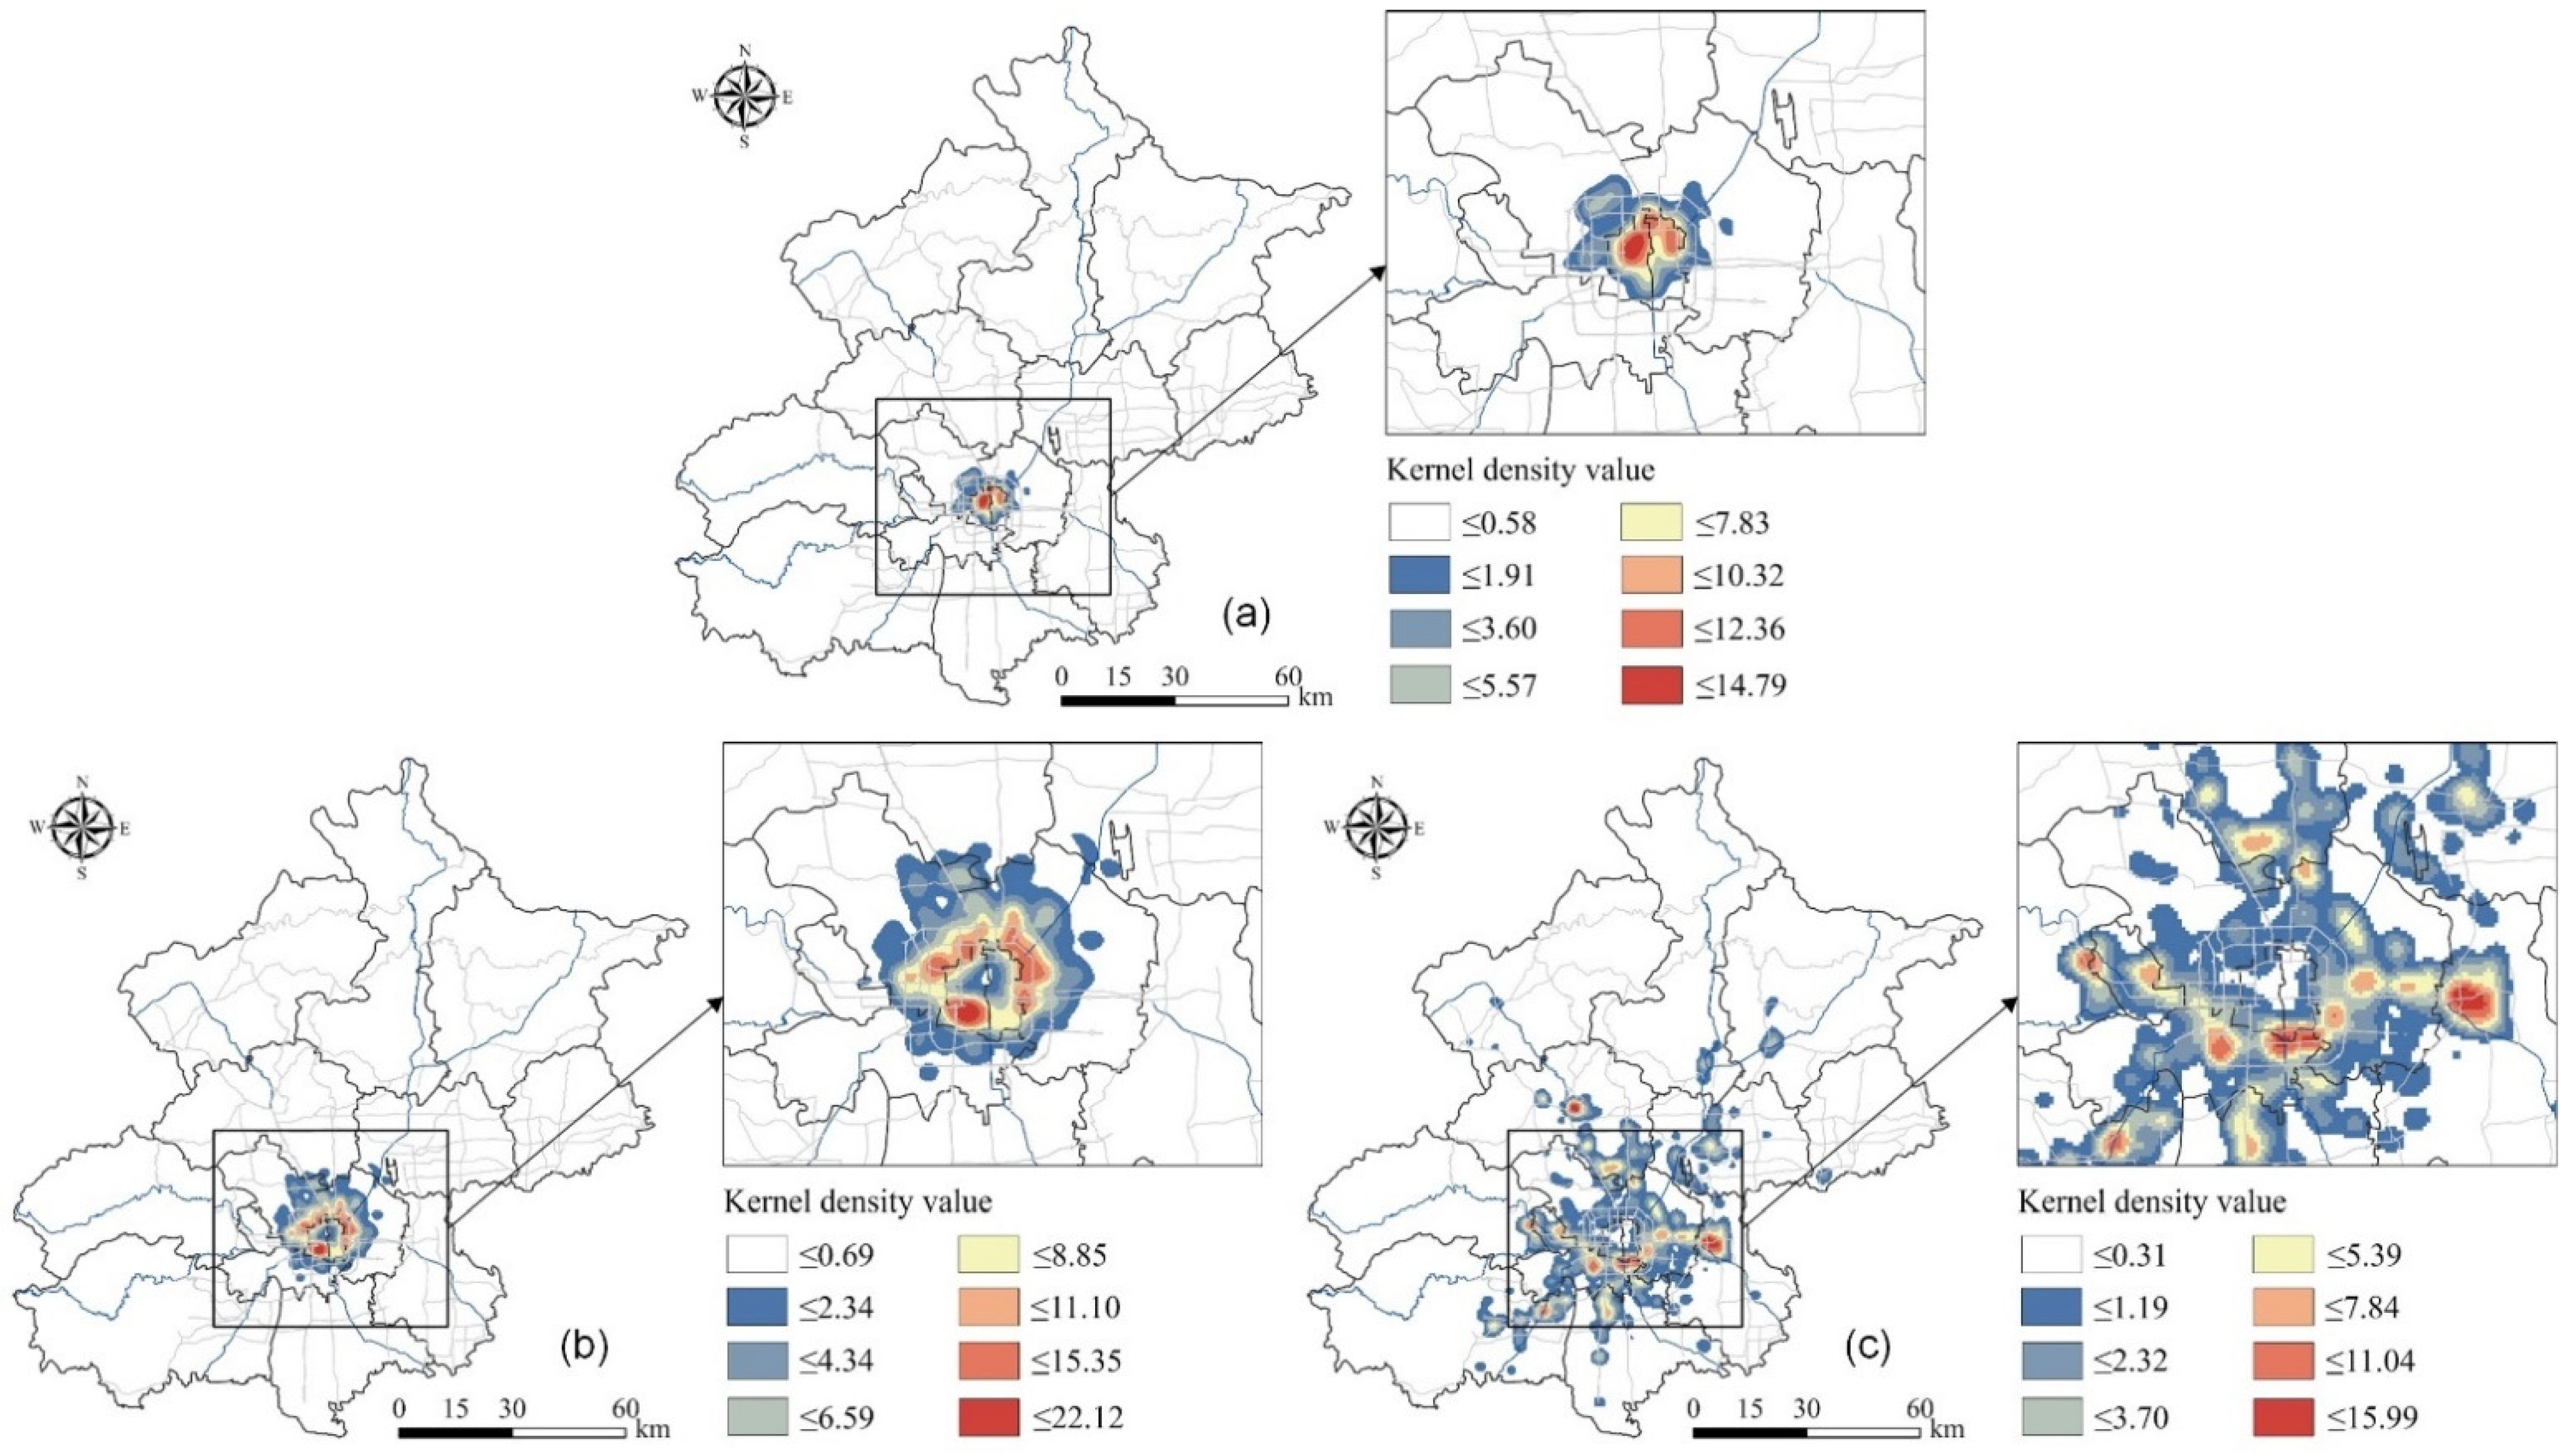
3.1. Spatial Distribution Characteristics
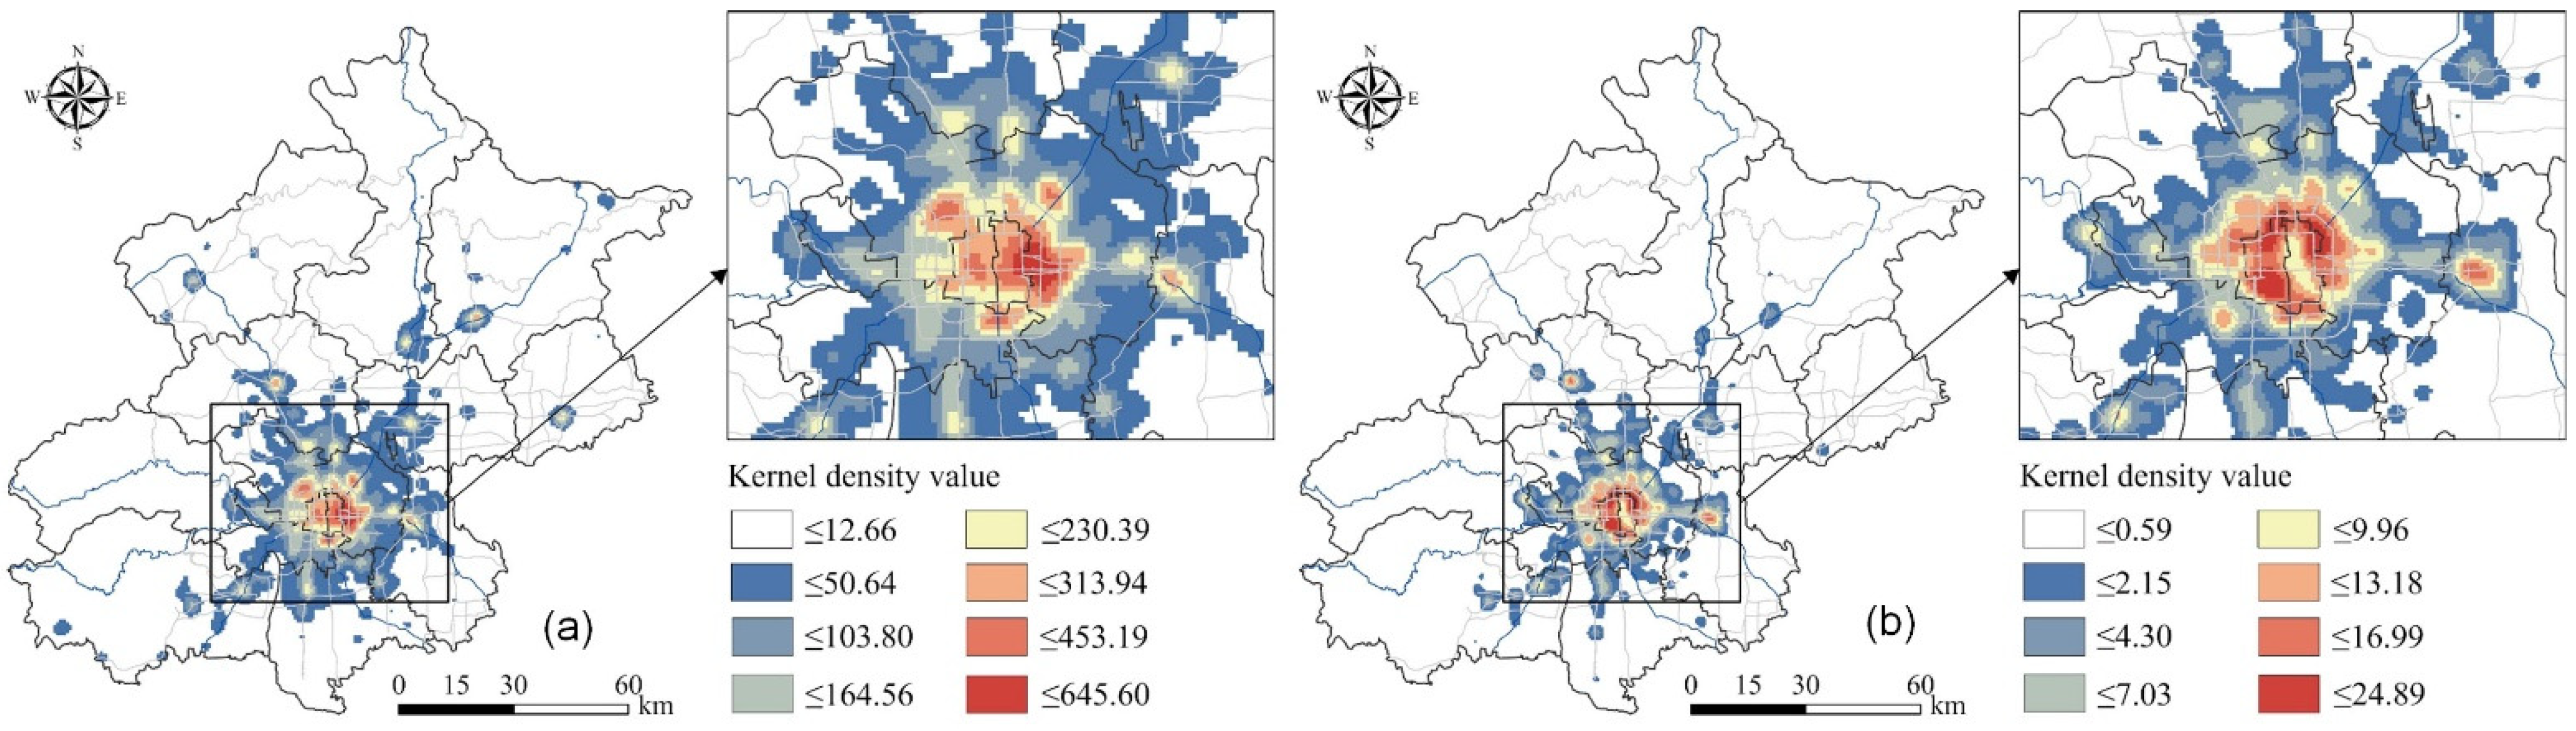
3.2. Spatial Clustering Characteristics
4. Association Relationship between Commercial and Residential Spaces
4.1. Spatial Correlation of Commercial and Residential Spaces
4.2. Association Degree of Commercial and Residential Spaces
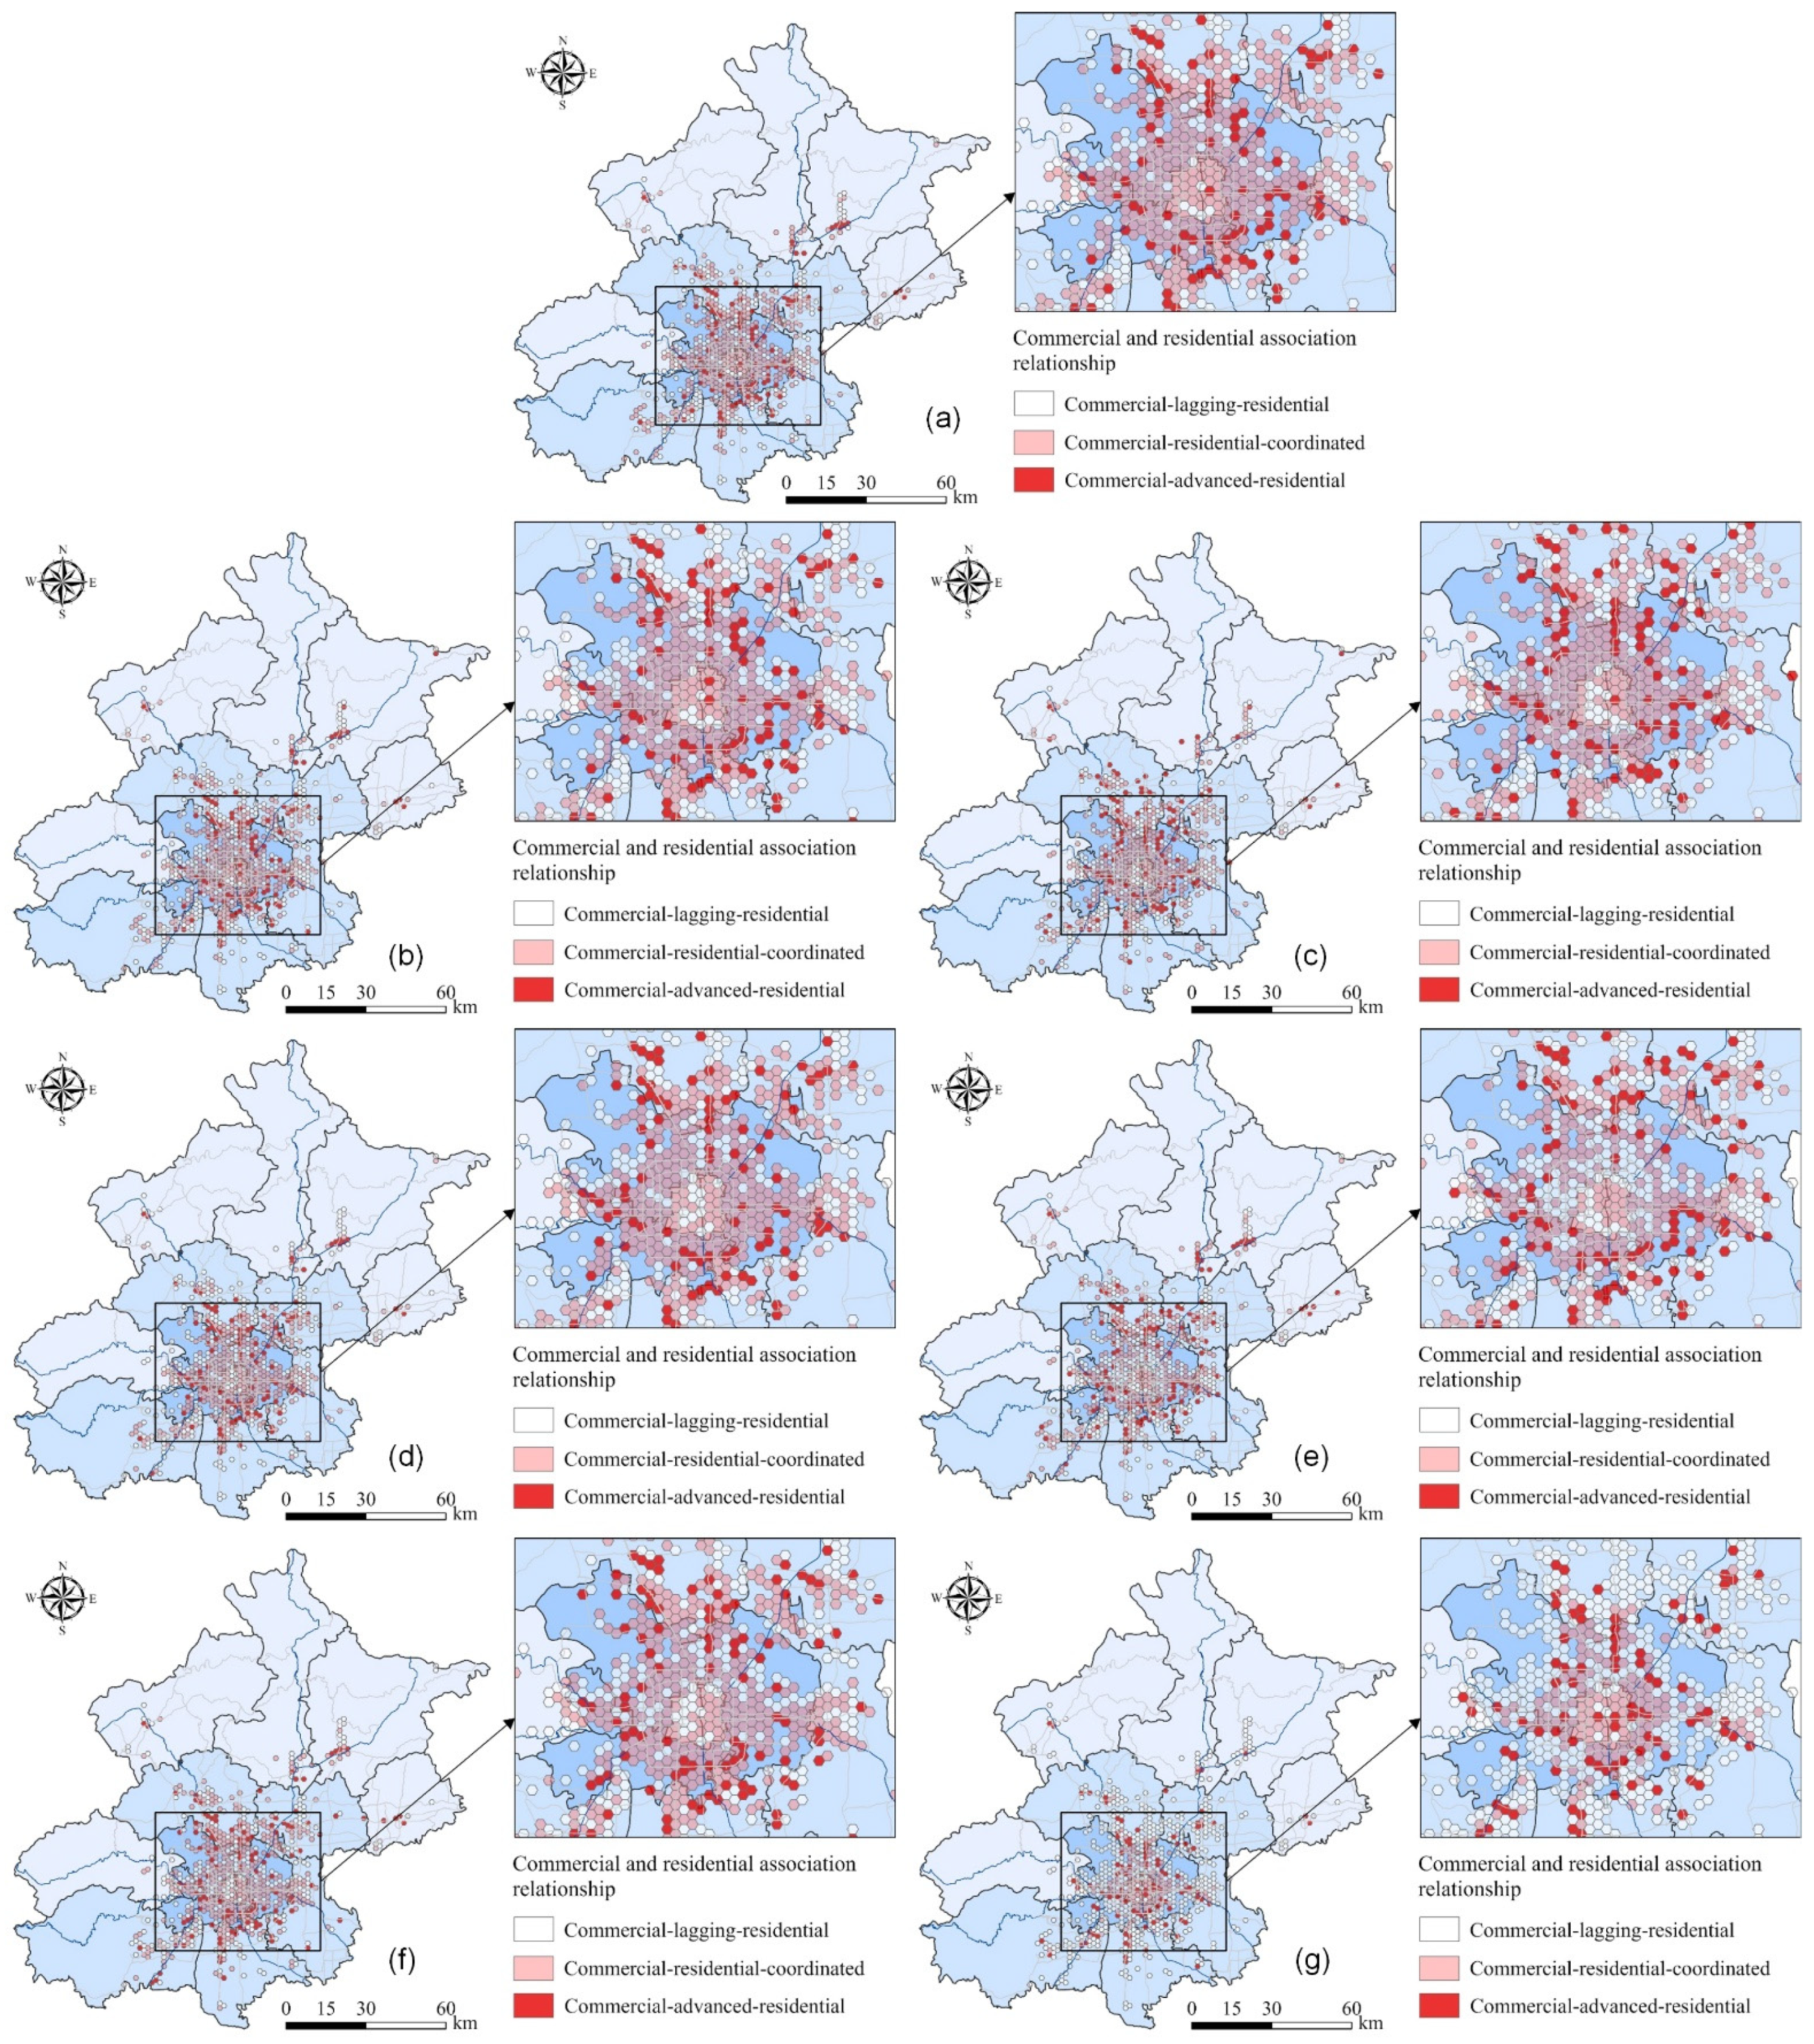
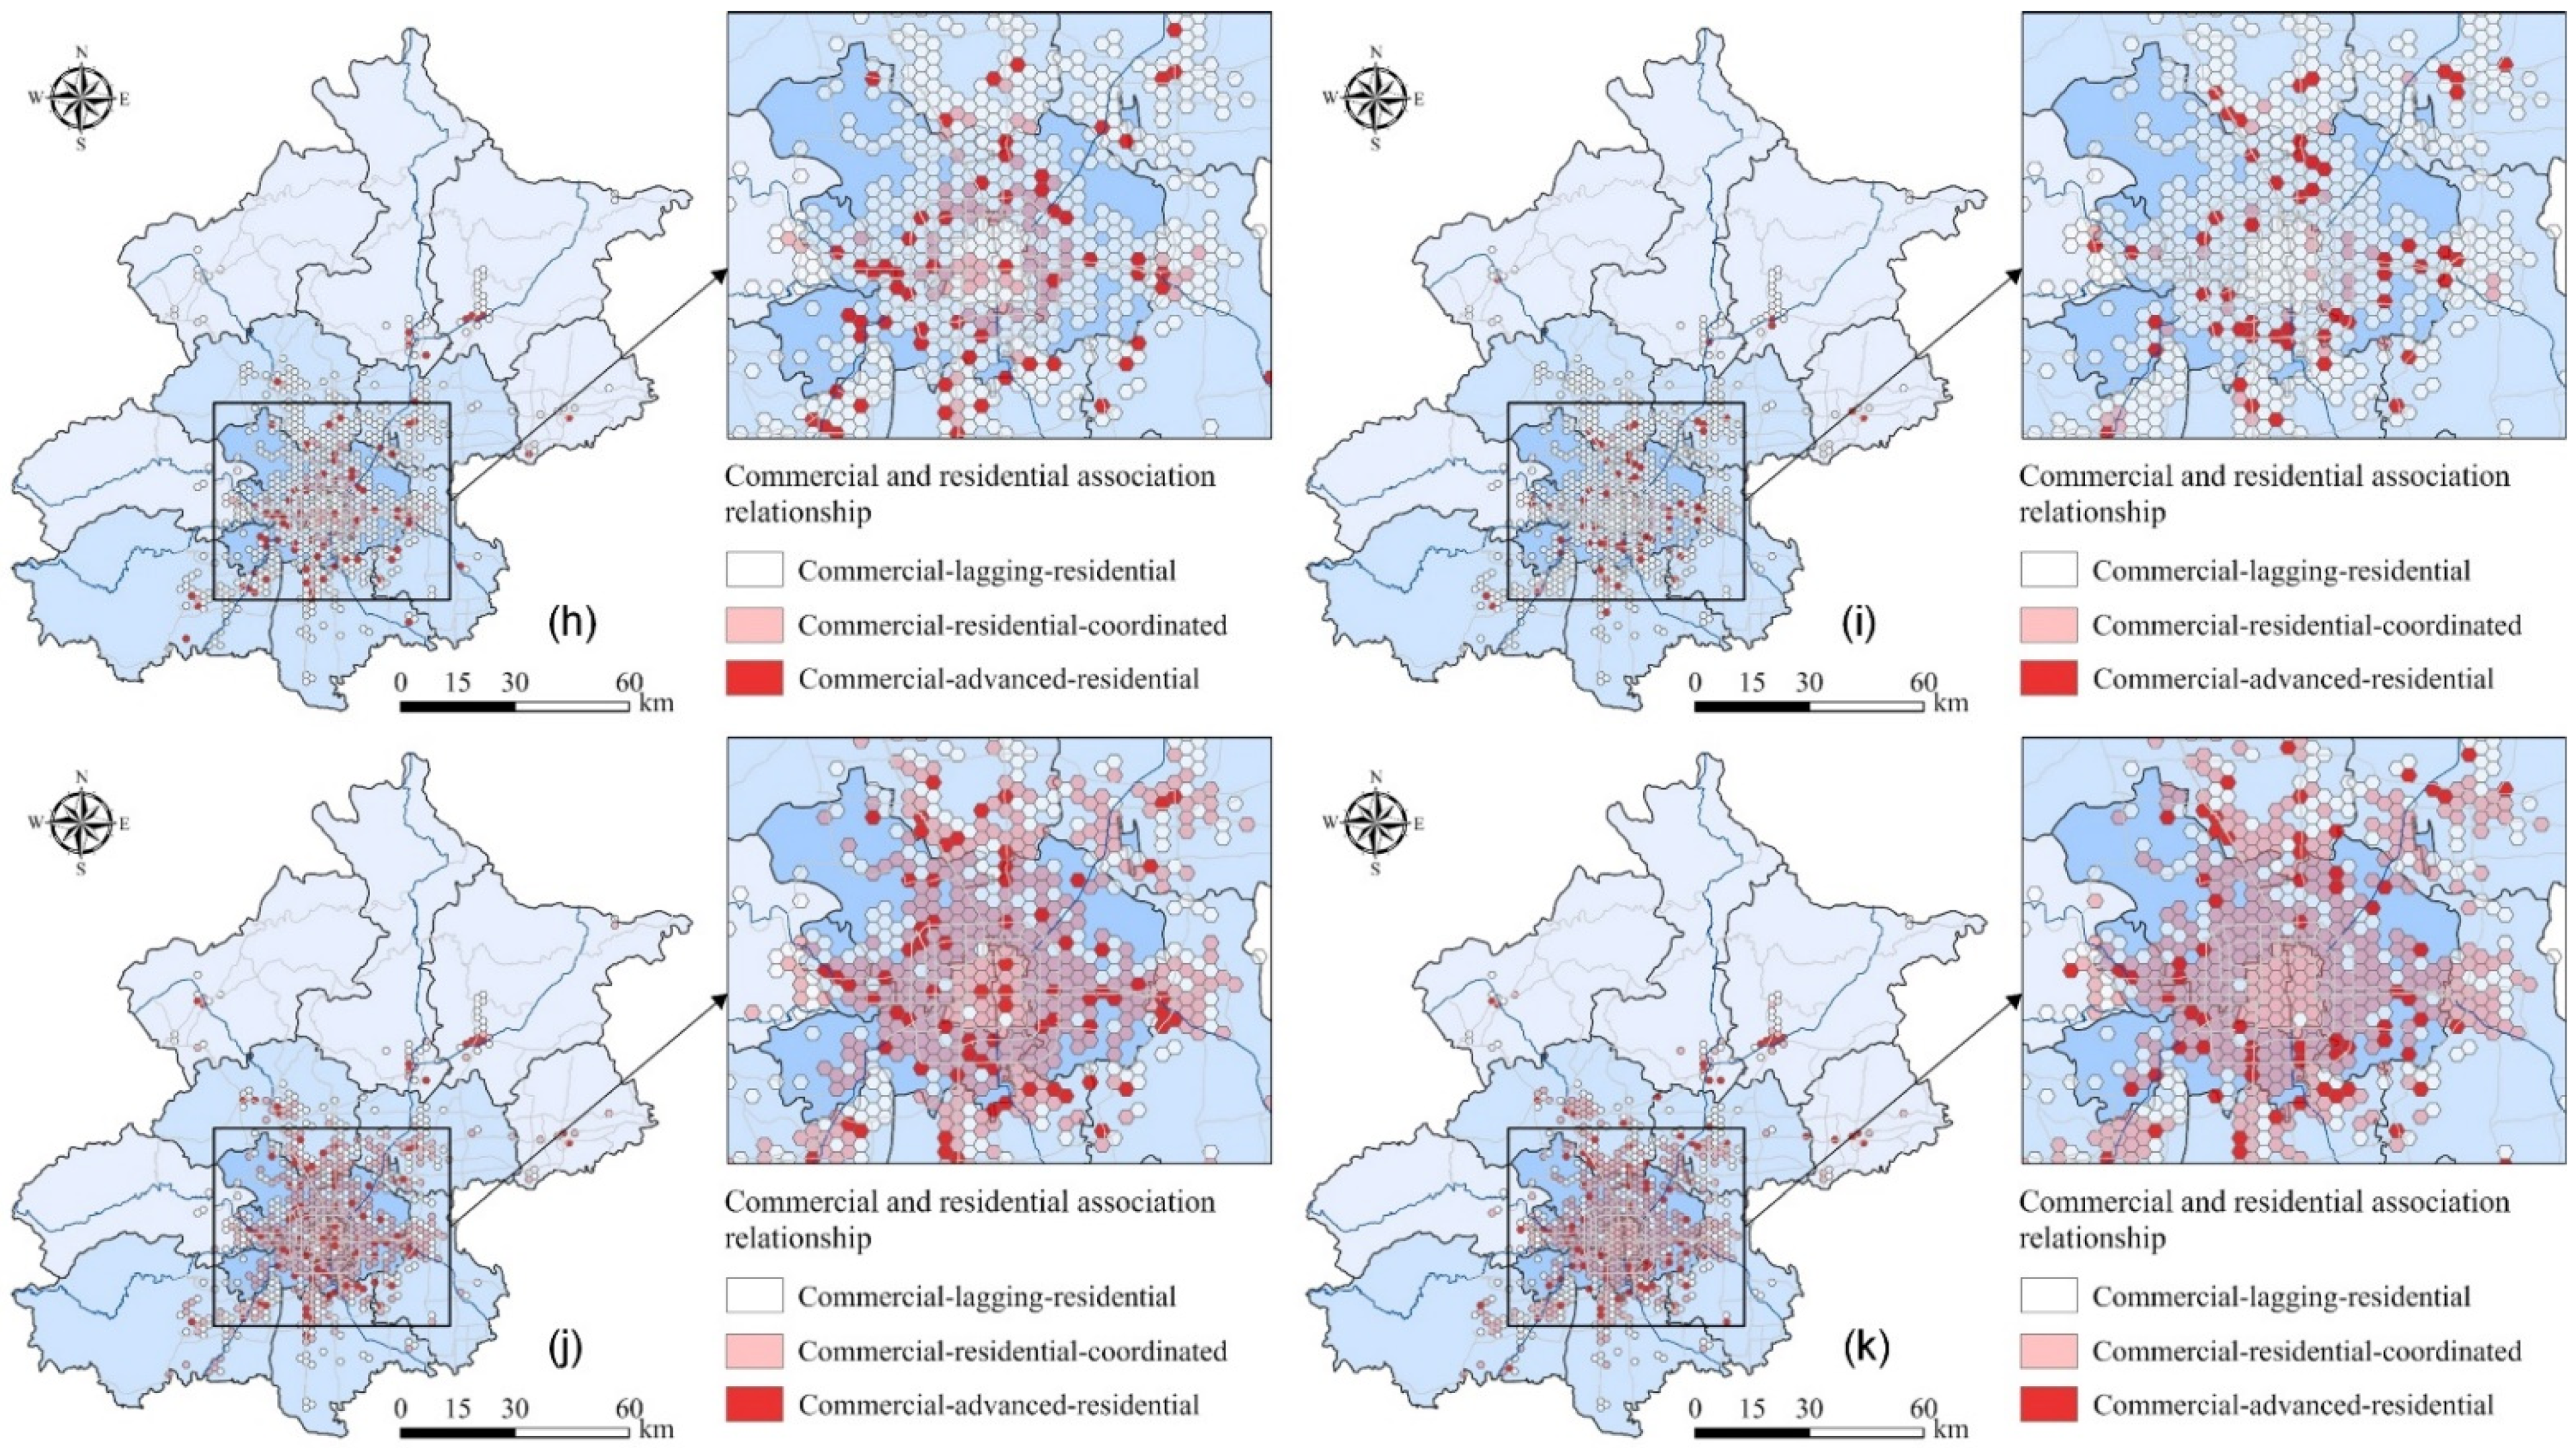
4.3. Association Type of Commercial and Residential Spaces
5. Discussion and Conclusions
Author Contributions
Funding
Data Availability Statement
Acknowledgments
Conflicts of Interest
References
- Bell, D. The hospitable city: Social relations in commercial spaces. Prog. Hum. Geogr. 2007, 31, 7–22. [Google Scholar] [CrossRef]
- Zhou, S.; Lin, G.; Yan, X. The relationship among consumer’s travel behavior, urban commercial and residential spatial structure in Guangzhou, China. Acta Geogr. Sin. 2008, 63, 395–404. [Google Scholar]
- Kobashi, T.; Choi, Y.; Hirano, Y.; Yamagata, Y.; Say, K. Rapid rise of decarbonization potentials of photovoltaics plus electric vehicles in residential houses over commercial districts. Appl. Energy 2022, 306, 118142. [Google Scholar] [CrossRef]
- Oosterbaan, C.; Arku, G.; Asiedu, A.B. Conversion of residential units to commercial spaces in Accra, Ghana: A policy dilemma. Int. Plan. Stud. 2012, 17, 45–66. [Google Scholar] [CrossRef]
- Francke, M.K.; Van de Minne, A. The hierarchical repeat sales model for granular commercial real estate and residential price indices. J. Real Estate Financ. 2017, 55, 511–532. [Google Scholar] [CrossRef]
- Zhang, W.; Li, W.; Zhang, C.; Hanink, D.M.; Liu, Y.; Zhai, R. Analyzing horizontal and vertical urban expansions in three East Asian megacities with the SS-coMCRF model. Landsc. Urban Plan. 2018, 177, 114–127. [Google Scholar] [CrossRef]
- Na, J.; Zhu, J.; Zheng, J.; Di, S.; Ding, H.; Ma, L. Cellular automata based land-use change simulation considering spatio-temporal influence heterogeneity of light rail transit construction: A case in Nanjing, China. ISPRS Int. J. Geo-Inf. 2021, 10, 308. [Google Scholar] [CrossRef]
- Zhao, J.; Xiao, Y.; Sun, S.; Sang, W.; Axmacher, J.C. Does China’s increasing coupling of ‘urban population’ and ‘urban area’ growth indicators reflect a growing social and economic sustainability? J. Environ. Manag. 2022, 301, 113932. [Google Scholar] [CrossRef] [PubMed]
- Weltevreden, J.W.J. Substitution or Complementarity? How the Internet Changes City Centre Shopping. J. Retail. Consum. Serv. 2007, 14, 192–207. [Google Scholar] [CrossRef]
- Farag, S.; Schwanen, T.; Dijst, M.; Faber, J. Shopping online and/or in store? A structural equation model of the relationships between e-shopping and in-store shopping. Transp. Res. A Policy Pract. 2007, 41, 125–141. [Google Scholar] [CrossRef] [Green Version]
- Zeng, W.; Li, L.; Huang, Y. Industrial collaborative agglomeration, marketization, and green innovation: Evidence from China’s provincial panel data. J. Clean. Prod. 2021, 279, 123598. [Google Scholar] [CrossRef]
- Liu, X.; Zhen, F.; Zhang, M.; Xi, G. Research review of online shopping impact on personal travel and urban retail space and implications. Prog. Geogr. 2015, 34, 48–54. [Google Scholar]
- Pang, R.; Zhao, Z.; Wang, W.; Yang, X. The spatial layout of residence since the reform of housing system in Changchun. Sci. Geogr. Sin. 2013, 33, 435–442. [Google Scholar]
- Jiang, L.; Feng, C. The study of residential differentiation in Changsha based on the social-spatial perspective. Econ. Geogr. 2015, 35, 78–86. [Google Scholar]
- Zhou, C.; Luo, R.; Dai, D. Evolution and mechanism of the residential spatial structure from 2000 to 2010 in Guangzhou. Geogr. Res. 2015, 34, 1109–1124. [Google Scholar]
- Shen, Q.; Li, C.; Liu, Z.; Hu, S.; Liu, Q. Spatial pattern of public service facilities space and living space in Changchun. Geogr. Res. 2018, 37, 2249–2258. [Google Scholar]
- Zhou, S.; Hao, X.; Liu, L. Validation of spatial decay law caused by urban commercial center’s mutual attraction in polycentric city: Spatio-temporal data mining of floating cars’ GPS data in Shenzhen. Acta Geogr. Sin. 2014, 69, 1810–1820. [Google Scholar]
- Li, Y.; Chen, X. Spatio-temporal evolution and spatial agglomeration of Harbin commercial center. Geogr. Res. 2017, 36, 1377–1385. [Google Scholar]
- Wang, D.; Wang, C.; Xie, D.; Zhong, W.; Wu, M.; Zhu, W.; Zhou, J.; Li, Y. Comparison of retail trade areas of retail centers with different hierarchical levels: A case study of east Nanjing Road, Wujiaochang, Anshan Road in Shanghai. Urban Plan. Forum 2015, 223, 50–60. [Google Scholar]
- Wu, K.; Zhang, H.; Wang, Y.; Wu, Q.; Ye, Y. Identify of the multiple types of commercial center in Guangzhou and its spatial pattern. Prog. Geogr. 2016, 35, 963–974. [Google Scholar]
- Wang, F.; Gao, X.; Xu, Z. Identification and classification of urban commercial districts at block scale. Geogr. Res. 2015, 34, 1125–1134. [Google Scholar]
- Gobillon, L.; Selod, H.; Zenou, Y. The mechanisms of spatial mismatch. Urban Stud. 2007, 44, 2401–2427. [Google Scholar] [CrossRef] [Green Version]
- Zhou, J.; Wang, Y.; Cao, G.; Wang, S. Jobs-housing balance and development zones in China: A case study of Suzhou industry park. Urban Geogr. 2017, 38, 363–380. [Google Scholar] [CrossRef]
- Lin, G. The relationship between spatial structure of commercial types and real estate in urban central district—A case study of Yuexiu in Guangzhou city. Areal Res. Dev. 2009, 28, 49–56. [Google Scholar]
- Lin, G. Characteristic and transformation of consumer space in a context of residential suburbanization—A case study for Guangzhou. Sci. Geogr. Sin. 2009, 29, 353–359. [Google Scholar]
- Ye, Q.; Cao, S.; Nie, C. Research on the correlativity of urban residential and commercial spatial structure evolution based on GIS—Case of Changsha. Econ. Geogr. 2012, 32, 65–70. [Google Scholar]
- Wu, D.; Zhou, S. The matching pattern of housing-shopping space based on residents’ daily shopping behaviors: A case study of communities in Guangzhou, China. Sci. Geogr. Sin. 2017, 37, 228–235. [Google Scholar]
- Xue, B.; Xiao, X.; Li, J.; Xie, X.; Lu, C.; Ren, W. POI-based spatial correlation of the residences and retail industry in Shenyang city. Sci. Geogr. Sin. 2019, 39, 442–449. [Google Scholar]
- Meltzer, R.; Schuetz, J. Bodegas or Bagel Shops? Neighborhood Differences in Retail and Household Services. Econ. Dev. Q. 2012, 26, 73–94. [Google Scholar] [CrossRef] [Green Version]
- Domínguez, C.S. Retailing establishments: A competitive analysis of commercial formats from the consumers’ profiles and perceptions. J. Retail. Consum. Serv. 2007, 14, 297–308. [Google Scholar] [CrossRef]
- Jiang, S.; Zhang, H.; Wang, H.; Zhou, L.; Tang, G. Using restaurant POI data to explore regional structure of food culture based on cuisine preference. ISPRS Int. J. Geo-Inf. 2021, 10, 38. [Google Scholar] [CrossRef]
- Chen, W.; Liu, L.; Liang, Y. Retail center recognition and spatial aggregating feature analysis of retail formats in Guangzhou based on POl data. Geogr. Res. 2016, 35, 703–716. [Google Scholar]
- Hao, F.; Wang, S.; Feng, Z.; Yu, T.; Ma, L. Spatial pattern and its industrial of commercial space in Changchun based on POI date. Geogr. Res. 2018, 37, 366–378. [Google Scholar]
- Lin, G.; Song, P.; Li, R.; Yang, F. The progress and prospect of commercial geography in the context of consumption society. Hum. Geogr. 2019, 34, 80–89. [Google Scholar]
- Gao, Y.; Yang, Q.; Liang, L.; Zhao, Y. Spatial pattern and influencing factors of retailing industries in Xi’an based on POI data. Sci. Geogr. Sin. 2020, 40, 710–719. [Google Scholar]
- Liu, Z.; Liu, S. Polycentric development and the role of urban polycentric planning in China’s mega cities: An examination of Beijing’s metropolitan area. Sustainability 2018, 10, 1588. [Google Scholar] [CrossRef] [Green Version]
- Do Carvalhal Monteiro, R.L.; Pereira, V.; Costa, H.G. A multicriteria approach to the human development index classification. Soc. Indic. Res. 2018, 136, 417–438. [Google Scholar] [CrossRef]
- Mitchell, A. The ESRI Guide to GIS Analysis, Volume 2: Spatial Measurements and Statistics; ESRI Press: Redlands, CA, USA, 2005. [Google Scholar]
- Getis, A.; Ord, J.K. The analysis of spatial association by use of distance statistics. Geogr. Anal. 1992, 24, 189–206. [Google Scholar] [CrossRef]
- Wang, D.; Fang, B.; Li, X. Evolution and mechanism analysis of residential-industrial spatial association in Yangzhou city in recent 100 years. Geogr. Res. 2020, 39, 1295–1310. [Google Scholar]


| Commercial Format | POI Subclasses | Number | Proportion |
|---|---|---|---|
| Catering services | Chinese restaurants, fast food restaurants, tea houses, cafes, pastry bakeries, foreign restaurants, hot pot restaurants | 97,198 | 41.26% |
| Recreation and leisure services | Karaoke television (KTV), bowling alleys, fishing parks, cinemas, ski resorts, golf courses, fitness centers, game centers, skating rinks, agritainment, theaters, amusement parks, multipurpose sports stadiums | 23,361 | 9.92% |
| Living services | Beauty salons, bath and massage facilities, logistics and express delivery facilities, laundries, telecommunication business offices, photography and printing facilities, post offices | 43,144 | 18.32% |
| Convenience stores | / | 15,624 | 6.63% |
| Supermarkets | / | 7202 | 3.06% |
| Shopping malls | / | 882 | 0.37% |
| Home appliance and electronics stores | Comprehensive home appliance stores | 457 | 0.19% |
| Home building materials markets | Fabric markets, lamp and porcelain markets, comprehensive home building material markets | 301 | 0.13% |
| Specialty stores | Personal product stores, sporting goods stores, cultural goods stores, clothing stores, shoe stores, hat and leather goods stores | 38,838 | 16.49% |
| Agricultural markets | / | 8542 | 3.63% |
| Administrative District | Number of Commercial Space POIs | Number of Residential Space POIs | ||||||||||||
|---|---|---|---|---|---|---|---|---|---|---|---|---|---|---|
| Catering Services | Recreation and Leisure Services | Living Services | Convenience Stores | Supermarkets | Shopping Malls | Home Appliance and Electronics Stores | Home Building Materials Markets | Specialty Stores | Agricultural Markets | High-Grade Residences | Mid-Grade Residences | Low-Grade Residences | ||
| Core area | Dongcheng | 5386 | 841 | 1761 | 634 | 228 | 61 | 16 | 2 | 2908 | 284 | 206 | 377 | 27 |
| Xicheng | 5387 | 856 | 1951 | 756 | 244 | 54 | 23 | 0 | 3585 | 455 | 440 | 361 | 19 | |
| Central area | Haidian | 12,227 | 2538 | 4746 | 1285 | 707 | 101 | 66 | 31 | 5331 | 873 | 145 | 928 | 169 |
| Chaoyang | 25,213 | 4577 | 11,616 | 2620 | 1432 | 238 | 75 | 100 | 8738 | 1659 | 43 | 772 | 653 | |
| Fengtai | 7819 | 1241 | 4197 | 1150 | 586 | 73 | 54 | 48 | 3700 | 1032 | 5 | 172 | 681 | |
| Shijingshan | 1860 | 376 | 1057 | 290 | 128 | 13 | 9 | 7 | 946 | 153 | 0 | 14 | 181 | |
| Inner suburb | Tongzhou | 6150 | 1219 | 3113 | 1263 | 659 | 46 | 47 | 13 | 2320 | 610 | 0 | 13 | 463 |
| Daxing | 7230 | 1262 | 3275 | 1201 | 711 | 58 | 34 | 13 | 2428 | 563 | 0 | 10 | 383 | |
| Shunyi | 4725 | 1079 | 2447 | 1113 | 594 | 58 | 25 | 20 | 1491 | 563 | 0 | 21 | 238 | |
| Changping | 8840 | 2150 | 3947 | 1582 | 751 | 81 | 24 | 25 | 3032 | 772 | 0 | 16 | 583 | |
| Fangshan | 4223 | 1348 | 1724 | 932 | 466 | 42 | 40 | 14 | 1467 | 474 | 0 | 0 | 363 | |
| Outer suburb | Mentougou | 850 | 451 | 384 | 206 | 48 | 10 | 2 | 1 | 237 | 104 | 0 | 2 | 180 |
| Yanqing | 1352 | 923 | 450 | 438 | 68 | 12 | 4 | 12 | 412 | 110 | 0 | 0 | 15 | |
| Huairou | 2023 | 1933 | 817 | 854 | 173 | 12 | 8 | 4 | 595 | 287 | 0 | 0 | 52 | |
| Miyun | 2449 | 1701 | 989 | 865 | 243 | 12 | 18 | 5 | 988 | 344 | 0 | 0 | 67 | |
| Pinggu | 1464 | 866 | 670 | 435 | 164 | 11 | 12 | 6 | 660 | 259 | 0 | 0 | 19 | |
| Total | 97,198 | 23,361 | 43,144 | 15,624 | 7202 | 882 | 457 | 301 | 38,838 | 8542 | 839 | 2686 | 4093 | |
| Commercial Formats | Average Nearest Neighbor Distance (m) | Nearest Neighbor Ratio | Z Score | p-Value | Clustering Degree Ranking |
|---|---|---|---|---|---|
| Specialty stores | 51.25 | 0.142 | −323.64 | 0.00 | 1 |
| Catering services | 48.50 | 0.194 | −480.88 | 0.00 | 2 |
| Home building materials markets | 551.20 | 0.204 | −26.41 | 0.00 | 3 |
| Living services | 70.06 | 0.224 | −104.12 | 0.00 | 4 |
| Agricultural markets | 182.28 | 0.234 | −135.40 | 0.00 | 5 |
| Shopping malls | 549.16 | 0.284 | −40.70 | 0.00 | 6 |
| Convenience stores | 183.92 | 0.301 | −167.23 | 0.00 | 7 |
| Home appliance and electronics stores | 890.6 | 0.303 | −28.52 | 0.00 | 8 |
| Supermarkets | 299.09 | 0.340 | −107.13 | 0.00 | 9 |
| Recreation and leisure services | 182.47 | 0.358 | −187.58 | 0.00 | 10 |
| Commercial Formats | All Residences | High-Grade Residences | Mid-Grade Residences | Low-Grade Residences |
|---|---|---|---|---|
| All commercial formats | 0.865 | 0.953 | 0.804 | 0.599 |
| Catering services | 0.864 | 0.651 | 0.794 | 0.559 |
| Recreation and leisure services | 0.814 | 0.595 | 0.826 | 0.495 |
| Living services | 0.832 | 0.506 | 0.742 | 0.640 |
| Convenience stores | 0.787 | 0.742 | 0.689 | 0.595 |
| Supermarkets | 0.812 | 0.519 | 0.715 | 0.645 |
| Shopping malls | 0.763 | 0.532 | 0.710 | 0.498 |
| Home appliance and electronics stores | 0.612 | 0.488 | 0.561 | 0.465 |
| Home building materials markets | 0.365 | 0.039 | 0.276 | 0.381 |
| Specialty stores | 0.818 | 0.690 | 0.723 | 0.543 |
| Agricultural markets | 0.721 | 0.575 | 0.608 | 0.616 |
| Commercial Formats | All Residences | High-Grade Residences | Middle-Grade Residences | Low-Grade Residences | |||||
|---|---|---|---|---|---|---|---|---|---|
| 500 m | 1000 m | 500–1000 m Growth Rate | 500 m | 1000 m | 500 m | 1000 m | 500 m | 1000 m | |
| All commercial formats | 91.1% | 98.1% | 7.6% | 99.1% | 100.0% | 97.4% | 99.6% | 89.8% | 97.9% |
| Catering services | 84.0% | 95.5% | 13.7% | 99.1% | 100.0% | 93.4% | 98.9% | 81.7% | 95.3% |
| Recreation and leisure services | 73.4% | 91.6% | 24.9% | 97.6% | 100.0% | 90.8% | 98.5% | 69.0% | 91.1% |
| Living services | 75.2% | 88.2% | 17.3% | 96.7% | 100.0% | 89.1% | 97.1% | 72.1% | 87.6% |
| Convenience stores | 71.0% | 88.4% | 24.5% | 93.4% | 99.0% | 84.0% | 96.4% | 67.6% | 88.0% |
| Supermarkets | 57.3% | 79.1% | 37.9% | 82.9% | 96.1% | 73.1% | 92.3% | 54.3% | 78.3% |
| Shopping malls | 16.8% | 32.2% | 91.1% | 34.6% | 65.7% | 27.2% | 54.0% | 15.3% | 31.8% |
| Home appliance and electronics stores | 7.9% | 18.7% | 136.8% | 11.9% | 35.3% | 10.3% | 28.8% | 7.7% | 18.8% |
| Home building materials markets | 4.2% | 11.6% | 176.2% | 2.8% | 11.8% | 3.7% | 13.9% | 4.5% | 12.2% |
| Specialty stores | 62.5% | 77.5% | 24.0% | 92.4% | 98.0% | 79.9% | 92.0% | 58.7% | 77.0% |
| Agricultural markets | 52.7% | 72.4% | 37.2% | 83.9% | 96.1% | 67.7% | 88.3% | 49.7% | 71.3% |
| Commercial Formats | Commercial-Lagging-Residential | Commercial-Residential-Coordinated | Commercial-Advanced-Residential |
|---|---|---|---|
| All commercial formats | 1.00–9.49 | 9.49–72.68 | 72.68–873.00 |
| Catering services | 1.00–5.28 | 5.28–30.20 | 30.20–416.00 |
| Recreation and leisure services | 1.00–1.89 | 1.89–5.91 | 5.91–77.00 |
| Living services | 1.00–2.84 | 2.84–15.14 | 15.14–209.00 |
| Convenience stores | 1.00–1.87 | 1.87–5.96 | 5.96–45.00 |
| Supermarkets | 1.00–1.48 | 1.48–3.08 | 3.08–19.00 |
| Shopping malls | 1.00–1.02 | 1.02–1.25 | 1.25–8.00 |
| Home appliance and electronics stores | 1.00–1.01 | 1.01–1.14 | 1.14–8.50 |
| Home building materials markets | 1.00–1.01 | 1.01–1.13 | 1.13–6.00 |
| Specialty stores | 1.00–1.60 | 1.60–12.64 | 12.64–169.00 |
| Agricultural markets | 1.00–1.15 | 1.15–4.59 | 4.59–64.50 |
| Commercial Formats | Commercial-Lagging-Residential | Commercial-Residential-Coordinated | Commercial-Advanced-Residential |
|---|---|---|---|
| All commercial formats | 29.46% | 56.20% | 14.34% |
| Catering services | 37.34% | 47.80% | 14.86% |
| Recreation and leisure services | 31.91% | 52.45% | 15.63% |
| Living services | 47.16% | 49.61% | 14.34% |
| Convenience stores | 39.28% | 44.57% | 16.15% |
| Supermarkets | 44.57% | 38.37% | 17.05% |
| Shopping malls | 68.60% | 18.35% | 13.05% |
| Home appliance and electronics stores | 81.27% | 9.04% | 9.69% |
| Home building materials markets | 88.37% | 3.88% | 7.75% |
| Specialty stores | 36.18% | 52.07% | 11.76% |
| Agricultural markets | 31.91% | 56.46% | 11.63% |
Publisher’s Note: MDPI stays neutral with regard to jurisdictional claims in published maps and institutional affiliations. |
© 2022 by the authors. Licensee MDPI, Basel, Switzerland. This article is an open access article distributed under the terms and conditions of the Creative Commons Attribution (CC BY) license (https://creativecommons.org/licenses/by/4.0/).
Share and Cite
Zhou, L.; Liu, M.; Zheng, Z.; Wang, W. Quantification of Spatial Association between Commercial and Residential Spaces in Beijing Using Urban Big Data. ISPRS Int. J. Geo-Inf. 2022, 11, 249. https://doi.org/10.3390/ijgi11040249
Zhou L, Liu M, Zheng Z, Wang W. Quantification of Spatial Association between Commercial and Residential Spaces in Beijing Using Urban Big Data. ISPRS International Journal of Geo-Information. 2022; 11(4):249. https://doi.org/10.3390/ijgi11040249
Chicago/Turabian StyleZhou, Lei, Ming Liu, Zhenlong Zheng, and Wei Wang. 2022. "Quantification of Spatial Association between Commercial and Residential Spaces in Beijing Using Urban Big Data" ISPRS International Journal of Geo-Information 11, no. 4: 249. https://doi.org/10.3390/ijgi11040249