1. Introduction
This research aims to explore low-cost sensor monitoring possibilities of structures, analysing the study case of a bridge beam model in real-time connected to its digital twin through an IoT sensor system.
The use of an RDBMS associated with the BIM model allows the real-time remote control of the structure behaviour. In this first part of the paper, the importance of monitoring in the world of construction, the application of BIM, and the evolution of IoT will be discussed through the analysis of literature.
In
Section 2, the literature relating to the subject of this research and experimentation will be analysed: the union between BIM and IoT for monitoring. The description of the study case will then follow, in which a specially studied method of monitoring through BIM and IoT will be shown.
1.1. Importance and Evolution of Monitoring Techniques
Considering some recent catastrophic events, the field of construction monitoring (of buildings, bridges, and big infrastructures) has become ever more pressing and necessary today. At the same time, structural damage monitoring is a very demanding activity in terms of time and cost [
1].
The definition of structural damage consists of the modification of the structural parameters that could compromise the present or future structural performances of a construction [
2]. In the world of construction, continuous maintenance and repair works are necessary to guarantee the safety of structures. For this reason, visual inspections have been the main building monitoring technique for a long time. But this method is useful only for simple structures [
3] and not for more complex structural configurations.
In this scenario, the automatic observation of the structural behaviour of a building, named Structural Health Monitoring (SHM), is a discipline taken into growing consideration in the world of construction. It consists of a non-destructive in situ monitoring system that allows the real-time control of the state of the considered structure by measuring physical–mechanical parameters [
4]. A recently followed method for SHM is the selection of vibration parameters related to possible damage that could affect the structure but not related to environmental or operational damage [
5]. Advances in surveying technology allowed the adoption of a new approach for HSM consisting of the use of terrestrial laser scanning (TLS), associating a displacement measurement model with the real structure to improve the accuracy of the survey [
6]. More recent studies adopted a motion-capture system (MCS) to measure 3D structural displacements of assigned markers with multiple cameras with a high level of accuracy and sampling rate [
7].
Considering the monitoring of bridges, at the end of the last century, the first experimental applications allowed the measurement of vertical displacements of a bridge structure with a network of fibre optic deformation sensors and electrical inclinometers [
8]. Another diffused monitoring technique for static and dynamic load tests of bridges is the use of a network of strain gauges [
9]. Recent advances in UAV technologies allowed the use of a vision-based approach in SHM for monitoring bridge infrastructures based on the Digital Image Correlation (DIC) technique [
10]. Since BIM is used in the field of construction, it is necessary to involve it in monitoring techniques. In this field, the combination of digital photogrammetry and laser scanning techniques with BIM allows obtaining a good level of precision to analyse small vertical movements of historical bridges [
11]. The spread of the BIM environment in recent years allowed the first experimentations on monitoring data of bridge structures by connecting in situ sensor data acquisition and remote data analysis [
12]. The integration of BIM software and database technology allows the visualisation and the analysis of bridge structures, ensuring the visual warning and monitoring information management of the structure [
13]. The recent application of digital twins (real-time physical model connected with its 3D virtual representation through an automatic flow of data) for bridge structures contributed to providing useful feedback for structural monitoring purposes [
14].
1.2. Monitoring with Building Information Modelling
The introduction of BIM methodology in the world of construction brought a significant change to the way of conceiving the design, analysis, and management of buildings and their installations. The use of BIM, in fact, will be an increasingly fundamental activity in the future of the construction world, truly extending its role from an information manager to a method of managing the whole construction process [
15].
The BIM acronym has two meanings:
Building Information Modelling, today involved in BIM-M (Building Information Modelling and Management), means the methodology related to the management of the building with its elements and parts, considering the whole life cycle of the structure (from the design to the restoration or demolition) using a single 3D model [
15].
Building Information Model, or the 3D model used in BIM management, consists of the digital representation of the construction, its physical features, and its capabilities [
16].
Nowadays, BIM methodology is mainly used for static management of building storage which contains as-built data [
17], as a “limited data source” of design and construction. However, the dynamic use of information is revealing a field of huge interest considering the sector of construction, where the possibility of importing real-time information about the state of various systems will lead to significant benefits [
18].
Besides, the sector of construction seems to be even more interested in the environmental impact of the building industry, and the BIM methodology turns out to be a perfect tool for the development of sustainable construction, thanks to the possibility of making virtual simulations during the design phase [
19].
Considering the analysis of buildings, monitoring structures through BIM technology is essential for all the aspects related to the construction during its lifecycle. In the design phase, for example, the continuous check of the environment that will host the construction is a fundamental help to the correctness of the subsequent construction choices. At the same time, recent studies extended the Industry Foundation Classes (IFC), the main BIM reference standard, for the maintenance management of road infrastructures [
20]. Furthermore, the use of BIM in the design and construction industry plays a strategic role in the development of the collaborative environment of the Spatial Development lifeCycle (SDC) [
21].
In the field of survey operations, recent advances in Geomatics regarding the further development of 3D laser scanning technologies (LIDAR) allowed the extraction of detailed point clouds of construction sites. The obtained data could be integrated with a BIM system [
22] and implemented into a VR (Virtual Reality) environment, easing the analysis of the considered site [
19]. Additionally, the progress of work could be checked step-by-step by comparing survey data with the corresponding BIM model.
1.3. Sensors and Internet of Things for the Monitoring of Buildings
Similarly, considering the world of construction, the evolution of sensors is another important monitoring technology that has been actively developed in recent years. With the help of sensor technology, it is possible to safeguard the safety of workers, tools, and materials of the construction site, avoiding human-induced risks caused by our limited vision possibilities. The use of sensors could relate to a navigation system managed using BIM 3D models that accurately reproduce the construction sites. This approach could avoid risks related to complex and dangerous operations in the construction site (e.g., work with blind spots) [
23]. For this reason, the recent development of real-time safety early warning systems in construction based on “Internet of Things” (IoT) technology has become a fundamental field of research [
24]. Considering, therefore, the importance of monitoring not only the structure but in general (temperature, degradation, number of occupants of a room, opening or closing of doors, etc.) and considering the ever-increasing use of BIM in the construction world, in the present study, we show the application of a distance measurement sensor to a scaled schematic model of a structural frame, remotely linked to its BIM 3D model reconstruction. This experimentation demonstrates the feasibility of a low-cost remote monitoring system based on BIM and IoT technologies. This is an example of what can be achieved through the integration of BIM and IoT devices, and it can be improved and applied on a large scale in order to remotely verify the state of a building emitting an alert in case of a possible collapse of structures. The next paragraph shows how recent studies integrated BIM and IoT technology in the field of structural monitoring. Then, a study case is illustrated. The instrumentations and methodologies used, the encountered problems, the adopted solutions, and the obtained results will then be described in detail.
2. BIM and IoT Integration for the Monitoring of Structures
IoT and BIM merged and supported by proper database systems could provide significant advantages in the control of both individual operations and an entire construction site. The position of the workers could be detected in real time while many activities are carried out simultaneously and at different points of the construction site, each very distant from the others [
25]. The ability to locate people quickly and accurately within an area or a building is also essential for the success of emergency operations. Indoor detection algorithms that can be managed through a BIM interface are also showing their validity in the management of fire emergencies [
26].
Applications of this type can even be used in the case of renovations or expansions of buildings. Manual survey systems are frequently used to obtain data for structural calculations or energy analysis software. However, tools such as laser scanners, optical fibres, or sensors can provide much more accurate information about the health status of the structures or the level of performance of the building. Even more, the full integration of BIM software with structural and energy analysis software allows obtaining more precise results in less time, permitting operators to plan interventions better. An interesting example can be represented by the connection of a BIM model to an IoT platform that allows real-time reading directly on the BIM model using parameters such as the internal temperature of an environment, lighting, and energy consumption. [
27]
The use of sensors interconnected via the web within buildings can, therefore, provide an enormous advantage in identifying critical situations linked to the building’s performance and comfort conditions, both to managers of buildings and the simple user [
16]. Additionally, the integration of deep learning algorithm long short-term memory (LSTM) allows obtaining warning information in the association between sensors and the BIM model [
28].
Therefore, greater control can be obtained for all the aspects and phases concerning the construction of a building and its use over time. The idea of smart buildings equipped with sensor networks and devices that make them responsive to different situations is more realistic today [
29,
30,
31]. For example, an office building could regulate the internal brightness according to the number of occupants or the light coming from outside. The aspect of indoor comfort has been a study object in the experimentation described by Marzouk et al. They proposed a BIM and Wireless Sensor Network (WSN) system that involves Revit DB Link API and Microsoft Access. The sensor’s data were stored in a Microsoft Access relational database and imported in Revit through Revit DB Link [
32]. At the same time, a sensor system mounted on a bridge could signal when one of its pillars no longer has optimal conditions. Finally, a structure, after an earthquake, could communicate if a floor shows damage not immediately visible to a human eye. A case study carried out on the Kish Bank lighthouse precisely concerns the interaction between motion sensors, pressure measurement, and ground vibrations with a digital model of the building. In this way, it shows the importance of the real-time visualisation of the precise phenomena for which timely intervention is essential [
33]. In some works, however, a GUI was created to display the data coming from the sensors in real time. Furthermore, the game engine Unity was used to link these data to the BIM model and to communicate with the database, so there was no direct connection between Revit, the database, and the sensors [
34,
35]. Furthermore, in the context of future smart cities, the use of sensors combined with information management typical for BIM methodology can provide key solutions for solving problems related to fire safety and, more generally, the organisation of intervention teams [
36].
However, research on BIM and IoT integration is still in its infancy and is theoretically proposed in most studies [
37]. Most current studies are only about integrating BIM and IoT devices without dwelling on sharing information across a network. Furthermore, in most of the studies and experiments, a real-time update of the visualisation of the BIM model based on the data received from IoT devices is missing [
38]. In this field of research, tests have been recently carried out integrating BIM and IoT sensors for the management and analysis of bridge structures [
39].
3. Materials and Methods
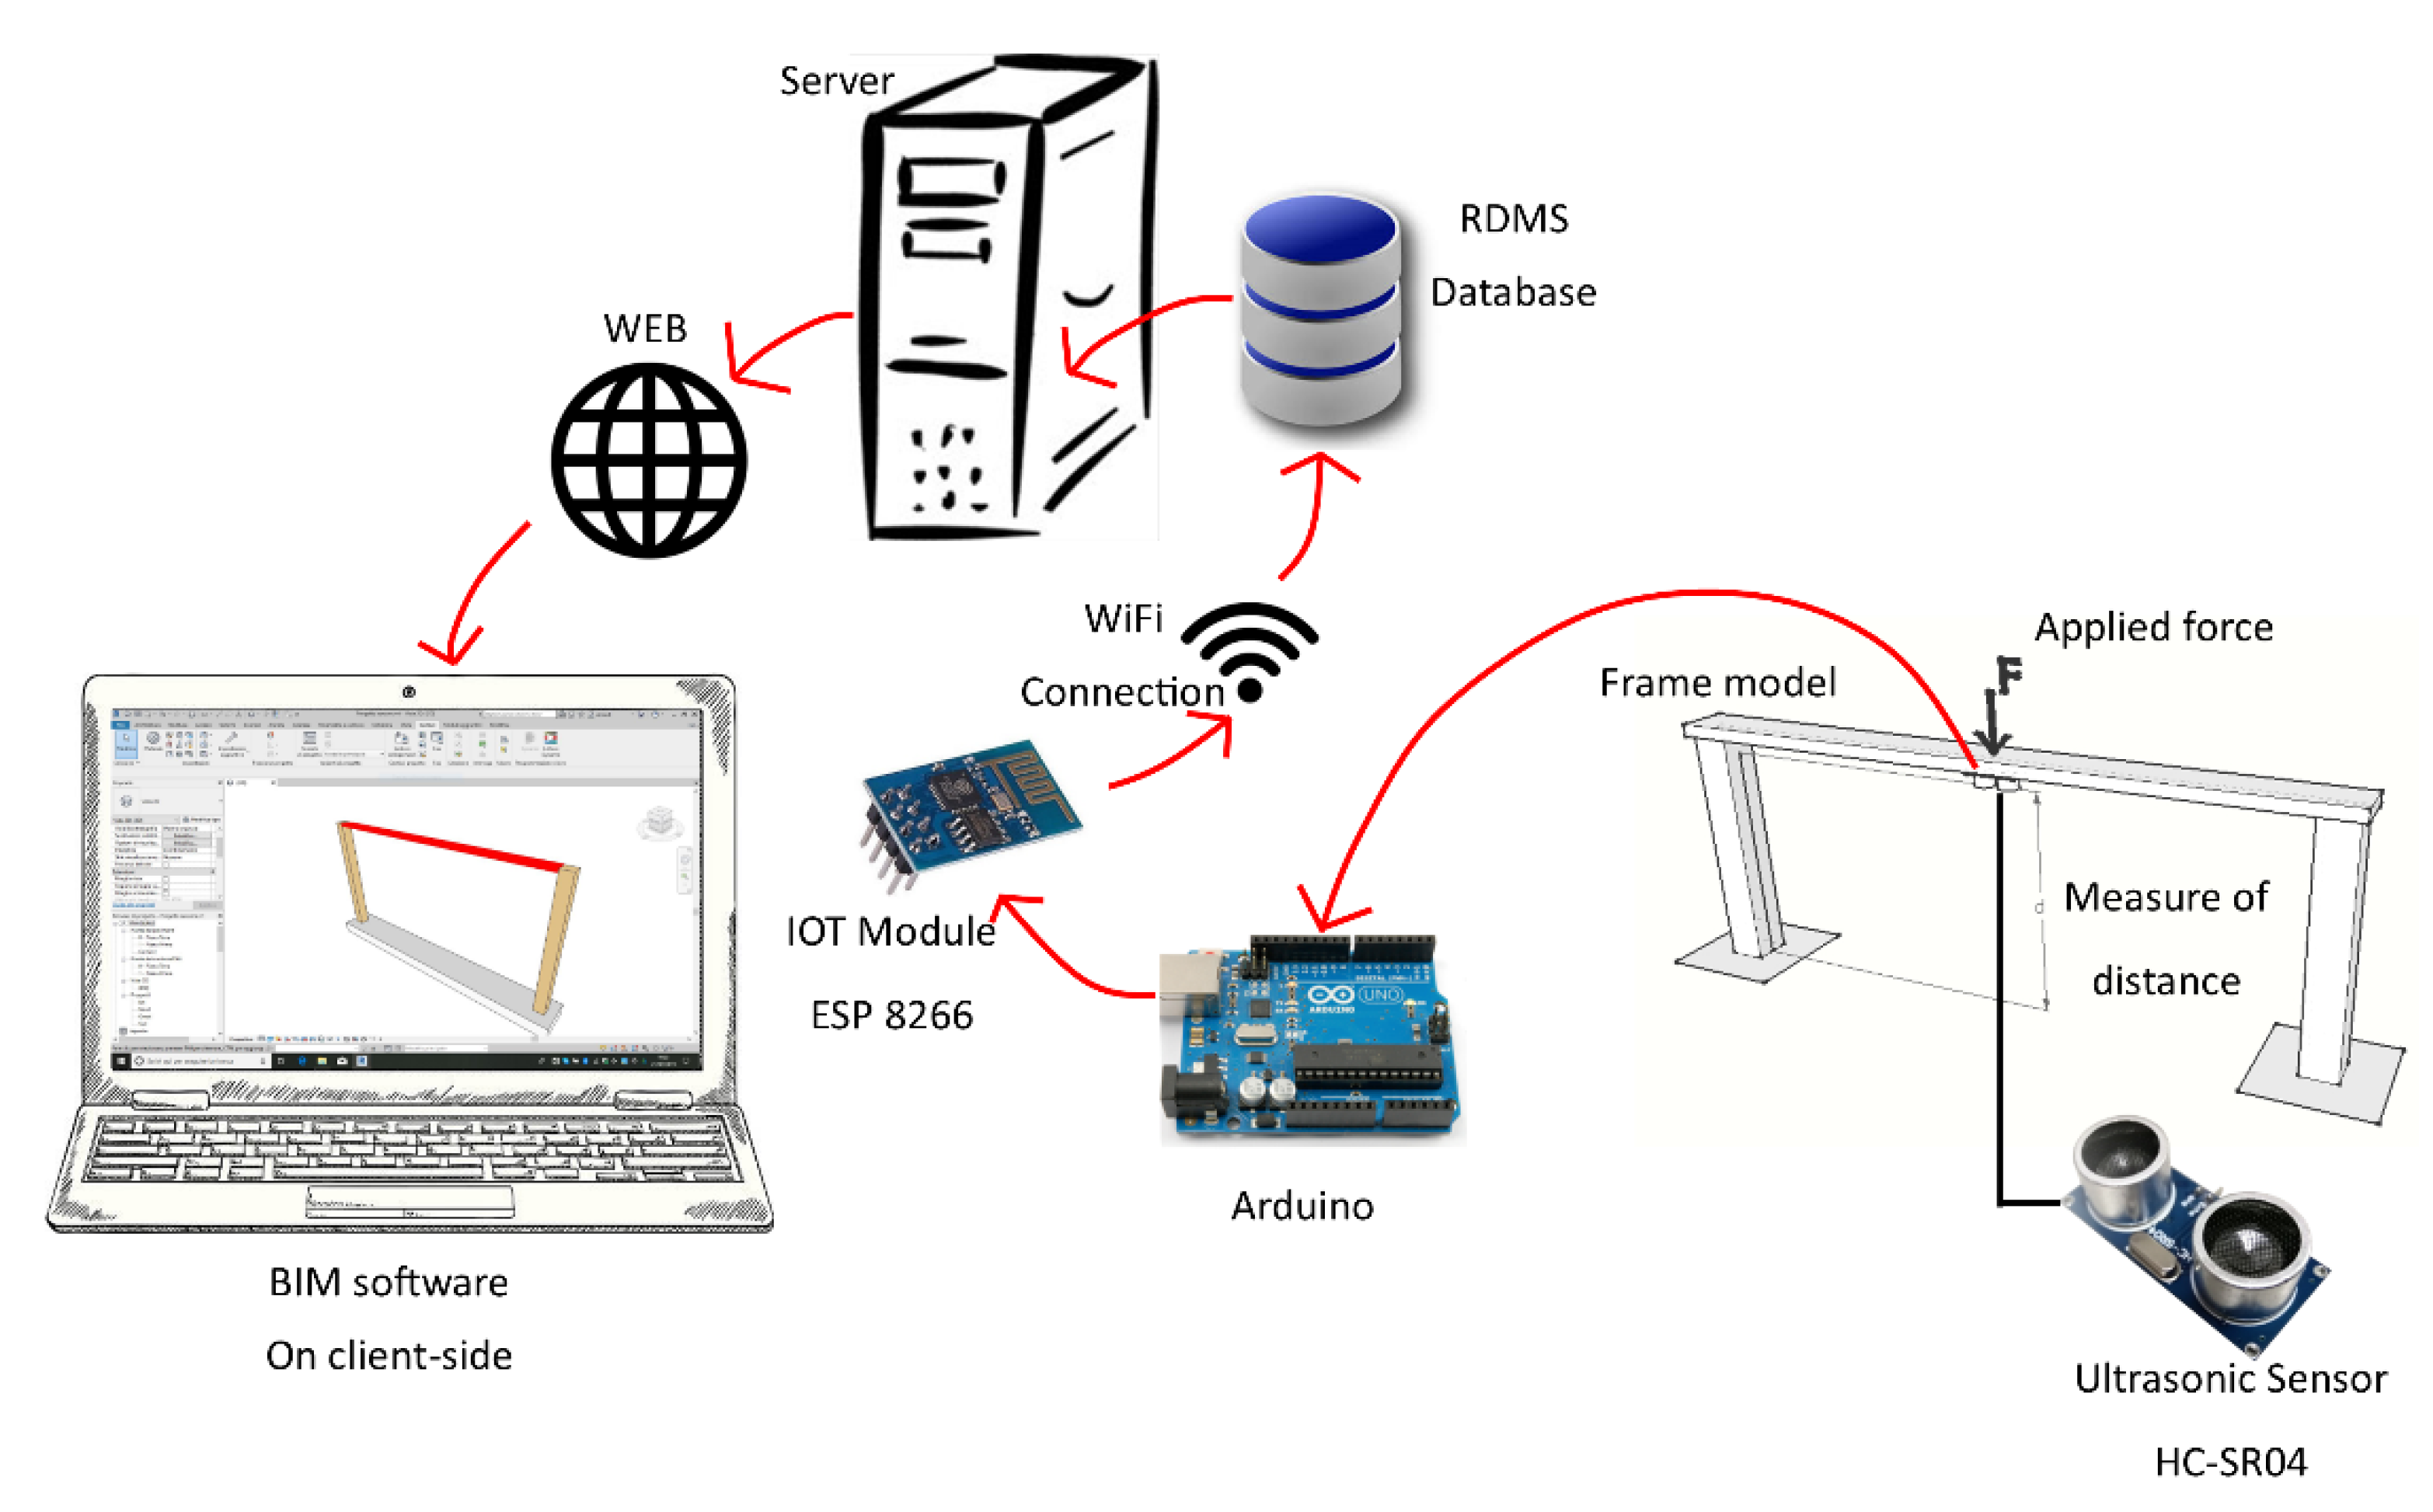
The system realised and reported here allows real-time monitoring of the central deflection of a structure.
To accomplish this, the system is composed of a distance sensor that acquires the distance between the intrados of the beam and the underlying surface (pavement), a microcontroller board (Arduino UNO), a Wi-Fi transmission module for Arduino, a remote server for storing data acquired by the sensor, BIM software, and a digital twin of the monitored structure, through which the real-time deformation state of the beam can be shown as an alert.
We used an ultrasonic sensor applied to a structural element modelled in 3D through BIM software running on a remote computer, network-connected (
Figure 1).
Measurements made by the sensor are sent to a server and loaded, through PHPcode, into a database created with MySQL database server. The BIM software, Autodesk Revit in this case, has been programmed, through its API, to automatically collect the last of the data inserted into the database, loading the previous information into a parameter of the 3D beam model. The procedure is summarised in
Figure 1.
As can be seen from the image below (
Figure 2), the experiment was completed using a small frame that simulates the behaviour of a leaning beam. The ultrasonic sensor is fixed to the midpoint of the intrados of the beam to measure the distance to the ground. The frame model is virtually reproduced in Revit. The modelling of the virtual beam was carried out by choosing a model belonging to one of the software families, then appropriately modified in its dimensions and in its physical and geometric characteristics. Additionally, two parameters, Date and Survey, were added to insert the sensor detection of time/date and state data, respectively. When the measured distance value (between the intrados and the ground) decreases below the established limit value (a predefined threshold), the beam of the virtual model is highlighted in red.
The communication of the sensor data to the database server is made through the Arduino hardware platform, to which sensors of different types, both analogue and digital, and Wi-Fi or GPRS communication modules can be connected. In particular, the hardware version used in the experimentation is the Arduino Uno that allows USB-Serial conversion. The ultrasonic sensor HC-SR04 distance sensor, with a ranging accuracy that can reach up to 3 mm, has been connected to it. HC-SR04 ultrasonic sensor represents a very low-cost solution with a ranging accuracy that can reach up to 3 mm and measurement distance from 2 cm to 400 cm, necessary to test the correct work of the system. On the market, there are several models of Laser Range Sensors (
Table 1), but for this experimentation, HC-SR04 was used as an alternative to test and validate the connection between every part of the system in a scaled model.
The sensor consists of an ultrasound transmitter, a receiver, and a control circuit. Upon activation, a series of ultrasonic pulses are emitted, and the echo is received from the surrounding objects. The distance between the hit object and the sensor is measured by evaluating the latency time between the emission of the sound and its return as an echo and the amplitude of the wave itself. The measurements can then be read immediately through the serial monitor of the Arduino development environment.
Once the measurement is acquired by the HC-SR04 sensor, the data are sent to a remote server, through an internet connection. However, Arduino Uno has no Wi-Fi connection, so it requires a connection to a device with relevant functionality. In this case, the followed choice was the ESP-8266 module, a Wi-Fi chip capable of using the TCP/IP protocol and equipped with a microcontroller (
Figure 3). With the native firmware provided by Espressif Systems, it responds well to AT commands (the command set originally developed for modems). AT commands were considered in this experiment because of their simple application and integration with the programming code uploaded to Arduino. Once an AT command is received from the module and correctly executed, the ESP sends the answer “OK”. Finally, the chip can be used in three modes: Wi-Fi station, Wi-Fi access point, and both simultaneously.
The remote server, upon which the relational database server (RDBMS) runs, is equipped with Apache WEB server guaranteeing remote internet access. The RDBMS server is implemented using a MySQL database server, managed with phpMyAdmin. To verify the correct sensor connection to the server, the information data are inserted into a PHP query string and sent in this form. The input value on the pin of Arduino acquired from the ultrasonic sensor is converted into centimetres and then inserted into a string using the following script:
duration = pulseIn(trigPin,HIGH);
distance = duration×0.034/2;
esp.print(“GET /insert.php?value=“);
esp.print(distance);
After the ESP-8266 module establishes a TCP connection with the server, any data received from Arduino are immediately sent to the network. The string, transferred to the server through the ESP Wi-Fi module, calls a particular PHP file located in a specific folder. The following script, contained in the PHP file, establishes a connection with the database when the query string with the measurement value reaches the server.
if (isset($_GET[‘value’])) {
$conn = new mysqli($server_name, $server_username, $server_password, $database_name);
}
Additionally, in the same file, there is a SQL query that, in case of connection, loads the measurement value and the current time in the correct table.
To obtain and upload data from the sensor on the BIM model, the use of Revit’s plug-in Dynamo is essential. It is an open-source visual programming software that allows generating scripts for automating repetitive tasks and simplifies 3D modelling problems within Revit. Dynamo interface works through the connection of nodes. Each node is an object that performs specific operations and can be connected to other nodes through input and output ports. Thanks to the Slingshot package, which can be installed on Dynamo, it is possible to use nodes that activate the connection to an RDBMS database, created with MySQL or Postgres. The programming scheme in Dynamo is divided into four blocks of nodes (
Figure 4).
The first block (in orange) collects data from the database. Once the connection is established, every node is used to compose specific SQL queries that collect all the data in a table (
Figure 5), allowing the selection of the last value registered by the sensor through an Open Database Connectivity (ODBC) connection.
Through the second block of nodes (in violet), the last registered value is inserted as an attribute in the parameter of the 3D object created in Revit (
Figure 6). In this procedure, it is essential to set up the correct format of the parameter, considering the kind of value to insert. For example, the time and the date to be loaded in the Date parameter require a number-to-string conversion.
Finally, the third block (in green) creates the visual notice inside the Revit 3D model. In particular, a specific part of the 3D graphic model changes colour if the registered data are higher or lower than a specific threshold value previously established by a Boolean construct (
Figure 7).
The fourth block of nodes is created to solve a lack of Dynamo, which does not automatically re-run the program if the input data of all the nodes are always the same, as described in the relevant section.
4. Results, Issues, and Solutions
A series of problems were identified during the experiment. These problems are mainly linked to the connection of Dynamo and the Wi-Fi module ESP8266ex to the server.
In this field, the Slingshot package available for Dynamo, which allows connection to an SQL database, offers nodes for connection to MySQL or Postgres and nodes to query these databases. Once the database access data have been entered in the connection node, a connection string, which is then sent as input to the query node, is obtained. However, these connection nodes do not seem to work correctly at the moment. The problem was bypassed using query nodes based on an ODBC link, where the connection string has been manually entered. In this case, however, the computer must already be connected to the server through an ODBC connection. The ODBC query node has three inputs:
Connection string;
SQL query string;
Toggle.
The first two inputs must always remain the same. Instead, the third input, called “toggle”, is a Boolean input that can assume only the values “true” and “false”, which respectively start and stop the execution of the query. By placing this input equal to “true” and leaving it always the same, the command will be launched, with the subsequent check on the database, only the first time.
A program created with Dynamo can be executed in three ways:
A manual mode, where the operator gives the start, and the program is only executed one time;
An automatic mode, where, after the start, the program remains active;
A periodic mode, where the program starts again after a given period.
However, the software does not repeat actions (in this case, the collection of data from the database) more than once if the input values at the nodes always remain the same. This probably happens to avoid creating infinite loops that could crash the software. To execute the next check on the database, it is necessary to manually act on the switch by changing the value in “false”, restarting the execution, then bringing it back to true and restarting the execution again. For this reason, the fourth block of nodes, as mentioned previously, has been inserted to make this process automatic. This block was then built-in order to send the last element of a list of two elements, whose order is continually inverted by the switch. Values, sent as input to the switch, are the Boolean value “true” and the time. The use of the value “time”, which changes continuously, is also necessary in this case to ensure that the order of the elements in the list is continually inverted, which would not happen if static values were used. In this way, at each execution of the program, the ODBC node will once receive the input true, forcing it to check the database, and the time input will be interpreted as “false” or a disconnection of the node. So, the subsequent automatic entry of the “true” value will be read as a restart of the program with a new input (
Figure 8).
Considering other issues, the connection of the ESP8266ex Wi-Fi module to Arduino has not been as simple as that of the HC-SR04 sensor. While the ultrasonic sensor signal could be read through the programming code loaded into the Arduino, the connection with the ESP module can be established and controlled through either specific commands or a C script directly loaded inside it. Moreover, depending on the installed firmware, the ESP module can reply to different types of commands. However, the documentation in this field available online is incomplete and unclear.
The supplied module contains pre-installed firmware that is not compliant with the AT commands. So, it could not grant a simple communication with Arduino, making it necessary to install a different one. Furthermore, the connection settings to the Arduino board, finalised to the ESP module programming, differ from the settings for the standard use of the board. In fact, in the case of direct programming of the ESP module or firmware installation, it is necessary to use a USB/TTL adapter or set the same Arduino board, which is bypassed through appropriate connections between the two modules (
Figure 9).
Additionally, the baud rate of the ESP8266 module, set at 115200, is different from that of the HC-SR04 ultrasonic sensor, which is 9600 baud instead. Arduino cannot keep two serial communications open at different baud rates simultaneously and, for this reason, it has been necessary to change the ESP baud rate to 9600. However, after some reset, the module may return to the initial baud rate. To avoid this behaviour, a starting command has been inserted in the Arduino script that always would set the correct baud rate for this application. In this operation, the server connection returned some issues. In the first instance, AT commands can connect the ESP module to a Wi-Fi network, establishing a TCP connection to a remote server linked to the same network. Once the SoftAP + Station mode was activated and the connection to the router was set, after each reconnection, the module assumed IP addresses that were not part of the server subnet, failing the TCP connection. After a correct IP address was assigned, the TCP connection was correctly established, and the data were sent. Always considering the connection, the AT + CIPSEND command, which sets the module to send data, can be used in two ways. In the first case, once the TCP connection is established, the command script is followed by the bit size of the data to send, and if the OK is received from the chip, the data can be sent.
This solution, however, is problematic because if the actual size of the data is different from that indicated previously, the chip tends to become stuck. On the other hand, every time the TCP connection is established, it assumes that the module is set to UART-WiFi. At this point, it is necessary to type the command to send data. After receiving the OK from the chip, the data transmission starts without worrying about the size of the data until a stop command is sent.
5. Conclusions and Future Application
This work highlights the wide field of application and the huge possibilities that the matching between sensors and BIM technology offers to building management. A simple measure of distance, applied to the centerline intrados of a beam and online connected to the virtual BIM representation of the model, becomes strategic information for the monitoring, control, and management of structures. Our example, reproduced in the laboratory, shows the process on a scaled model, but the connection system could be structured with the same configuration working on a real model of a beam of a bridge to attempt the real-time monitoring and the possible consequent control of the structure exploiting the connection with the BIM model. Considering this last case, the sensor capabilities for the data acquisition should be different, obtaining, at the same time, the same interaction with the BIM model through the connection with the RDBMS database. The next step of this research could be the implementation of multiple sensors inside the system to acquire more real-time information. Comparing the solution involved in this work with the existing monitoring technologies that involve infrastructures, the costs are considerably reduced. In fact, the data acquisition and transmission solution in question uses low energy consumption and could be connected to a solar panel, an autonomous solar power supply that guarantees stable and continuous monitoring activity. For this reason, the proposed solution could be useful as a low-cost system for alarming infrastructure managers by reporting possible risks of the monitored structures. The selected structures could then be more accurately detected using more expensive monitoring systems. Future advances in this experimentation will consider real cases of bridge infrastructure, where it is necessary to adopt sensors with a higher level of resolution and wider distance range (connected in the same way) in order to detect vertical displacements related to the bending of the structure (
Table 1).
Considering the accuracy of the results, the integration of a more accurate sensor network based on recent automotive technologies and the integration of strain gauges and accelerometers could offer a real opportunity for a wide range of monitoring applications for bridge infrastructures in the future.
The interaction between sensor technologies, the RDBMS database, and BIM application represents a multidisciplinary field of research that will play a key role in the management of civil structures.


