Article

Research on Gridding of Urban Spatial Form Based on Fractal Theory

School of Architecture, North China University of Water Resources and Electric Power, Zhengzhou 450046, China
*
Author to whom correspondence should be addressed.
ISPRS Int. J. Geo-Inf. 2022, 11(12), 622; https://doi.org/10.3390/ijgi11120622
Submission received: 8 October 2022 / Revised: 17 November 2022 / Accepted: 12 December 2022 / Published: 13 December 2022

Abstract

:
Urban spatial form is a significant reference to getting to know cities and running the cities. The fractal theory is an effective means to quantify urban spatial form. Taking the buildings in the outer ring of Zhengzhou City as the research object, the basic architectural models are built by extracting their forms. The research site is subdivided into 199 regions. The distribution of architectural forms in Zhengzhou is analyzed by fractal theory and spatial autocorrelation from the perspective of two-dimensional(2D) and three-dimensional(3D). The results indicate that the architectural layout of Zhengzhou has distinct fractal characteristics; Both global spatial autocorrelation and local spatial autocorrelation show significant positive correlations; There are obvious spatial differences in architectural space forms in different regions. The refined grid analysis strengthens the understanding of the urban spatial structure and development rules in more detail. The study promotes the refinement and visualization of fractal theory effectively and improves the depth of urban spatial form cognition.

1. Introduction

An urban spatial system is an organism formed by the interaction of many urban morphological elements and usually takes architecture as the skeleton [1,2,3,4]. The urban spatial form can reflect the deep structure and development trend of urban space and is the basic reference for high-quality urban development [5,6,7,8]. Strengthening the research on urban spatial morphology increases understanding of the urban development process, urban development trends, and growth mechanisms, as well as provides a reference for urban planning and design practice [9,10,11,12].
At present, urban spatial morphology research includes qualitative and quantitative forms [12,13]. The qualitative analysis focuses on image comparison and narrative description of the evolution process of urban morphology [13,14]. Quantitative analysis uses mathematical methods (the eigenvalue method, fractal research, network topology analysis, etc.) to quantify the form, distribution, evolutionary trends, and growth mechanism of urban space [14,15,16]. Among these methods, urban fractal research is based on the relationship between the overall form and parts of the form of urban space. It describes the relationship between the whole and part of the city with self-similarity [17]. Fractal theory can condense the numerous and complex geospatial data of cities into a concise digital expression, thus revealing the hidden space-time information behind urban evolution [18]. With the development of urban geography, the combination of GIS technology and fractal theory has become an important method to study urban spatial morphology [19,20,21,22,23]. The research of fractal theory in urban spatial form involves urban road networks, land use, building layout, etc. [24,25,26]. In terms of specific indicators, urban spatial form quantification utilizes indicators such as capacity dimension, radius dimension, information dimension, and the box-counting method [27,28,29].
At present, fractal research has been widely used in urban spatial morphology, but the following limitations must be acknowledged. First, the visualization capability of fractal results is low. Planners and decision-makers are often unable to intuitively obtain the specific form of urban space from the digital fractal results [30,31,32,33]. Secondly, the scale of urban fractal research is relatively macro, thus the spatial morphological differences in different areas of the city cannot be displayed [34,35,36]. Finally, the research on urban fractals is mostly concentrated in the 2D field, while the research on 3D fractals is relatively few, and the research on the combination of 2D and 3D fractals is almost nonexistent.
However, the city is a complex entity with ever-changing architectural forms. There is no convincing method to quantify the difference in architectural forms. The basic architectural model is extracted from the architectural form, and the corresponding relationship between the basic architectural model and the fractal dimension is established, which can quantify the spatial differences of all architectural forms in the whole city. At the same time, it is also helpful to promote the visualization research of fractal theory. The city is divided into several grids. Through the description of the architectural forms in each grid, the architectural forms in each location of the city can be more finely displayed, and the differences in the distribution of buildings can be more finely quantified. Finally, the combination of 2D and 3D fractals for architectural form analysis can interpret the complexity of urban spatial form from multiple perspectives, and can more accurately interpret urban spatial information.
Taking the outer ring area of Zhengzhou as the study area, the spatial distribution differences of urban spatial forms on a fine scale are illustrated through refined grid division.
The research results help identify the development status of different regions from a spatial perspective and promote the visualization of urban fractals. Moreover, through multi-dimensional fractal research, the study of the spatial correlation between the whole region and the local region can be graphically displayed, which is of great significance to urban planning and decision-making. Through the refined grid division, the architectural form and distribution differences in various regions of the city can be quantified and visualized. This study can provide a decision-making reference for urban management and improve the scientificity of urban planning.
The rest of this paper consists of the following parts. Section 2 describes our research sites, data preprocessing, and calculation methods. Section 3 introduces the research results, including the two-dimensional and three-dimensional forms and spatial distribution of buildings. Section 4 discusses the differences between our and other studies. Section 5 gives a brief summary of the manuscript.

2. Materials and Methods
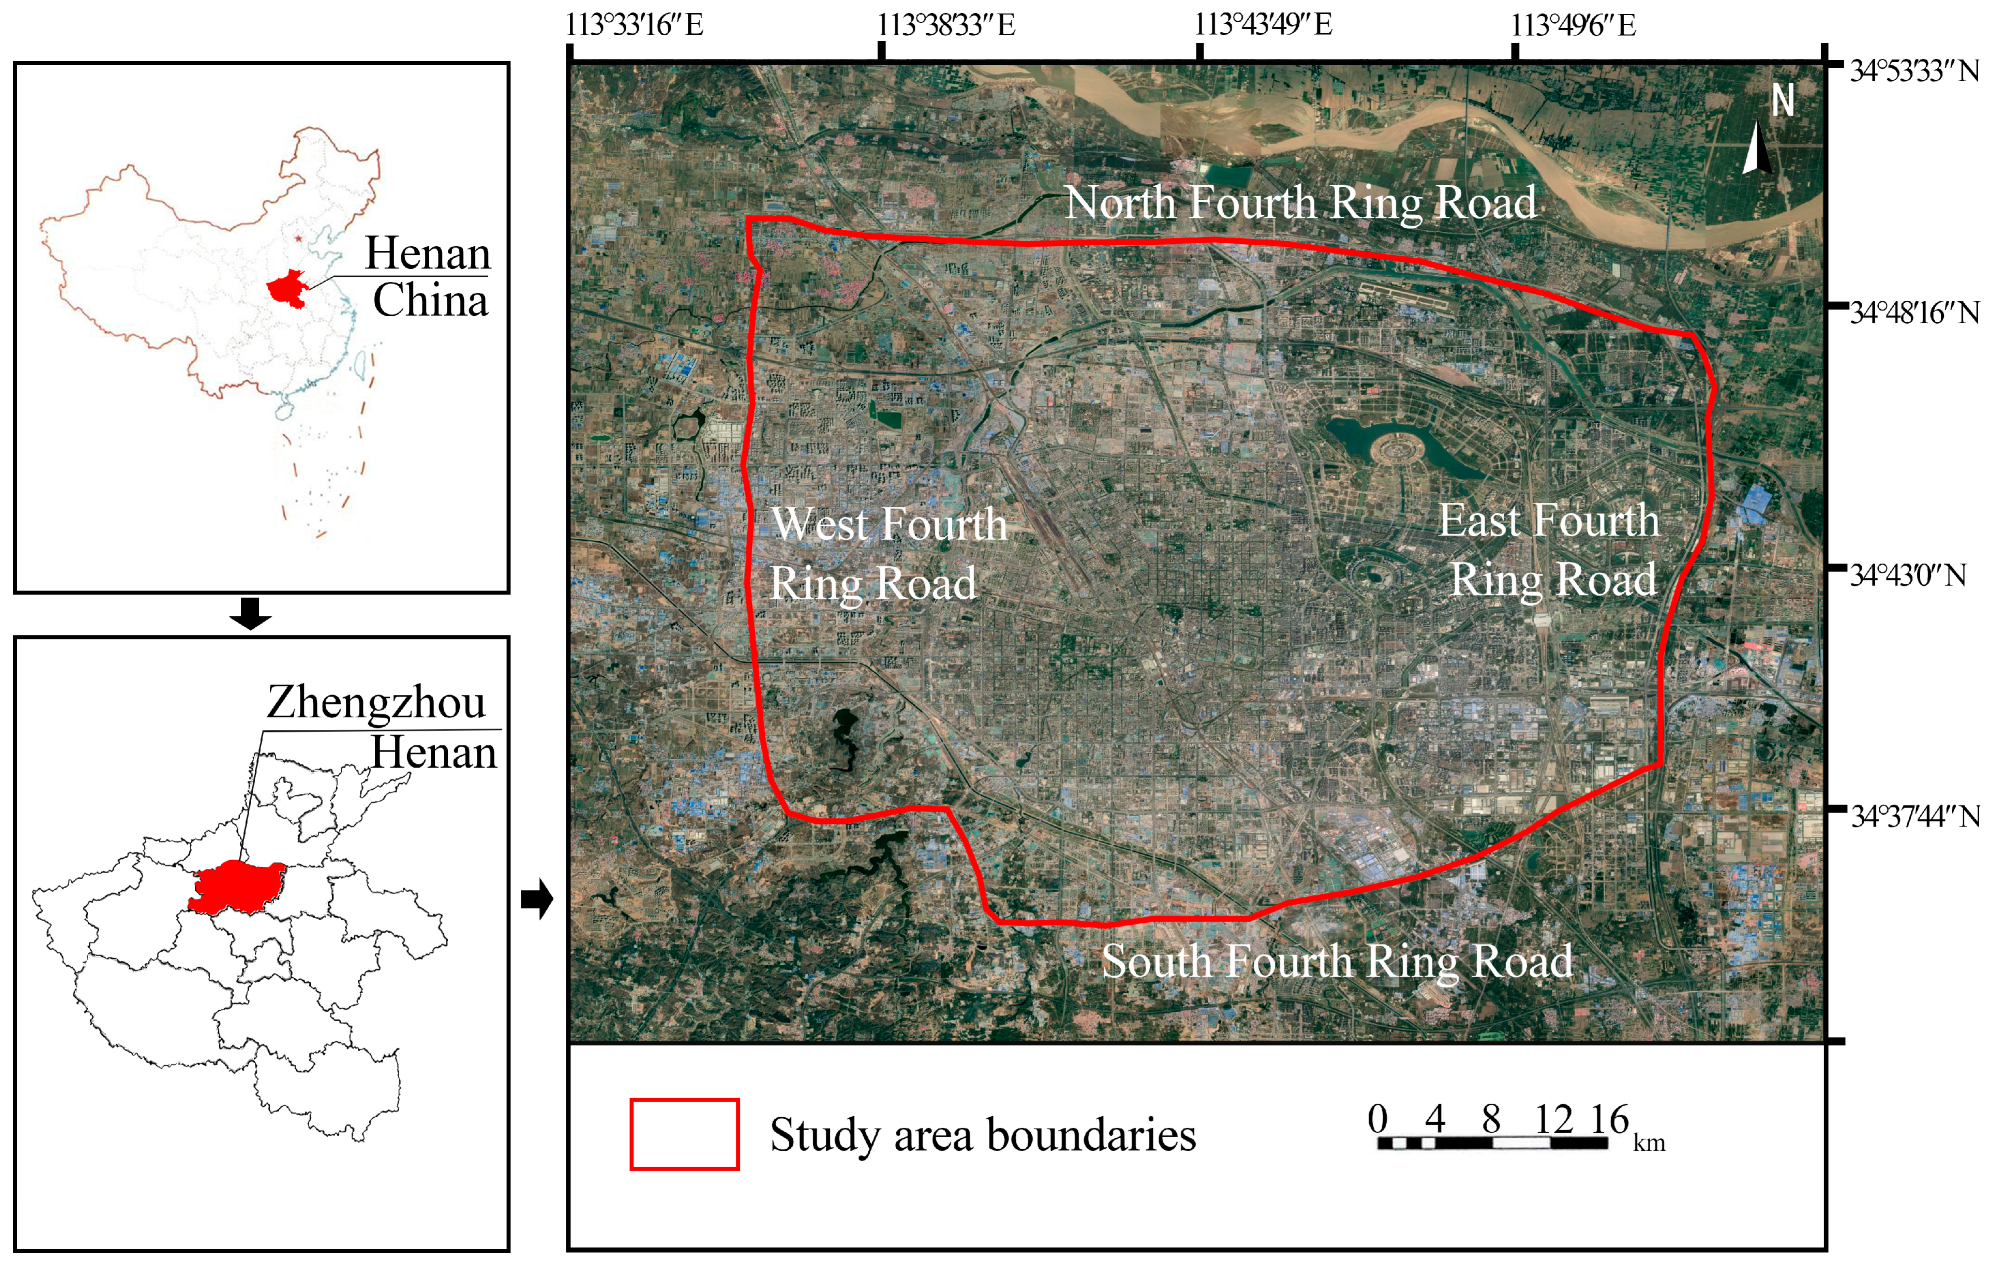
2.1. Study Area

Based on the investigation of the current situation of building growth, the buildings in the Fourth Ring Road of Zhengzhou City, Henan Province, China were selected as the research objects. The study area is enclosed by four roads: East Fourth Ring Road, West Fourth Ring Road, South Fourth Ring Road, and Dahe road. The total length of the study area boundary is about 93.3 km (km), and the study area spans about 550 km2. The study area is shown in Figure 1.

2.2. Data Source and Preprocessing

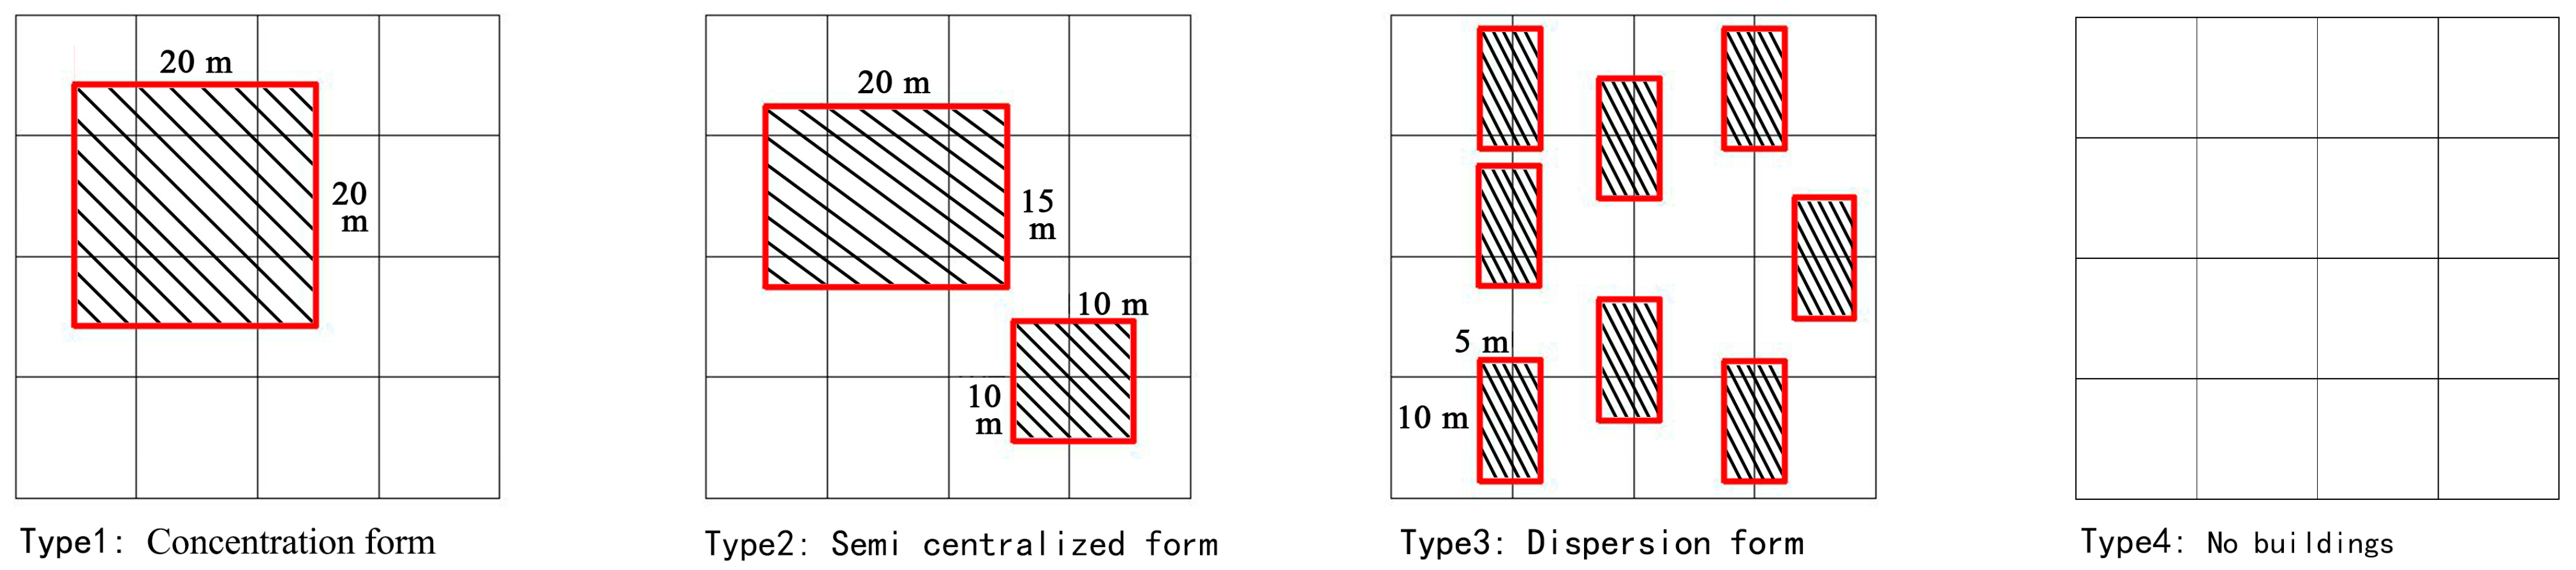
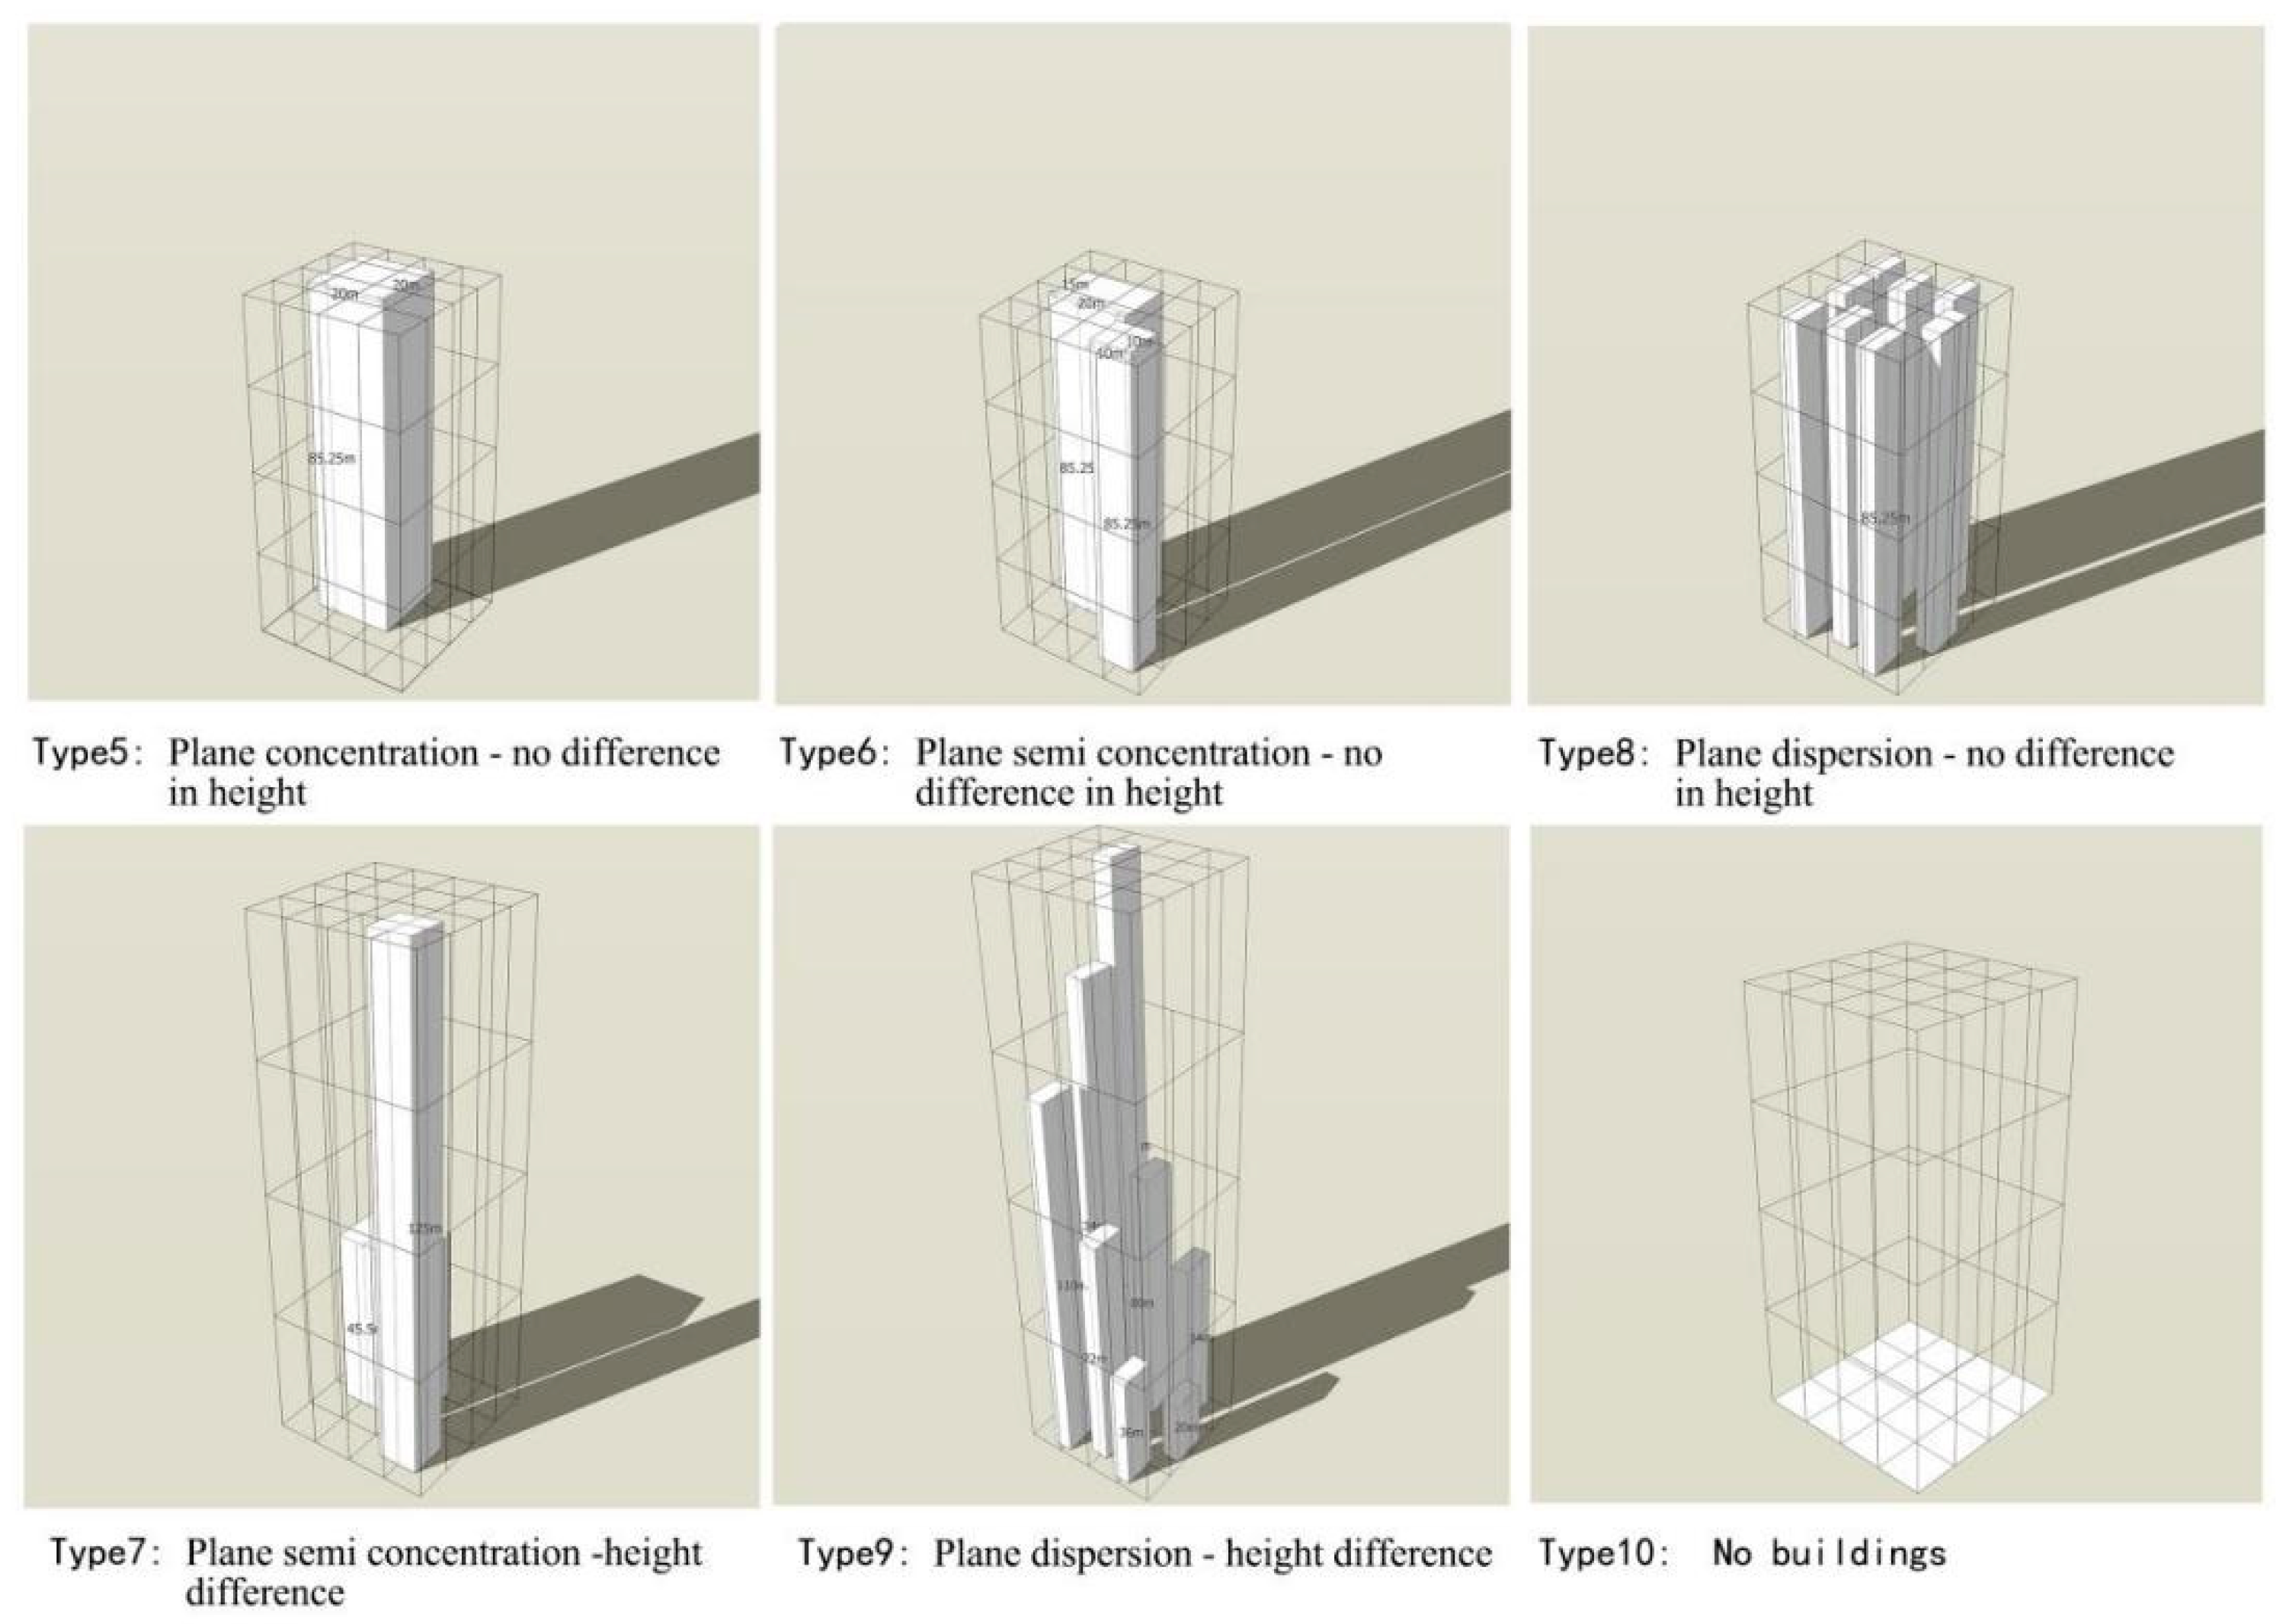
2.2.1. Basic Model Building

The 2D plane and 3d elevation data of buildings in the study area were purchased from the Beijing Qianfan Shijing Technology Co., Ltd. (Beijing, China). The 2D plane data accuracy reaches 1 × 1 m (m), Sand the 3D elevation data accuracy reaches 3 m. Subsequently, the obtained 2D and 3D building data were processed using GIS 10.0. Based on the previous investigation, ten basic architectural models were built according to the plane and spatial layout of the buildings in the study area (Figure 2 and Figure 3).
Figure 2 (Type1 to Type3) shows the basic pattern of the 2D plane distribution of buildings. In order to eliminate the influence of area on measurement results, the sum of plane distribution areas of each basic form is consistent. Type 4 indicates an area with few or no buildings.
Figure 3 (Type 5 to Type 9) shows the basic mode of building distribution in 3D space. To eliminate the influence of volume on measurement results, the total volume of each basic form is the same. Type 10 indicates an area with few or no buildings.

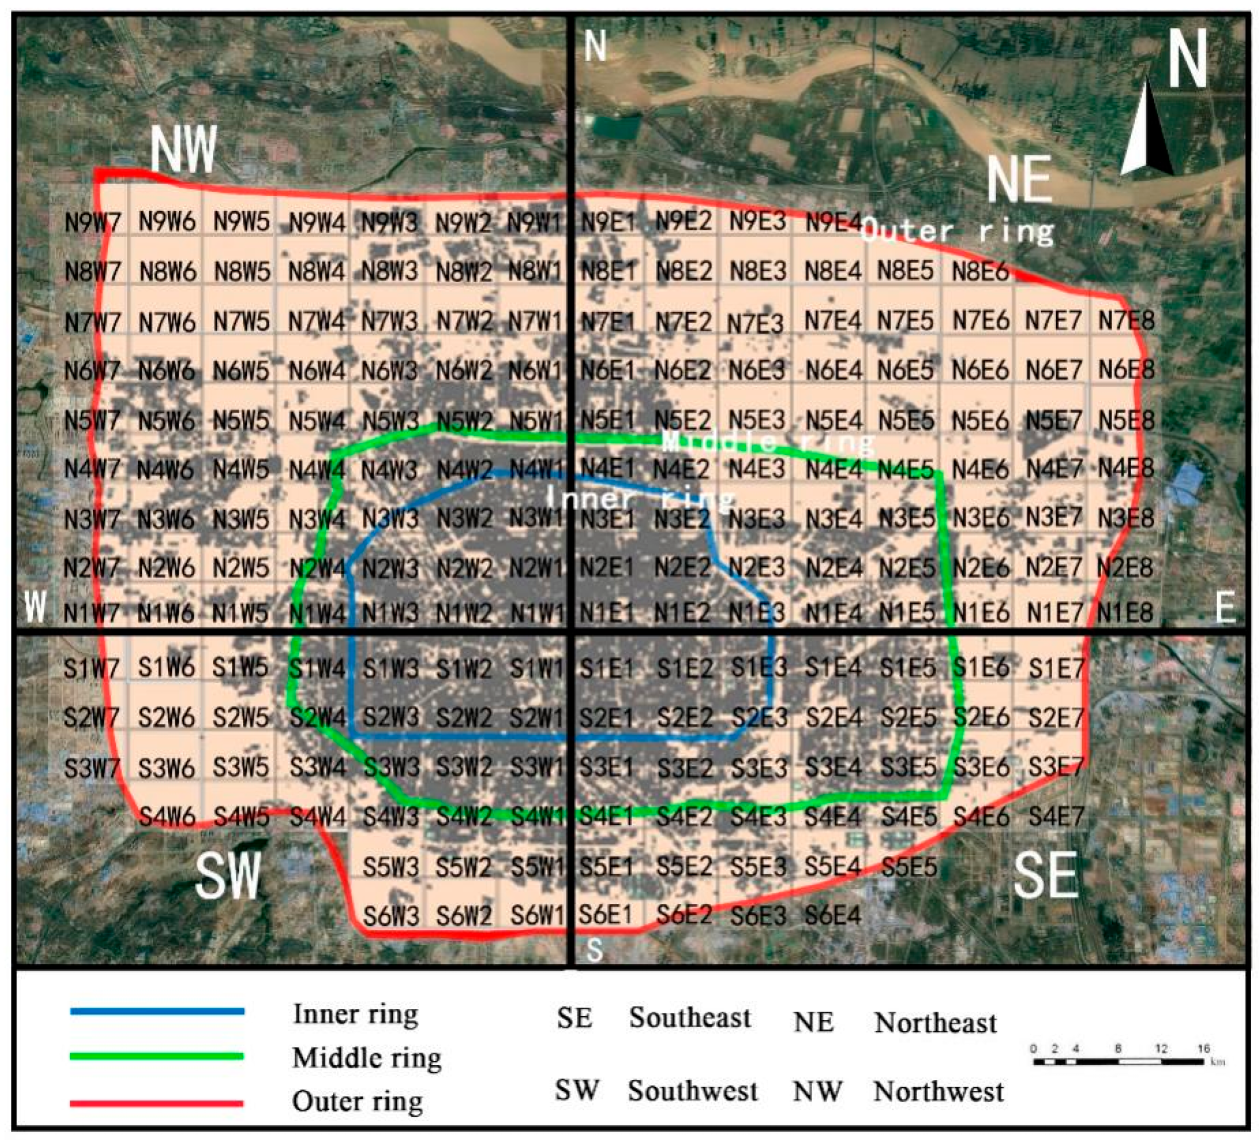
2.2.2. Grid Subdivision of Study Area

In order to detail the differences in architectural spatial form distribution throughout the study area, the study area was divided into 199 fine grids. The blank area in the study area is dominated by non-construction land, and the spatial form is homogeneous resulting in no grid division. Taking the central position of the study area (113°40′33″, 34°44′26″) as the coordinate origin, a rectangular coordinate system was established. The 199 grids are numbered according to their orientation, as shown in Figure 4.

2.3. Research Methods

2.3.1. Calculation Method of 2D and 3D Fractals

It should provide a concise and precise description of the experimental results, their interpretation, as well as the experimental conclusions that can be drawn. The calculation of 2D and 3D fractals both require a measurement of space but at different scales. For example, different scales of “measurement units” can be built to conduct the fractal study. The scale of the measurement units is r, and the number of measurement units required for the measurement space is N(r). The relationship between r and N(r) should obey the negative power law:
N r r D
where D is the fractal dimension.
After obtaining the N(r) values that correspond to different r values, lgr and lgN(r) as the abscissa and ordinate, respectively, are plotted using the following regression equation:
l g N r = D lg r + lg k
where k is a constant. In Equation (2), the negative value of the slope of the regression line is the calculated value of the 2D fractal dimension, D. Additionally, D represents the complexity and regularity of the region’s morphology, and lgk is the intercept of the regression line.
The measurement units are grids in 2D and cubes in 3D. Taking 3D as an example, 3D urban space M can be completely covered by a cuboid with length L, width W, and height H. Start with an L × W × H box as the ruler, and its scale as r1 = L. Then the number of cubes required to measure the whole urban space M, that is, the number of non-empty boxes, must be N(r1) = 1. Divide the length, width, and height of the cuboid equally to form a cuboid with a size of L/2 × W/2 × H/2, its scale R2 = L/2. The number of scales required to cover the whole urban space is N(r2). Further, use L/4 × W/4 × H/4 and r3 = L/4 to measure the 3D space of the city, and the number of scales required is N(r3). Continue to gradually and proportionally reduce the size of the box ruler, and the size of the box ruler in step n is L/2n−1 × W/2n−1 × H/2n−1 with scale rn = L/2n−1. The number of non-empty cuboids required to cover M space is recorded as N(rn). If the urban 3D space is fractal, the scale r value and its corresponding non-empty box number N(r) satisfy the power relationship of Formula (1), and the fractal dimension value can be calculated according to Formula (2).

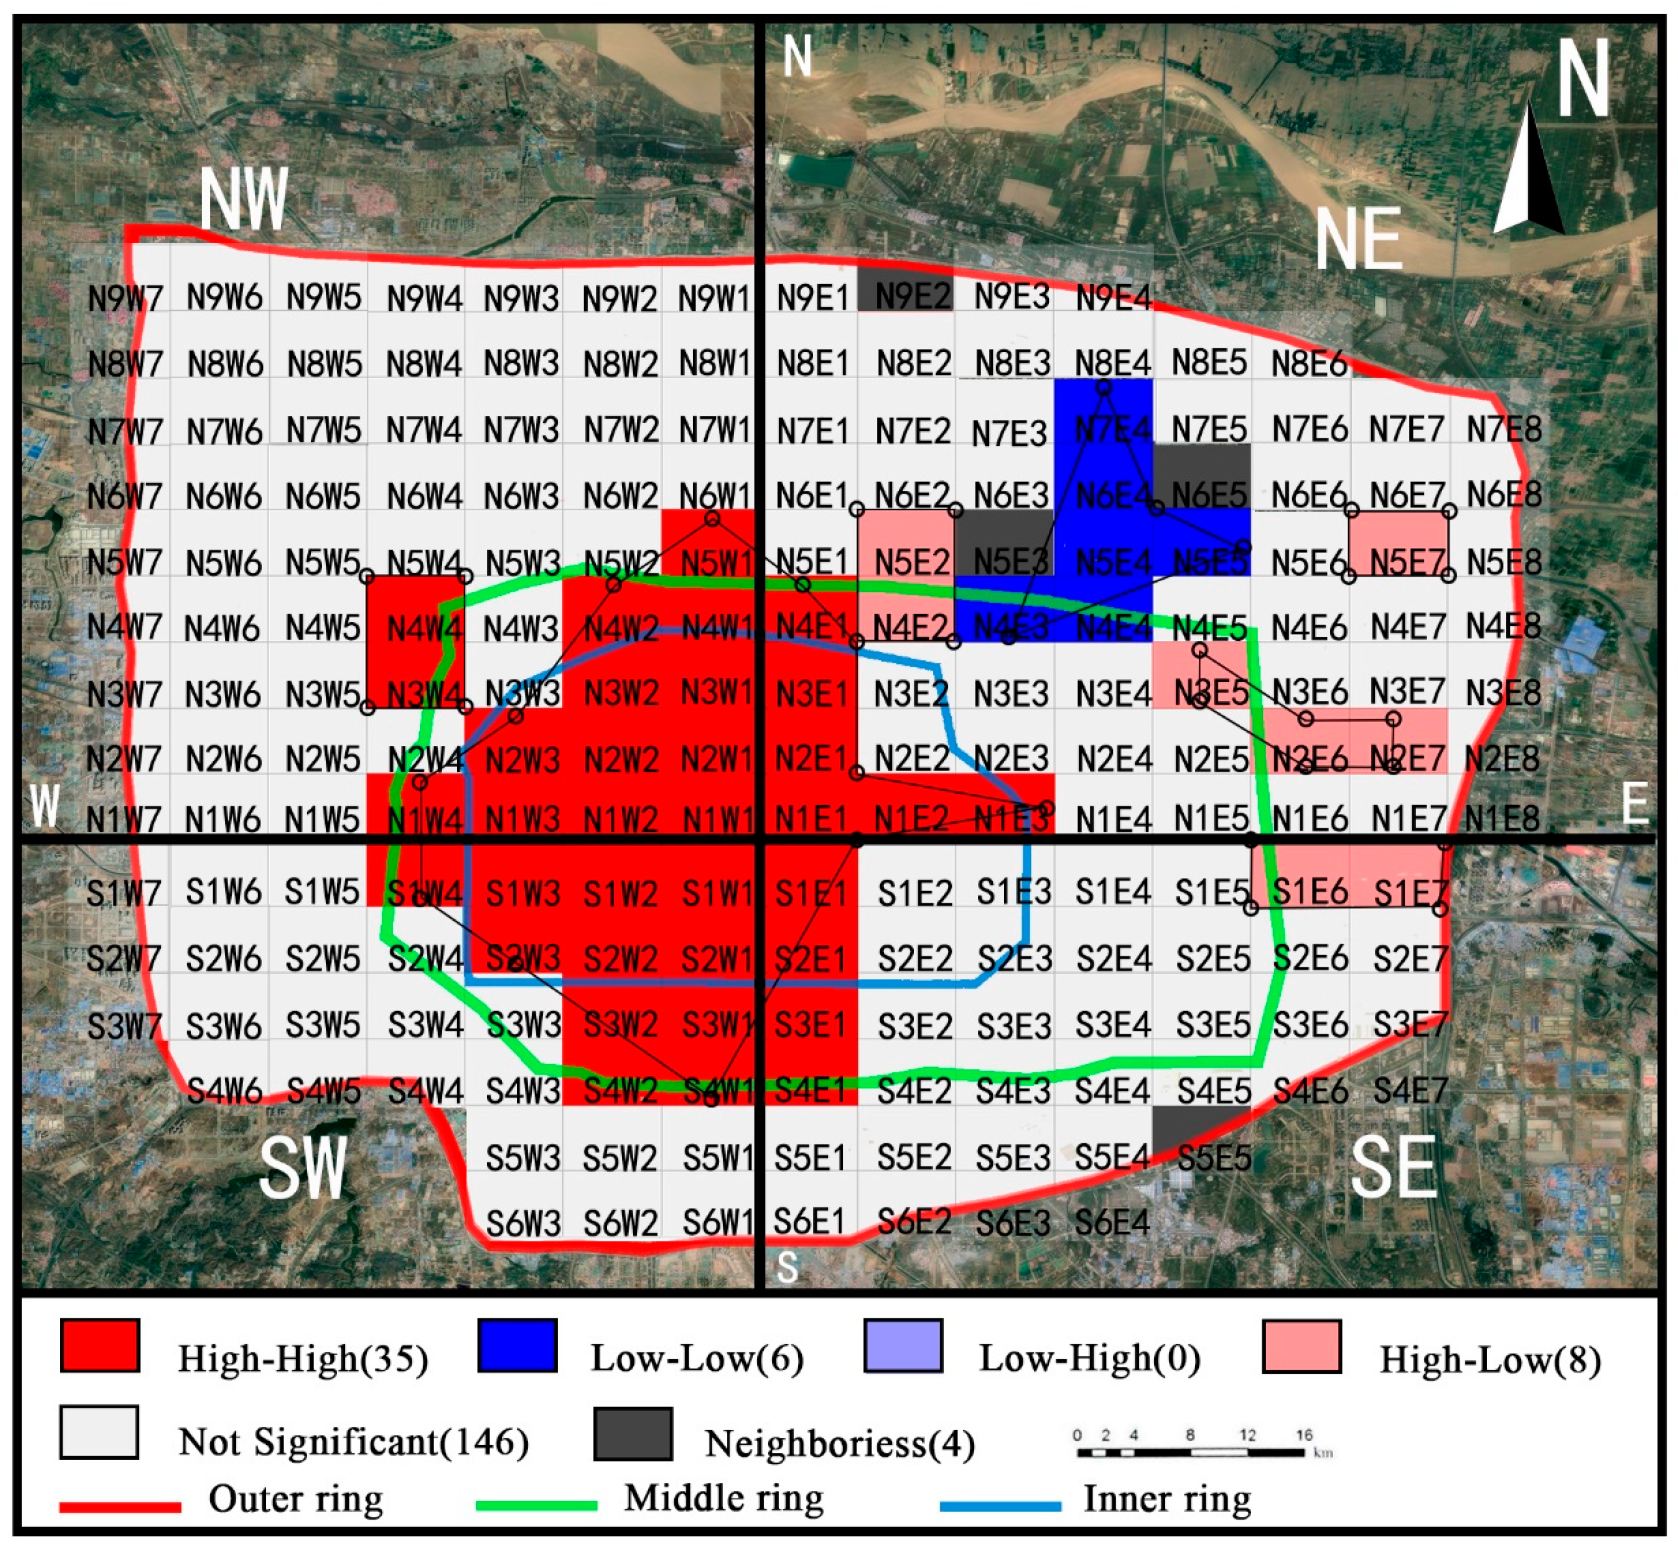
2.3.2. Spatial Auto-Correlation Analysis

In order to investigate the spatial auto-correlation degree of architectural forms in the study area, the following study selected the Global Moran’s I to analyze the overall correlation of urban agglomeration buildings and the Local Moran’s I to analyze the spatial dependence’s degree of architectural indicators. Global Moran’s I is calculated as:
G l o b a l   M o r a n s   I = i = 1 n j = 1 m W i j x i x ¯ x j x ¯ S 2 i = 1 n j = 1 m W i j
where S 2 = 1 n i = 1 n x i x ¯ 2 ,   x ¯ = 1 n i = 1 n x i , x i , represents the attribute value of the ith region, and n is the number of grids. W i j is a binary adjacency space weight matrix (i = 1, 2, …, n; j = 1, 2, …, m). Where W i j = 1 indicates that area I and area j are adjacent and W i j = 0 indicates area i and area j are not adjacent. Moran’s I is generally between −1 and 1. Less than 0 represents a negative correlation, equal to 0 represents no correlation, and greater than 0 represents a positive correlation.
L o c a l     M o r a n s   I i = x i x ¯ m j = 1 n W i j x i x ¯
where m = j = 1 , j 1 n x j 2 / n 1 x ¯ 2 . A positive I i value represents the spatial clustering of similar values (high or low) around the spatial unit, and a negative I i value represents spatial clustering between dissimilar values.

3. Results

3.1. Visual Expression of Architectural form Based on Fractals

The results of the fractal dimension calculations for the ten basic building models are shown in Figure 2 and Figure 3. Each basic model’s goodness of fit is higher than 0.996, showing strict fractal self-similarity. Which indicates that the basic form model has significant self-similar characteristics and conforms to the general law of fractals. According to the basic model calculation results, different fractal intervals were determined to make different fractal values correspond to the specific basic model (Table 1). By comparing the fractal calculation results of different grids with ten basic architectural forms, the approximate spatial form of each grid can be obtained.
On the 2D level, with a decreasing fractal value, the three basic architectural models (Type 1 to Type 4) show a trend from “concentration” to “dispersion.” At the 3D level, with a decreasing fractal value, the five basic architectural models (Type 5 to Type 10) show a trend from “plane concentration–- no difference in height” to “plane dispersion–- difference in height.”

3.2. Grid Scale Architectural Form Distribution

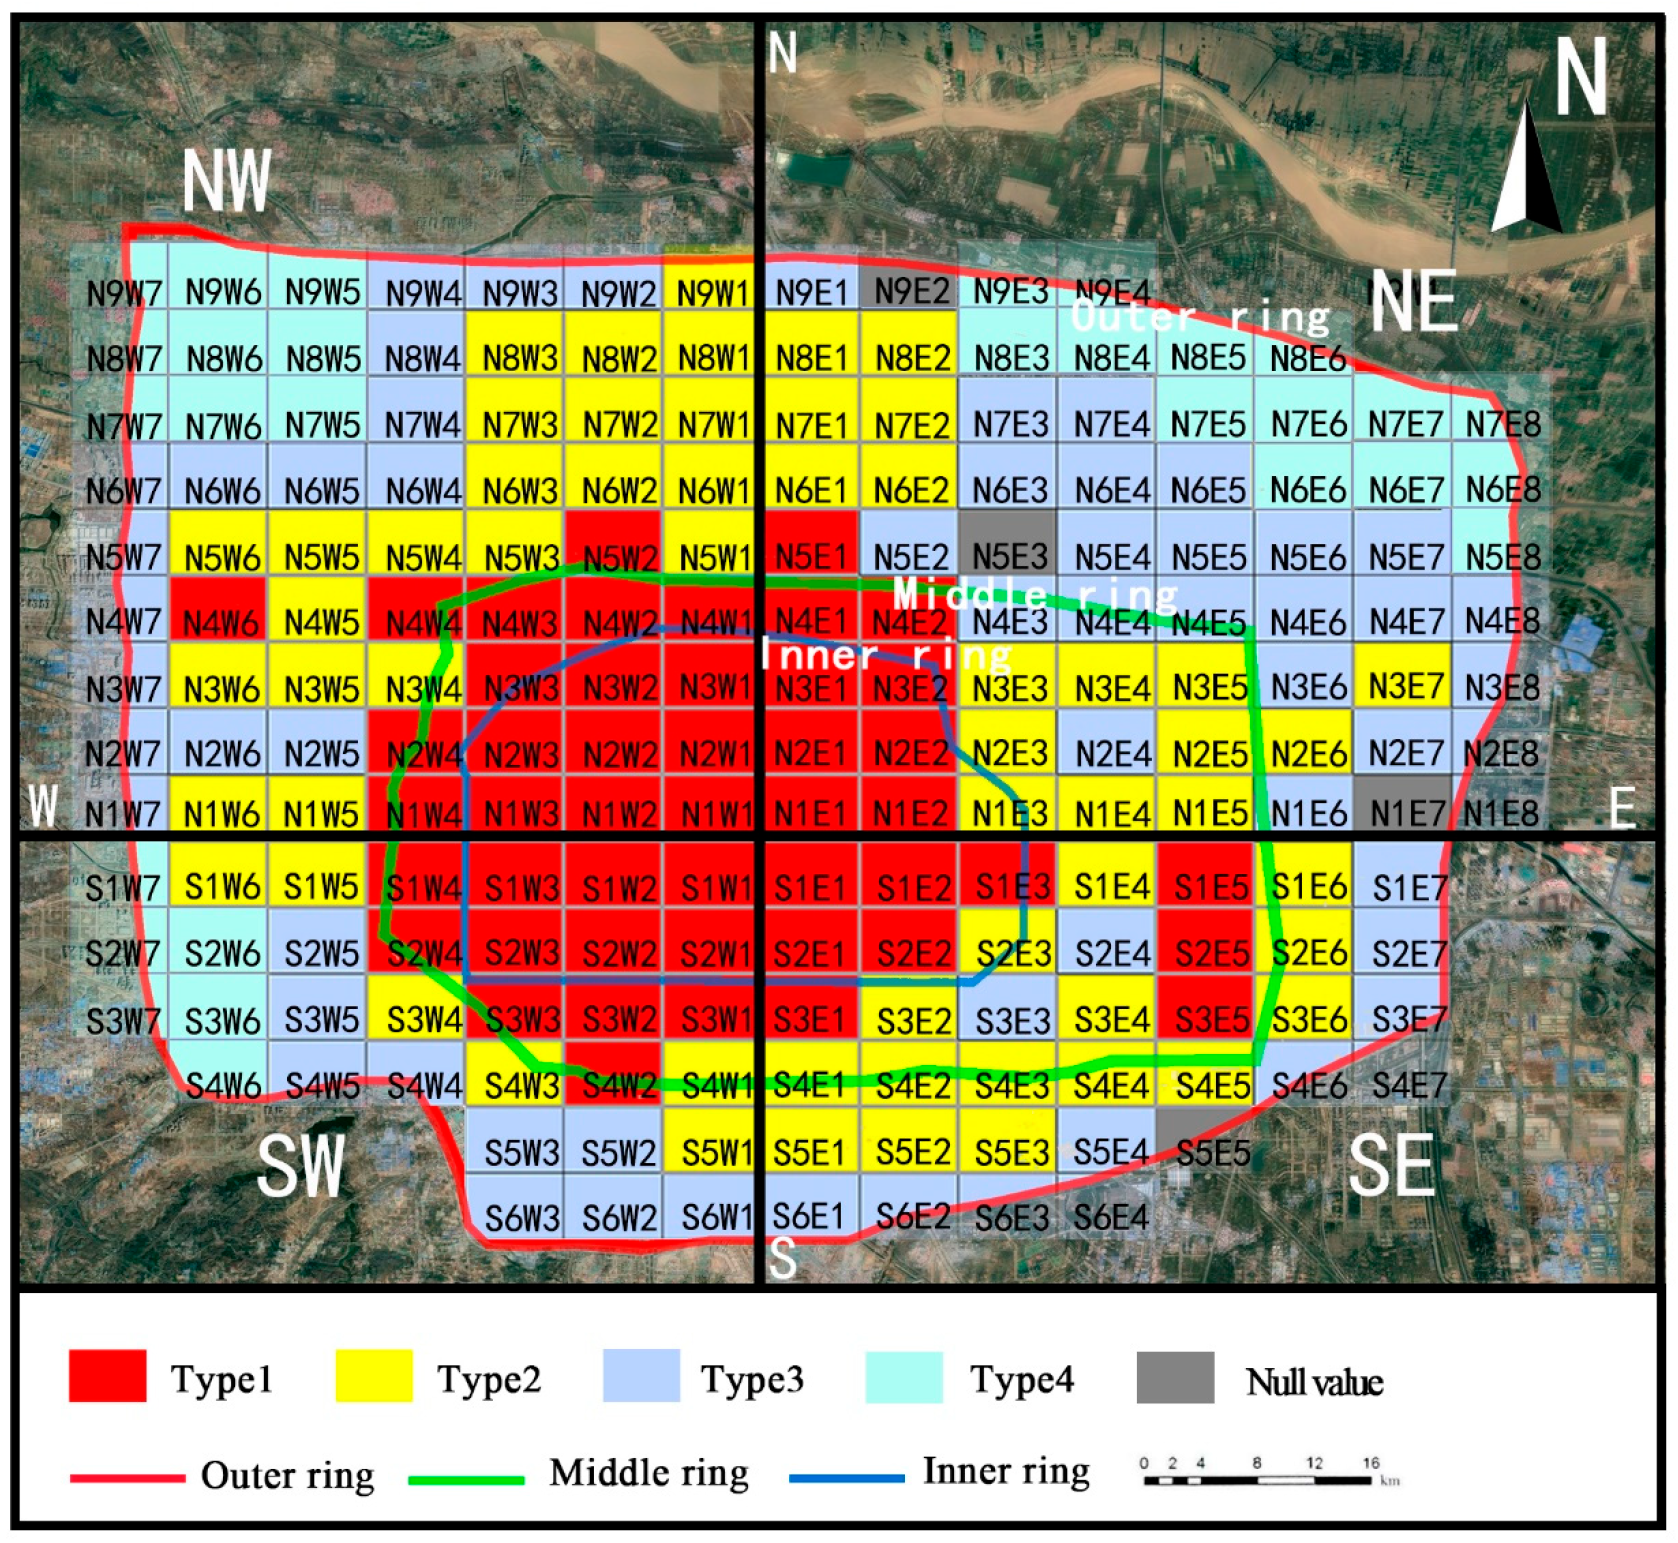
3.2.1. Architectural Spatial Form Distribution Based on the 2D Fractal

The 2D fractal dimensions of the buildings in each grid of the outer ring of Zhengzhou City are calculated, and then the calculation results are compared with the fractal dimensions of the basic forms (as shown in Table 1). According to the comparison results, the architectural forms in the study area are divided (Figure 5). Finally, the local autocorrelation analysis of the 2D spatial forms is carried out (Figure 6).
As shown in Figure 5. Comparing the spatial differences of different grids, the 2D fractal dimension of the buildings from the inner ring to the outer ring gradually decreases, and the building layout trends away from concentration towards dispersion with distance from the city center, reflecting an obvious gradient. This result corresponds to the development status of Zhengzhou: the buildings in the inner ring are densely distributed with more open spaces from the inner ring to the middle ring, and the distribution of buildings between the middle ring and the outer ring is relatively scattered. There are no buildings or few buildings in the northeast, northwest, and southwest grids of the outer ring, so it is defined as Type 4.
This rule is verified in local auto-correlation analysis. As shown in Figure 6, two H-H clusters (Type 1) occupy the western half of the middle ring. The large H-H cluster is enclosed by N5E1-N1W4-S1W4-S6W1-N1E3, and the small H-H cluster is enclosed by N3W4-N4W4. The L-L cluster (Type 3) mainly occupies in the northeast area between the middle ring and the outer ring, and the main area is surrounded by N7E4-N4E3-N5E5. Finally, the H-L clusters (Type 2) include N3E5-N2E6-N2E7, N5E2-N4E2, S1E6-S1E7, and grid N5E7, mainly located in the east and north between the outer ring and the middle ring. The L-H grid does not appear.

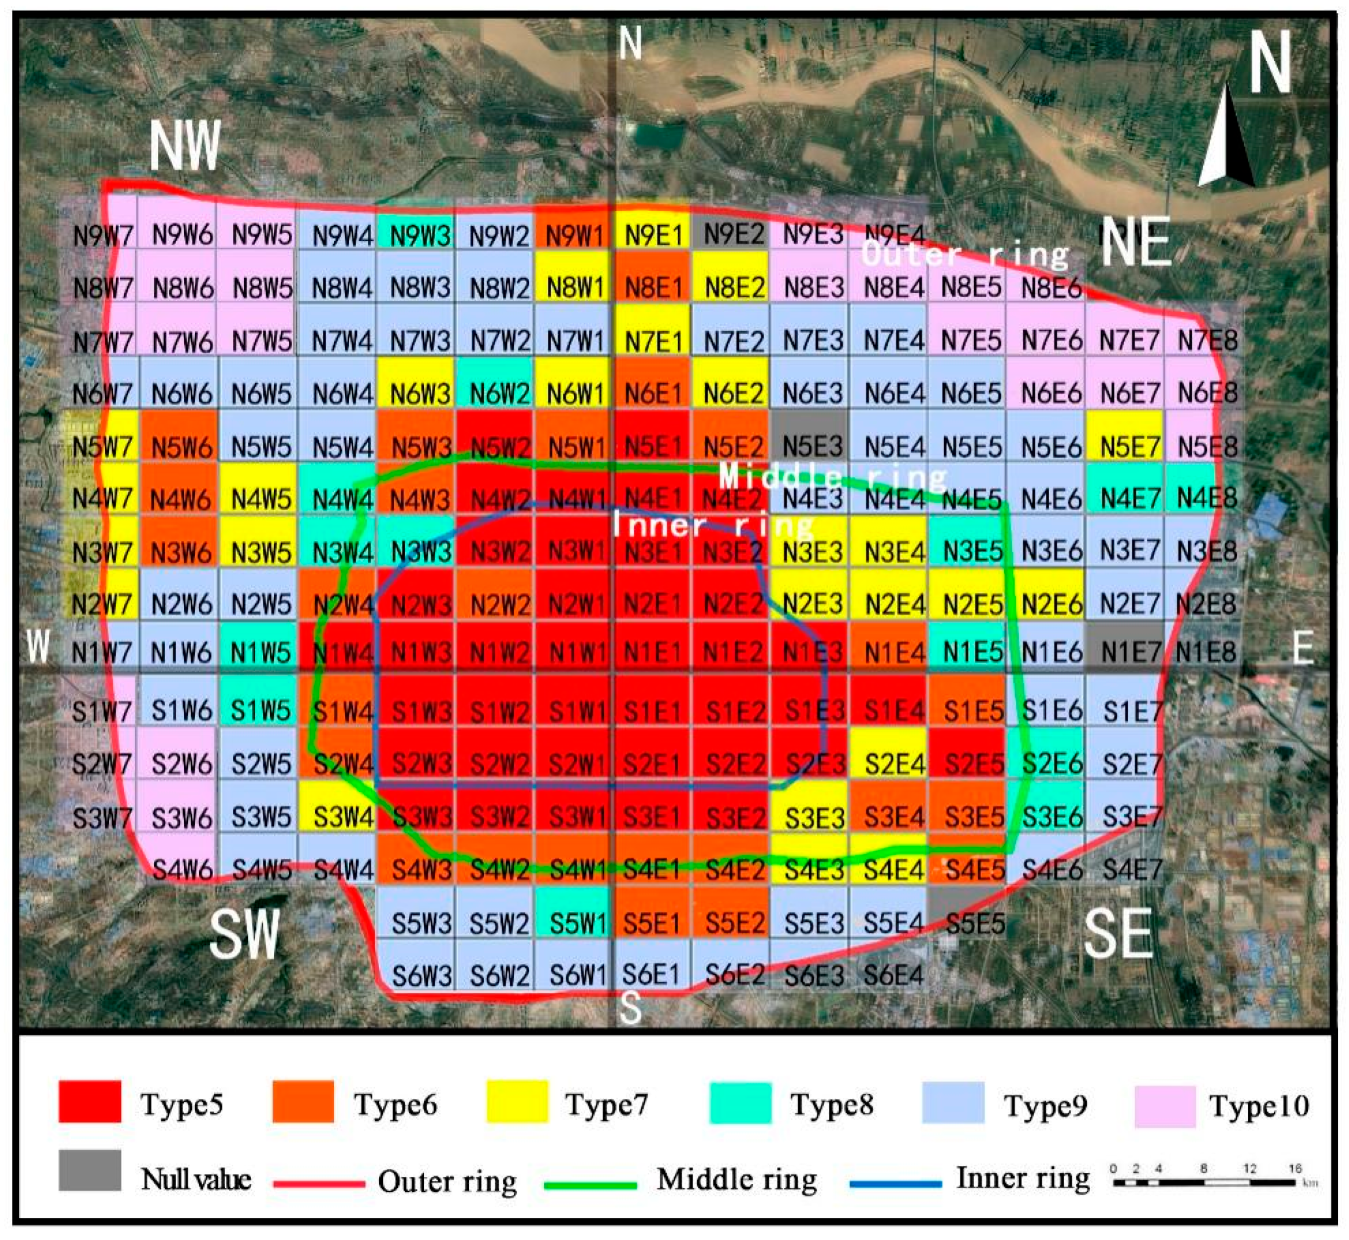
3.2.2. D Fractal Research

The 3D fractal dimensions of the buildings in each grid of the outer ring of Zhengzhou City are calculated, and then the calculation results are compared with the fractal dimensions of the basic forms (as shown in Table 1). According to the comparison results, the architectural forms in the study area are divided (Figure 7). Finally, the local autocorrelation analysis of the 3D spatial forms is carried out (Figure 8).
According to Figure 7, the log goodness of fit of the 3D fractal of buildings in each grid is above 0.996, showing strict fractal self-similarity. In the whole study area, the 3D fractal dimension shows a decreasing spatial trend from the inside to the outside. Combined with the basic 3D fractal model, the distribution of architectural forms in the study area progresses from “plane concentration—no difference in height”, corresponding to the many old, uniformly-tall buildings in the inner ring of Zhengzhou City, to “plane semi concentration—the difference in height”, corresponding to a large number of new real estate communities, commercial buildings, logistics and storage buildings, high-speed rail stations that have been built interspersed with the old buildings between the inner and middle rings, to “plane dispersion—the difference in height”, corresponding to the suburban industrial plants and natural villages of the outer ring. Overall, the 3D fractal accurately characterizes the urban-rural crisscross phenomenon. There are no buildings or few buildings in the northeast, northwest, and southwest grids of the outer ring, so it is defined as Type 10.
This rule is more evident in the local auto-correlation analysis (Figure 8). H-H agglomeration is mainly distributed around the middle ring, with the main area composed of N5W1-N1W3-S4W1-S1E4-N1E4. L-L clusters are mainly distributed in the northwest, northeast, and southeast between the middle and outer rings and are defined by N7E4-N6E3-N4E4-N5E5 and N1E6-S1E6-S1E7. In addition, the L-L agglomeration also includes grid N2E7, the rectangular region N8W3-N7W3, and grid N6W5. The H-L configuration is scattered mainly in the northwest between the middle ring and the outer ring and is composed of N3E4-N2E6-N3E5, grid N6E2, grid N8E2, and grid N6W3.

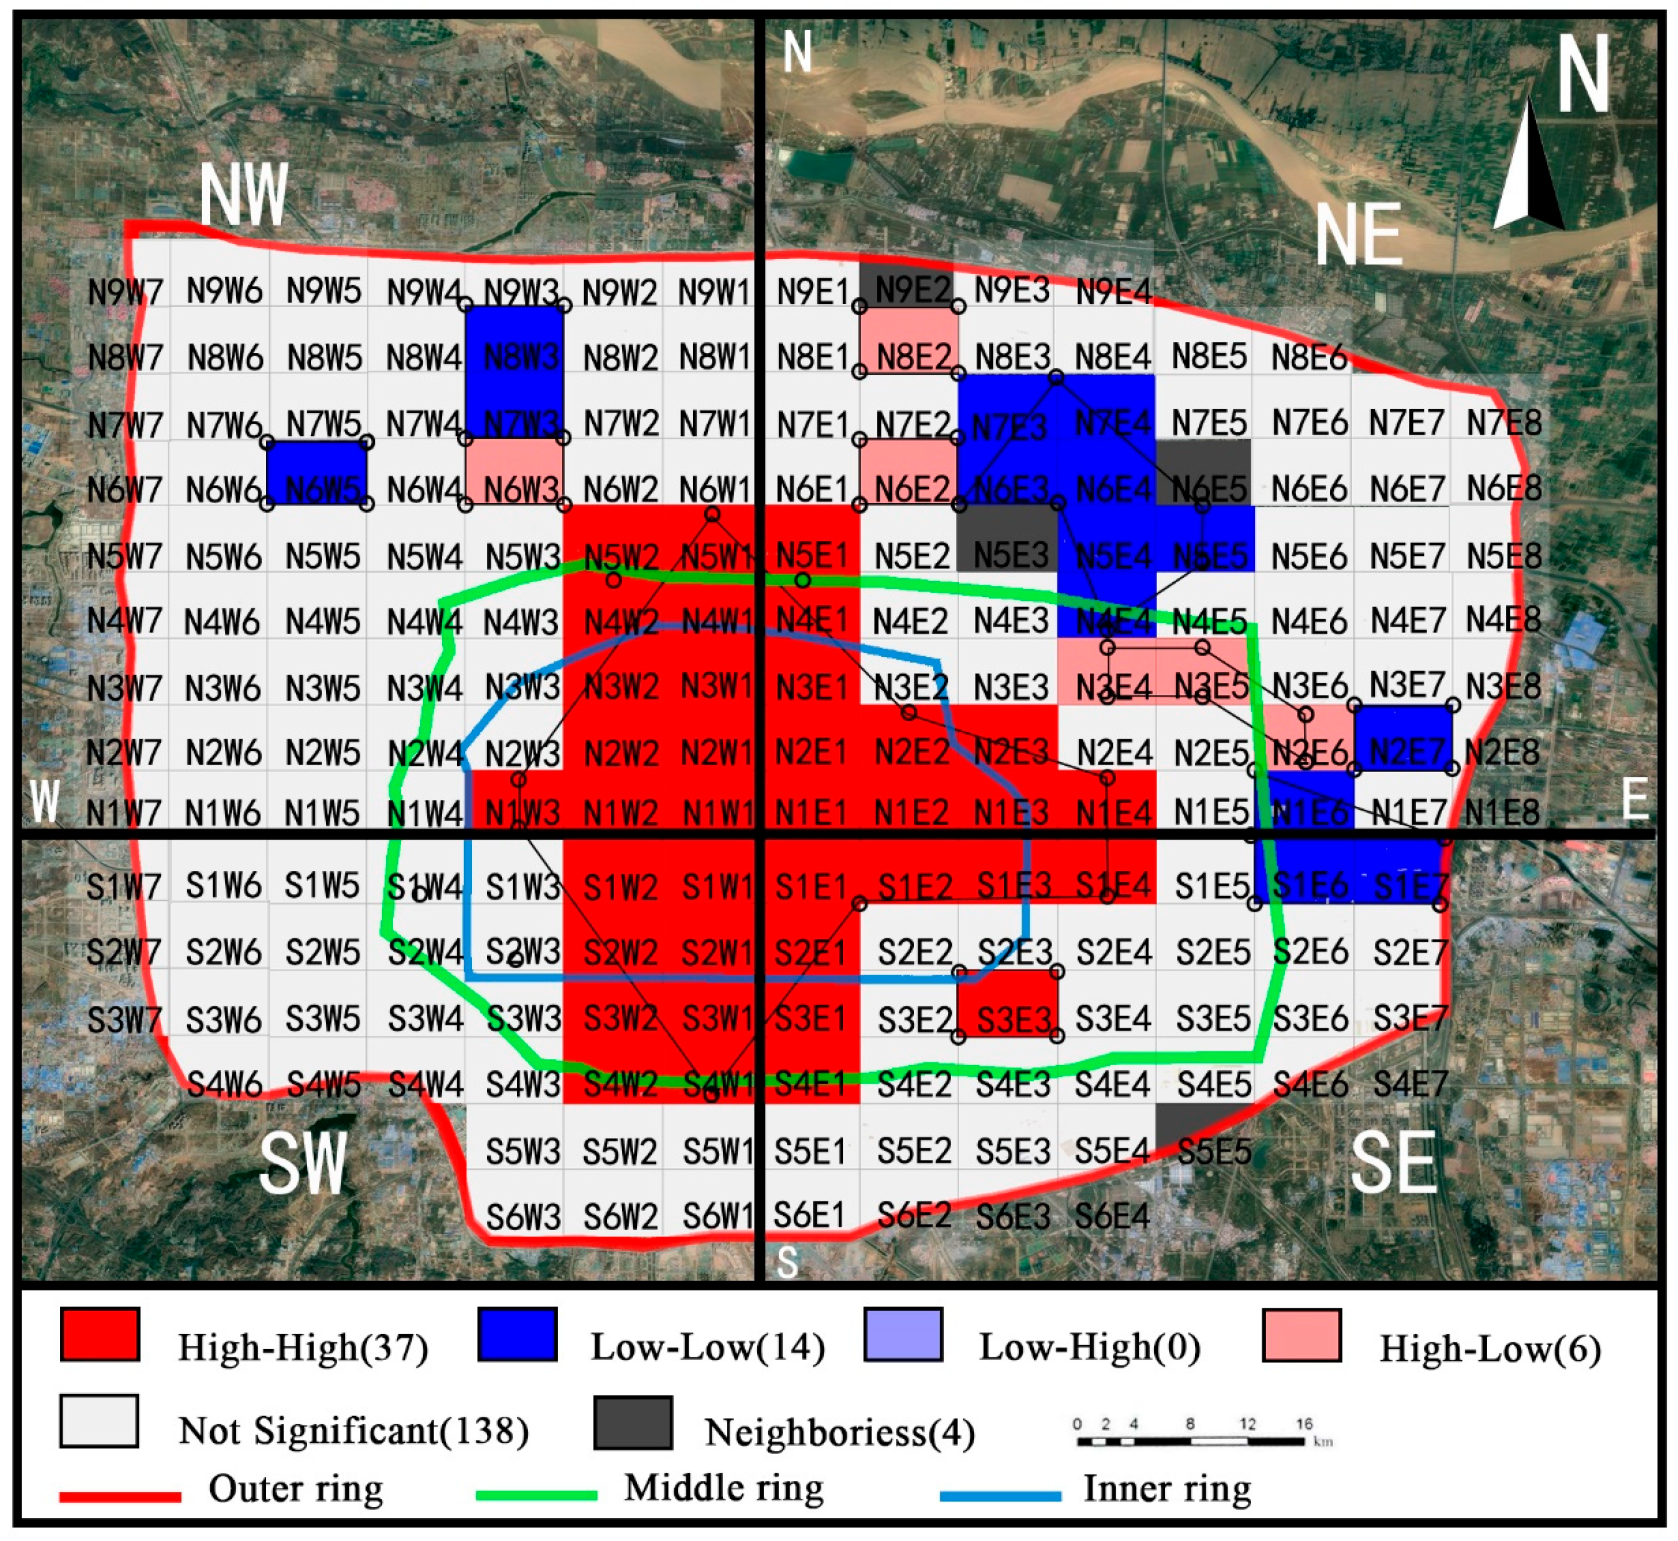
3.3. Spatial Relationship between 2D Mode and 3D Mode

The 2D and 3D fractal dimensions of the buildings in each grid of the outer ring of Zhengzhou City are calculated, and then the calculation results are compared with the fractal dimensions of the basic forms (Table 1). Finally, the bivariate local autocorrelation analysis between 2D and 3D spatial forms is conducted (Figure 9).
According to Figure 9 and Table 1, the Global Moran’s I is positive, meaning the 2D form and 3D form of the buildings are matched on the whole. The more scattered the building layout, the greater the height difference of the building facade. Considering that it is difficult to determine the basic shape mode of buildings through the 3D fractal dimension alone, the 2D fractal and 3D fractal must be combined to carry out bivariate ESDA analysis. H-H clusters (Type 5, Type 6) are distributed in the western half of the middle ring. The H-H agglomeration area is dominated by the irregular area enclosed by N5E1-N1W4-S4W1-S4W2-S4E1-N1E3. The H-L agglomeration area (Type 7) is mainly distributed in the northeast of the middle and outer rings, including grids N5E7, N4E7, N3E5, and N2E6. The L-H cluster (Type 8) has only one grid, N3W4, located in the northwest between the middle and outer rings. The L-L agglomeration area (Type 9) is mainly distributed in the northeast and southeast between the middle and outer rings and consists of two patches: N7E4-N6E3-N4E5-N5E6 and N2E7-N1E6-S1E6-S1E7.

4. Discussion

4.1. Fractal Study of Urban Morphology on Grid Scale

Research on an urban spatial form based on fractal theory mostly measures the fractal dimension of a city at the macro level. For example, Frankhauser calculated the fractal dimension of many urban forms in the world, including Beijing and Taipei, China [34], and Benguigui et al. calculated the fractal dimension of the whole urban area of Tel Aviv as a function of time to study the development trend of urban dynamic evolution [35], and Batty [36], Longley [37], White [38], Kuang Yi [39], Chen Yanguang [40], and other scholars have also carried out urban fractal studies. However, the scale of these case studies is too large to describe the fine differences in spatial morphology of each local city area. Our research divides the main urban area into 199 grids and describes the architectural spatial form of each, which aids in understanding the specific spatial form of each part of the city. In future studies of urban spatial morphology, this method will allow for the division of urban space at multiple scales.

4.2. Combination of Fractal Theory and Spatial Auto-Correlation

Cases of fractal theory in urban research include urban boundary and urban land use [17], urban form entropy and urban fractal dimension [18], timeliness of urban fractal [19], and urban simulation [20]. Research on urban fractal mainly focuses on two-dimensional fractal of the urban plane form [18,19,20], and a few scholars conduct three-dimensional fractal research on an urban spatial form based on the volume of buildings [30,31]. The focus of the relevant study is a specific expression of urban forms which are lacking in the analysis of the agglomeration mode and distribution rules of urban forms. Spatial auto-correlation is suitable for measuring the agglomeration of geographical units in space, which can present the distribution pattern of urban geographic units [41,42,43]. Overview, relevant research either uses fractal theory or spatial autocorrelation method in architectural form, which is missing the necessary combination of the two methods. A basic architectural form model is built in the manuscript, which combines both fractal theory and spatial autocorrelation, will reveal the distribution law and correlation of architectural form in a better way.

4.3. Research on 2D and 3D Fractal Combination

Traditional 2D fractal research aims to reveal the plane shape of a city, but it struggles to reflect the changes in a city’s 3D space. There are even a small number of pioneering scholars trying to expand the research scale of urban space into 3D [30,31,32]. However, there is a lack of research combining 2D and 3D fractal analysis, despite the clear benefits. Based on the basic architectural form, combining the 2D with 3D fractal allows urban space to be visually expressed from two perspectives: plane and elevation.

4.4. Application of Fractal Theory

Based on the three-dimensional fractal research, the three-dimensional form of the urban space can be described digitally, such as defining the form of urban buildings and the aggregation situation. The practical significance requires further exploration, the further research can be conducted in the following areas: ① Study on the relationship between architectural form distribution and architectural function [43]. ② Study on the relationship between architectural form distribution and urban development process [36]. ③ Study on the relationship between architectural form distribution and urban traffic [17]. ④ Study on the relationship between architectural form distribution and urban human flow distribution [44,45,46]. ⑤ Study on the relationship between architectural form distribution and urban and rural planning [22].
In summary, the theoretical and applied research of architectural form and layout based on fractals is still in a phase of exploration. However, it can help people deepen their understanding about the urban process, meanwhile, it will enhance rationality and sustainability about the construction of the urban.

5. Conclusions

This study establishes the corresponding relationship between fractal dimension and architectural form, and quantifies the plane and spatial form of architecture, which is helpful to promote the visualization research of fractal theory. In addition, the refined grid division can more accurately show the architectural form of various locations in the city. The main conclusions of the study are as follows.

5.1. Grid-Scale Fractal Research, Urban Spatial Form, and the Direction of Urban Development

In this study, the buildings surrounded by the Fourth Ring Road of Zhengzhou were divided into 199 research areas, and the architectural space form of each area was calculated and visualized. This study displays the architectural space form of various areas of the city, which is a more refined study of urban space form compared to traditional approaches. By calculating the fractal dimension of each grid, the spatial differences in various regions of the city can be revealed, reflecting the regional differences in urban development.
Taking Zhengzhou as an example, the expansion in the east was faster than that in the west in the previous development process. Based on the analysis of spatial form, the distance from the east inner ring to the east middle ring is much larger than the distance from the west inner ring to the west middle ring, and the urban spatial functional attributes and architectural forms on the east side are also richer. In the fractal dimension, the regional variation of the northeast and southeast is more obvious than that of the northwest and southwest. The local regional changes are more obvious in the northwest and southwest. The results show that by analyzing the building fractal dimension of different grids, the main development direction of the city can be identified.

5.2. D and 3D Fractal Combinations and Urban Space Visual Expression

2D fractals can analyze the characteristics of urban form from the perspective of building plane distribution while 3D fractals focus on the façade expression of urban spatial form; the combination of 2D and 3D fractal analysis can describe the urban spatial form with more accuracy. In addition, by comparing the fractal calculation results of each grid with the fractal interval, the fractal value can be visualized and the 2D and 3D visual forms of each part of the study area can be clarified.

5.3. D and 3D Fractals and Spatial Auto-Correlation

In this study, the spatial auto-correlation value of the 2D fractal is 0.053, the spatial auto-correlation value of the 3D fractal is 0.125, and the spatial auto-correlation value of the 2D and 3D fractal combined is 0.087. The value of local auto-correlation and the fractal results of the architectural form in the study area show obvious spatial auto-correlation. Introducing spatial auto-correlation into the fractal theory can clarify the relationship between them and the surrounding areas on the basis of the characterization of the architectural forms in each grid.

Author Contributions

Conceptualization, Qindong Fan and Xuejian Mei; methodology, Chenming Zhang and Xiaoyu Yang; software, Qindong Fan and Xiaoyu Yang; validation, Xuejian Mei and Chenming Zhang; formal analysis, Qindong Fan; investigation, Xuejian Mei and Qindong Fan; resources, Chenming Zhang and Xiaoyu Yang; data curation, Chenming Zhang and Xuejian Mei; writing—original draft preparation, Chenming Zhang; writing—review and editing, Chenming Zhang and Xiaoyu Yang; visualization, Qindong Fan and Xuejian Mei; supervision, Xuejian Mei; project administration, Qindong Fan; and funding acquisition, Xiaoyu Yang. All authors have read and agreed to the published version of the manuscript.

Funding

This study was supported by 2019 Key R&D and Promotion Projects in Henan Province (No. 192102310004), Henan Ecological Civilization City Theory and Application Innovative Scientific and Technological Team, (HNKJZK-2020-02C), 2020 Henan Science and Technology Think Tank Research Project (HNKJZK-2020-25C).

Data Availability Statement

Not applicable.

Acknowledgments

I am very grateful to my tutor for helping me to complete the topic selection and conception of the thesis, and gave me a lot of valuable suggestions on the revision of my thesis, so that my paper has been constantly improved. In addition, in the process of completing my thesis, I would like to express my heartfelt thanks to my family and friends who care and help me.

Conflicts of Interest

We declare that we have no financial and personal relationships with other people or organizations that can inappropriately influence our work, there is no professional or other personal interest of any nature or kind in any product, service and/or company that could be construed as influencing the position presented in, or the review of, the manuscript entitled.

References

  1. Ostwald, M.J.; Vaughan, J. The Fractal Dimension of Architecture; Springer International Publishing: Berlin/Heidelberg, Germany, 2016. [Google Scholar]
  2. Schläpfer, M.; Lee, J.; Bettencourt, L. Urban skylines: Building heights and shapes as measures of city size. arXiv 2015, arXiv:1512.00946. [Google Scholar]
  3. Liu, S.; Chen, Y. A Three-Dimensional Box-Counting Method to Study the Fractal Characteristics of Urban Areas in Shenyang, Northeast China. Buildings 2022, 12, 299. [Google Scholar] [CrossRef]
  4. Li, Y.T.; Zhang, L.J. Research on Fractal of urban spatial form based on three-dimensional box dimension algorithm. Mod. Urban Res. 2019, 4, 92–99. [Google Scholar]
  5. Chen, Y.G. Derivation of the functional relations between fractal dimension of and shape indices of urban form. Comput. Environ. Urban Syst. 2011, 35, 442–451. [Google Scholar] [CrossRef]
  6. Chen, Y.G.; Huang, L. Modeling growth curve of fractal dimension of urban form of Beijing. Phys. A Stat. Mech. Its Appl. 2019, 523, 1038–1056. [Google Scholar] [CrossRef] [Green Version]
  7. Chen, Y.G. Exploring the Fractal Parameters of Urban Growth and Form with Wave-Spectrum Analysis. Discret. Dyn. Nat. Soc. 2010, 2010, 1038–1045. [Google Scholar] [CrossRef] [Green Version]
  8. Zhou, Z.H.; Ma, J.; Feng, X.G. Analysis on urban spatial form and driving force of Jiuquan City from 1990 to 2016. Sci. Technol. Eng. 2020, 20, 12104–12111. [Google Scholar]
  9. Fan, Q.; Du, F.; Li, H. A Study of the Spatial Form of Maling Village, Henan, China. Sustainability 2020, 12, 7350. [Google Scholar] [CrossRef]
  10. Kaviari, F.; Mesgari, M.S.; Seidi, E.; Motieyan, H. Simulation of urban growth using agent-based modeling and game theory with different temporal resolutions. Cities 2019, 95, 102387. [Google Scholar] [CrossRef]
  11. Sun, C.; Wu, Z.; Lv, Z.; Yao, N.; Wei, J. Quantifying different types of urban growth and the change dynamic in Guangzhou using multi-temporal remote sensing data. Int. J. Appl. Earth Obs. Geoinf. 2013, 21, 409–417. [Google Scholar] [CrossRef]
  12. Wang, X.W.; Wang, S.J.; Song, Y.; Hu, H. Study on spatial identification and influence mechanism of urban construction land evolution in Changchun. Geogr. Sci. 2015, 35, 873–881. [Google Scholar]
  13. Liu, W.C.; Wang, J.Y.; Kuang, W.H.; Ning, J. Remote sensing analysis of spatiotemporal characteristics of urban and rural construction land expansion in China based on main functional area planning. J. Geogr. Sci. 2017, 27, 643–660. [Google Scholar] [CrossRef]
  14. Teng, F.; Wang, Y.; Wang, M.; Li, S.; Lin, Y.; Cai, H. Study on the spatial-temporal coupling relationship between urban spatial morphology and carbon budget in the Yangtze River Delta urban agglomeration. Acta Ecologica Sinica 2022, 23, 1–15. [Google Scholar]
  15. Li, J.; Qian, Y.; Zeng, J.; Yin, F.; Zhu, L.; Guang, X. Research on the Influence of a High-Speed Railway on the Spatial Structure of the Western Urban Agglomeration Based on Fractal Theory—Taking the Chengdu–Chongqing Urban Agglomeration as an Example. Sustainability 2020, 12, 7550. [Google Scholar] [CrossRef]
  16. Chen, Y.G.; Liu, J.S. An index of equilibrium of urban land-use structure and information dimension of urban form. Geogr. Res. 2001, 20, 146–152. [Google Scholar]
  17. Zhang, C.; Gao, J.; Li, S.; Gao, S.; Zhao, J. Fractal study on urban spatial form agglomeration based on road network accessibility. Geogr. Res. 2018, 37, 2528–2540. [Google Scholar]
  18. Chen, Y.G.; Jiang, S.G. Urban agglomerations, urban agglomerations and urban systems. Urban Dev. Res. 2017, 24, 8–15. [Google Scholar]
  19. Fan, Q.; Mei, X.; Zhang, C.; Wang, H. Urban spatial form analysis based on the architectural layout--Taking Zhengzhou City as an example. PloS ONE 2022, 17, e0277169. [Google Scholar] [CrossRef] [PubMed]
  20. Correia, F.N.; Da Graça Saraiva, M.; Da Silva, F.N.; Ramos, I. Floodplain Management in Urban Developing Areas. Part I. Urban Growth Scenarios and Land-Use Controls. Water Resour. Manag. 1999, 1, 1–21. [Google Scholar] [CrossRef]
  21. Chen, Y.G. Fractal Modeling and Fractal Dimension Description of Urban Morphology. Entropy 2020, 22, 961. [Google Scholar] [CrossRef]
  22. Guo, A.; Yang, J.; Xiao, X.; Xia, J.; Jin, C.; Li, X. Influences of urban spatial form on urban heat island effects at the community level in China. Sustain. Cities Soc. 2019, 53, 101972. [Google Scholar] [CrossRef]
  23. Shen, G.Q. Fractal dimension and fractal growth of urbanized areas. Int. J. Geogr. Inf. Sci. 2002, 16, 419–437. [Google Scholar] [CrossRef]
  24. Encarnação, S.; Gaudiano, M.; Santos, F.C.; Tenedório, J.A.; Pacheco, J.M. Fractal cartography of urban areas. Sci. Rep. 2012, 2, 527. [Google Scholar] [CrossRef] [PubMed] [Green Version]
  25. Huang, L.S.; Chen, Y.G.; Li, S.C. Multi fractal dimension spectral analysis of urban land spatial structure in Beijing, Tianjin and Hebei. Prog. Geogr. Sci. 2019, 38, 50–64. [Google Scholar]
  26. Crompton, A. The fractal nature of the everyday environment. Environ. Plan. B Plan. Des. 2001, 28, 243–254. [Google Scholar] [CrossRef]
  27. Crompton, A. Fractals and Picturesque Composition. Environ. Plan. B Plan. Des. 2002, 29, 451–459. [Google Scholar] [CrossRef]
  28. Li, Y.; Zhang, L.; Ye, S.; Qi, X. Improvement and application of two-dimensional fractal model of urban growth and morphology. J. Earth Inf. Sci. 2020, 22, 2140–2151. [Google Scholar]
  29. Yang, J.; Guo, A.; Xi, J.; Ge, Q.; Li, X. Study on temporal and spatial differentiation characteristics of urban three-dimensional landscape pattern—A case study of Zhongshan District, Dalian. J. Geogr. 2017, 72, 646–656. [Google Scholar]
  30. Zhang, Q.; Zhou, D.; Xu, D.; Rogora, A. Correlation between cooling effect of green space and surrounding urban spatial form: Evidence from 36 urban green spaces. Build. Environ. 2022, 222, 109375. [Google Scholar] [CrossRef]
  31. Zhou, W.Q.; Tian, Y.Y. Research Progress on thermal environment effect of urban three-dimensional spatial form. J. Ecol. 2020, 40, 416–427. [Google Scholar]
  32. Liang, J.; Xu, L.; Li, J.; Ding, X. Fractal Design of Indoor and Outdoor Forms of Architectural Space Based on a Three-Dimensional Box Dimension Algorithm. Math. Probl. Eng. 2022, 2022, 2069757. [Google Scholar] [CrossRef]
  33. Chen, Y.G. Fractal Dimension Estimation and Fractal Judgment of Urban Form. Adv. Geogr. Sci. 2017, 36, 529–539. [Google Scholar]
  34. Frankhauser, P. Comparing the morphology of urban patterns in Europe: A fractal approach. Eur. Cities-Insights Rep. COST Action 2004, 2, 79–105. [Google Scholar]
  35. Benguigui, L.; Czamanski, D.; Marinov, M.; Portugali, Y. When and where is a city fractal? Environ. Plan. B 2000, 27, 507–520. [Google Scholar] [CrossRef]
  36. Batty, M.; Longley, P.A. Fractal Cities: A Geometry of Form and Function; Academic Press: London, UK, 1994. [Google Scholar]
  37. Batty, M.; Longley, P.; Fotheringham, S. Urban growth and form: Scaling, fractal geometry, and diffusion-limited aggregation. Environ. Plan. A 1989, 21, 1447–1472. [Google Scholar] [CrossRef]
  38. White, R.; Engelen, G. Cellular automata and fractal urban form: A cellular modelling approach to the evolution of urban-land-use patterns. Environ. Plan. A 1993, 25, 1175–1199. [Google Scholar] [CrossRef] [Green Version]
  39. Kuang, Y.; Chen, Y.G. DLA and DBM Models and Fractal Simulation of Urban Growth: A Theoretical Discussion on Urban Fractal Morphological Simulation Methods. J. Xinyang Norm. Univ. Nat. Sci. Ed. 2001, 14, 303–308. [Google Scholar]
  40. Chen, Y.G.; Huang, K. Fractal dimension of urban form: Theoretical discussion and practical teaching. J. Xinyang Norm. Univ. Nat. Sci. Ed. 2002, 15, 62–67. [Google Scholar]
  41. Qin, J.; Fang, C.; Wang, Y.; Li, Q.; Zhang, Y. A three dimensional box-counting method for estimating fractal dimension of urban form. Geogr. Res. 2015, 34, 85–96. [Google Scholar]
  42. Zhang, L.S.; Chen, G.; Han, Y.; Zhang, T. 3D box-counting algorithm for calculating fractal dimension of cities. J. Comput. Appl. 2010, 30, 2070–2072. [Google Scholar] [CrossRef]
  43. Long, F.; Dai, X.F.; Yu, H. Shanghai accommodation industry space layout characteristics based on road network form. Geogr. Sci. 2021, 41, 1569–1577. [Google Scholar] [CrossRef]
  44. Liu, K.; Duan, Y.Y.; Lu, F. Urban road traffic status space based on topology and morphological characteristics. J. Earth Inf. Sci. 2014, 16, 390–395. [Google Scholar]
  45. Bento, A.M.; Cropper, M.L.; Mobarak, A.M.; Vinha, K. The effects of urban spatial structure on travel demand in the United States. Rev. Econ. Stat. 2005, 87, 466–478. [Google Scholar] [CrossRef]
  46. Li, X. Zhengzhou City Multi-Center Spatial Famination Based on the Scope of Gravity forces. J. Geogr. 2022, 77, 1475–1489. [Google Scholar]
Figure 1. The study area.
Ijgi 11 00622 g001
Figure 2. The basic model of the 2D building.
Ijgi 11 00622 g002
Figure 3. The basic model of the 3D building.
Ijgi 11 00622 g003
Figure 4. Gradient and grid division of the study area.
Ijgi 11 00622 g004
Figure 5. 2D space buildings form in the Fourth Ring Road of Zhengzhou.
Ijgi 11 00622 g005
Figure 6. Local auto-correlation in 2D space.
Ijgi 11 00622 g006
Figure 7. 3D spatial form distribution of buildings in Zhengzhou outer ring.
Ijgi 11 00622 g007
Figure 8. 3D spatial local auto-correlation of architectural form in the study area.
Ijgi 11 00622 g008
Figure 9. Local auto-correlation in multi-dimensional bivariate space.
Ijgi 11 00622 g009
Table 1. Fractal interval division based on basic architectural models.
DimensionBasic FormBasic Form DescriptionFractal Dimension (D)R2Fractal Interval
2D formType1Concentration form1.83640.9963[1.8205,1.8433]
Type2Semi centralized form1.80470.9962[1.7764,1.8205)
Type3Dispersion form1.74800.9986[1.6261,1.7764)
3D formType4No building1 1
Type5Plane concentration—no difference in height2.50840.9991[2.4809,2.5571]
Type6Plane semi concentration—no difference in height2.45340.9976[2.4397,2.4809)
Type7Plane semi concentration—height difference2.42590.9987[2.4158,2.4397)
Type8Plane dispersion—no difference in height2.40570.9986[2.3933,2.4158)
Type9Plane dispersion—height difference2.38080.9994[2.0967,2.3933]
Type10No building2 2
Publisher’s Note: MDPI stays neutral with regard to jurisdictional claims in published maps and institutional affiliations.

