1. Introduction
Emergency shelters are important public service facilities in cities, which can provide essential safety and living services when disaster strikes [
1]. With the process of urbanization, increasingly more people are settling in cities, which can lead to greater losses in cities affected by natural disasters. Therefore, the fair and reasonable provision of safe sites for residents has become more prominent.
Spatial accessibility refers to the degree of convenience of accessing one place over another [
2,
3]. The methods commonly used to analyze spatial accessibility include the minimum distance [
4], network analysis [
5], gravity model [
6], and two-step floating catchment area (2SFCA) [
7] methods, as well as spatial simulations [
8]. Since the 2SFCA method can analyze the multi-dimensional features of public service facilities, such as the spatial distribution of service providers and demands and the capacity of shelters, it is widely used in various scenarios. A series of models have been established by the 2SFCA method [
9]. The 2SFCA method was proposed by Luo and Wang [
10], who comprehensively considered the spatial quantity relationship between the supply and demand sides of the service. However, the original 2SFCA method was developed in relation to three distinct facets to suit complex, real-world environments, which include distance decay [
11], the size of catchment areas [
12], and the competition of the supply or demand of service facilities [
13]. The inverted 2SFCA method [
14] was proposed to measure the crowdedness of supply facilities. The fixed-coverage-based two-step floating catchment area (FC2SFCA) method [
15] was developed by using the service suppliers’ catchment areas both in steps one and two in 2020. The original 2SFCA method and its modified versions have been used to analyze the spatial accessibility of public facilities, such as parks [
16,
17,
18], green spaces [
19], hospitals [
20,
21,
22], schools [
23], emergency shelters [
24], fire stations [
25], job opportunities [
26], and banks [
27]. However, the 2SFCA method and its modified versions still present weakness when attempting to settle the three distinct facets.
There are various distance decay functions: Gaussian [
25], kernel-density [
28], and hybrid-function [
29] distributions. However, it is difficult to unify the decay function for various situations. As for the catchment size, Luo proposed a variable two-step floating catchment area (V-2SFCA) method by summarizing the demand or supply factors to calculate the catchment radii [
30]. McGrail divided the medical service radius into five categories by examining experience and population density [
12]. Tao valued the service radius of a pension agency based on its service capacity [
31]. These algorithms do not consider the internal interaction between the supply and demand factors in the two dimensions of quantity and spatial distribution in the calculation of the search radius, which usually leads to computational errors in spatial accessibility [
32]. The catchment sizes of service suppliers are affected by numerous factors, such as the quantity and spatial location of supply and demand and the internal competition between the supply and demand sides. While every service supply has its own catchment size, it is difficult to obtain a suitable catchment size for searching service suppliers in the second step of the 2SFCA method. In the inverted two-step floating catchment area (i2SFCA) method, the same problem occurs due to different service radii.
At present, there are numerous researchers studying the spatial accessibility of emergency shelters by the 2SFCA method and its variants. For example, Zhu calculated the spatial accessibility of an emergency shelter in Changchun by the variable 2SFCA method [
24]. Zhou studied the spatial accessibility of emergency shelters in Beijing by an enhanced two-step floating catchment area (E2SFCA) method [
33]. However, the competitiveness of both in both emergency shelters and census tracts has been overlooked in these studies. There is a considerable difference between emergency shelters and other public facilities. The demand of citizens for emergency shelters following the occurrence of a disaster is high and competitive. Citizens would definitely make full use of the emergency shelters available to them. Generally, they tend to choose a relatively less crowded shelter when several shelters provide their services. However, the 2SFCA method is less concerned with those factors. Therefore, when deciding on the catchment size of emergency shelters, the traditional 2SFCA method is rigid, and the spatial accessibility of emergency shelters would be inaccurate.
It is suggested in the literature that the service radius and competitive relationship of emergency shelters are interactive. The essence of competition among emergency shelters is the evacuees’ choice of shelter. For the evacuees, the factors that influence their choice of shelter are the distance and quality of services provided for their needs. This paper considers crowdedness as an important parameter to reflect the quality of service provided. From the perspective of the evacuees, they tend to choose a less crowded shelter within a certain nearby spatial area, which creates competition among emergency shelters. From the perspective of the service provider, the size of the service area of an emergency shelter reflects the competitiveness between them. In other words, when the crowding in a shelter is less than the average crowdedness of the shelters around it, then the shelter is attractive and competitive. In this case, people will be attracted to the shelter from a greater distance, thus expanding its radius of service, which improves its competitiveness status. In this paper, the conception of a service subset is defined. Firstly, we propose a method to calculate the catchment size of emergency shelters by using service subsets concerning the distribution of the population and emergency shelters, the weight of emergency shelters, and their impact on others around them. Then, using the FC2SFCA method, we calculate the spatial accessibility of emergency shelters. This method is known as the adaptive catchment sizes 2SFCA (A-2SFCA).
The remainder of this paper is organized as follows:
Section 2 describes the study area and data;
Section 3 addresses the proposed method;
Section 4 analyzes the experimental results;
Section 5 provides the discussion; and finally,
Section 6 presents the conclusions.
2. Study Area and Data
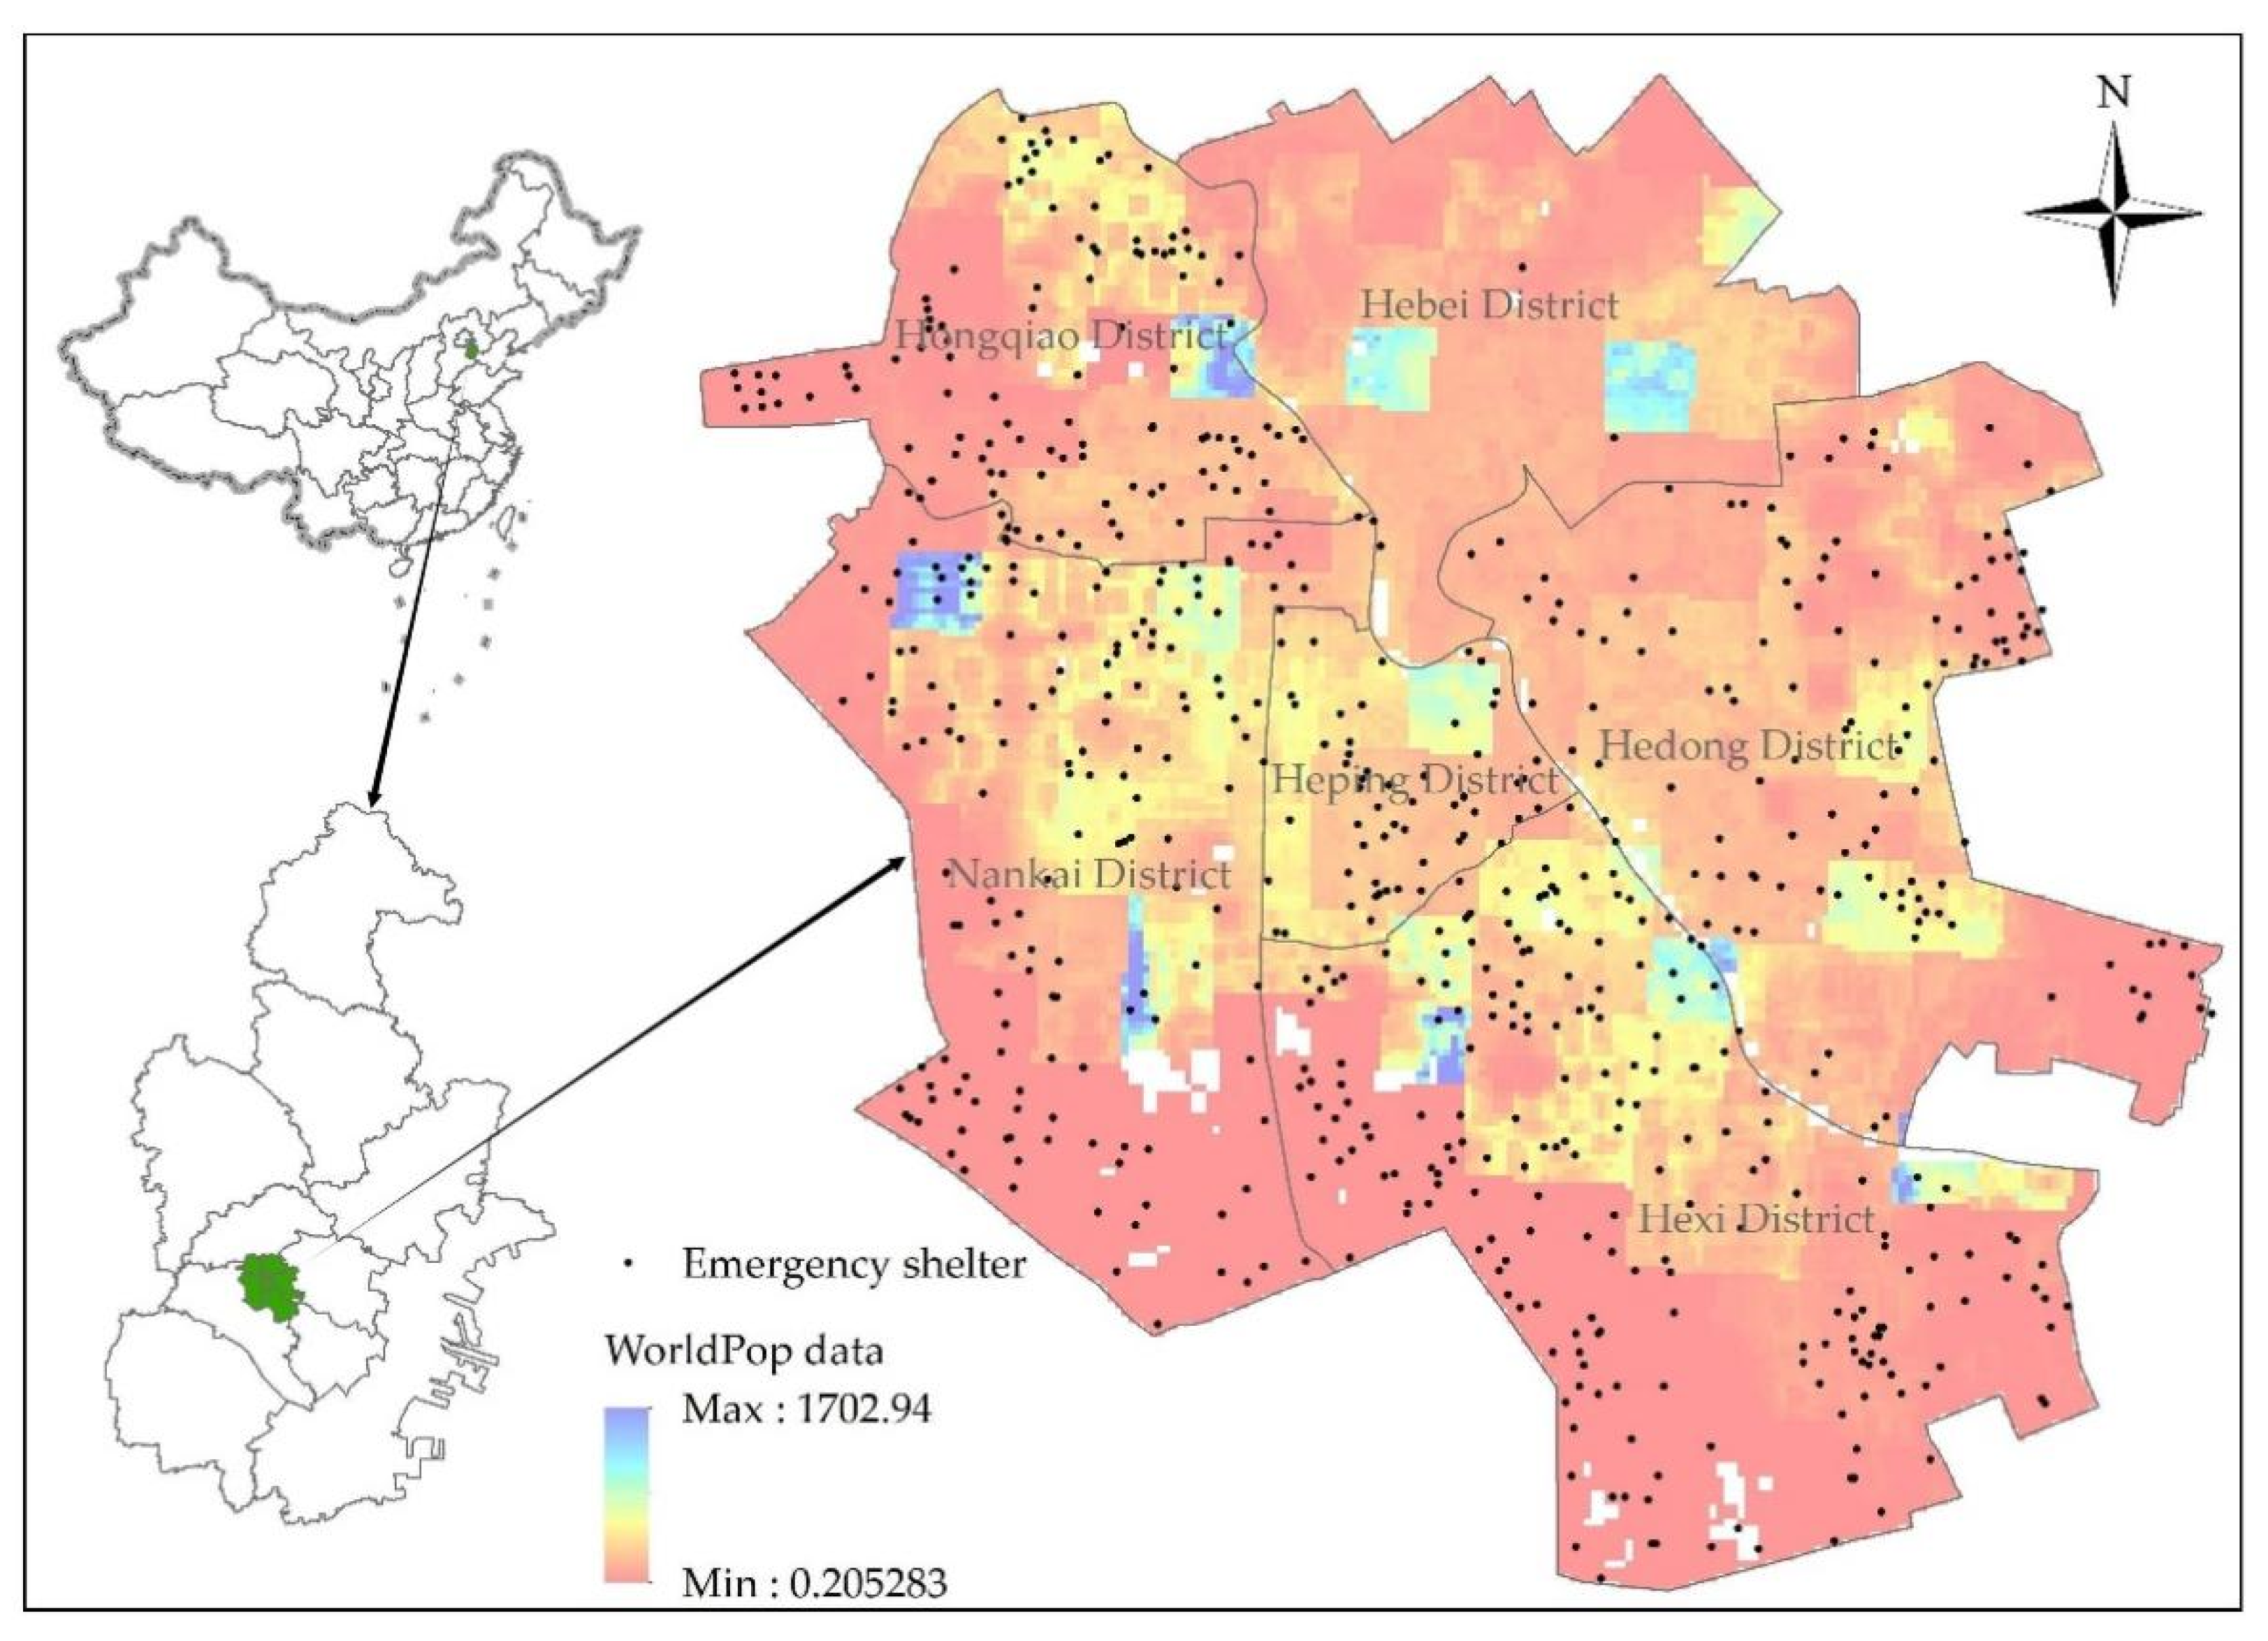
Tianjin is one of four municipalities in China, and it is the shipping center in the north of China. The study area of this study is the downtown area of Tianjin, composed of six districts (
Figure 1). The area measures 194.22 square kilometers. The entire population was approximately 4 million (4,057,200) by the end of 2020. In order to refine the population data, this study adjusted the WorldPop population distribution data using the seventh population census data. The average population density in the urban area is 20,888 people per square kilometer. Heping District has the highest population density, reaching 35,552 people per square kilometer. Hexi District has the lowest population density compared to the other five districts, with 16,926 people per square kilometer.
There were 682 emergency shelters in downtown Tianjin (
Figure 1) until 2020, which included parks, green spaces, and school playgrounds. To date, two types of emergency shelters exist: central and temporary refuge places with corresponding service radii of 1500 and 500 m, respectively.
Four types of data were used in this study. The emergency shelter data (
Figure 1) were obtained from the Bureau of Emergency Management of Tianjin (
http://yjgl.tj.gov.cn, accessed on 1 June 2022). WorldPop data were obtained from the WorldPop research program (
https://www.worldpop.org, accessed on 6 June 2022), and the WorldPop data used in this experiment were the population distribution data for the year 2020 at a resolution of 100 × 100 m
2. The WorldPop data were also preprocessed along with the seventh census data (
http://stats.tj.gov.cn, accessed on 6 June 2022).
Table 1 presents some basic data, such as the seventh census, emergency shelter data, population density, and area of shelter per person. It can be observed that the areas of shelter per person in the Hebei and Hedong Districts are relatively small.
3. Methods
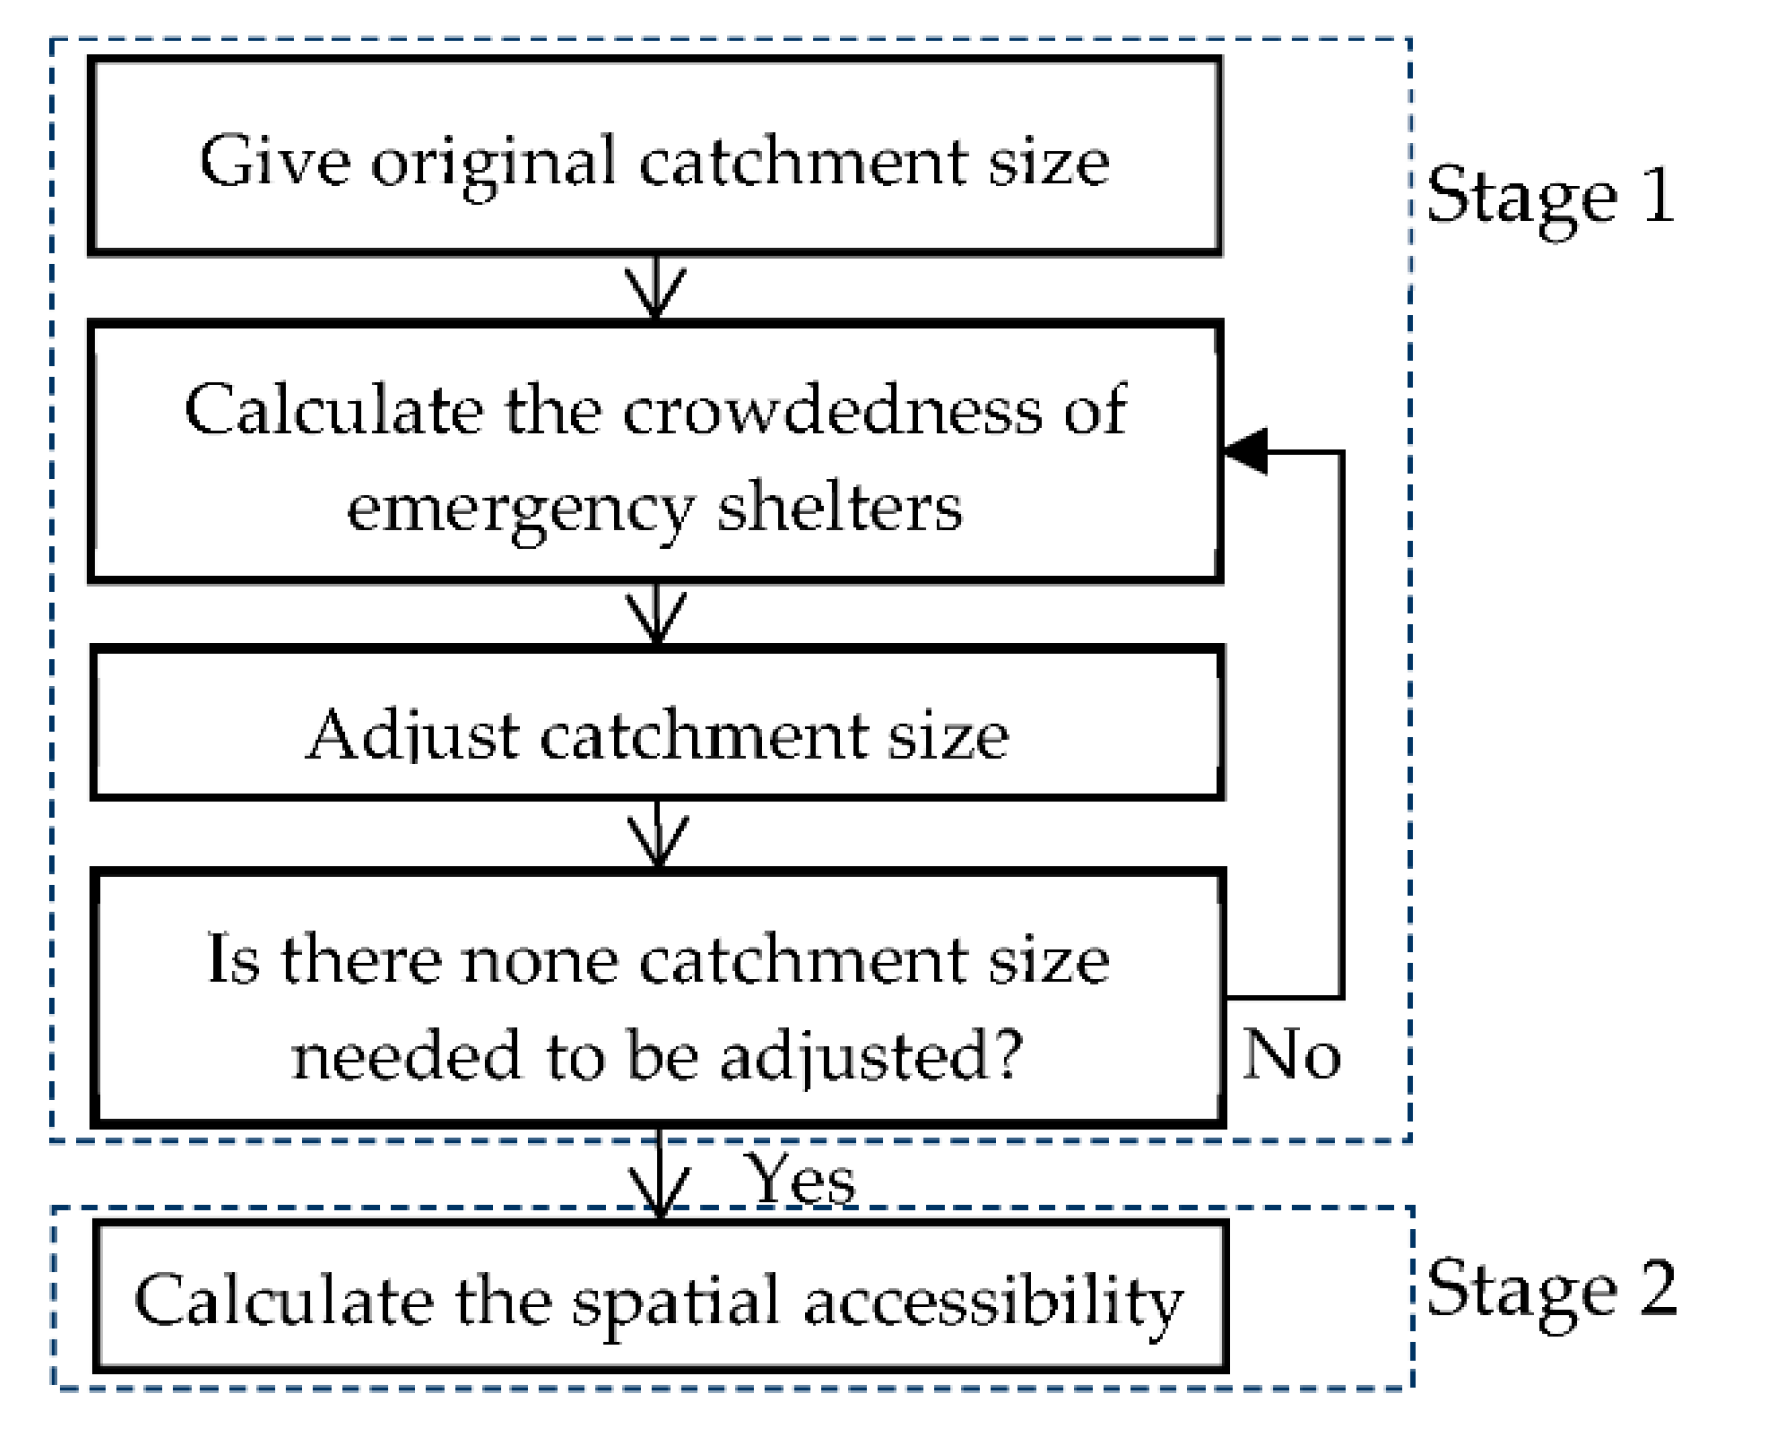
The A-2SFCA method has two stages. The first stage is to calculate the catchment size of the emergency shelter. The second stage is to determine the spatial accessibility.
There are numerous overlaps in the catchment areas of shelters. The concept of a service subset is used in the calculation of the radius of the catchment areas of emergency shelters to facilitate the analytical calculations. The service subset consists of a master shelter and some slave shelters. When an emergency shelter’s catchment area (called the master shelter of the service subset) needs to be adjusted, it is easy to observe that its catchment area is overlapped by several other emergency shelters’ catchment areas (called the slave shelters of this service subset). The master shelter is the object of study in the service subset. Slave shelters have catchment areas that intersect with the master shelter’s catchment area. If the master shelter’s crowdedness is significantly less than the average crowdedness in its slave shelters, the main shelter is then selected by people from further distances, and its catchment area is extended.
In the first stage, the radius of the catchment areas of emergency shelters are provided with a design value, and their level of crowding is firstly calculated. In the service subset of every emergency shelter, when the crowding level of the master shelter is less than the average crowdedness in the slave shelters by a certain amount, the radius of the catchment area of the master shelter is increased. In this case, the master shelter is more attractive than the slave shelters in the service subset when its crowding level is significantly less. When the catchment-area radius of a master shelter increases, it is shown that the shelter becomes competitive in its service subset. The catchment area radius of the master shelter increases by only 10% of its original radius at a time. In the calculations, the maximum radius of the catchment area of each shelter is 1500 m. This method is used cyclically to adjust the catchment area radius of each shelter until there are no more shelter radii to be adjusted. Eventually, all the shelters’ catchment areas are determined. In stage 2, the spatial accessibility of the emergency shelters is calculated based on the FC2SFCA method by using the final catchment area in stage 1.
The calculation process is presented in
Figure 2. Stage 1 is the key step of the A-2SFCA method. In stage 1, every emergency shelter’s catchment area is determined. In the equations presented in this section, the unit of both the capacity of an emergency shelter and the census tract is a person. The distance unit is meters.
3.1. Calculate the Crowdedness Using the i2SFCA Method
In stage 1 of the A-2SFCA method, the crowding in emergency shelters is the key parameter to adjust the catchment area. The i2SFCA method [
14] is used to calculate the crowdedness of emergency shelters. The i2SFCA method contains two steps: step 1 computes the competition intensity for each census tract; step 2 summarizes the demands of each emergency shelter. The Gaussian function [
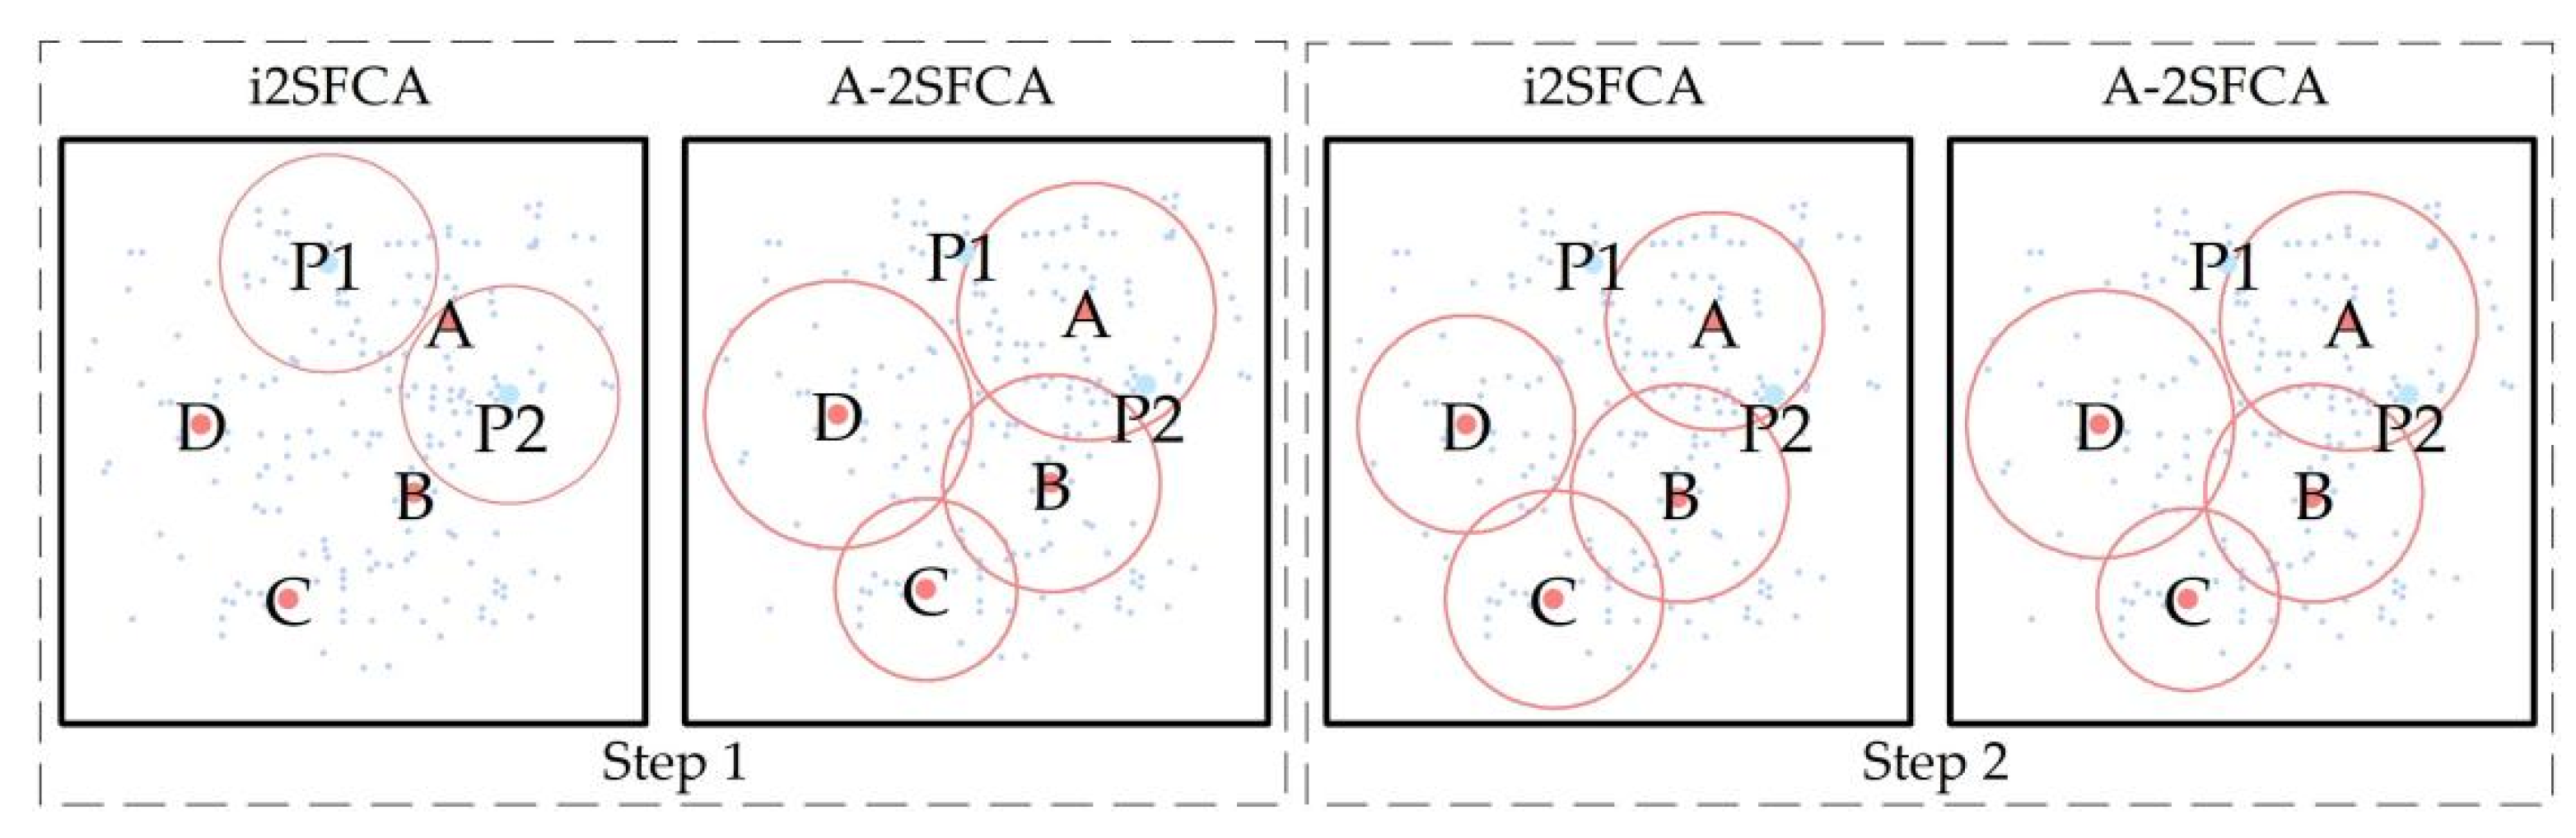
26] is used to measure the travel time decay. However, the i2SFCA method used in this study was adjusted in two places: the fixed catchment area was first introduced, and then every catchment area in an emergency shelter was unique.
The two differences are presented in
Figure 3. There are four emergency shelters (i.e., A, B, C, and D) and two census tracts (i.e., P1 and P2). The threshold travel distance of the i2SFCA method is equal in steps 1 and 2; they are different in the A-2SFCA method. The different catchment area centers were used in both steps of the i2SFCA method. The A-2SFCA method used supply facilities’ catchment areas both in steps 1 and 2.
The detailed steps for calculating the crowdedness are listed below:
- (1)
Initially, the catchment area value is designed by the catchment size.
- (2)
For each census tract location i, search for all emergency shelters j that have covered catchment areas i, and compute the demand-to-supply ratio Qj. The distance decay is discounted by the Gaussian function.
- (3)
For each emergency shelter j, search for all service census tracts i within its service range, and calculate the sum of all demand–supply ratios multiplied by Gaussian weighting. The sum of this is the crowdedness of the shelter j.
where
i is the demand point;
j is the supply point;
Cj is the value of the congestion degree of the supply point;
Qj is the ratio of the population of the demand point covered by the service of the supply point
j to the service capacity;
Ti is the set of supply points providing services to the demand point
i;
Bj is the service capacity of the service provider
j;
Pi is the demand scale of the demand point
i;
dij is the distance between the demand
i and supply points
j;
dj is the service radius of the supply point
j; and
is the Gaussian function that considers the distance decay. The units of
Pi and
Bj are people. The units of
dij,
d0, and
dj are meters. The calculation of the Gaussian function is presented in Equation (2).
In Equation (2), dij represents the distance between the demand i and supply points j; d0 is the maximum distance for the service provider to provide its services. The units of dij and d0 are meters.
3.2. Catchment Area Size-Adjusting Method
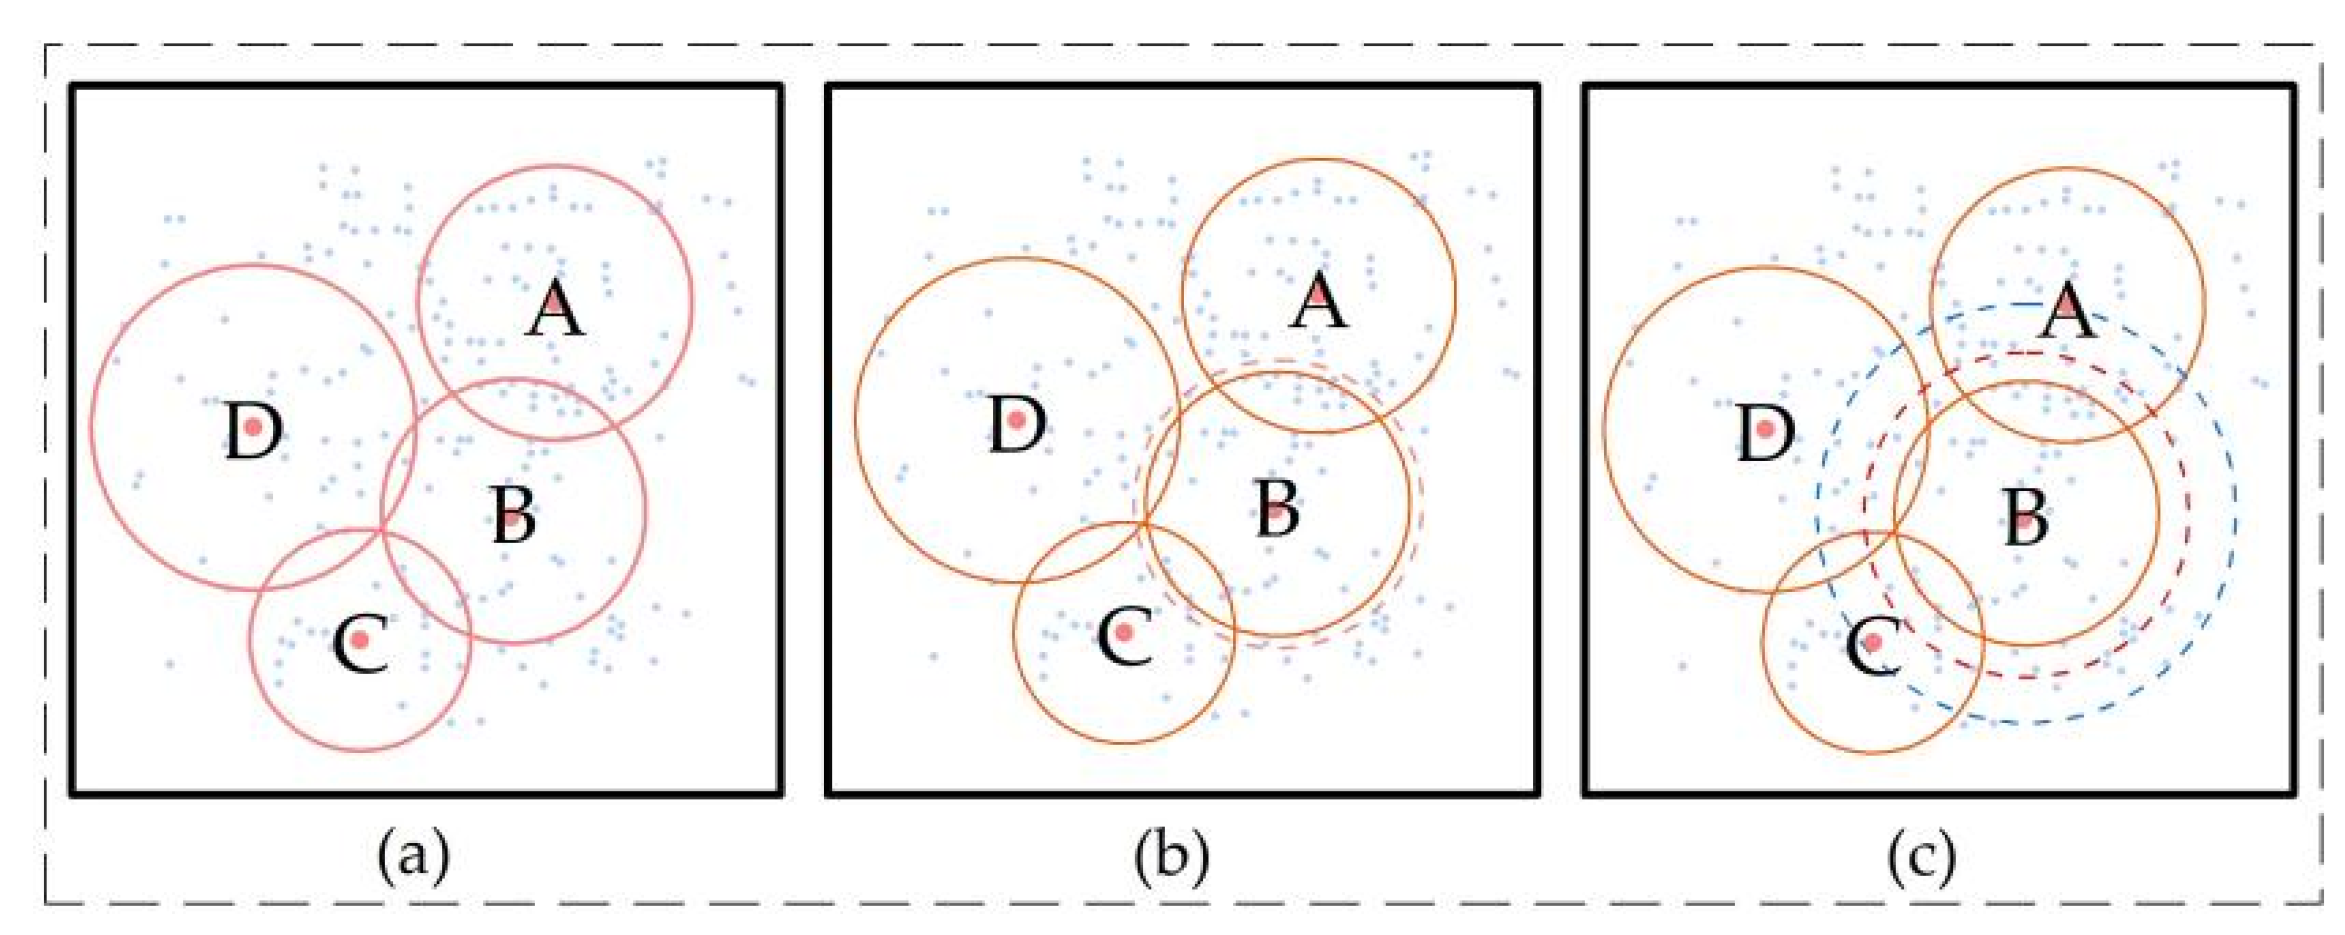
In order to describe the adjusting process of the catchment size of emergency shelters more clearly, the service subset was used. The catchment size of every emergency shelter was adjusted by calculating the crowdedness of the corresponding master and slave shelters in the service subset. For example, four emergency shelters are presented in
Figure 4a. Their corresponding catchment areas are circular areas. According to the definition of the service subset, the service subset of shelter
A includes two shelters:
A and
B, denoted as
SetA = {
A,
B}, because the catchment areas of shelters
A and
B intersect. Shelter
A is the master shelter of the subset. Shelter
A’s slave shelter can be observed as a set too, which is denoted as
Setslave_A = {
B}. Similarly, the service subset of shelter
B can be recorded as
SetB = {
A,
B,
C,
D}. Shelter
B is the master shelter in this subset, and he shelters
A,
C, and
D are the slave shelters in this subset. The slave shelters of shelter B are recorded as
Setslave_B = {
A, C,
D}. The service subset and slave shelters of shelter
C can be recorded as
SetB = {
B,
C,
D} and
Setslave_B = {
B,
D}; the symbols of
SetD = {
B,
C,
D} and
Setslave_D = {
B,
C} are the service subset and slave shelters of emergency shelter
D.
When calculating the crowdedness of shelters for the first time in stage 1, the threshold travel distance of emergency shelters was valued according to their designed radius. There are two kinds of design radii, as mentioned above. After obtaining the crowdedness of every shelter by Equation (1), both the master shelter’s crowdedness and the average crowdedness values of slave shelters in the service subset were obtained. Through comparing the relationship between the master emergency shelter’s crowdedness and the crowdedness of the slave shelters in the service subset, we could adjust the threshold travel distance of the master shelter. The adjustment rules for the threshold travel distance are listed as follows:
- (1)
The max threshold travel distance is less than 1500 m.
- (2)
For shelter i, its service subset is Seti. By comparing the crowdedness of emergency shelter i and the average crowdedness of the slave shelters in Seti, we can calculate the new threshold travel distance of shelter i using Equation (3):
where
di is the new threshold travel distance of shelter
i,
di0 is the old threshold travel distance of shelter
i,
n is the number of shelters in the service subset of the shelter
i,
Setslave_i is the set of slave shelters of
i,
Ci is the crowdedness of the emergency shelter
i, and
Cj is the congestion degree of the shelter
j in the service subset of the shelter
i. The units of
di0 and
di are meters.
As shown in Equation (3), there are several conditions that need to be considered (
Figure 4). For instance, there are four emergency shelters presented in
Figure 4a. The radius of emergency shelter
D is 1500 m, so the catchment area of emergency shelter
D does not need to be altered. As for emergency shelter
B, its service subset has four elements:
A,
B,
C, and
D. The average crowdedness of B’s slave shelters is
CB_avg. Following the rules presented in Equation (3), if
CB is ten percent less than
CB_avg and
dB0 is less than 1500 m, then its radius needs to be adjusted. Two conditions must be considered. If the adjusted radius
dB is less than 1500 m, then
dB would be the new radius of the catchment area. As it is shown in
Figure 4b, the red, dotted circle is the next catchment of emergency shelter
B. If the adjusted radius
dB is equal to or larger than 1500 m, than the value of
dB would be 1500 m. It is shown in
Figure 4c that the blue, dotted circle is calculated using Equation (3), but its radius is larger than 1500 m, which means its final radius will be the red, dotted circle, of which the radius is 1500 m.
By using this method, there would be no need to alter the catchment area of the emergency shelter until every emergency shelter has a crowdedness similar to the emergency shelters around it, or its threshold travel distance is 1500 m. Additionally, at the end of stage 1, every emergency shelter’s final catchment area will be determined.
3.3. Calculating Spatial Accessibility
Accessibility originates from the classical location theory [
6], which has different understandings in different application scenarios. For accessibility scenarios, such as healthcare, retirement, and green spaces, the research angle is mostly biased towards the traffic and distance levels. The subjective dimension is also considered and reflected upon in the study of the influence of distance on accessibility [
34]. This paper defined the accessibility of an emergency shelter as the ease with which people evacuating from a disaster-affected area can reach the shelter on foot from their location and have their evacuation needs met. This definition encompasses three characteristics: firstly, the demand for evacuation services is a short time surge; secondly, the mode of transport is on foot, which determines the limited distances that can be occupied by evacuation sites; and thirdly, the high volume of demands creates a competitive and crowding-out effect on the demand for high-quality evacuation services and competition between evacuation sites. These factors result in the study of the accessibility of places of refuge that have both common and unique characteristics in relation to the accessibility of other public services.
The spatial accessibility of emergency shelters is calculated using the FC2SFCA method, which is an improved version of the 2SFCA method. Its distance decay function is a Gaussian function. The fixed-coverage-based catchment area is used in this method. The supply-to-demand ratio for each emergency shelter is calculated in Equation (4); the spatial accessibility of each shelter is calculated in Equation (5):
- (1)
For each emergency shelter j, all census tracts i within the threshold of the travel distance dj of the emergency shelter are searched. Then, the supply-to-demand ratio Rj can be calculated according to Equation (4). The demand number of used emergency shelters j is weighted by the Gaussian function.
- (2)
For each census tract i, all emergency shelters that can provide a service to the census tract i are searched, and all supply–demand ratios Rj used to obtain the spatial accessibility Aj are summarized as:
where
Aj is the spatial accessibility of census tract
i,
Rj is the supply-to-demand ratio of the emergency shelter
j,
Ti is the emergency shelter’s subset that provides a service to the census tract
i,
Sj is the capacity of the emergency shelter
j,
Dk is the demand number of the census tract
k,
dij is the distance between the emergency shelter j and the census tract
i,
dj is the final threshold travel distance, and
is the Gaussian function. The unit of
Sj and
Dk is people.
4. Results and Analysis
To compare the proposed A-2SFCA with FC2SFCA methods, the spatial accessibility of an emergency shelter calculated by using the FC2SFCA method was measured and analyzed.
4.1. The Process of Understanding the Suitable Catchment Areas of Shelters
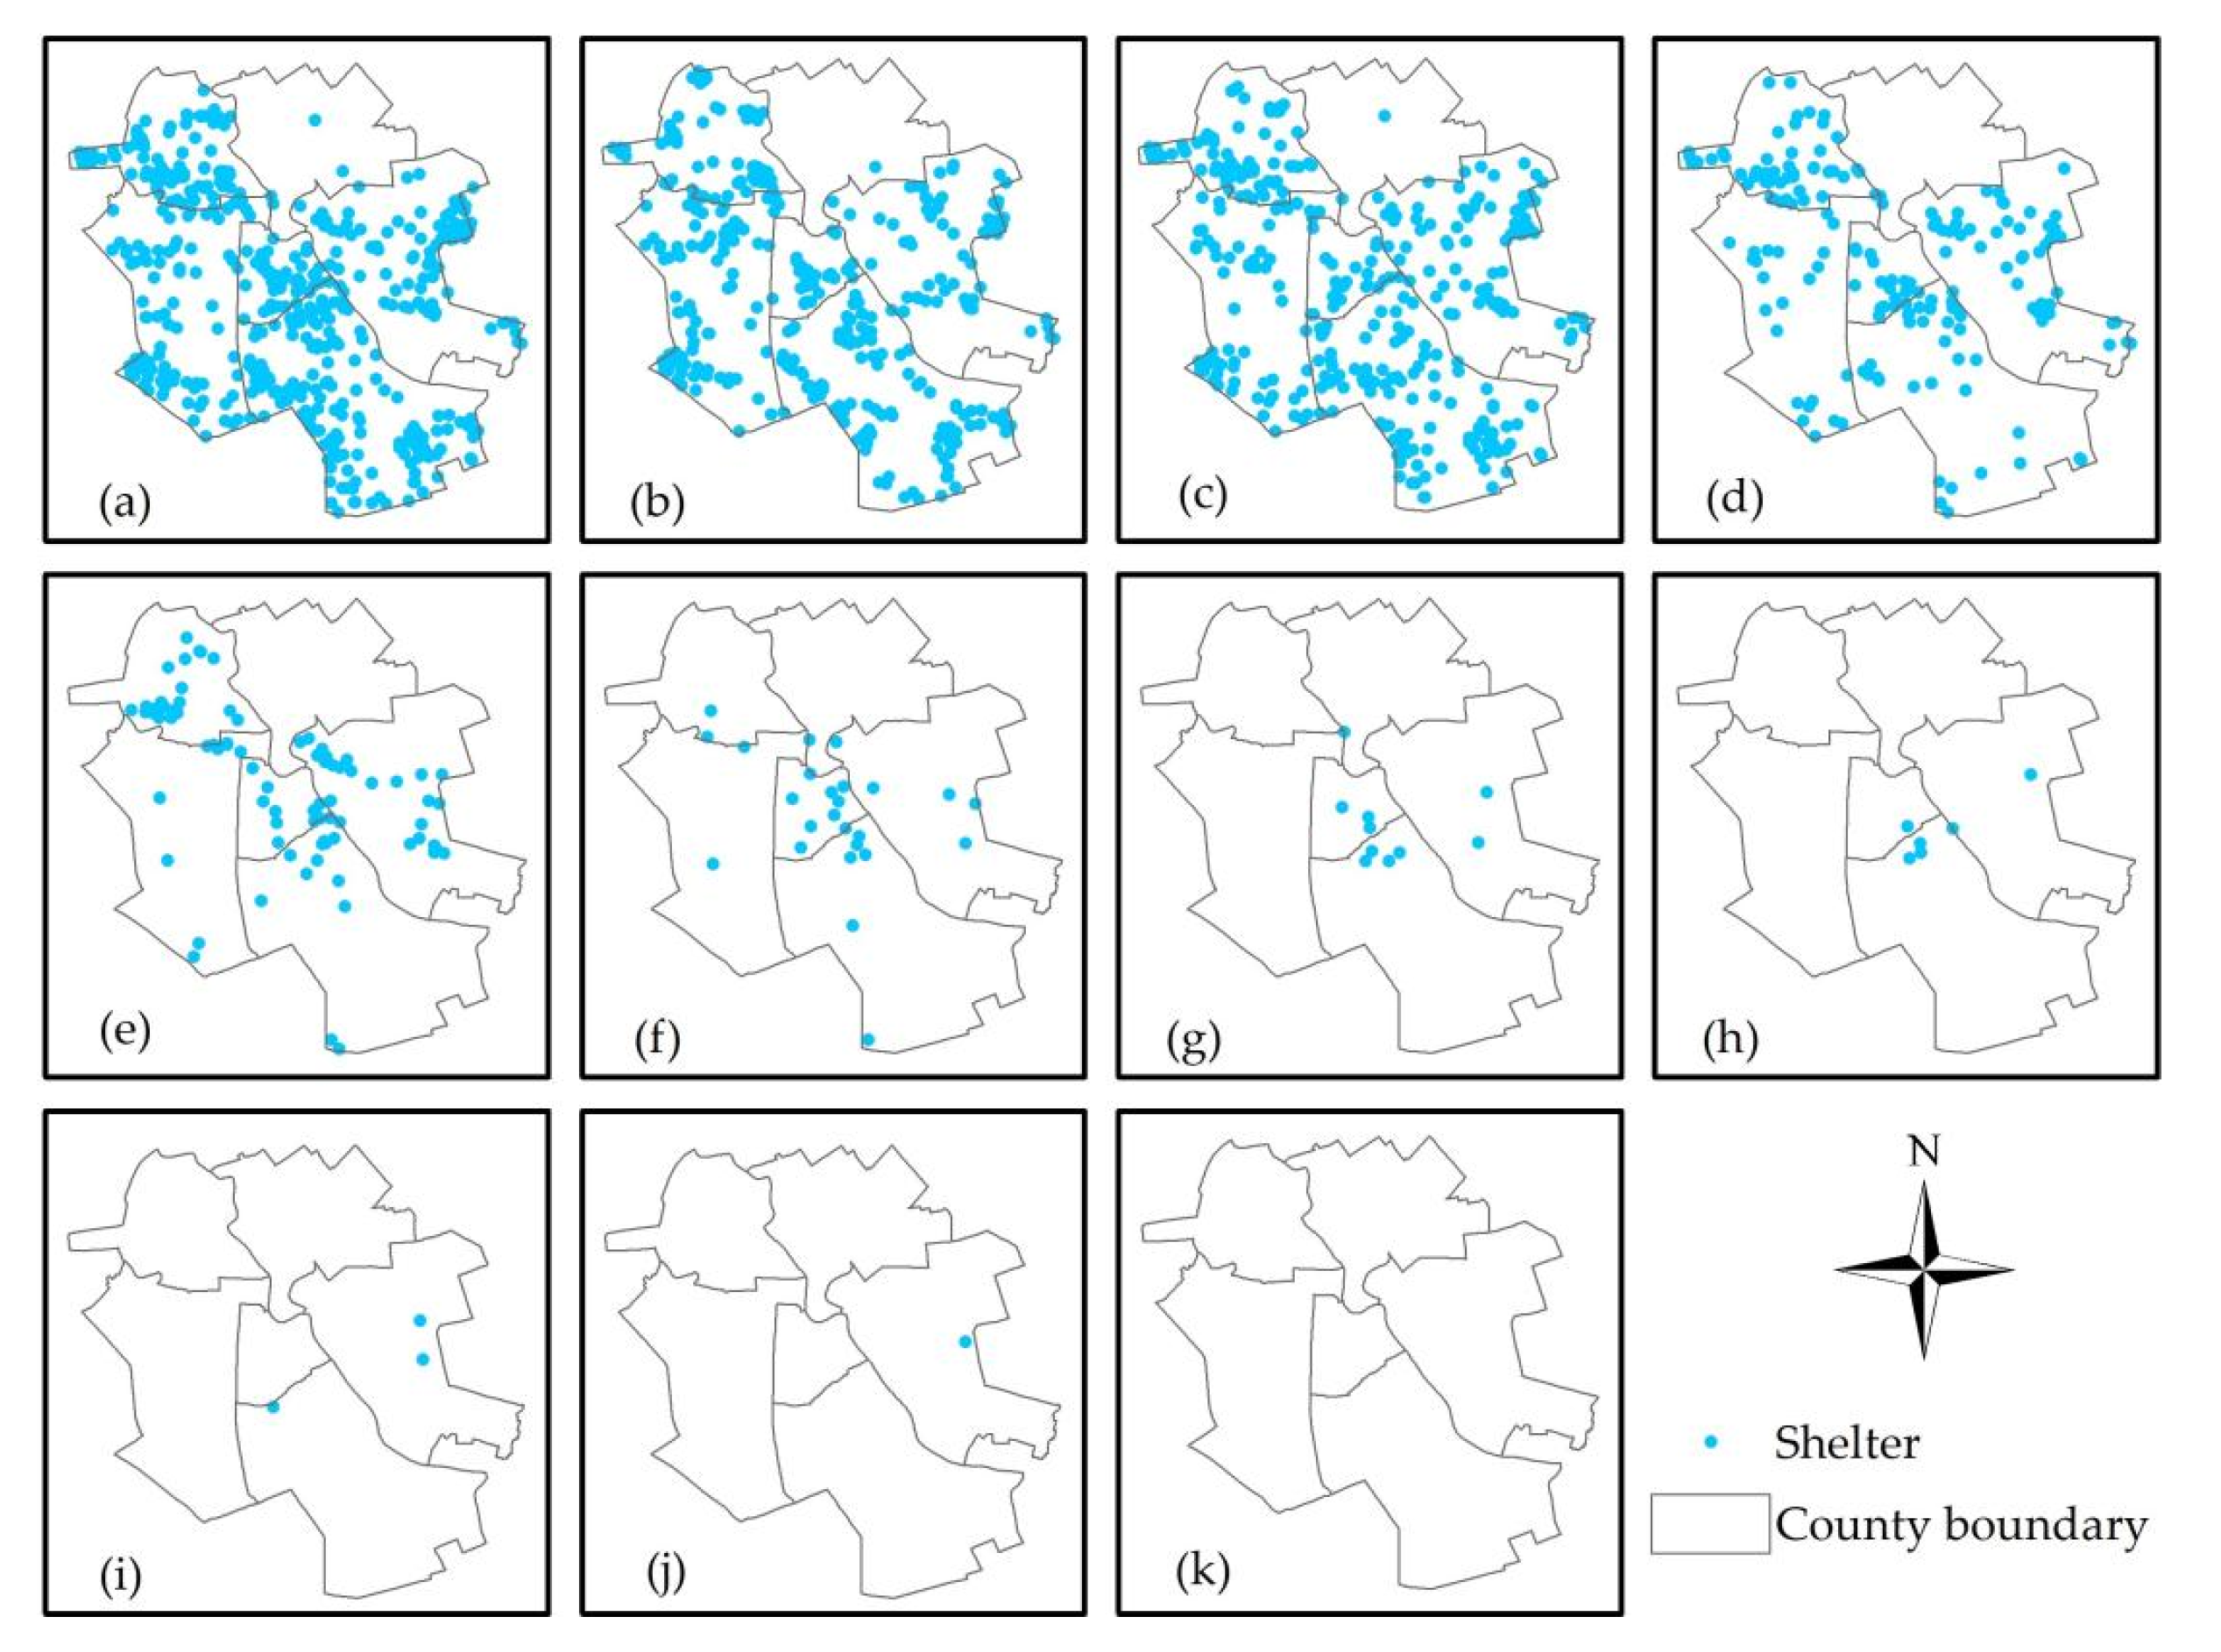
The calculation performed in stage 1 of the A-2SFCA method was used to adjust the catchment area based on the crowdedness of the emergency shelters. There were 11 times calculating the crowdedness and 10 times altering the radii of the catchment areas in emergency shelters in stage 1 to obtain the final radius of the Tianjin emergency shelter by using Equations (1)–(3). The process is presented in
Figure 5.
Figure 5 shows the emergency shelters whose threshold travel distances need to be adjusted each time. It can be observed from
Figure 5a–k that the number of emergency shelters gradually decreases. The reduction in the number of shelters is more obvious in
Figure 5e. This means that most of the catchment-size adjustments of shelters are conducted during the first five attempts. Subsequently, the adjustment of the shelters becomes a fine-tuning of a few shelters.
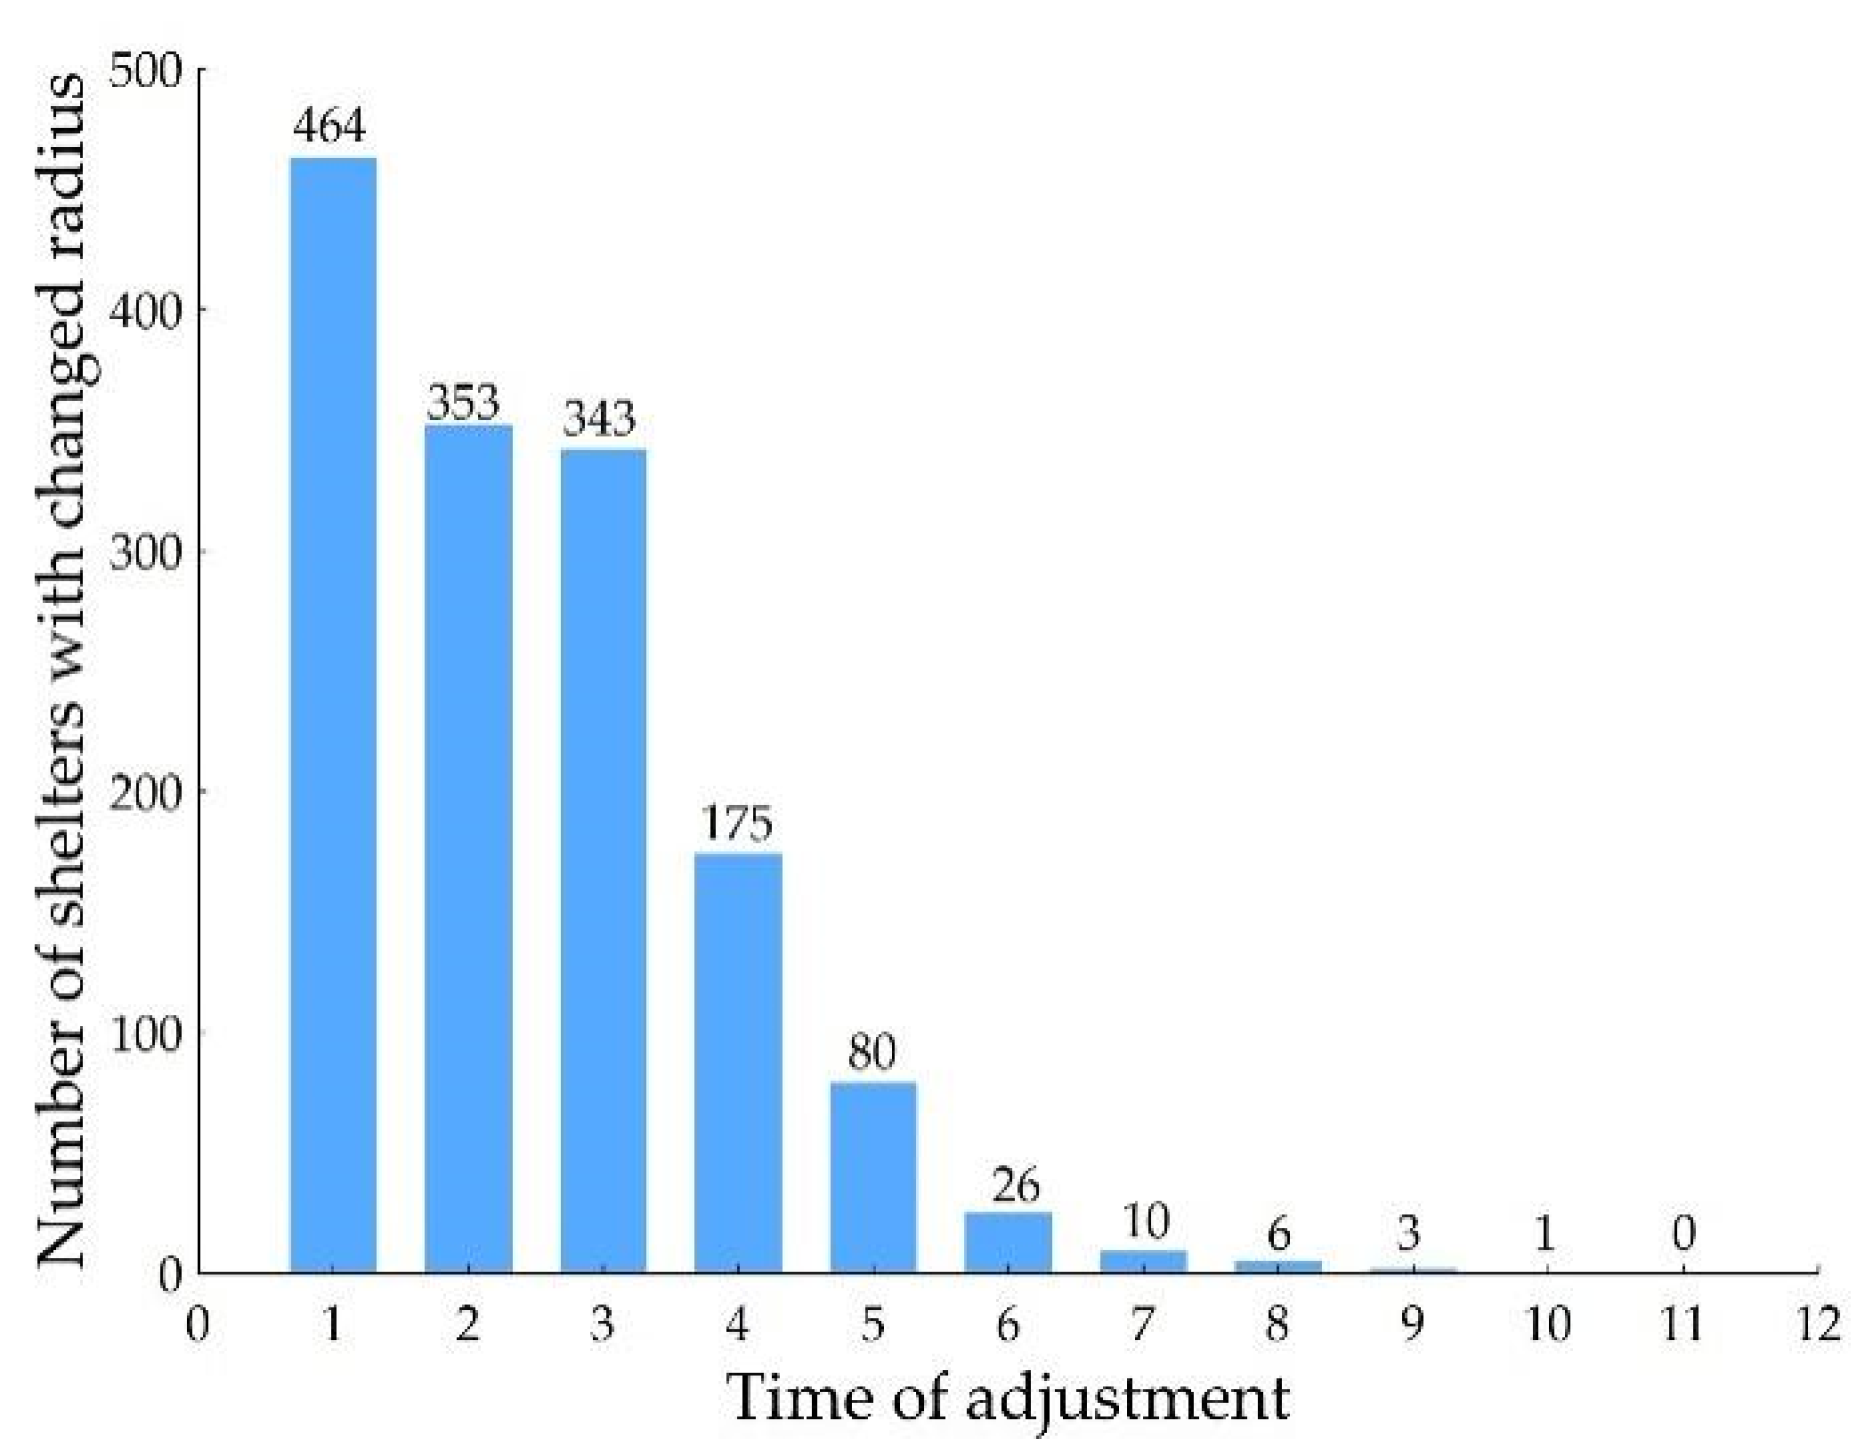
Figure 6 illustrates the quantitative 10-times change of the shelter catchment area’s adjustment. The number of shelters is the highest during the first adjustment. Approximately two-thirds of the shelters’ catchment areas were adjusted. The number of shelters that needed to be adjusted was reduced to about half during the second and third times. The number of those shelters rapidly declined from the fourth time to the end. Starting from the seventh round, the number of adjustments of the catchment areas of the shelters was fewer than 10. The zero at the eleventh time calculation shows that there is no emergency shelter’s catchment size that needs to be adjusted, which also represents the end of stage 1 of the A-2SFCA method.
4.2. Spatial Accessibility Analysis of Emergency Shelters
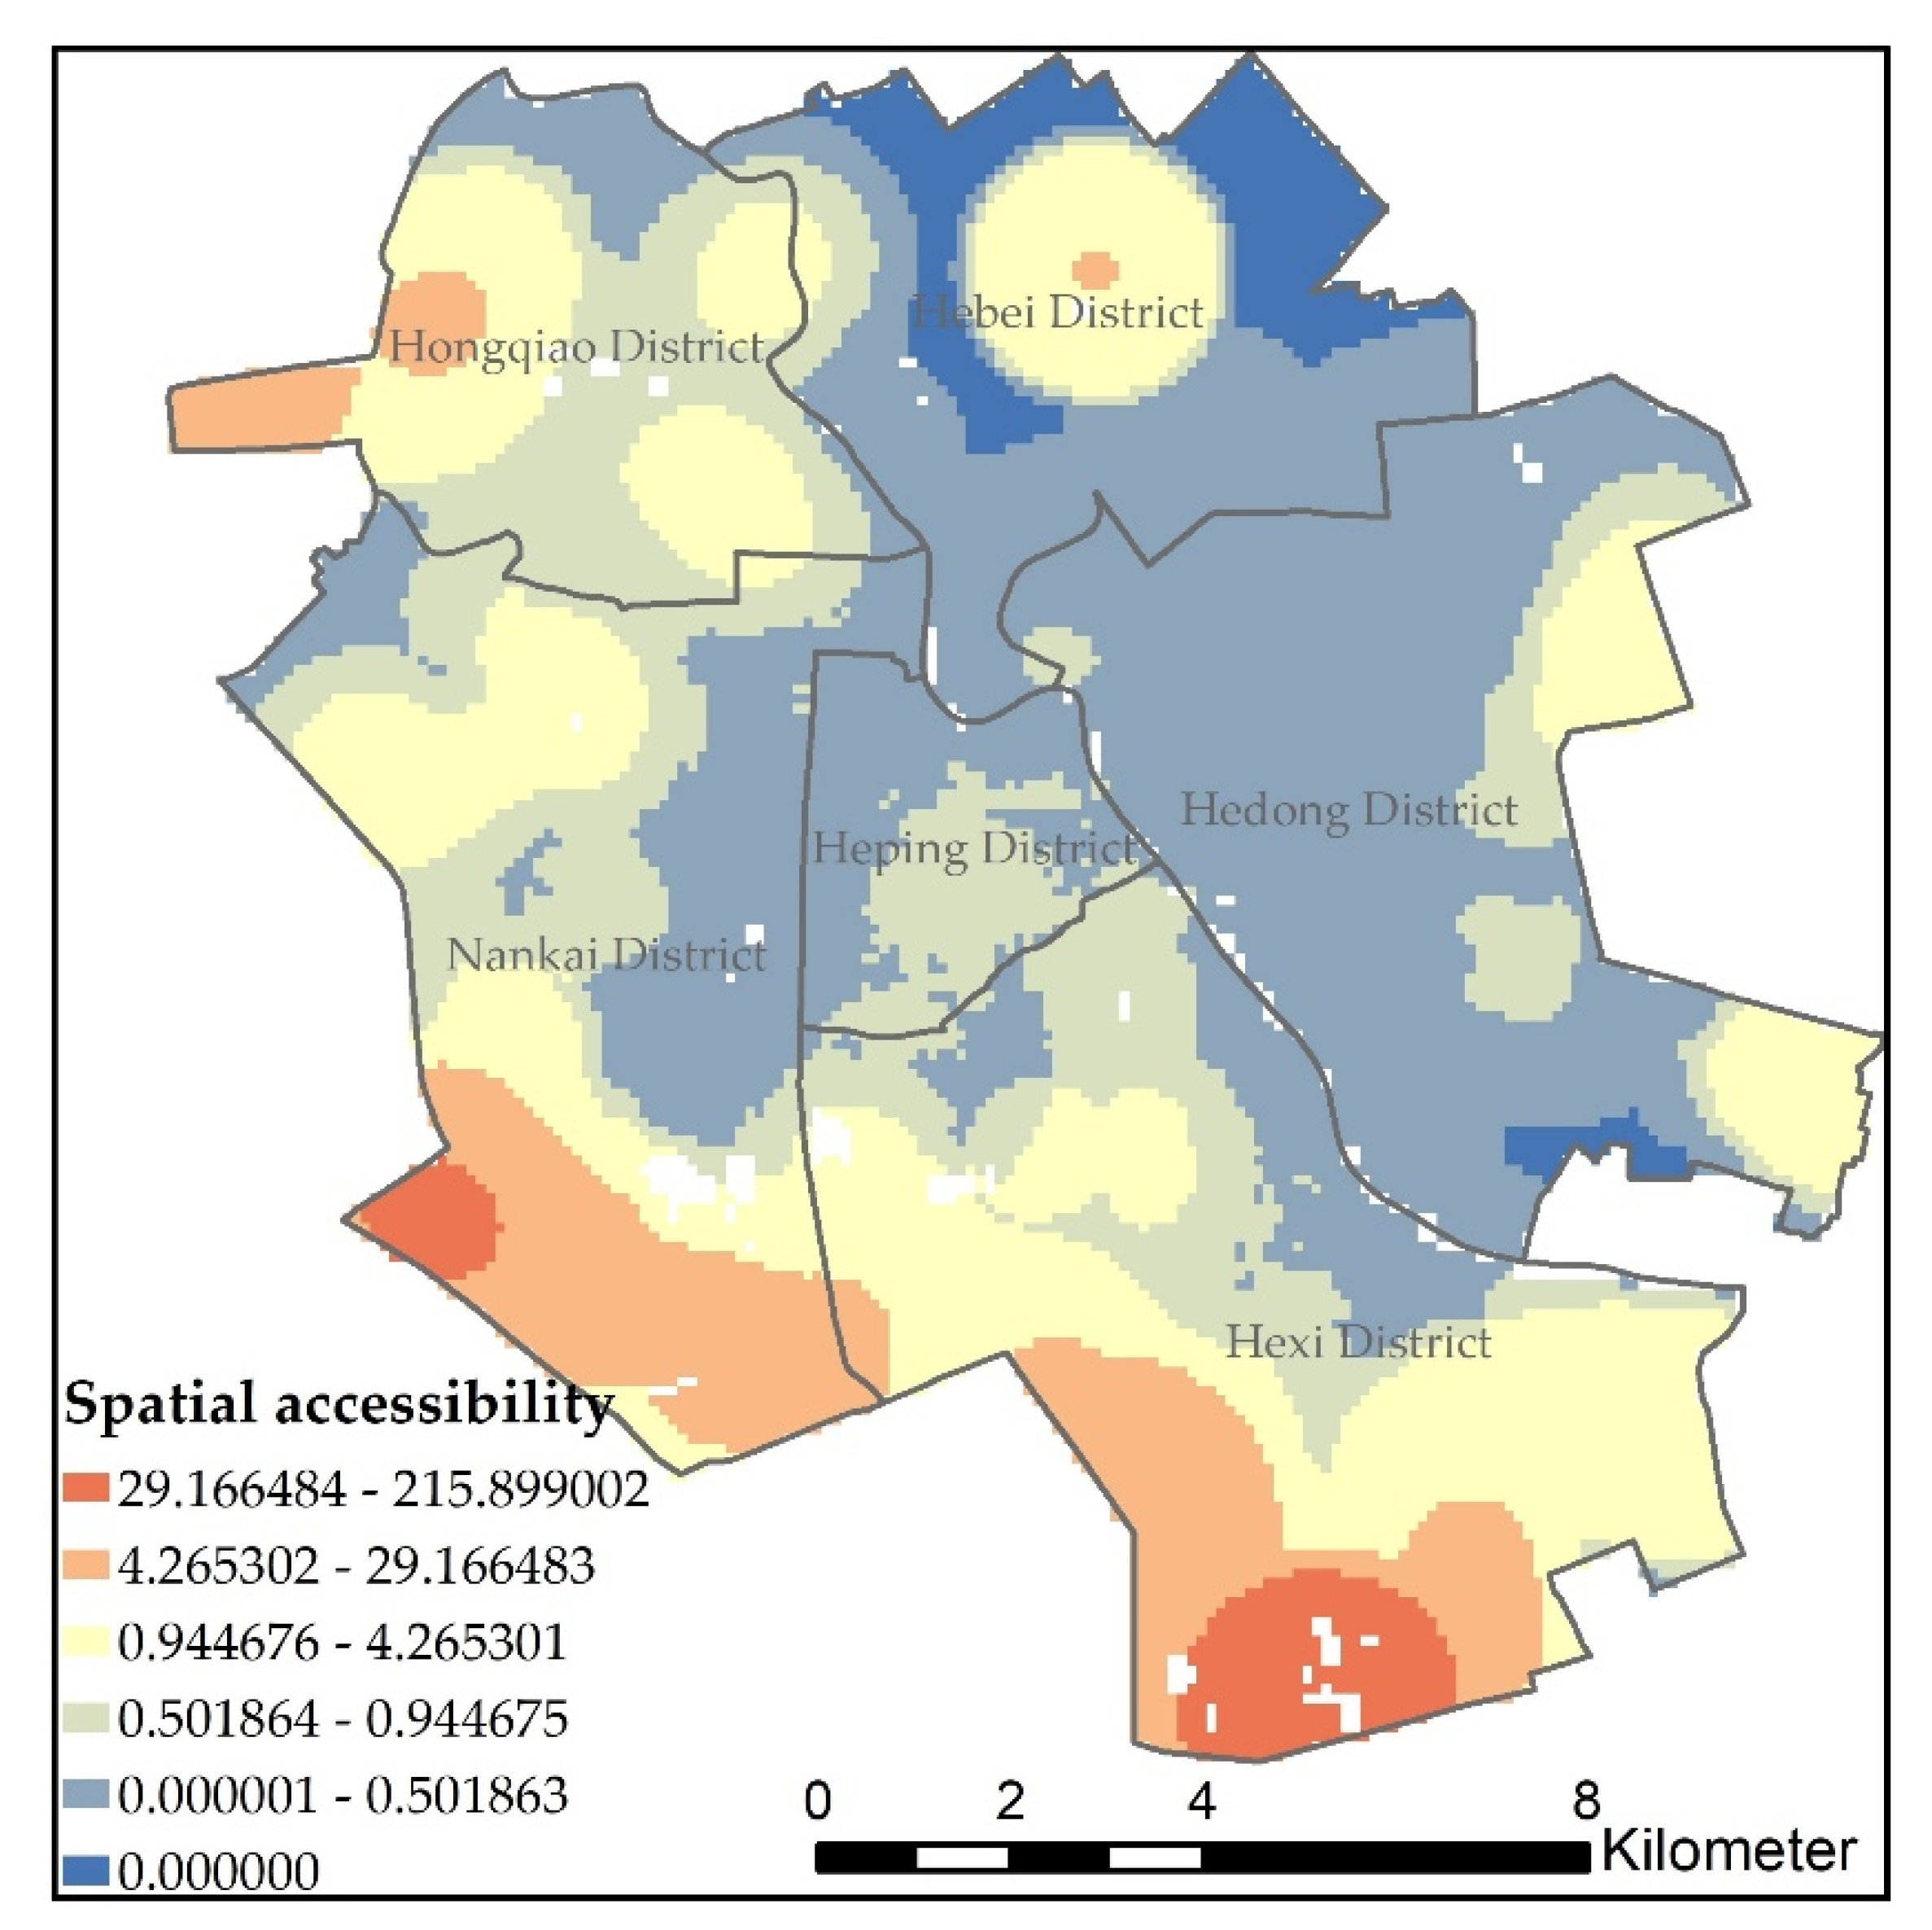
Figure 7 shows the spatial accessibility of emergency shelters in the Tianjin urban area using the A-2SFCA method. In general, the spatial accessibility to the west and south of the Tianjin urban area is better. Most of Hebei District has the lowest spatial accessibility value because it only has two emergency shelters, and this part is represented in blue. The central and eastern districts are relatively lower, which is due to the low per capita area of refuge in these two areas (as shown in
Table 1). The shelter area per capita in Hedong District is 0.515 m
2/person, while that in Nankai District is 0.777 m
2/person. Despite the high per capita area of shelters in Heping District, accessibility is also reduced in the neighboring areas of Hebei, Hedong, and Nankai. Among the six districts in the city, Hexi, Hongqiao, and most of Nankai have the best spatial accessibility values.
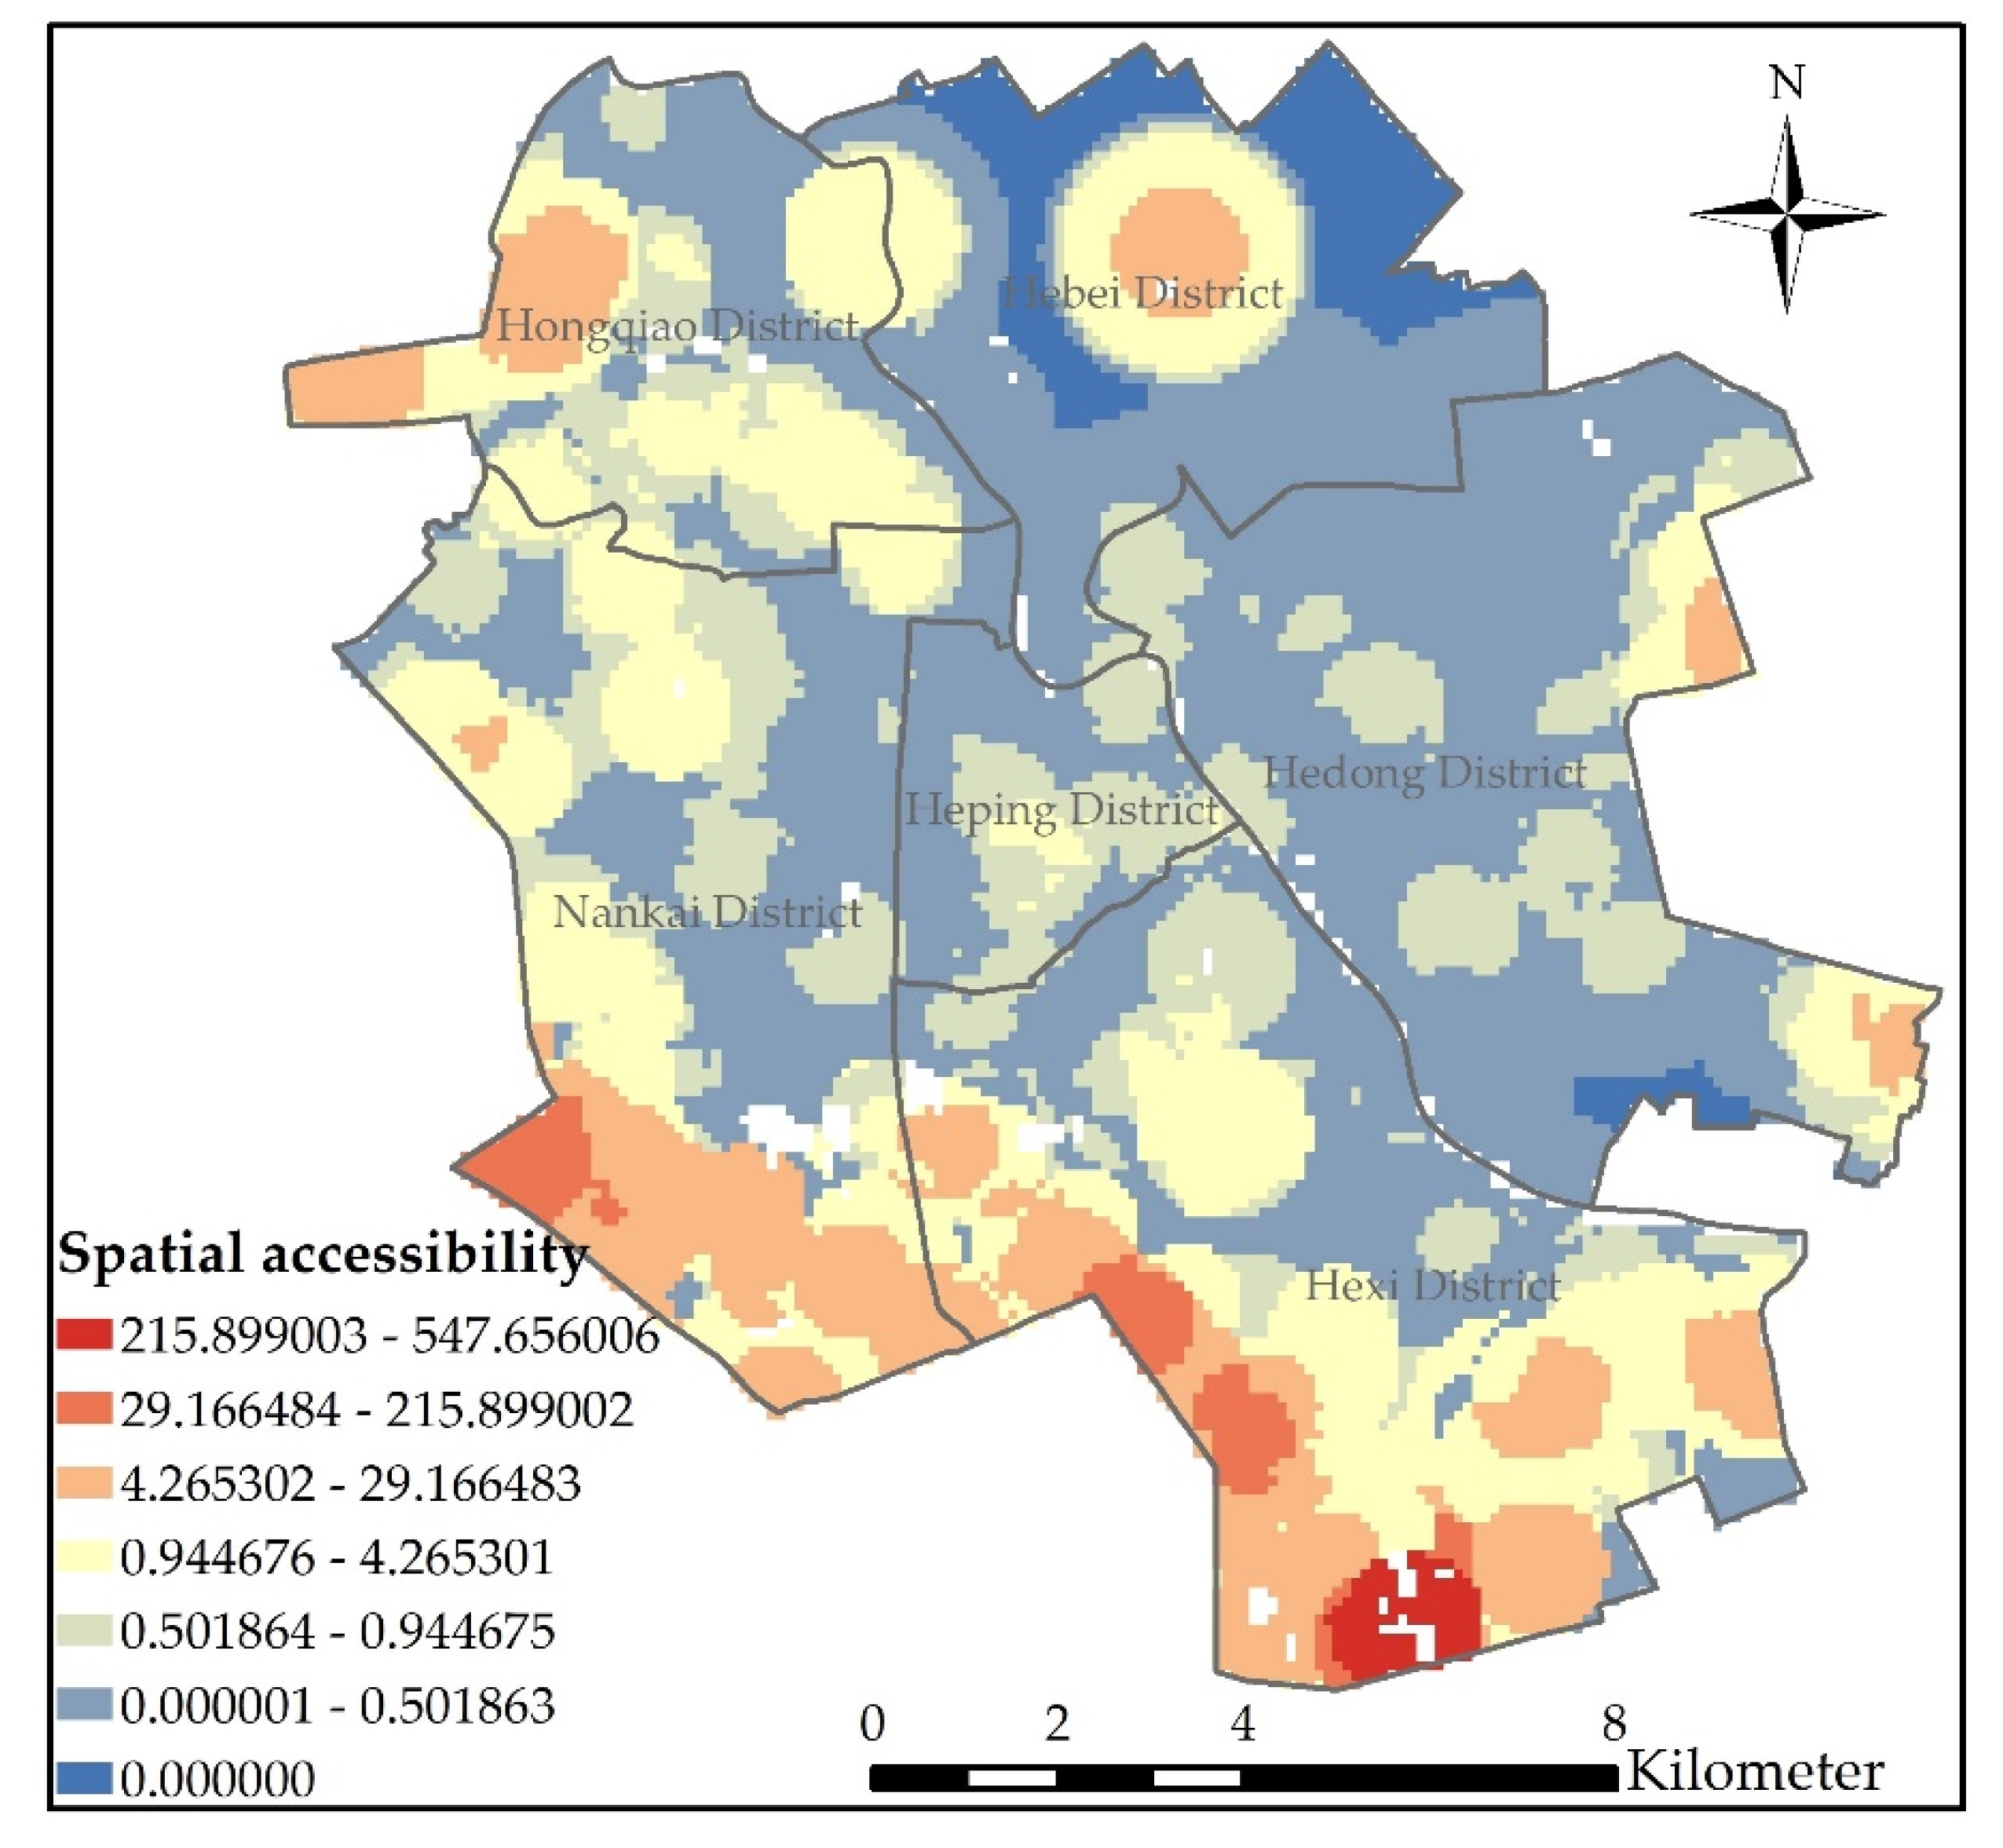
In order to analyze the effect of the method used in this paper, we used another method to measure the accessibility of emergency shelters in the Tianjin urban area, which was the FC2SFCA method. Additionally, the result of the FC2SFCA method is presented in
Figure 8. The difference between these two methods is the threshold travel distance of the emergency shelters. In the A-2SFCA method, the distance was calculated by a 10-times adjustment. However, the threshold travel distance used in the FC2SFCA method was the designed distance. From the calculation results of these two methods, it can be observed that the spatial accessibility caused by different service radii is different.
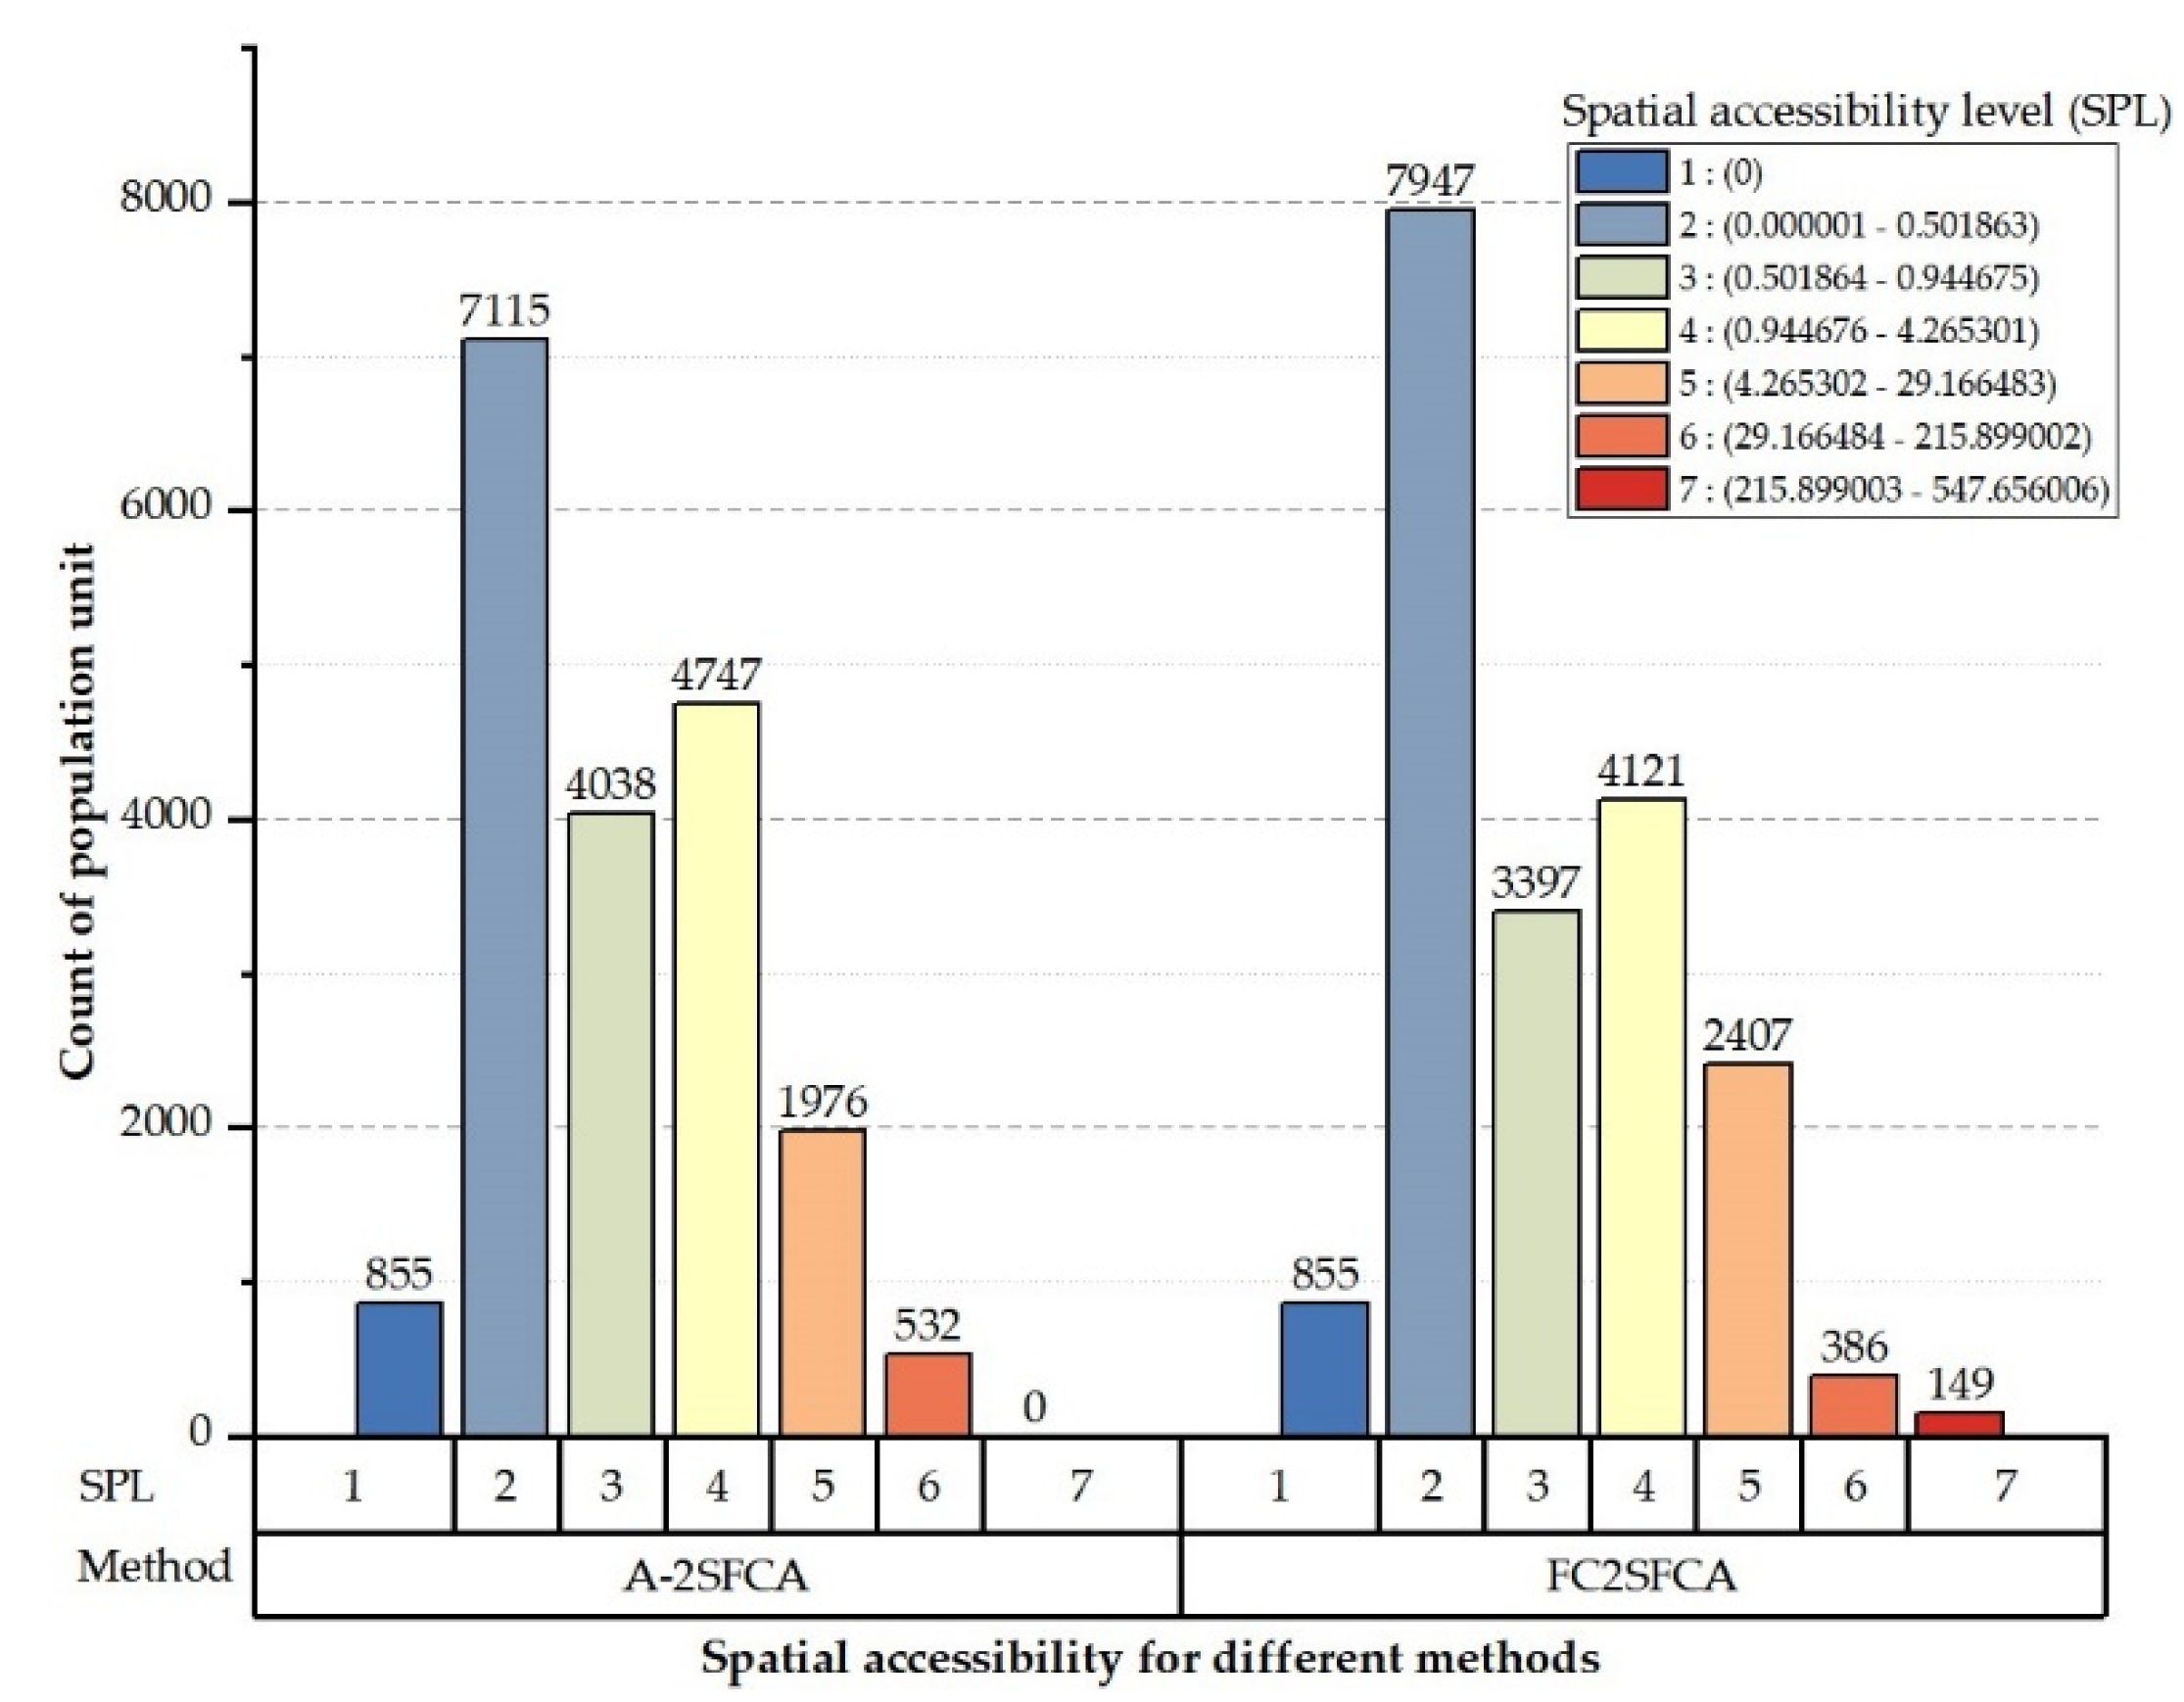
4.3. Comparison of A-2SFCA and FC2SFCA Methods
The spatial accessibility distribution trends of shelters in the Tianjin urban area calculated by the two methods were consistent. It can be observed that the area with high accessibility calculated by the A-2SFCA method (
Figure 7) is significantly greater than the area presented in
Figure 8. This indicates that more people in the calculation of the A-2SFCA method have an increased chance of using emergency shelters. The maximum value of spatial accessibility presented in
Figure 8 is higher than that in
Figure 7. It can be observed in
Figure 9 that the results obtained using the A-2SFCA method present fewer extreme and minimal values.
4.4. Comparison of the Variation during the Calculation of Using the A-2SFCA Method
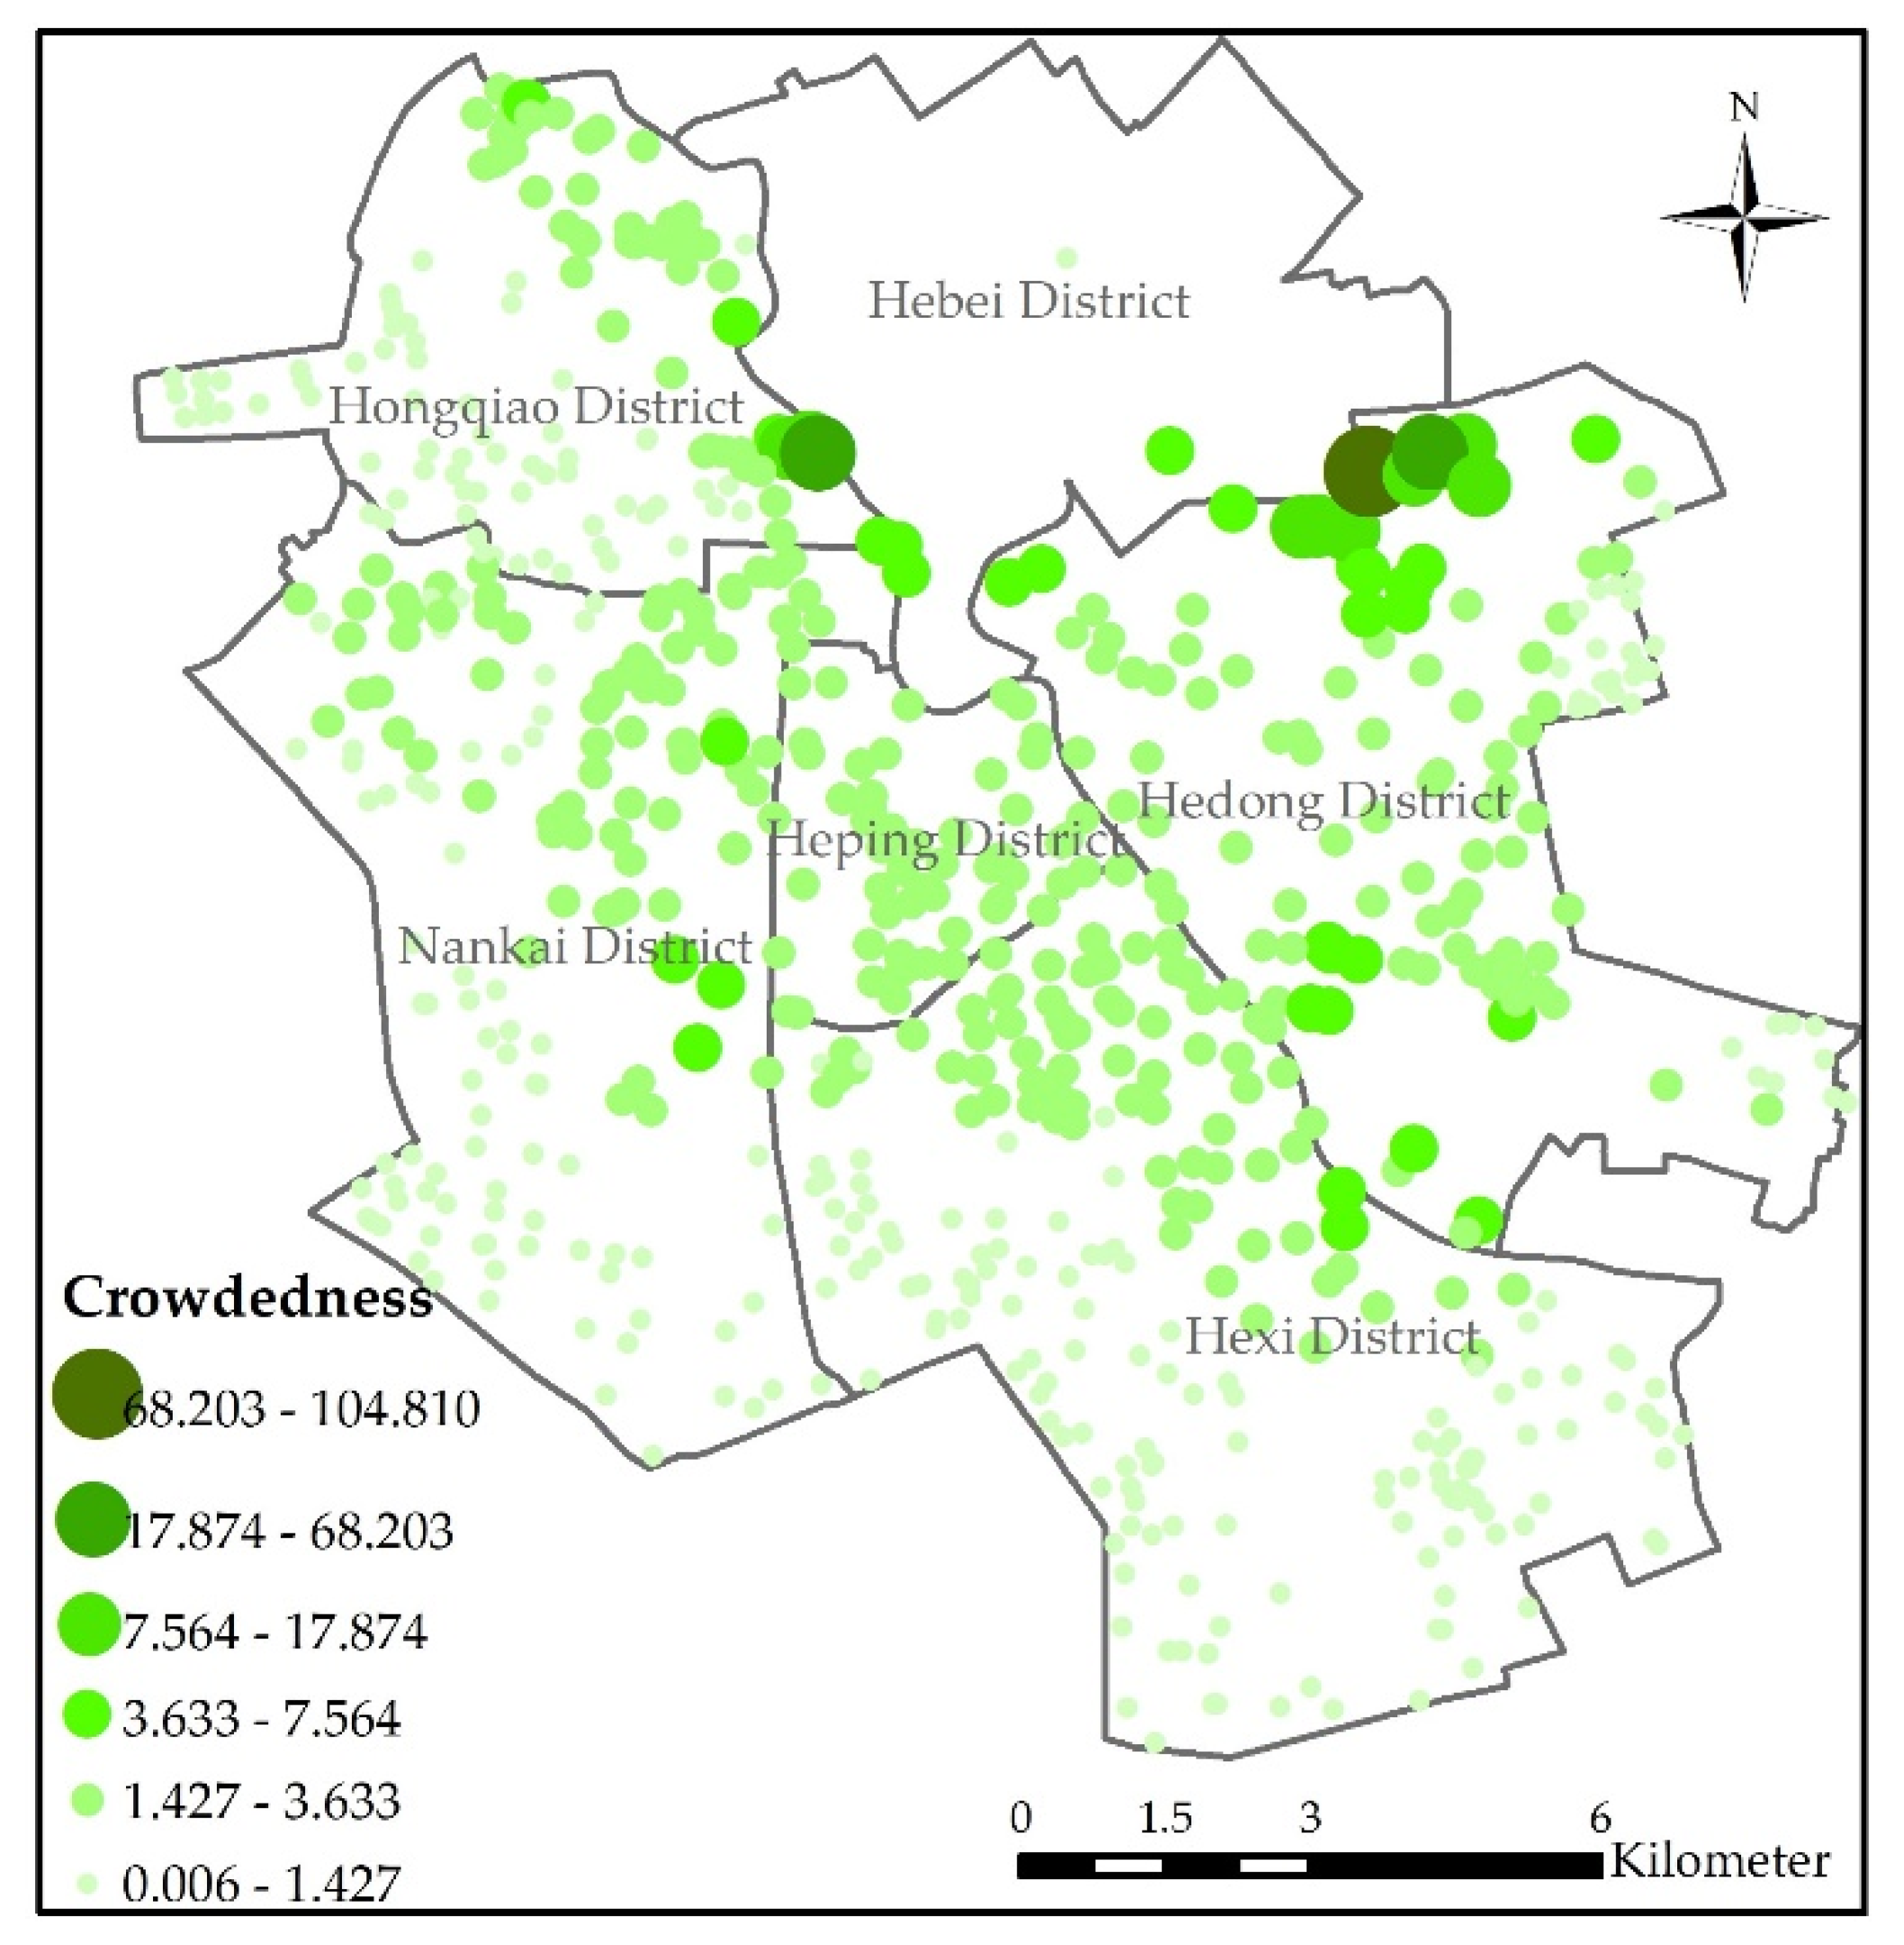
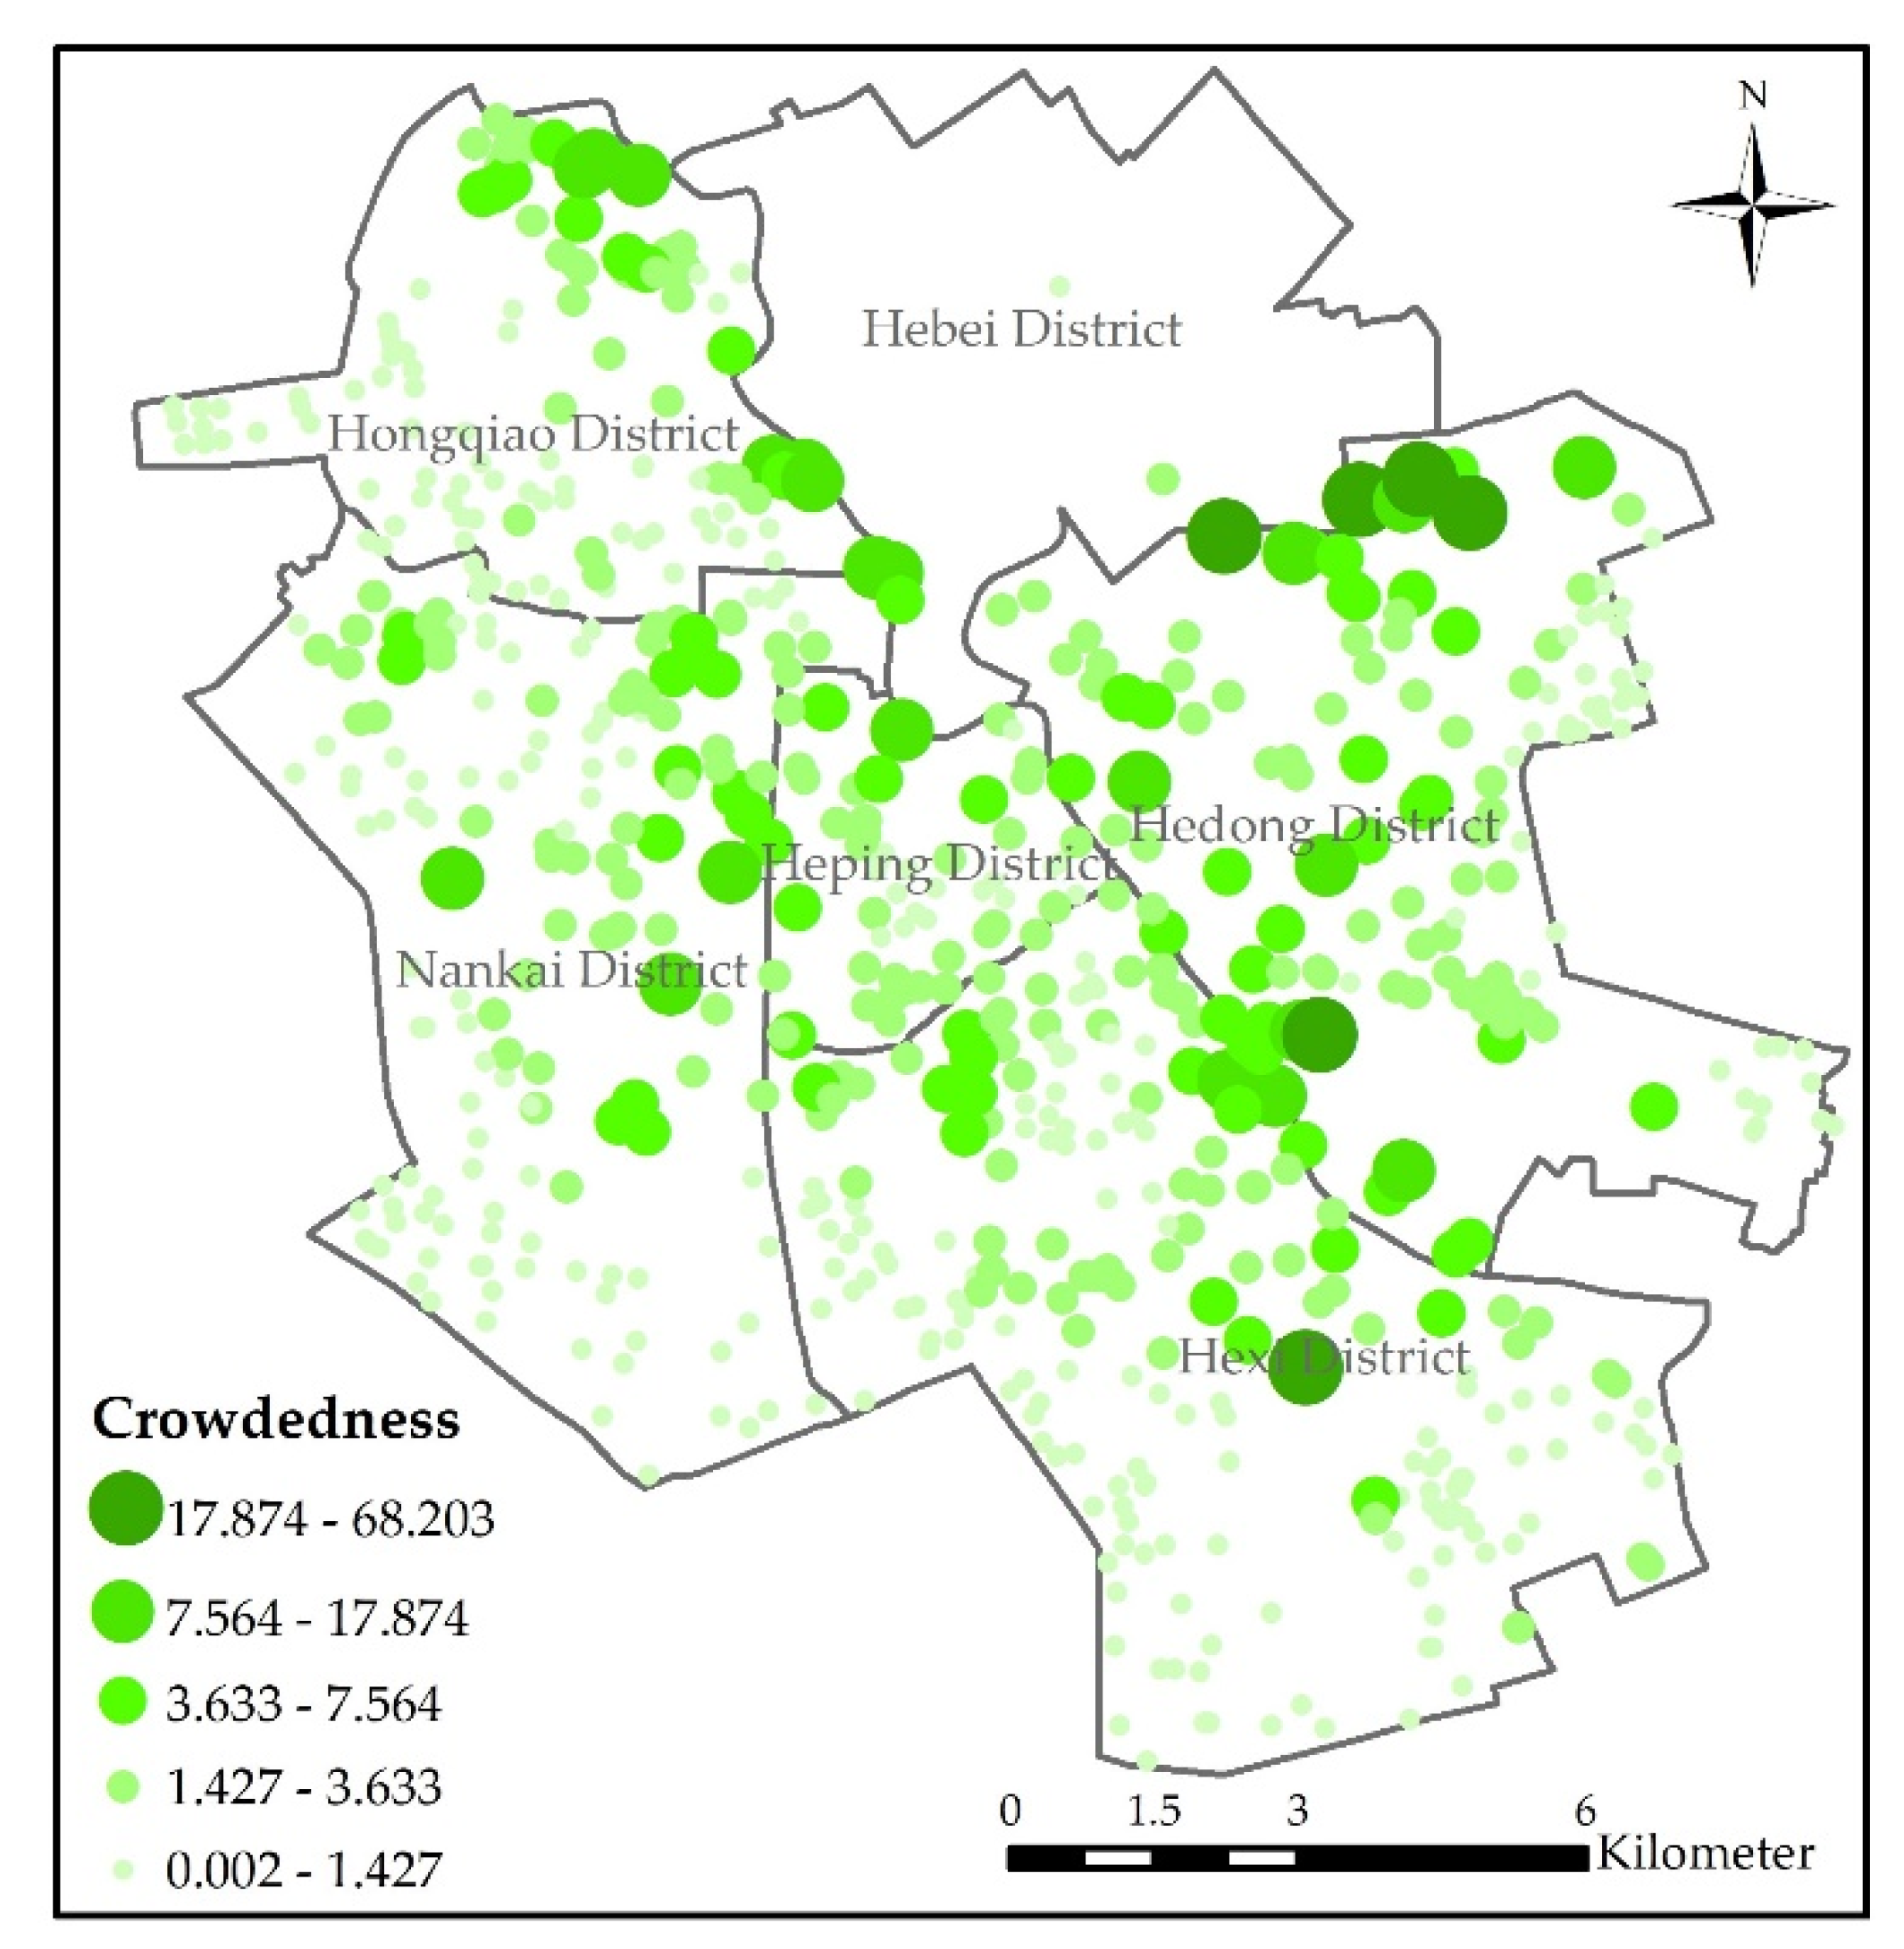
The crowdedness was the key indicator used in the first stage. This indicator combined population distribution, shelter capacity, and shelter distribution. This indicator was used to adjust the service radius of each shelter.
Figure 10 shows the final crowdedness of using the A-2SFCA method. The crowdedness of emergency shelters is calculated by using the initially designed threshold travel distance as the designed catchment size (
Figure 11). The crowdedness from the two methods is generally similar in spatial distribution. However, the number of shelters with a crowding degree greater than 7.564 is much less in
Figure 10 than in
Figure 11. The crowdedness of emergency shelters with similar geographical locations is also relatively similar in
Figure 10, but this phenomenon does not exist in
Figure 11. The results in
Figure 10 are more reasonable, because people tend to choose a less crowded shelter more. In most areas, the crowdedness of emergency shelters in
Figure 10 is lower than in
Figure 11. However, the crowdedness of the emergency shelters in
Figure 10 is higher than in
Figure 11 in the area where Hebei District connects with Hedong district and Nankai district.
It can be seen that the overall service capacity of emergency shelters in most areas of Tianjin urban area is relatively good. However, the Hebei district needs to strengthen the construction of emergency shelters.
5. Discussion
This paper firstly introduced the concept of service subset, which provides a novel perspective for analyzing the service capacity of public service providers in a local area. The concept of a service subset reflects the relationship among service providers in a local area, including the mutually supportive or competitive relationship between their internal service provision. Secondly, the elements in the service subset are distinguished for ease of computation. There is a master and slave relationship among the elements within the subset. They are called master and slave service elements, respectively. This master and slave relationship is used to adjust the size of the service area radius of the master shelter in conjunction with the population distribution data. In this paper, slave service elements were places of shelter where there was a spatial overlap with the service area of the master service element. However, in other fields, this concept of a service subset can also be introduced, and the membership and master–slave relationship of the service subset concept is adaptable to the actual application scenario. For example, in the study of this example, the members of the service subset can also be adapted to such a set, where the slave elements of this set intersect with an area that is centered on the main refuge and extends outwards in a radius of 1500 m or a different distance value. This situation arises where even though the service areas of two shelters do not intersect, they nevertheless have a mutually supportive relationship. It may be more realistic to define the scope of the service subset in this way.
On the other hand, a fixed catchment area was introduced into the calculation of the crowdedness of shelters. The service radius of a shelter was influenced by several factors, which resulted in a service radius that was not uniform. If the traditional i2SFCA method is followed, it is incorrect to use the same radius in the two-step calculation to search for the calculation.
Finally, the crowdedness, as an adjustment parameter for the service radius of the shelter, can reflect a combination of aspects, including the capacity of the shelter, its spatial distribution, and the distribution of population density. The crowdedness of elements within a service subset can reflect the support or competition of nearby places of refuge. Such an abstract parameter, which can reflect the complex relationships among features in a higher dimension, is perhaps more reasonable for analyzing the service radius of the shelter.
Compared to previous methods, the method proposed in this paper was much more computationally intensive, especially when the spatial granularity of the population distribution data was small, and the number of computations significantly increased.
6. Conclusions
The spatial accessibility of emergency shelters was affected by a variety of factors, such as the number and spatial distribution of those demanding and supplying them, and the competition between service suppliers. An extended A-2SFCA method was proposed to calculate spatial accessibility. In this method, the conception of a subset service was defined, which was used to analyze the mutual influence of the geographically close supply and adjust the catchment size of emergency shelters by crowdedness. In addition, when calculating the congestion degree or spatial accessibility, the same catchment areas were used when searching the service supply or demand, which is also called the fixed catchment area. This method can be used to measure the spatial accessibility of other service scenarios, such as healthcare services, green spaces, educational services, and job opportunities.
The emergency shelters in the urban area of Tianjin, China, were used as an example to test the method proposed in this paper. When comparing the proposed A-2SFCA method and the 2SFCA method, we observed that the accessibility distribution of emergency shelters in the Tianjin urban area was uneven. The accessibility in the southern and western regions of the Tianjin urban area was significantly better than that in the northeastern region. This shows that the construction of emergency shelters in the northeastern part of Tianjin City is slower than in other districts. At the same time, due to the higher population density in the downtown area, the crowding degree of emergency shelters is also greater.
A-2SFCA method can use more reasonable catchment areas to access the spatial accessibility values. However, this method still presents limitations. First of all, this method is relatively suitable for a situation where service suppliers are relatively dense. When the service providers are sparse and their catchment areas do not overlap with each other, the algorithm in this paper does not work. In the future, the spatial accessibility method of emergency shelters should be studied further.


