Article

Delineating Urban Community Life Circles for Large Chinese Cities Based on Mobile Phone Data and POI Data—The Case of Wuhan

1
Department of Urban Planning, School of Urban Design, Wuhan University, Wuhan 430072, China
2
Engineering Research Center of Human Settlements and Environment of Hubei Province, Wuhan 430072, China
3
Research Center for Digital City, Wuhan University, Wuhan 430072, China
*
Author to whom correspondence should be addressed.
ISPRS Int. J. Geo-Inf. 2022, 11(11), 548; https://doi.org/10.3390/ijgi11110548
Submission received: 15 August 2022 / Revised: 26 October 2022 / Accepted: 28 October 2022 / Published: 1 November 2022

Abstract

:
In the recent decade, a new concept, urban community life circle (CLC), has been introduced and widely applied to Chinese community planning and public service facilities configuration alongside people-oriented urbanization. How to delineate the CLC has become a core task of urban CLC planning. The traditional way to determine the CLC using administrative boundaries does not fully consider the needs of residents. Recent research on urban CLC delineation is usually based on residential behavior survey using sample surveys or GPS data. However, it is difficult to generalize the sample surveys or GPS surveys for one specific community to that for others, because of the extremely high cost. Due to the ubiquity of the location-based service (LBS) data, i.e., the mobile phone data and points of interest (POI) data, they can serve as a fine-grained and continuous proxy for conducting human daily activity research with easy accessibility and low cost. Mobile phone data can represent the daily travel activities of residents, and POI data can comprehensively describe the physical conditions. In this paper, we propose a method from both the social and physical perspectives to delineate the CLC based on mobile phone and POI data, named DMP for short. The proposed DMP method is applied to Wuhan. We decipher the CLC’s boundary and residents’ travel activity patterns and demonstrate that (1) the CLC is not a regular circle but a non-homogeneous corridor space extending along streets; and (2) adjacent CLCs are found to share some daily facilities. Based on these findings, we propose that CLC planning should be data-based and people-oriented in general. In addition, sufficient space in the overlapping region of the CLCs should be preserved for future planning of public service facilities configuration, given that adjacent CLCs share some daily facilities.

1. Introduction

Community-related research has been a popular issue in urban research [1,2,3]. Along with the rapid social and economic development of China, the perspective of community planning has gradually shifted from “place-oriented” to “people-oriented”, which requires more attention to residents’ daily behavioral activities in the community. Recently, due to the people-oriented urbanization of China, urban community life circle (CLC) has become a popular topic in not only planning but also urban studies [4]. As a key transformation direction of urban planning in China, the goal of CLC planning is to realize the equal and precise allocation of public service facilities to satisfy the increasing and diverse needs of residents [5].
The theory of “life circle composition” was first proposed in the planning of Japan’s territories in 1962 [6]. Subsequently, the concept of “life circle” was put forward as the prototype of the concept of “community life circle”. This concept was later accepted, and it gradually spread over the world, e.g., South Korea and France, which are characterized by their large and intensive population [7,8].
A scientific and an accurate delineation of CLC’s spatial coverage is a prerequisite for achieving its planning goal and ensuring the smooth practice of its planning. Three mainstream methods to delineate CLC have been proposed: (1) division based on fixed boundaries, such as administrative boundaries [9,10,11]; (2) division based on fixed distances, such as distances on topological road networks [11,12]; and (3) division based on questionnaire surveys or GPS surveys [5,8,13]. However, previous methods often ignore the residents’ travel activities and their interaction with the surrounding physical environment. Furthermore, there is still no generally applicable method that can delineate CLC accurately with low cost and large coverage. Therefore, it is necessary develop a CLC delineation method that can consider residents’ daily activities and the surrounding physical environment quantitatively, cost-effectively, and more efficiently.
Ubiquitous location-based services data can now be collected with the development of open map services to address the limitations of previous studies [14,15,16]. These fine-grained and continuous data sources can be applied to supplement or substitute traditional survey data, which make it possible to portray human daily activities pattens with low cost and high efficiency [17,18,19]. Among these, mobile phone data and POI data can be easily accessed and can cover the entire urban space. Mobile phone data can represent the daily travel activities of the residents, and POI data can comprehensively describe the physical conditions.
Mobile device data are the most widely applied and promising source [20,21]. Mobile device data comprise two major types: location-based traces data and call detail records (CDRs) data. Location-based traces data (such as WeChat, Weibo, Facebook, Twitter etc.) are captured by the GPS devices attached to mobile phone, which boasts precision of data with longitude-latitude information recorded every couple of minutes [22]. Such location-based trace data usually contain private information about residents, which leads to the difficulty to obtain a large sample of such data. By contrast, CDRs data can be more effectively recorded by the base stations [23]. CDRs data contain location information of millions of individuals so that they can be used to track phone users’ movement at various levels of granularity [24,25,26]. Furthermore, CDRs can be generated from neither feature phones, standard cellphones or smartphone. Therefore, their use in research does not preclude those from low socioeconomic groups in the way that GPS data would, for instance [27]. In addition, the realistic spatio-temporal characteristics of residents’ behavior can be extracted from CDRs data without revealing privacy of participants [28]. There are many scholars have studied residents’ travel patterns based on mobile phone data. For example, Zhu et al. inferred individuals’ daily activities from their mobile phone traces [29], Yao et al. developed an effective framework to extract individual daily travel patterns from mobile phone data between workdays and day-offs [30]. There are also scholars who have applied mobile phone data to community-related studies, Yue et al. used the numbers of mobile phone users in a 24-h period as a proxy of neighborhood vibrancy, for instance [31]. The aggregated CDRs data in several days allows effective analysis of the daily activities of residents, but they suffer from a mismatch with the street scale because they often have coarser spatial scale than the CLC [27,30].
POI data are characterized by a large volume of data and a low cost of acquisition, which contain information about facility types and precise spatial locations [31,32]. In China, the POI categories are in accord with land-use classifications [33]. However, in contrast to conventional land-use data, POI data from navigation databases have the following advantages: (1) POI data have greater flexibility for studying scale issues because point data can be transformed to arbitrary scales; (2) People’s preferences and social functions can be represented by their interactions with POIs rather than by land-use type; (3) The statistical granularity of POI data is much finer [33,34]. In addition, POI data can be used to delineate the functions of urban spaces effectively at the building level, because human activities usually take place in POIs [32,35]. For example, Mei-Po Kwan et al. through taking into account the attractiveness of POIs proposed a human travel purpose inference method that takes to divide human trips into different types combining with the taxi trajectory data [36]. POI data are often used to infer the purpose of human activities in combination with other types of LBS data, which cannot directly provide the detailed activity information of individual [37,38,39,40]. For this reason, the combination of fine-grained POI data and mobile phone data allows for more accurate analysis of people’s activity travel patterns at the microscopic scale.
To sum up, based on the experience of previous related studies, in order to delineate the CLC more accurately, both the travel activities of residents and the physical space conditions should be considered. At the same time, ubiquitous and easily accessible mobile phone data and POI data can help to achieve quantitative, easy to generalize and efficient CLC delineation. Therefore, this study aims to conduct urban CLC delineation based on Mobile Phone Data and POI Data (DMP for short), quantitatively and easily to generalize. Wuhan is one of the large cities in China that is undergoing rapid urbanization, and we apply the method to cases in Wuhan to verify its feasibility and effectiveness. Through the results of this method, it may be possible to achieve a fine-grained evaluation of the current performance of the community-related planning and provide data support for the subsequent CLC planning and policy formulation, thus helping to achieve its people-oriented planning goals.
This paper is organized as followings: Section 2 introduces the DMP methodology and materials; Section 3 shows the experimental results; Section 4 presents the discussions, and Section 5 is the conclusions.

2. Literature Review

There are three mainstream methods to define the coverage of CLCs. The first method is based on fixed boundaries, such as administrative boundaries. The infant community-related analyses used fixed boundaries, such as census tracts, postal codes and voting districts, or administrative units, such as geographic boundaries [9,10,11]. Because administrative boundaries are statistically significant and can reflect general characteristics of the internal population. For example, relationships between neighborhood residential environments and various health behaviors and outcomes have traditionally been investigated using such an approach [12,13]. In addition, such fixed boundaries are relatively easy to obtain [41,42,43]. Although administrative delimitations of neighborhoods may have collective meanings [44], they have not taken into account the travel activities ranges in residents’ lives [45]. For example, Coutts et al. examined green space at the whole-county level for the U.S. and could not capture places related to physical activity of individuals [46].
The delineation based on fixed distances, such as distances on topological road networks, is another widely used method. To address the limitation of the fixed boundary method, most of the research tended to define spatial boundaries within a certain Euclidean distance, road network distance, or buffers [8,11,12]. Although this method takes into account the walking distance of the residents, the diverse needs from residents in the CLC has not been considered [5,12,47]. Some scholars have tried to consider residents’ needs for facilities, using indicators such as the coverage rate and convenience of facilities [8,13,48]. However, such delineation results lack flexibility and cannot satisfy the new requirements to adapt to local contexts [5]. GIS tools and two-step floating catchment area methods are often used to analyze the needs of residents versus the supply of surrounding public facilities continuously [49,50,51]. However, from a spatio-temporal behavior perspective, these studies may have oversimplified residents’ daily activities and ignored the daily mobility of individuals [52]. Nevertheless, it is worthwhile to learn from the core of these methods to consider both residents’ daily travel and the surrounding spatial conditions.
The third method is based on sample surveys and GPS surveys. In recent literatures, some scholars have investigated the daily activities pattens of residents using sample investigation and GPS data to delineate the coverage and facilities configuration of the CLC [5,8,13]. This method concerned the interaction between residents’ daily activities and the surrounding physical environment, too, so that the delineated CLC is closer to reality. CPS data can accurately record the travel activity trajectories of individuals at the CLC scale and previous scholars have conducted studies at the individual community scale while obtaining additional information through sample investigation. However, the cost of sample surveys and GPS surveys is extremely high. Moreover, the coverage of the survey sample is relatively small, resulting in sample bias [53,54,55]. To reduce bias, multiple GPS sampling surveys are required, further increasing costs. Thus, it is difficult to generalize for one specific community to other communities using traditional survey data [56]. Some other scholars have suggested that the boundaries of CLC can be defined by identifying the activity space [5]. Theoretically, the community life circle is equivalent to the aggregated result of the activity space near and within the community of all the residents and the methods of determining the boundaries of both do have some commonalities. However, the existing methods of activity space delineation also have similar dilemmas, and they also only consider the actual behavior of residents while ignoring the role of the surrounding environment [57,58,59].
Therefore, to delineate the CLC considering residents’ daily activities and the surrounding physical environment quantitatively, cost-effectively, and more efficiently, a new way should be developed.

3. Methodology and Materials

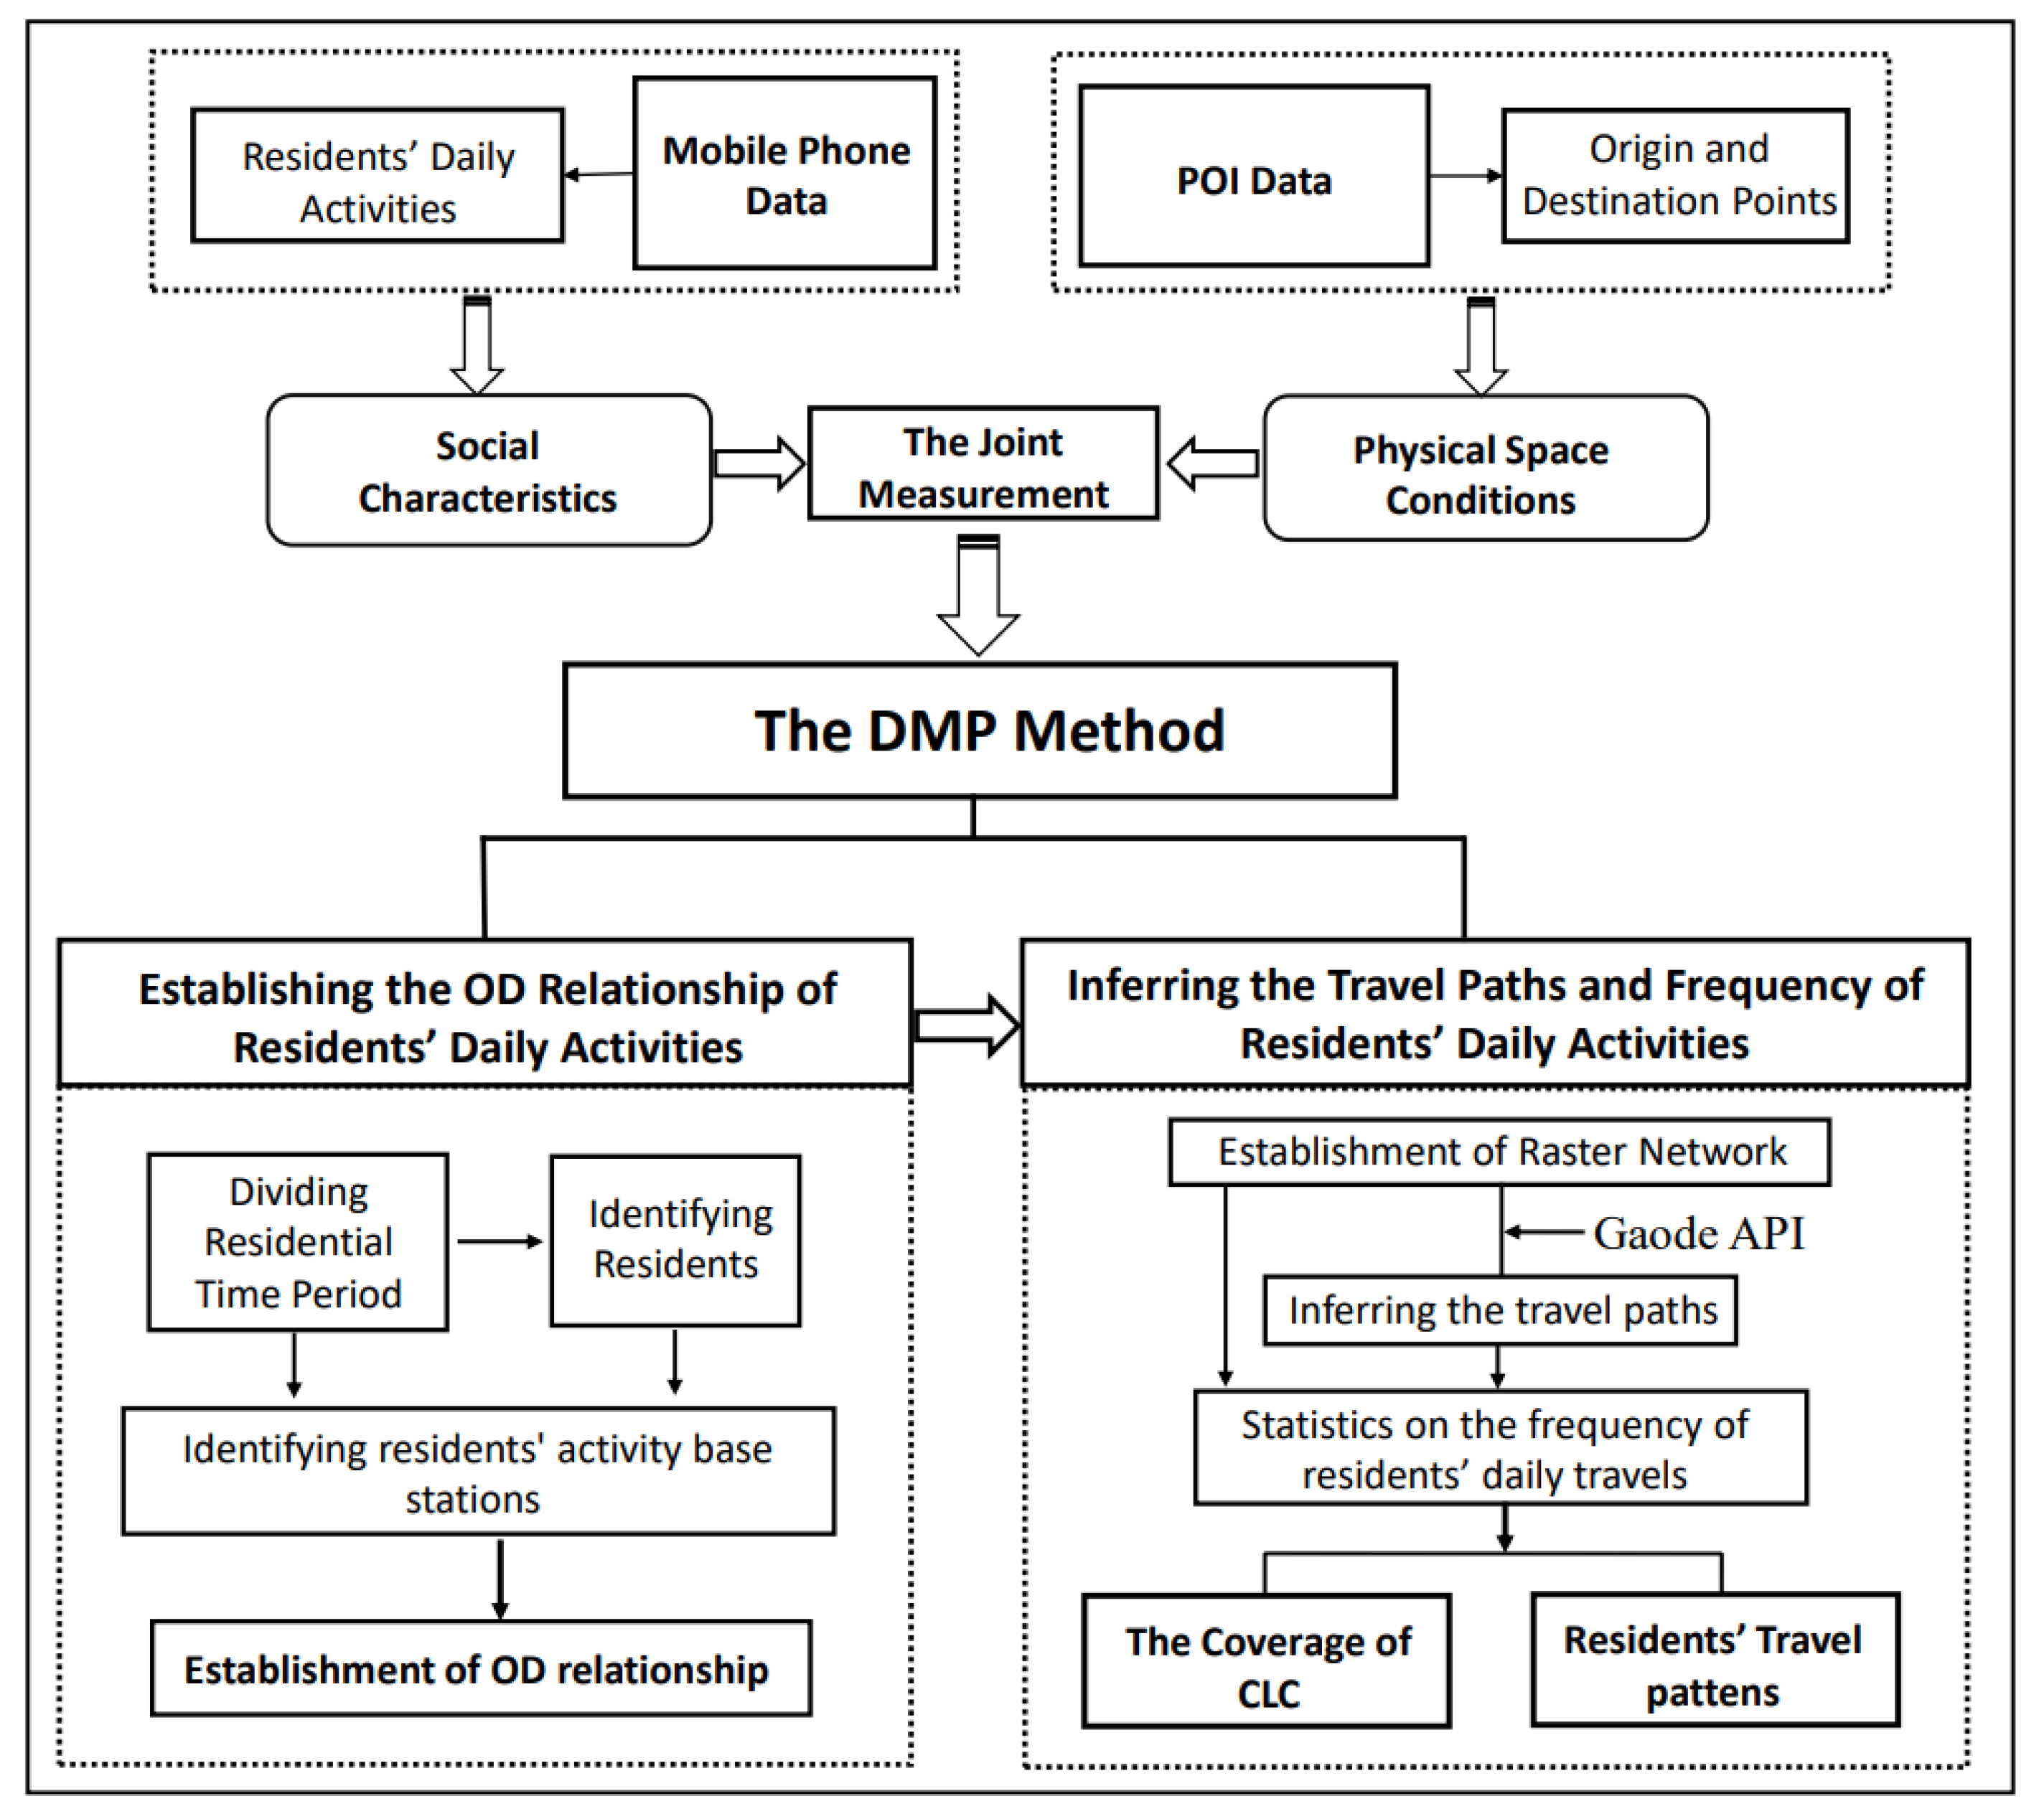
3.1. Methodological Framework

Mobile phone data can delineate CLC with relatively large spatial coverage. However, the coverage radius of mobile phone data in the city is approximately 250–300 m, which is not sufficient to reflect individual activities within the streets. The POI data can assist the analysis of people’s activity travel patterns accurately within the streets. Therefore, this study adopts POI data to infer the travel paths of residents for fine-grained delineation of CLC.
Herein, it is assumed that the paths of daily travel activities of all residents in a community constitutes the coverage of the CLC [5]. Accordingly, the daily travel activities of residents are spatially divided into three stages: the departure point, the destination, and the street-scale corridor space connecting the two.
In this study, the DMP method is carried out in two steps: first, establishing the Origin–Destination (OD) relationship of residents’ daily activities; and then, inferring the travel paths and frequency of residents’ activities. Thus, we can finally delineate the coverage of CLC and the daily travel pattern of the residents within the CLC.
The overall process is illustrated in Figure 1.

3.1.1. Establishing the OD Relationship of Residents’ Daily Activities

(1) Dividing residential time period: the travel patterns on workdays and weekends can be vastly different. Furthermore, to delineate the CLC more accurately, we need to focus on the time period of activities related to residents’ daily life. Therefore, we select the weekdays from 8pm to 8am the next morning and weekends as the users’ residential time periods;
(2) Identifying residents of the community: The principle of identifying residents is that the users have stayed in the community for three days or more within a week during the residential time periods;
(3) Identifying residents’ activity base stations: According to the planning criteria of CLC, the hierarchical model of CLC is “15-min life circle, 10-min life circle and 5-min living circle” [8]. Therefore, we define the residents’ activity base stations as those adjacent to the community where the residents have been traveled and the travel time is within 15 min;
(4) Establishment of OD relationship: Related literature proves that the probability of residents visiting different types of POIs within the CLC is different, so different weights need to be defined depending on the types of POI [60]. Specifically, residents may more frequently use facilities that are related to their basic demands, such as living facilities, dining facilities, shopping facilities, leisure facilities. Taking into account the relevant literature and calibration by the sample surveys, we assign different weights to different types of POI according to the frequency of residents’ daily use (Table 1) and establish a model of activity facility weights (Table 2) [61]. Then, based on the weighting model, residents’ the travel frequency of the activity base stations is assigned to each POI point to establish the OD relationship.

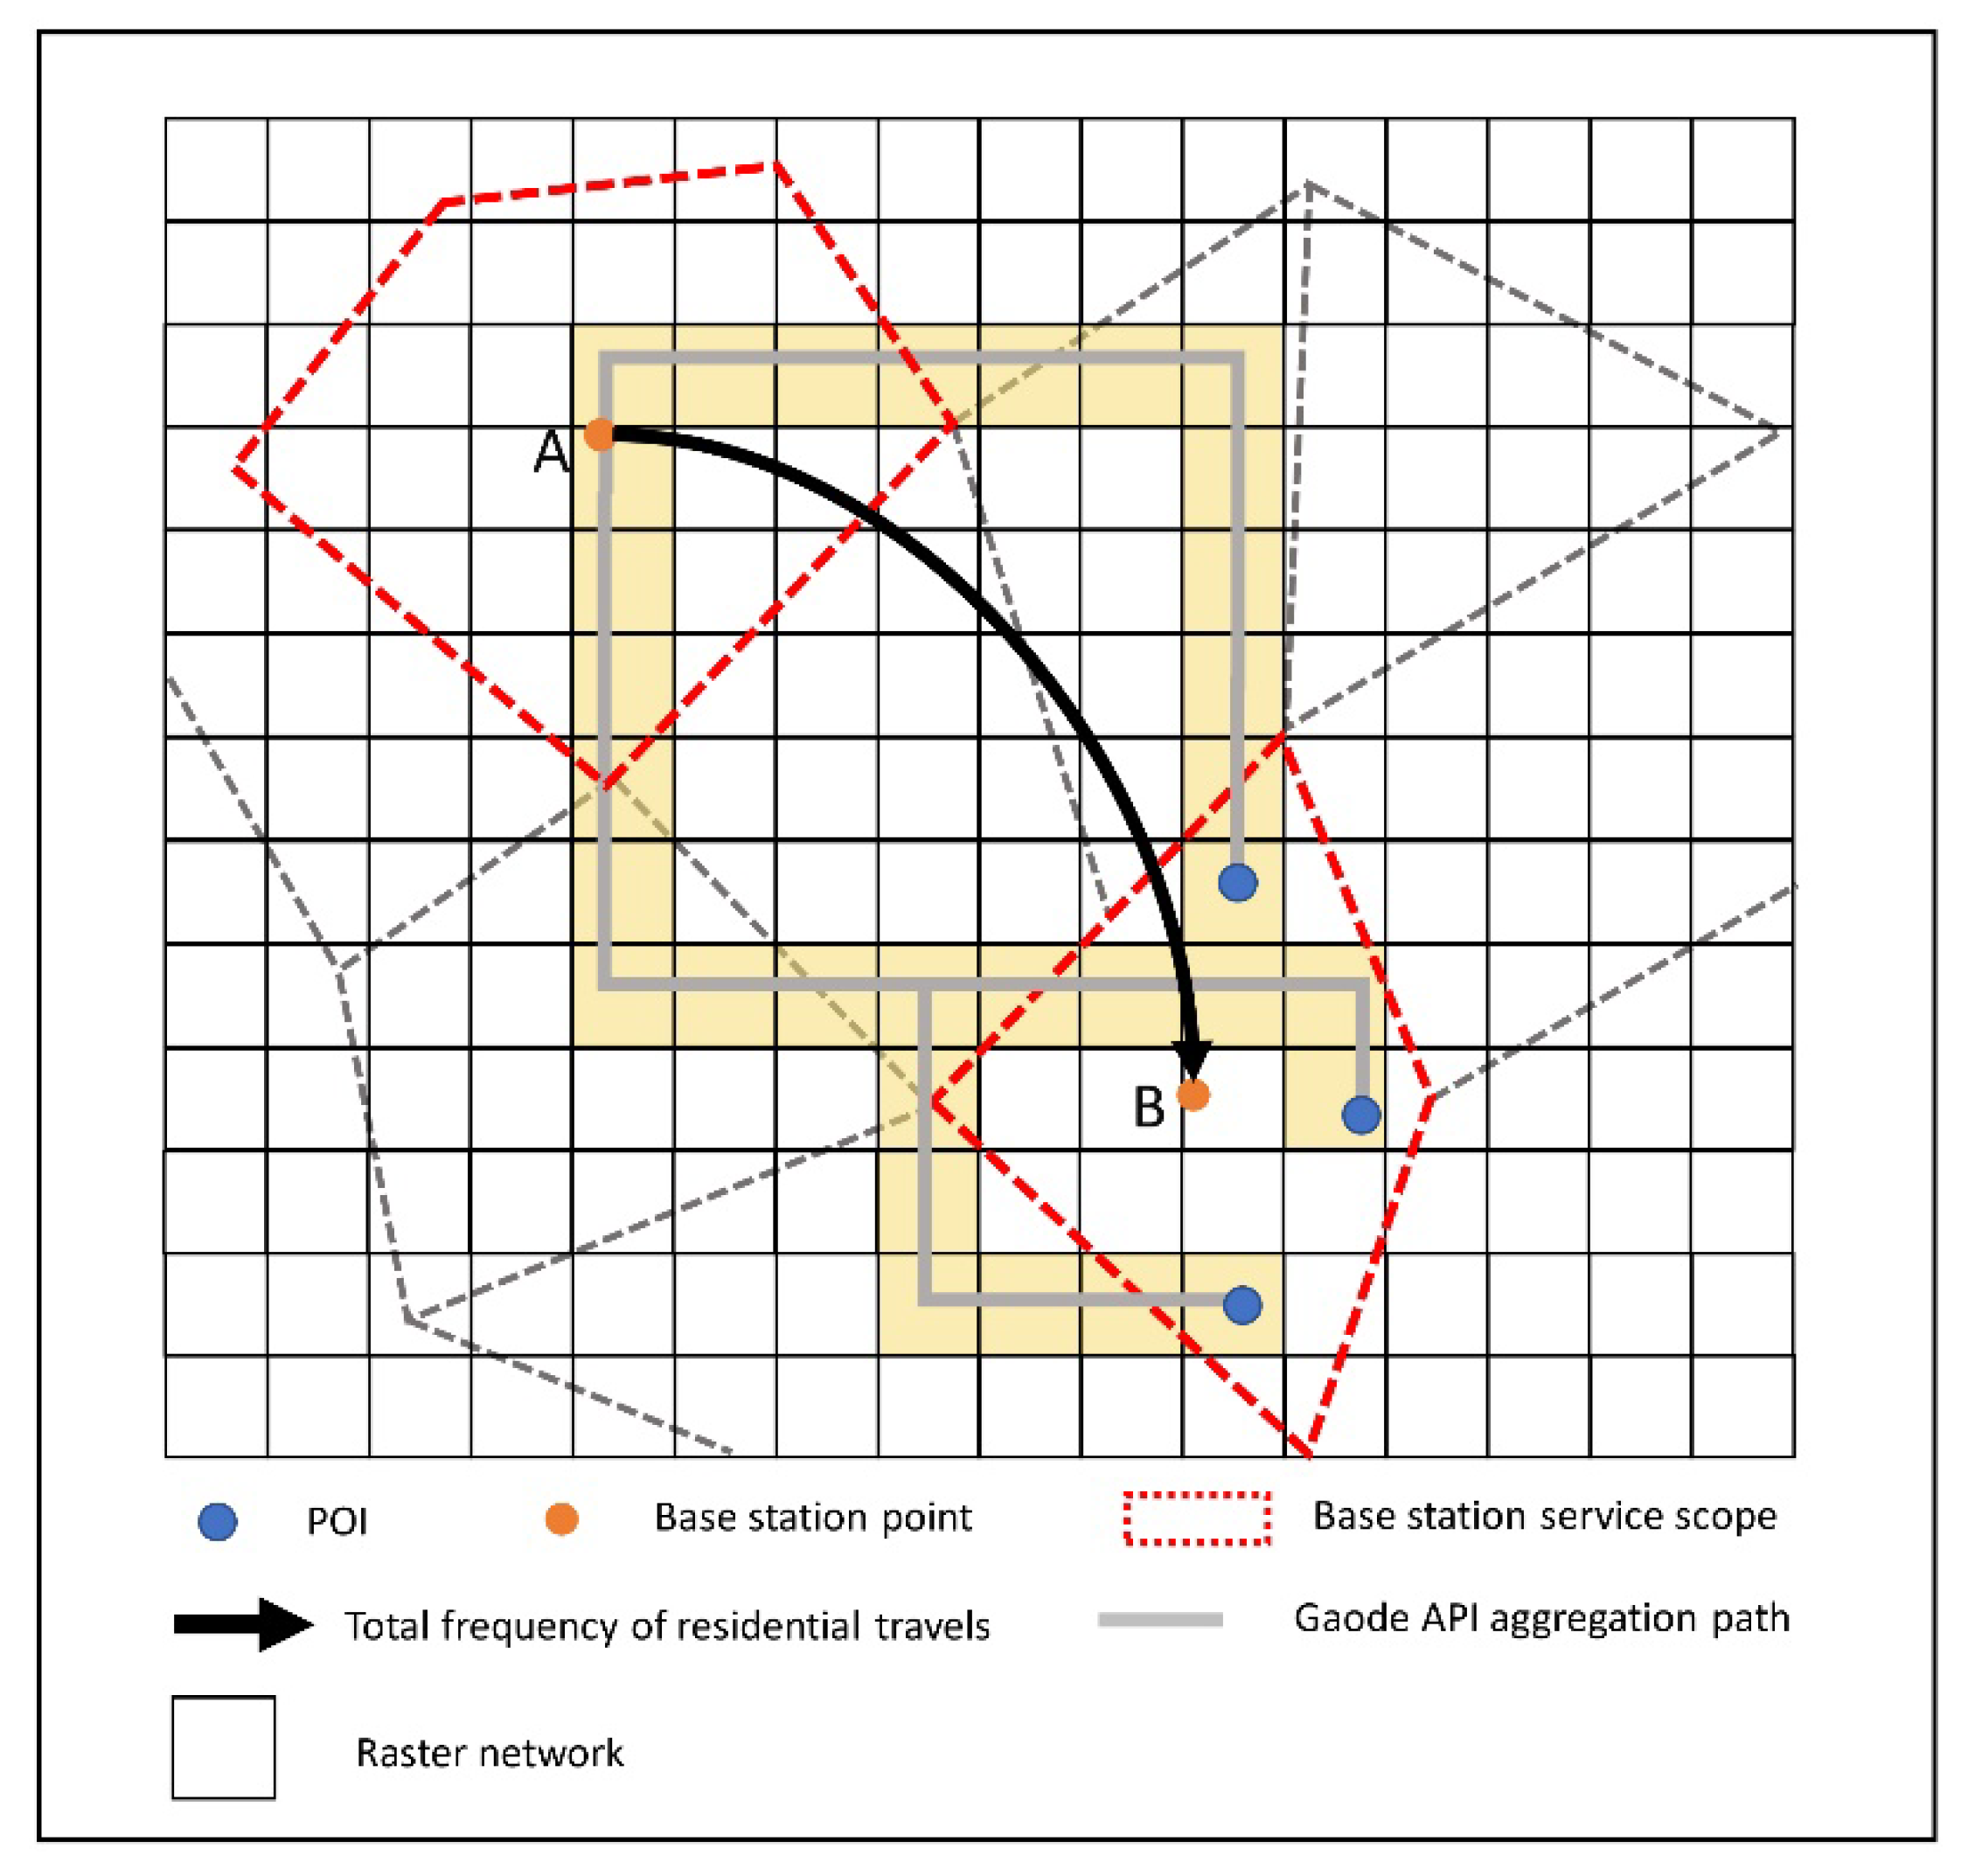
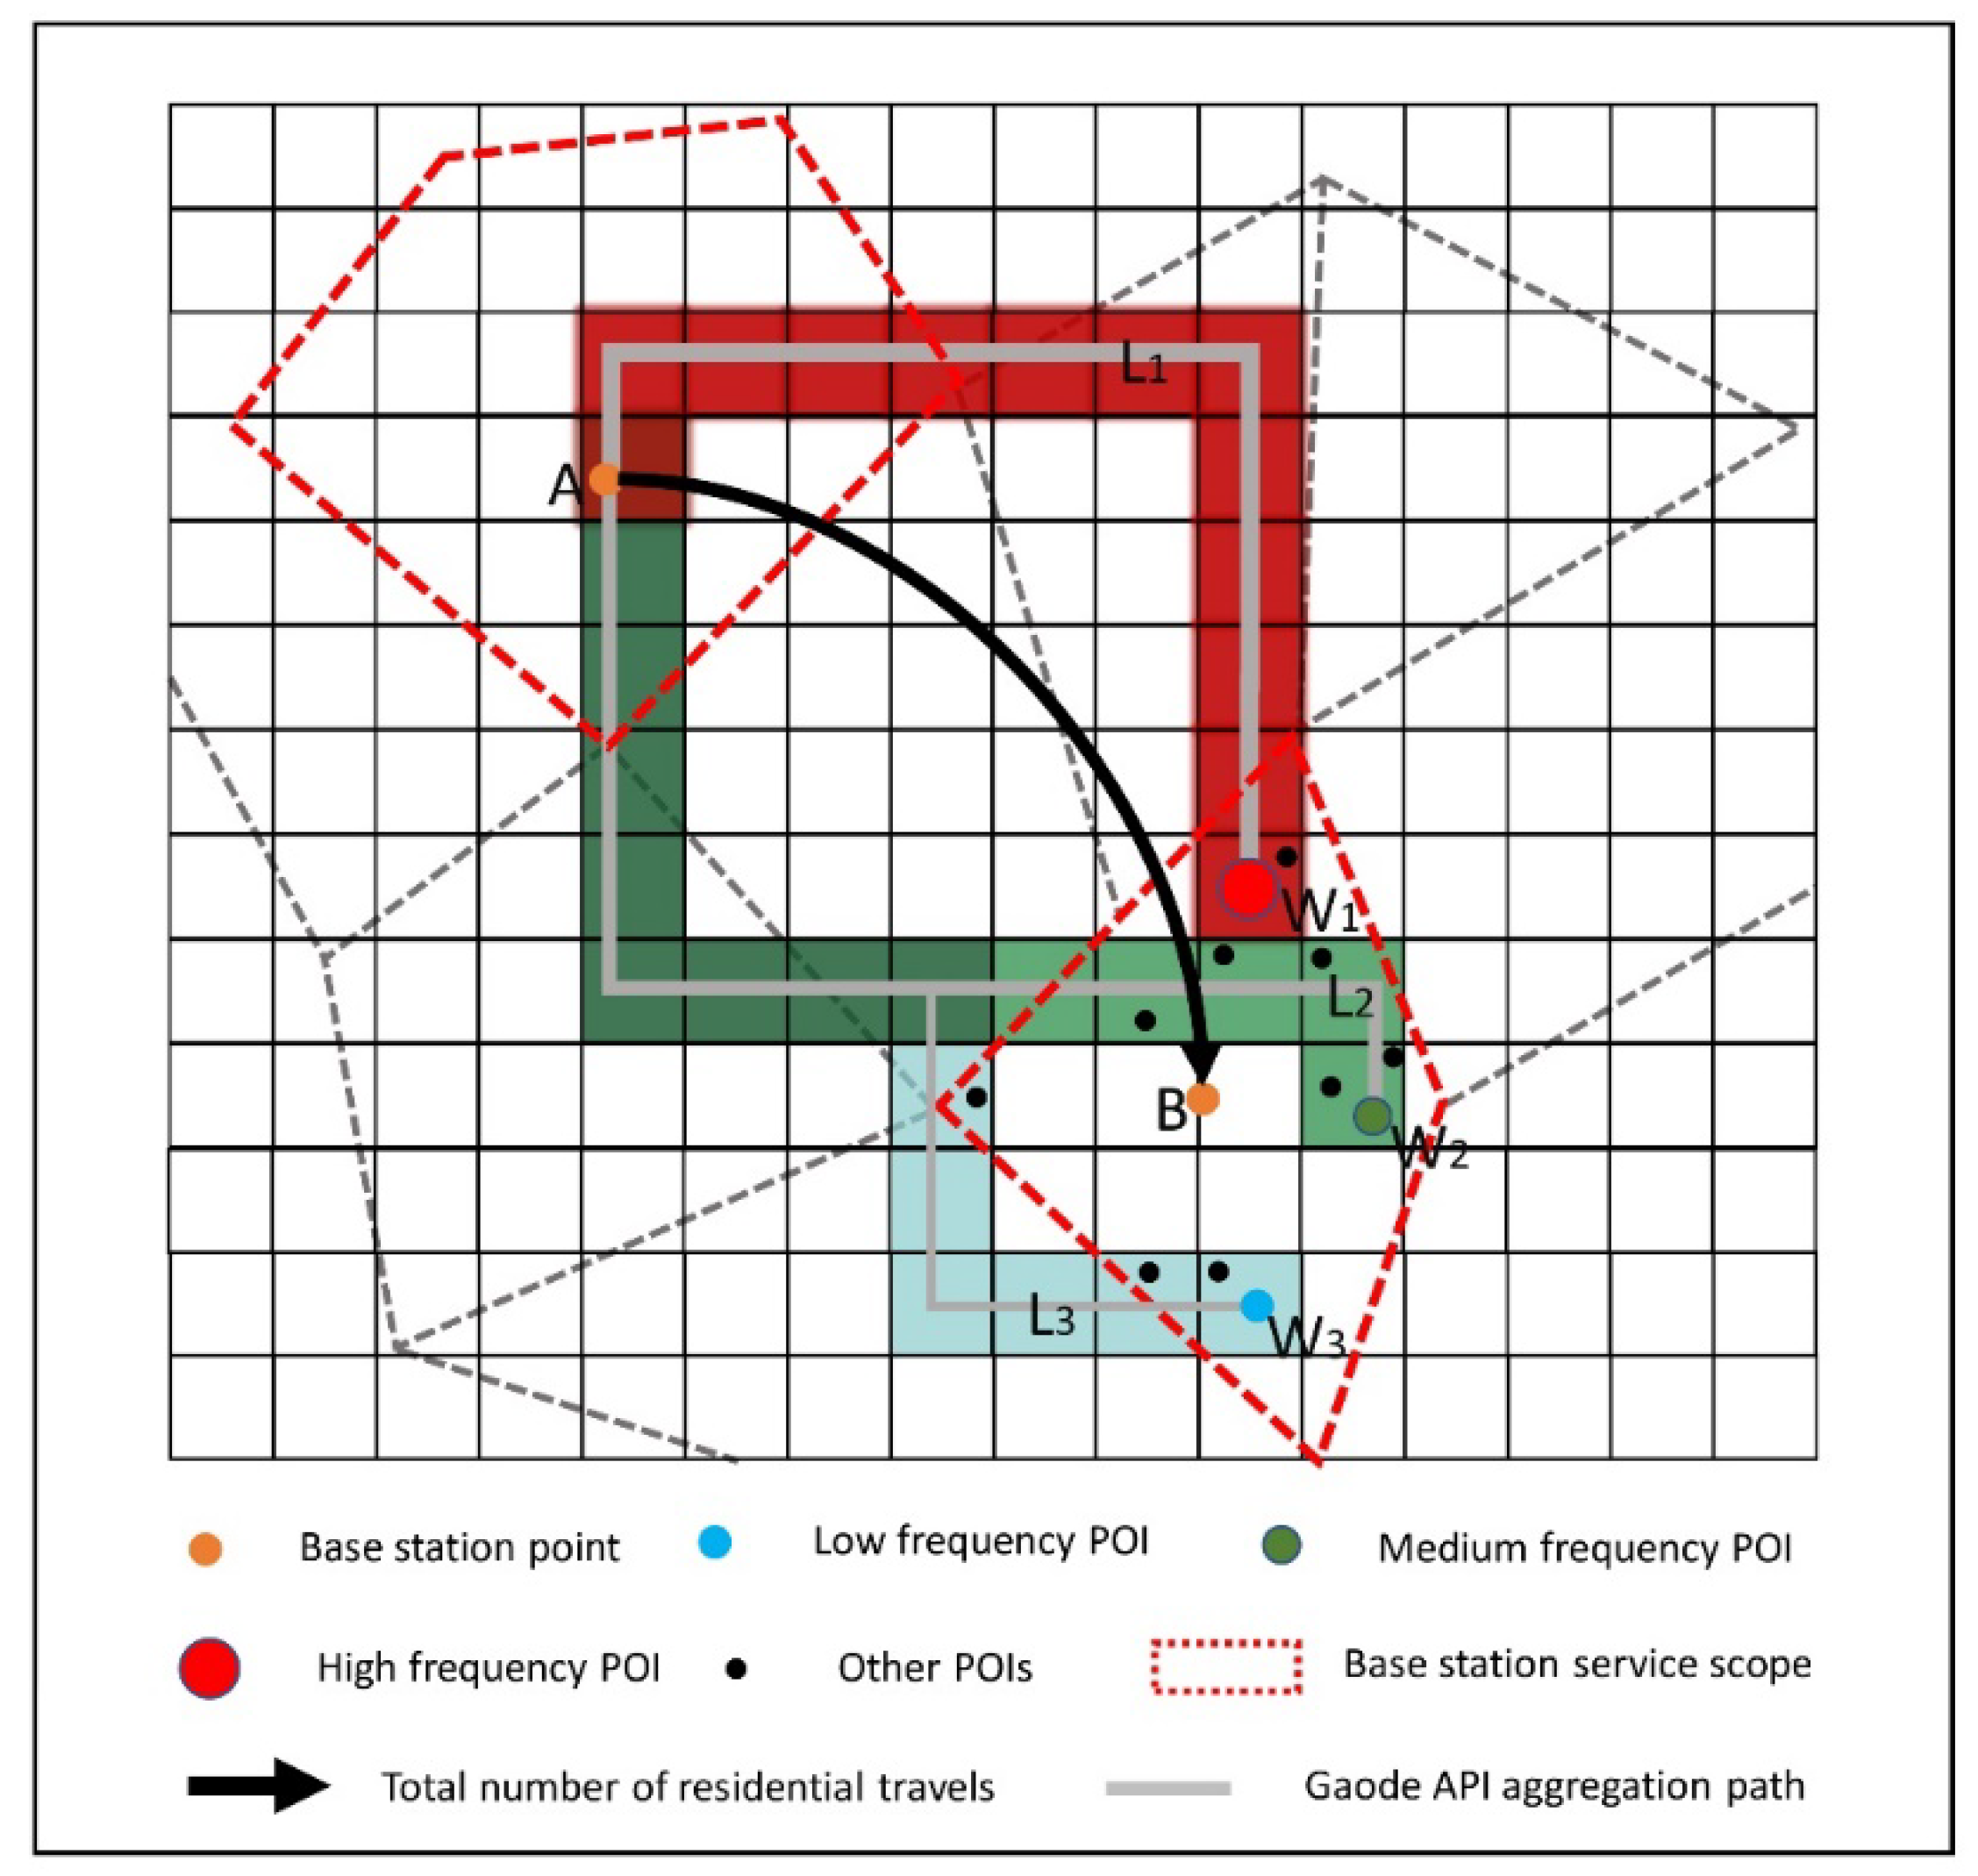
3.1.2. Inferring the Travel Paths and Frequency of Residents’ Activities

(1) Establishment of raster network:
Residents’ daily activities are often carried out in the space of street scale. Based on the scale of the street space, we build a 50 × 50 m raster network. The raster network is built to facilitate the subsequent statistics and calculations;
(2) Inferring the travel paths:
Open map services can directly provide the best paths for residents who use various modes of transportation. The travel behaviors generated by commuting are compatible with the best paths generated by map services because they are more familiar with the road sections [62]. Therefore, to realistically infer the trajectory of residents’ daily activities in the CLC, we use the requests library in Python to realize the quantitative inference of residents’ daily activity paths based on Gaode map application programming interface (API). Gaode Map (https://www.amap.com, accessed on 10 August 2022) is one of the main transportation route navigation providers in China, providing accurate road data and an algorithm for computing the best paths which are open access. The travel times obtained based on this method are more accurate. On the one hand, travel path was real recommended map navigation path; on the other hand, the path selection system considering walking time during route selection, waiting time, transfer impact, and traffic jams, the final travel time obtained corresponds to the impact of various factors already converted into time costs [63].
The origin point is the entrance of the experimental community, and the destination point is the POI point within the service area of the resident’s activity base station. According to the planning criteria of CLC, the travel time of residents’ daily activities is also set as within 15 min. Taking two base stations A and B as an example, the inference process of the travel path of residents’ daily activities is shown in Figure 2. The coverage of CLC can be acquired based on residents’ cumulative paths;
(3) Statistics on the frequency of residents’ daily travels
Still taking the example of two base stations A and B (Figure 3), the travel frequency of the resident travel paths is calculated using the following formula:
F L i = O D A B × W i i = 1 n W i
where F L i denotes the travel frequency of the i th travel path, O D A B represents the frequency of residents’ travel between the base stations A and B, W i is the weight of each POI point.
Then, the frequency of residents’ trips within each grid is calculated by the formula:
F j = i = 1 n F L i
where F j denotes the travel frequency of the j th grid, F L i represents the travel frequency of the i th travel path.
Finally, we can get the residents’ travel characteristics based on the residents’ travel patten. This provides a fine-grained visualization of how the residents within the CLC use the space. Thus, it provides basic support for subsequent CLC planning.

3.2. Study Area

Some scholars have found the phenomenon that different CLCs share some important facilities [11,12]. So the distance between the experimental communities needs to be considered. In this paper, two communities, Waterside Star City and Century City, in Wuchang District, Wuhan City, were selected as experimental communities.
Although the distance between these two communities is relatively low, the composition of residents and facilities within the two communities varies greatly. Waterside Star City is located at the intersection of Qingyuan East Road and Shahu Road in Wuchang District. It was built in 2010, covering an area of 313,500 square meters, with floor area ratio of 1.7, a greening rate of 50%, and a total of 1142 households. There is a kindergarten and various other facilities. There are also many types of buildings inside the communities, such as townhouses and garden houses.
Century Color City is located at Zhongbei Road, Wuchang District. The dominant building type is a tower; it was built in 2006 and covers an area of approximately 83,700 square meters, with floor area ratio of 2.96, greening rate of 36% and a total of 1189 households. Although there are relatively few public services within the community, the surrounding commercial facilities and transportation facilities are very convenient.

3.3. Data Sources and Preprocessing

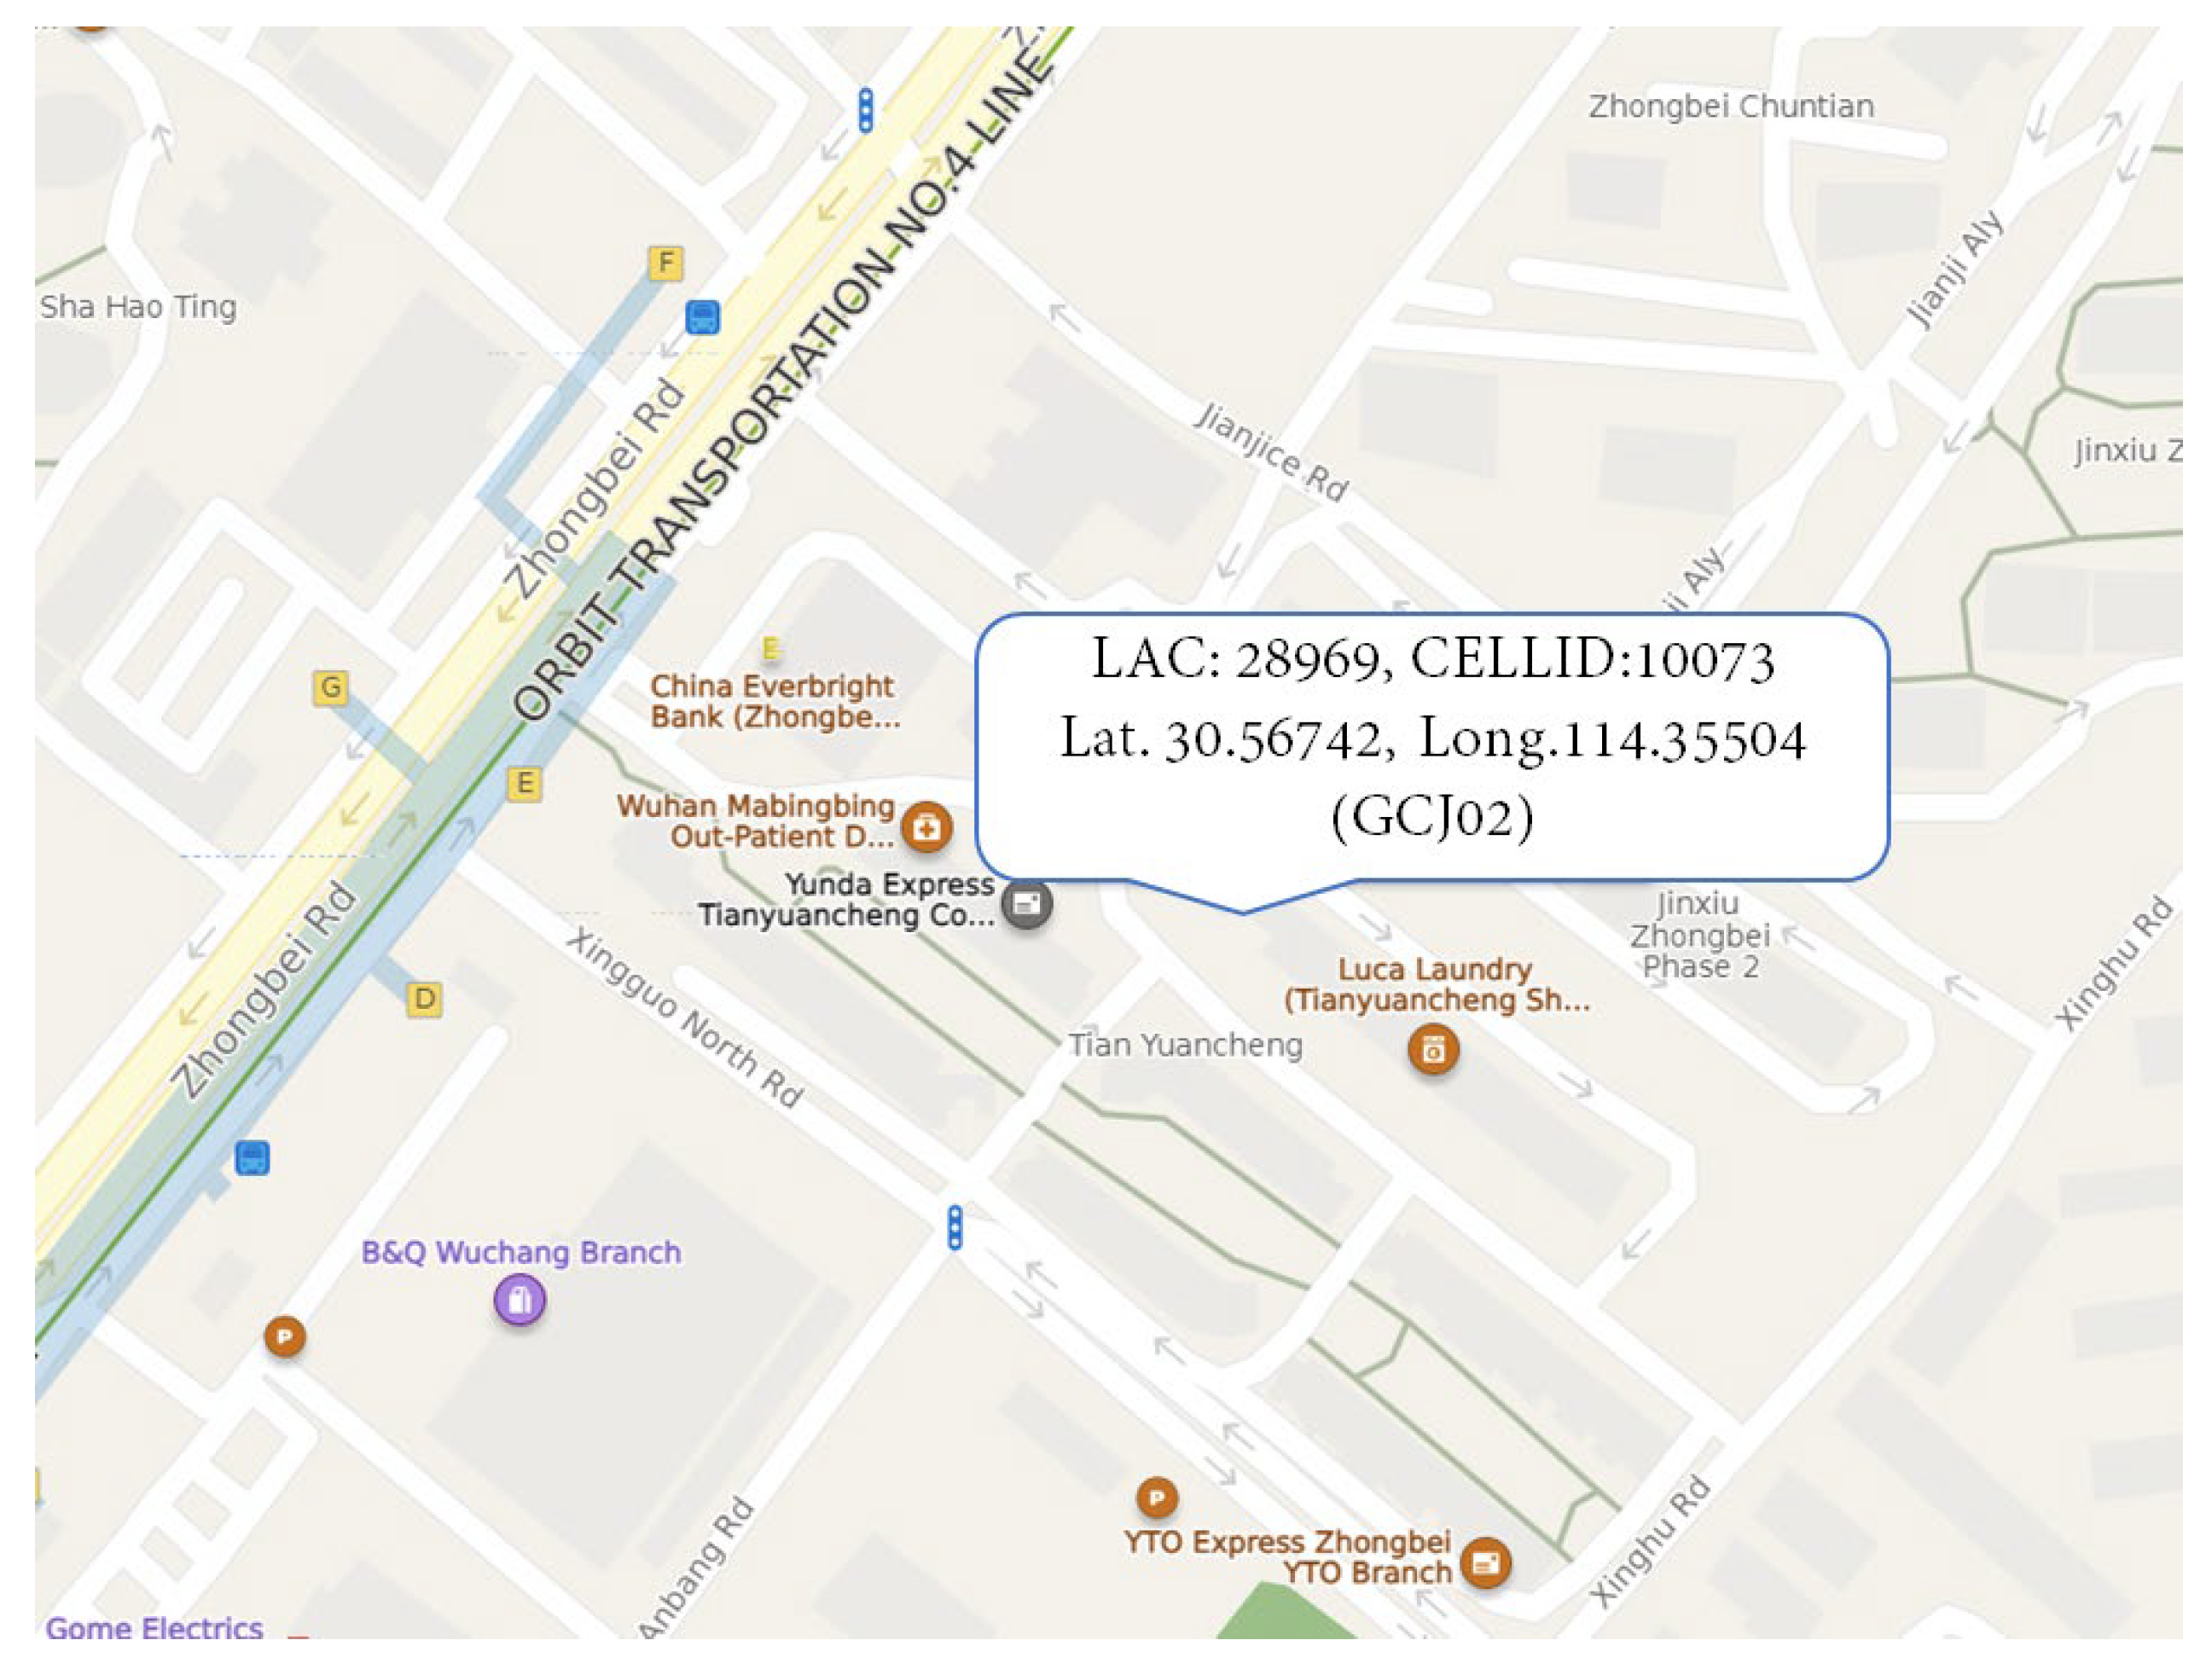
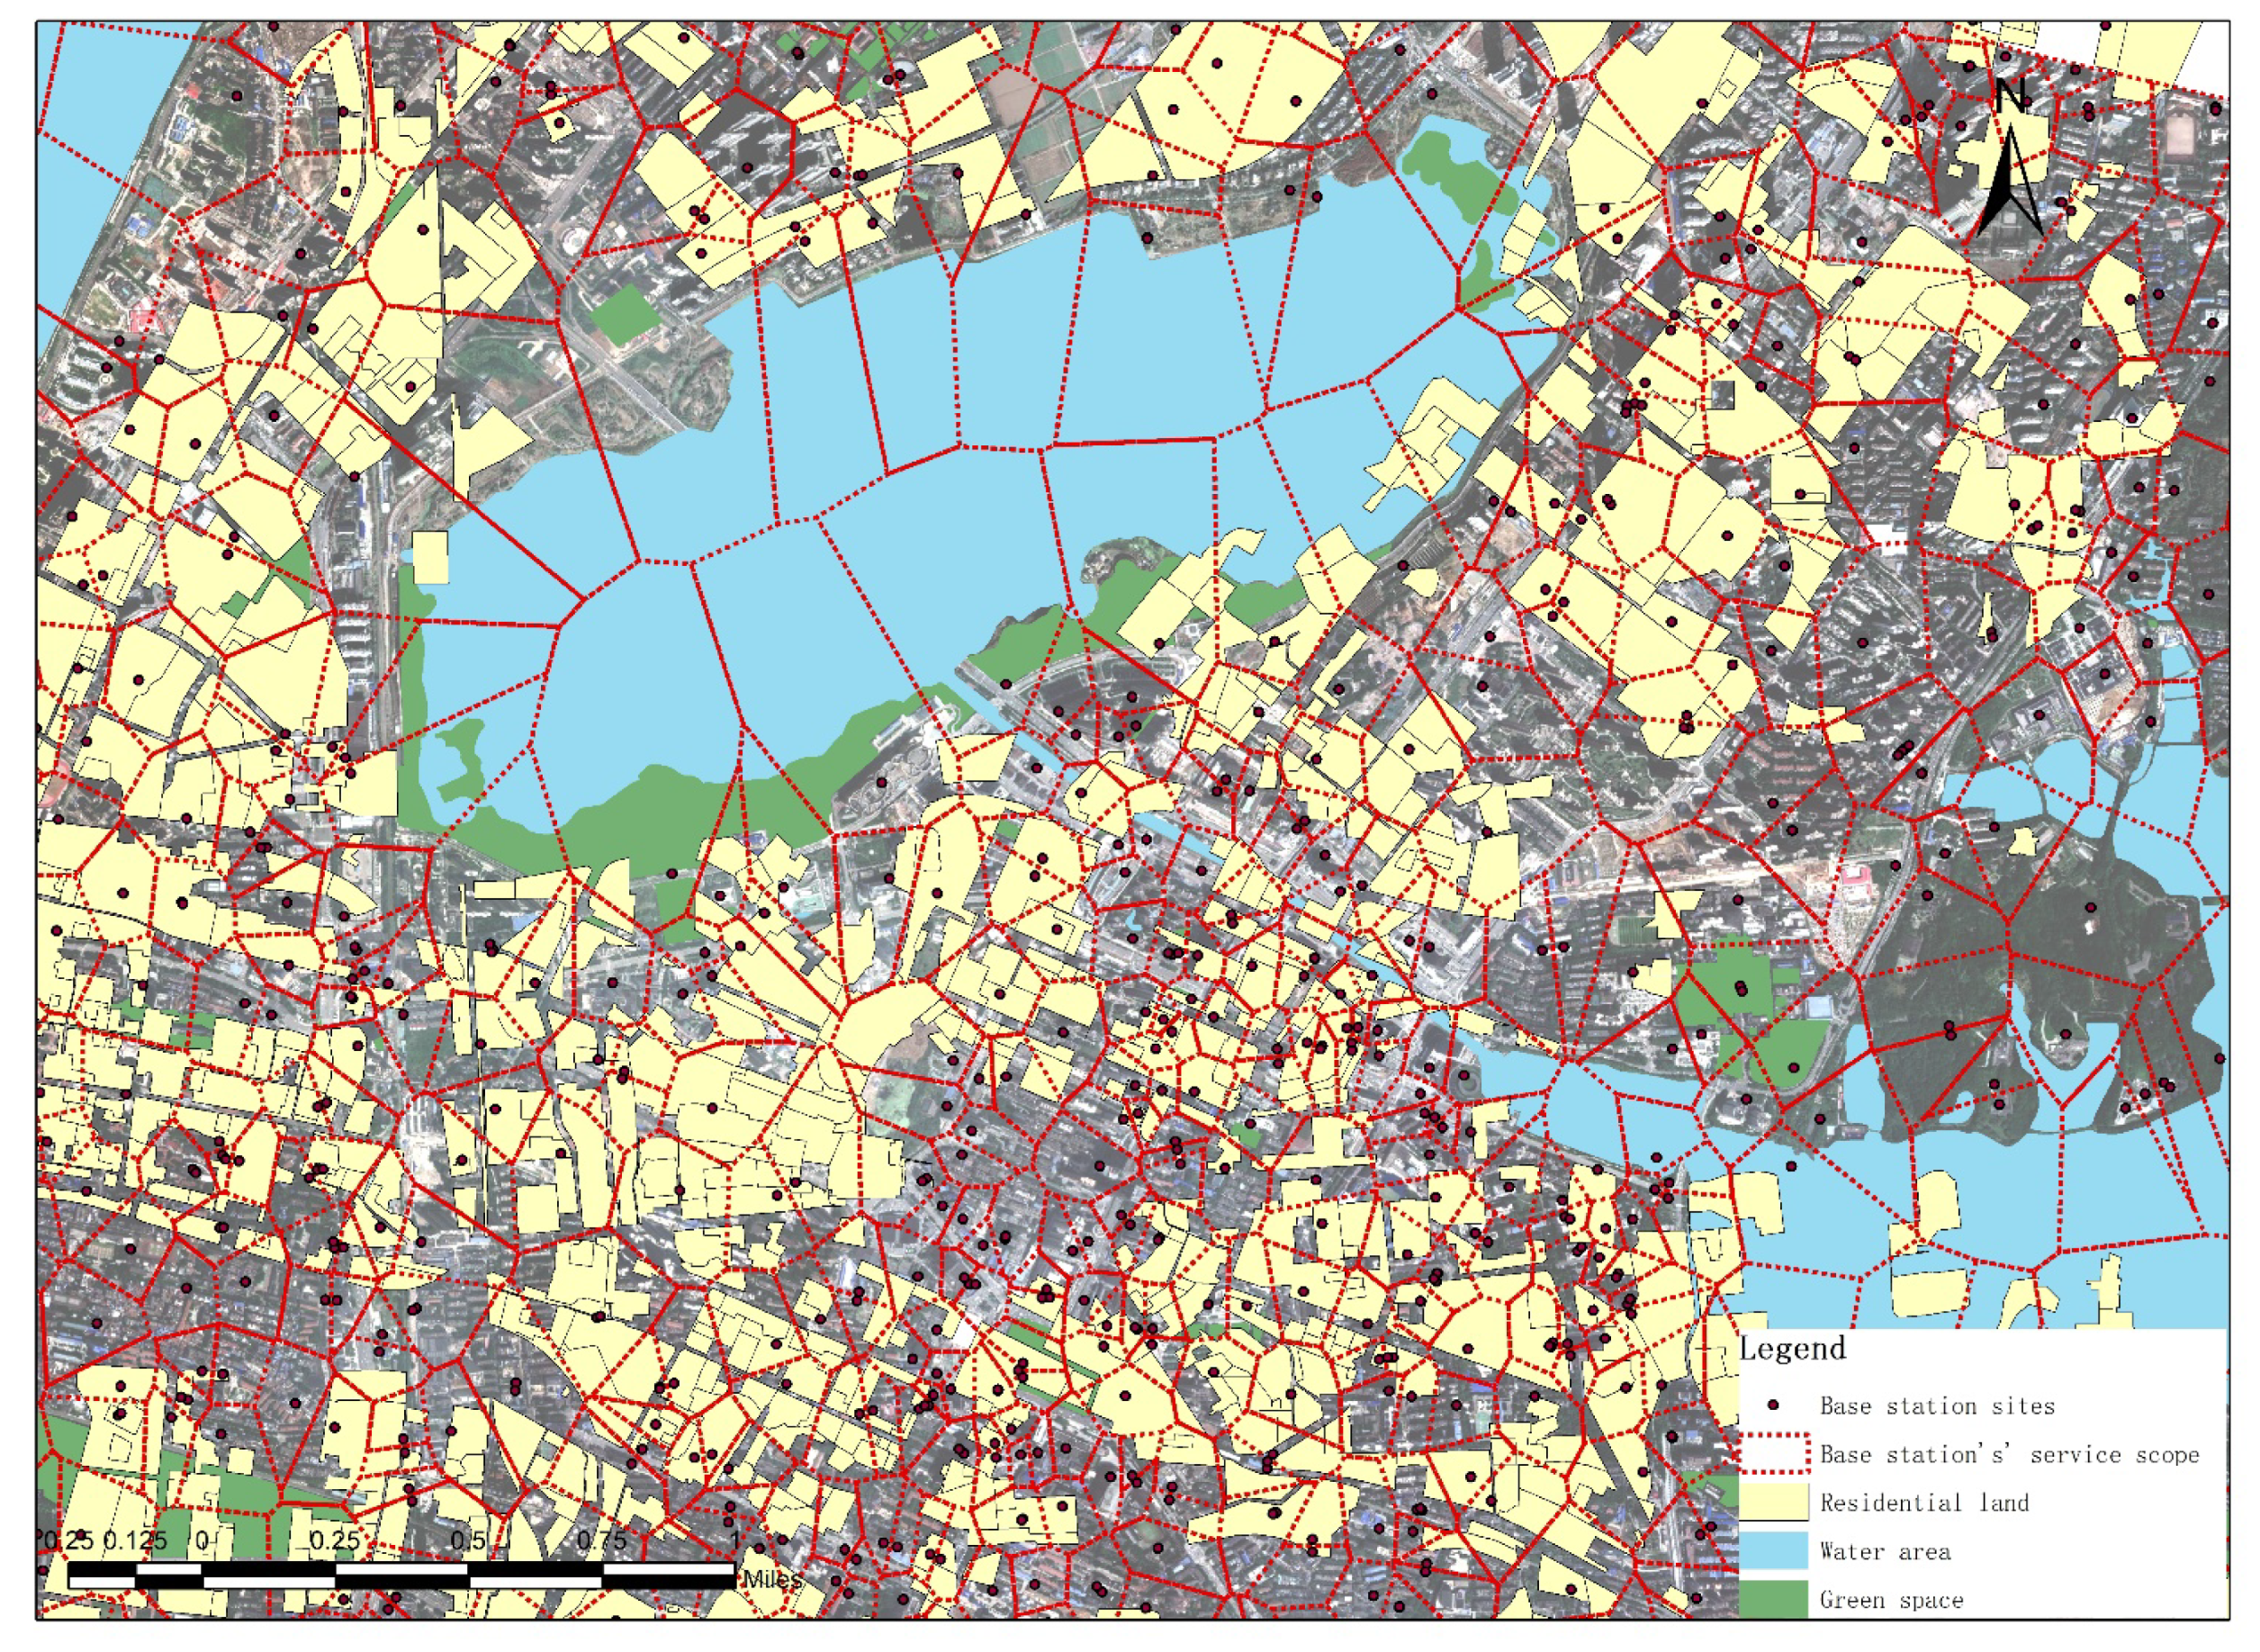
3.3.1. Mobile Phone Data
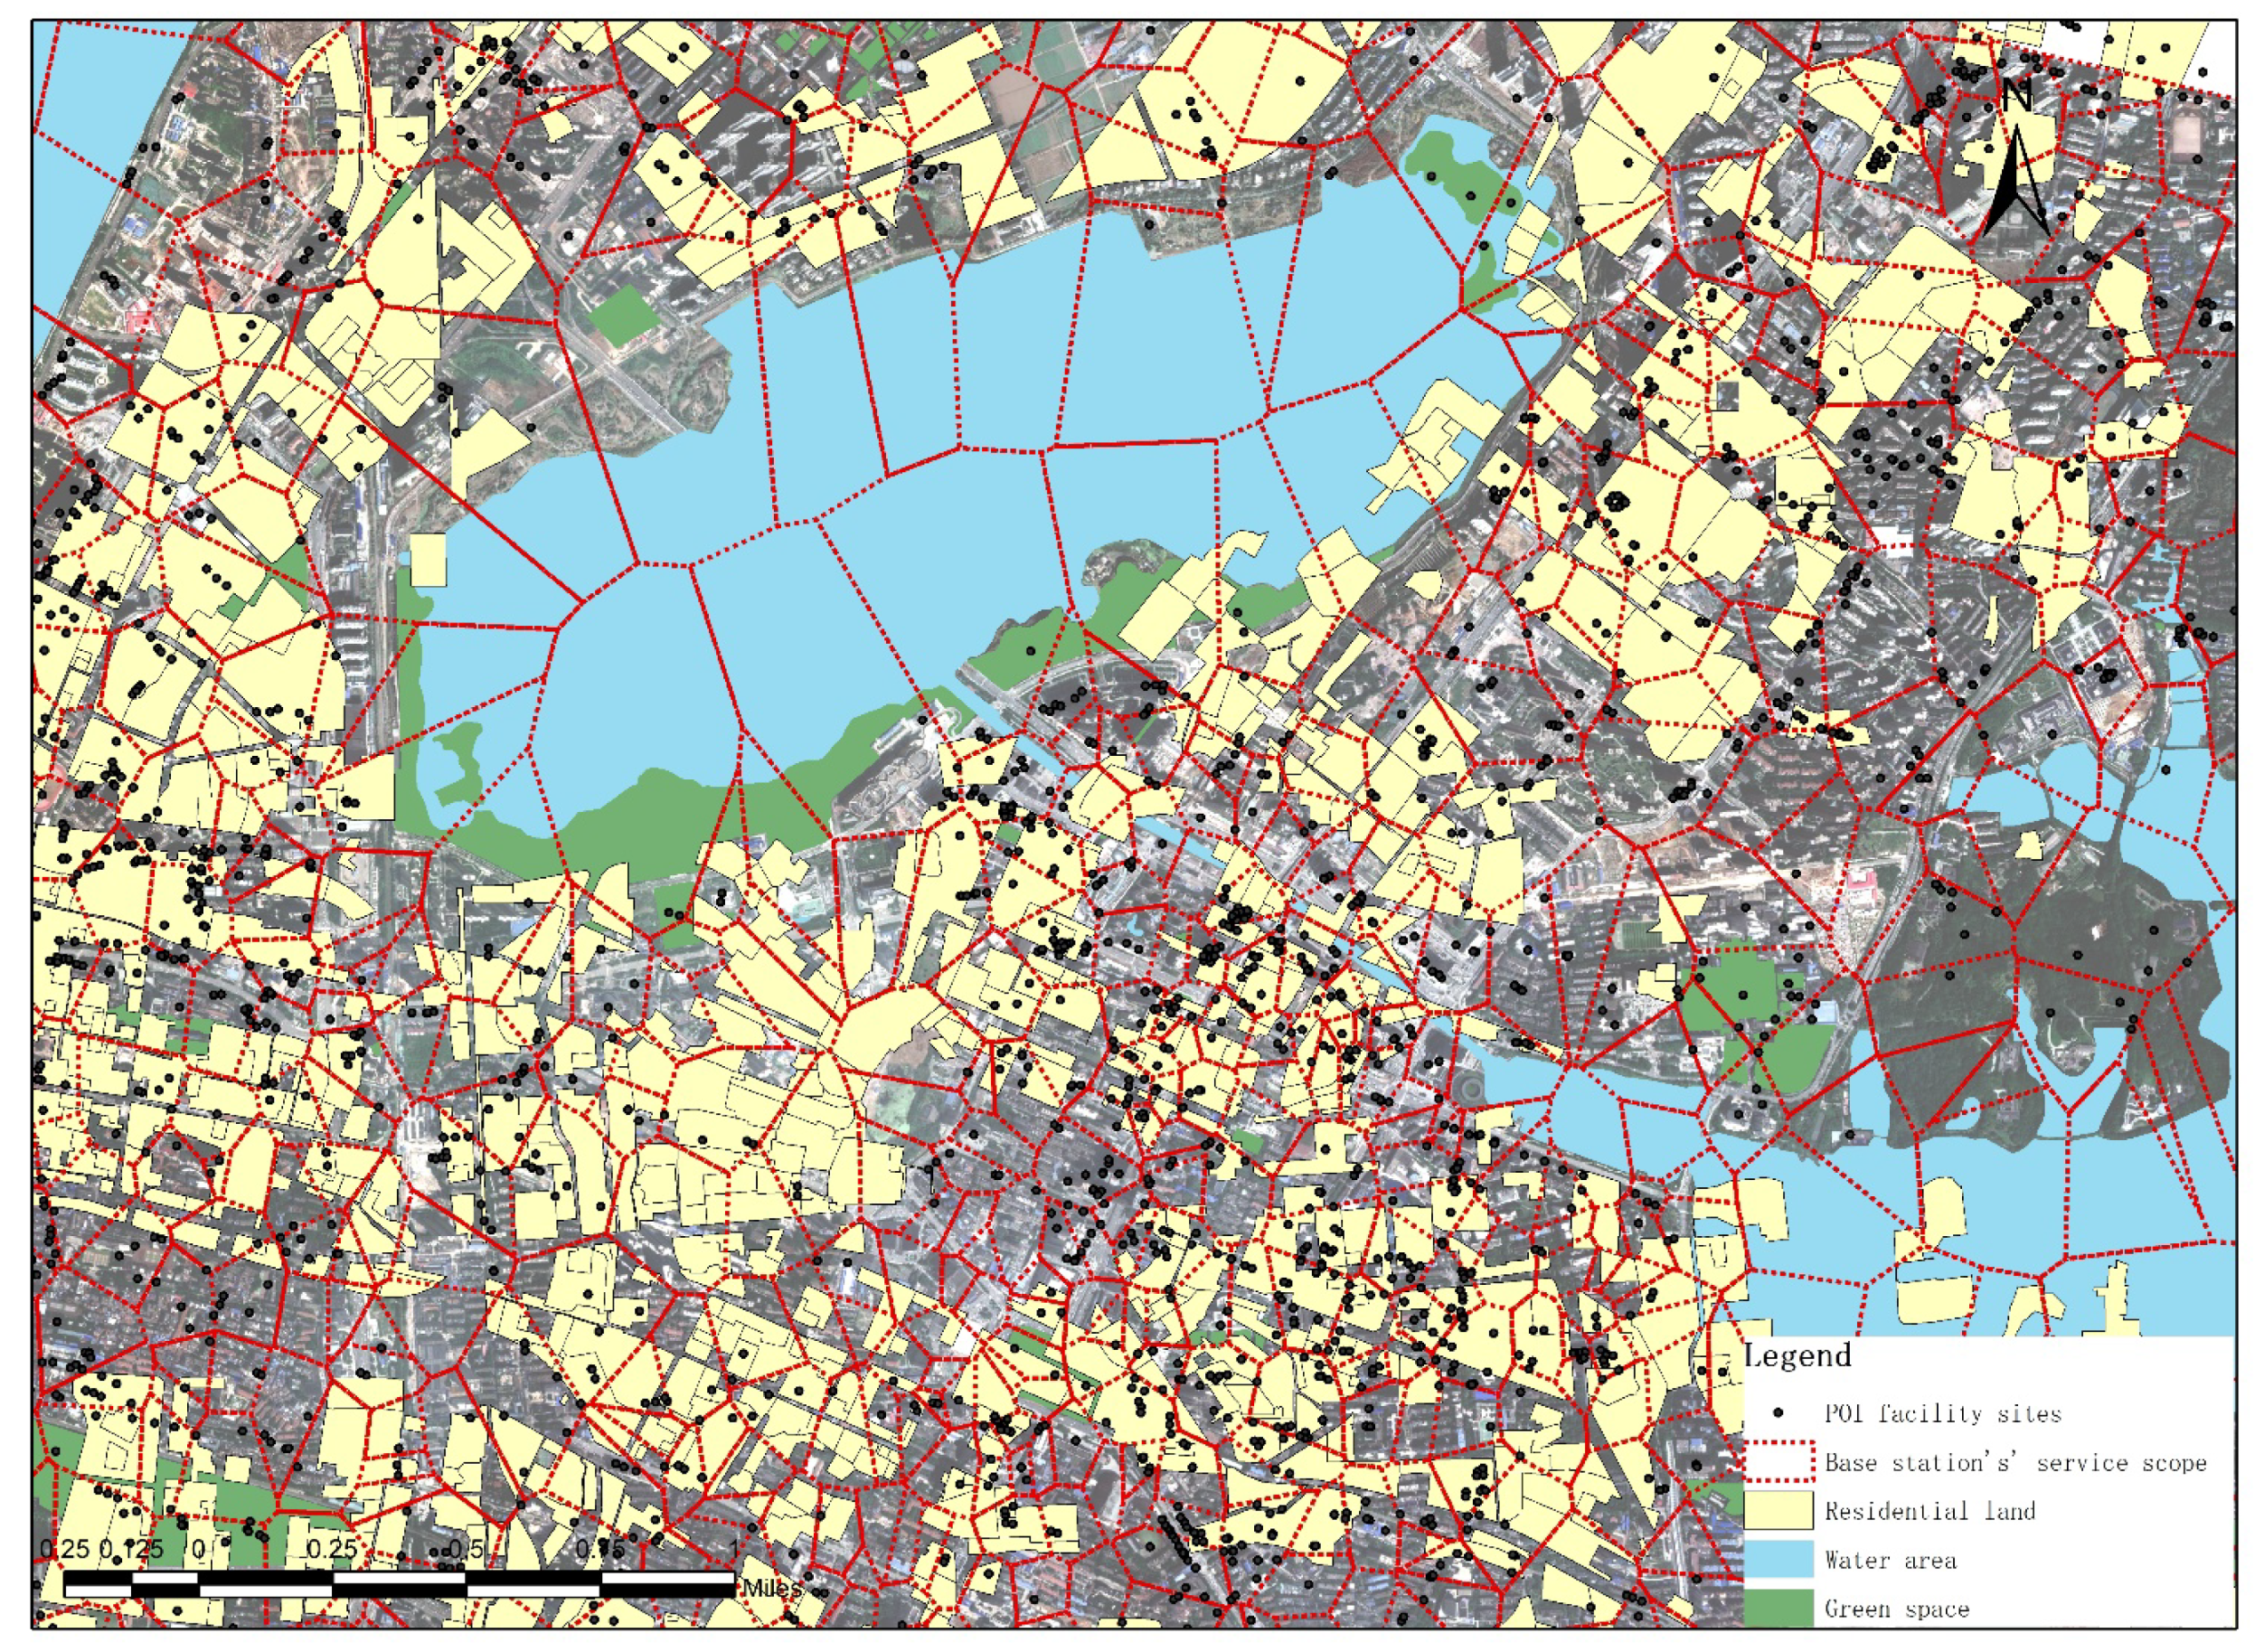
Mobile phone data comprises CDR data recorded by nearby communication base stations. In this study, we used mobile phone data for one month in March 2018, collected by a communication company in Wuhan. According to relevant studies, the daily behavior pattens of the residents are noticeably dissimilar on the weekdays and day-offs [30,64], so we selected a non-holiday week in March to show normal activities of city residents and to analyze their daily activities. Table 3 lists the structure of CDR data, comprising anonymous user ID, call time, location area code (LAC), and cell tower ID (CID). LAC and CID contain information about the communication base stations. On average, there are approximately 30 million records per day. In total, 238,329,996 calls were generated in one week by 6,435,621 users, accounting for approximately 60% of the permanent resident population of Wuhan.
Mobile phone base station data was obtained from the same communication company based in Wuhan City for a working week in March 2018, and it includes the code and geographic location information of base stations, as shown in Table 4. The distribution of the base stations in Wuhan is denser to the other big cities, such as Beijing (capital of China), where more base stations are placed in the city center than in the outer area. In the densest area, the distance between base stations can be less than 100 m. Although CDR data do not directly contain the spatial location, the spatial and temporal distribution characteristics of residents in the CLC can be obtained by aggregating the time series of CDRs and assigning them to the service area of the communication base station.

3.3.2. POI Data

The POI data used in this study are the point data crawled from the Gaode platform (https://ditu.amap.com/, accessed on 10 August 2022). There are 10 types of original POI data with 22 sub-categories, including medical, life services, auto service, leisure and entertainment, dining, shopping, finance, tourist attractions, transportation facilities and government agencies. Based on people’s activity habits in the CLC scale, this paper reclassifies the POI data. These data are aggregated to medical health, life services, scientific and cultural services, financial services, leisure and tourism, transportation facilities, and public administration facilities. After reclassification, there are 7 types of POI facilities, with 17 sub-categories, as shown in Table 5.

3.3.3. Data Preprocessing

After removing invalid data, totaling more than 6 million travel records can be obtained. The location coordinates of the communication base station can be obtained through the base station location query web page, given the corresponding communication base station code recorded in the CDR data (http://api.cellocation.com:82/cell.html, accessed on 10 August 2022), as shown in Figure 4. This location information facilitated subsequent analyses, such as identification of the residents of the experimental neighborhoods. After obtaining the location coordinates of the communication base station, spatial visualization analysis is carried out with ArcGIS to construct Tyson polygons coverage to divide the service coverage of each communication base station. Figure 5 shows that the service coverage of the communication base station constructed in this study is in good agreement with the scale of the residential land in terms of spatial scale. The mobile phone data are located by base stations, whose service radius is approximately 250–500 m. Therefore, the road network and various POI facilities are often overlapped by the service radius (Figure 6).

3.4. Application of the Methodological Framework

Based on the above method and preprocessed data, we established the OD relationship of the residents’ daily activities and the raster network. Then, we inferred the residents’ travel paths based on the raster network through the Gaode API, and we obtained the coverage of CLC by aggregating them. Finally, the frequency of residents’ activity travel within each grid obtained from the formulas based on the raster network.

4. Results

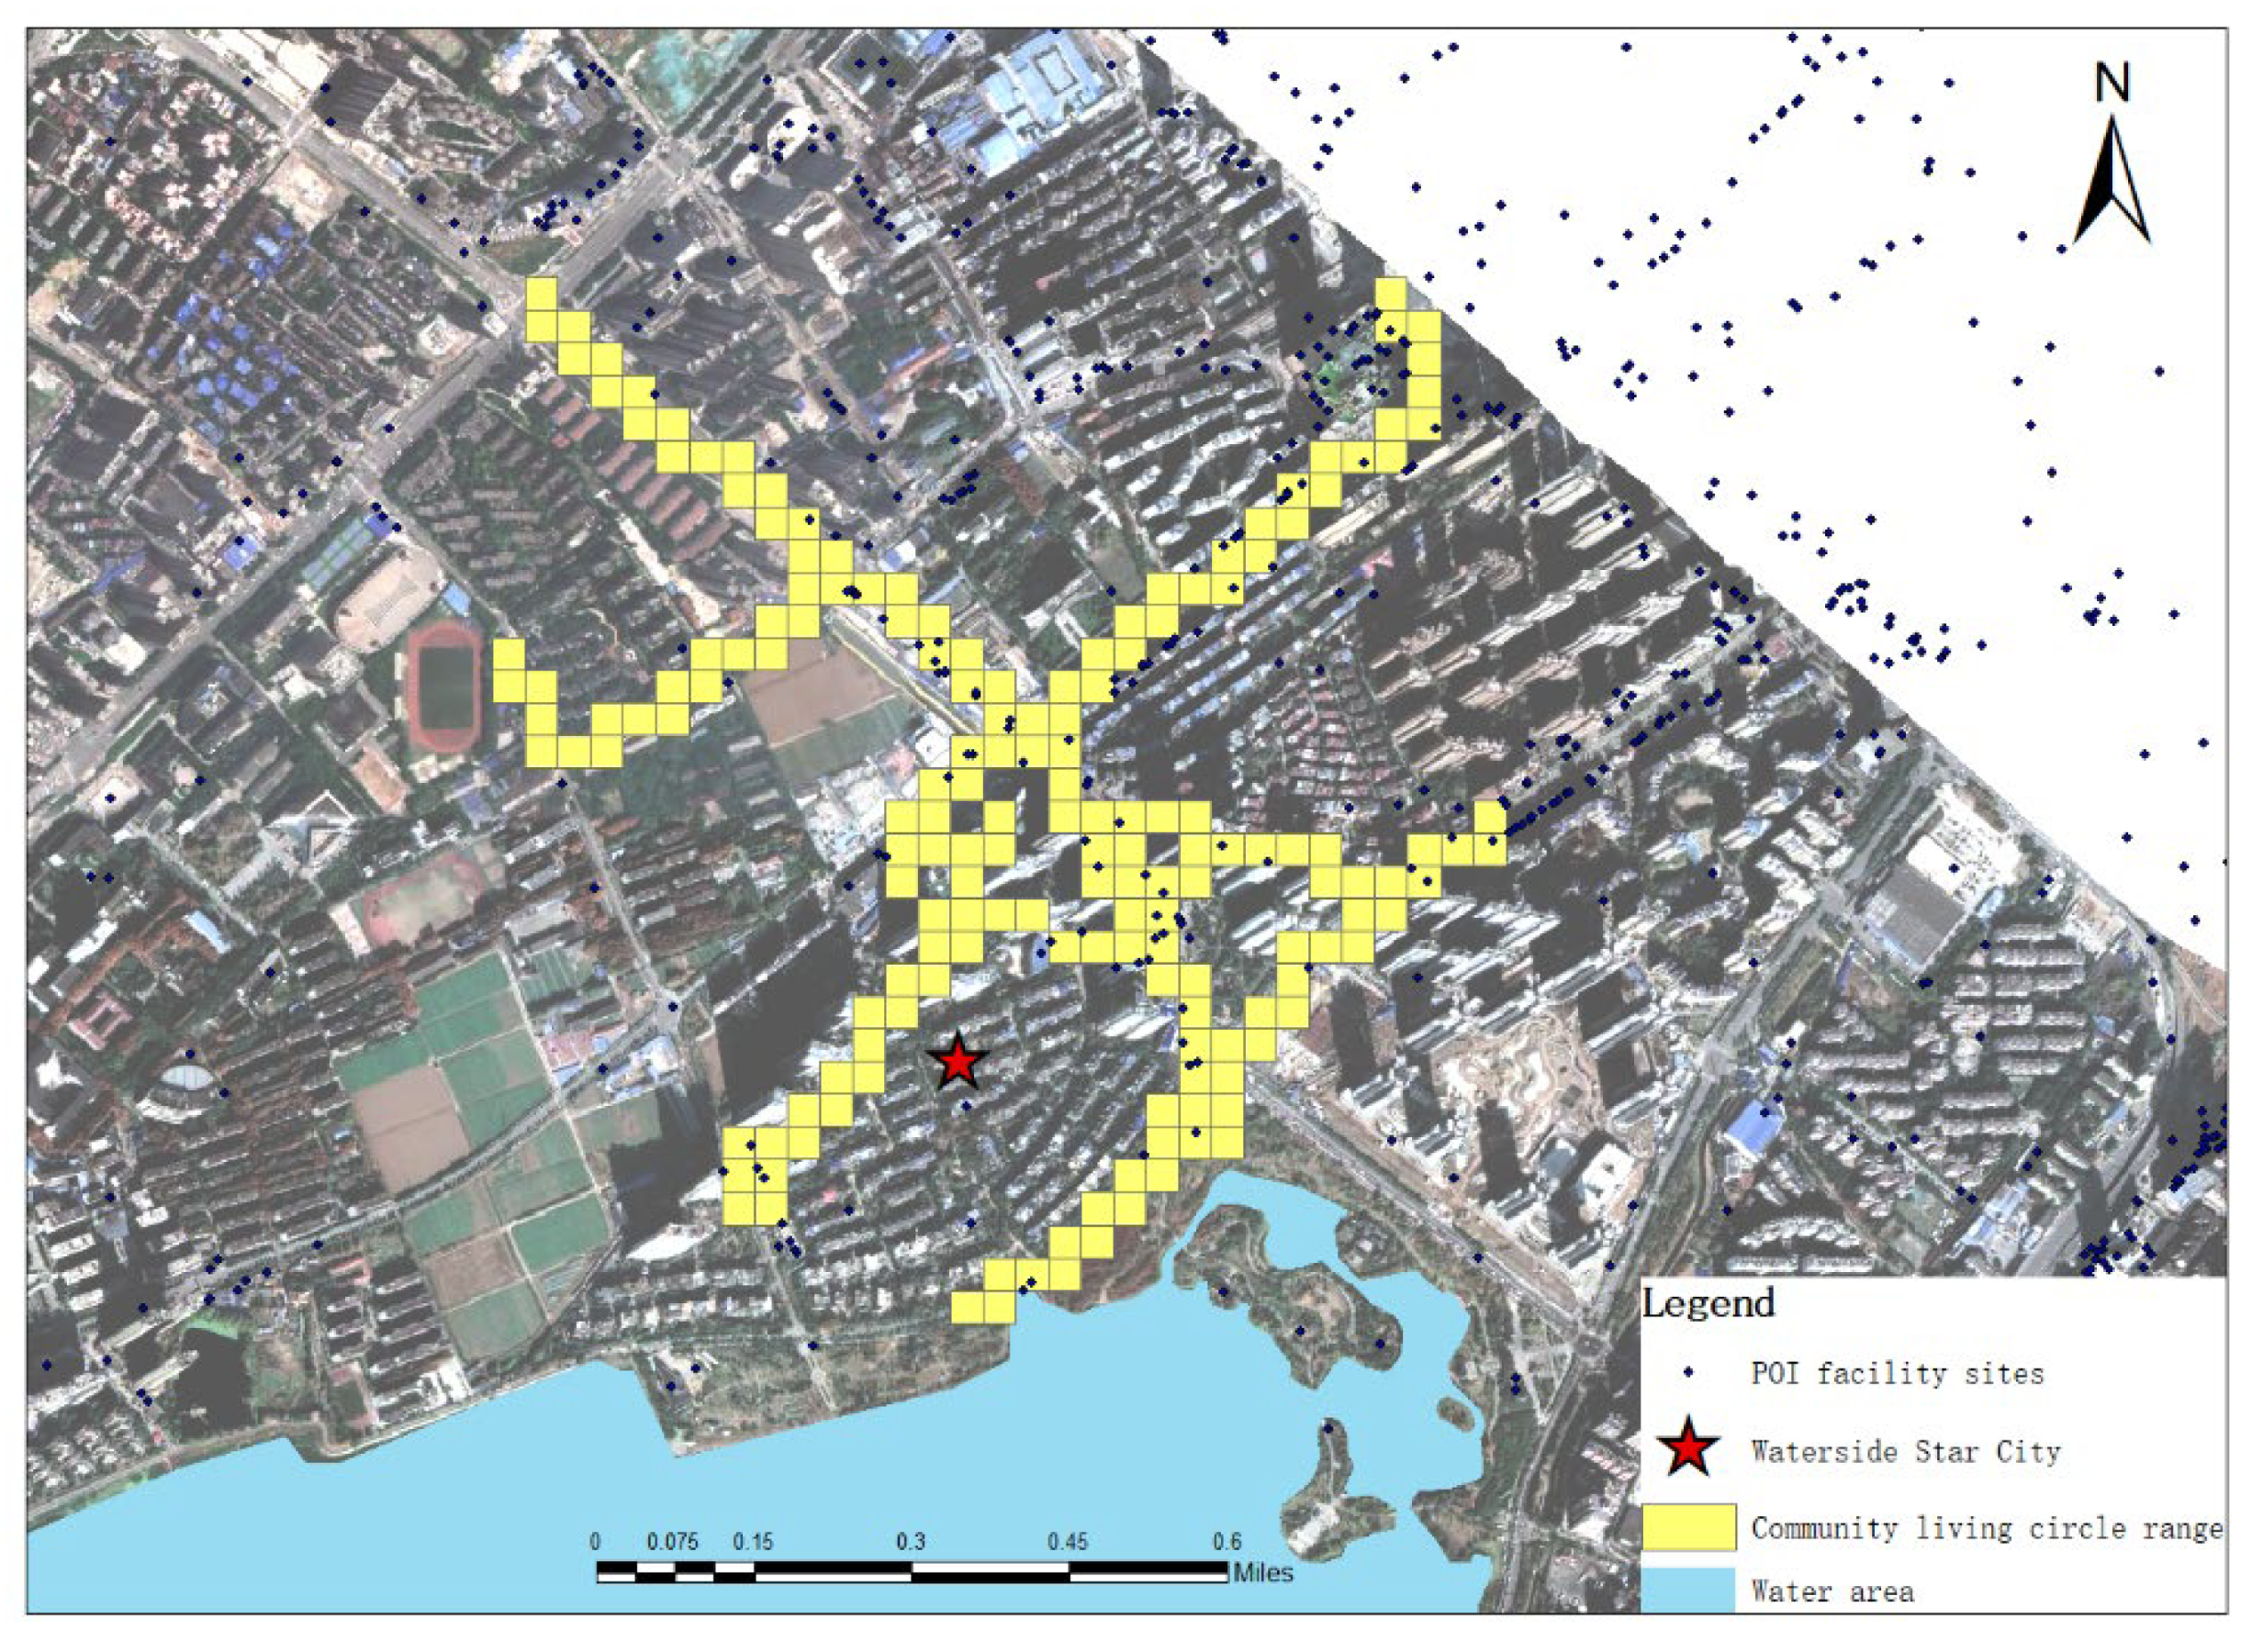
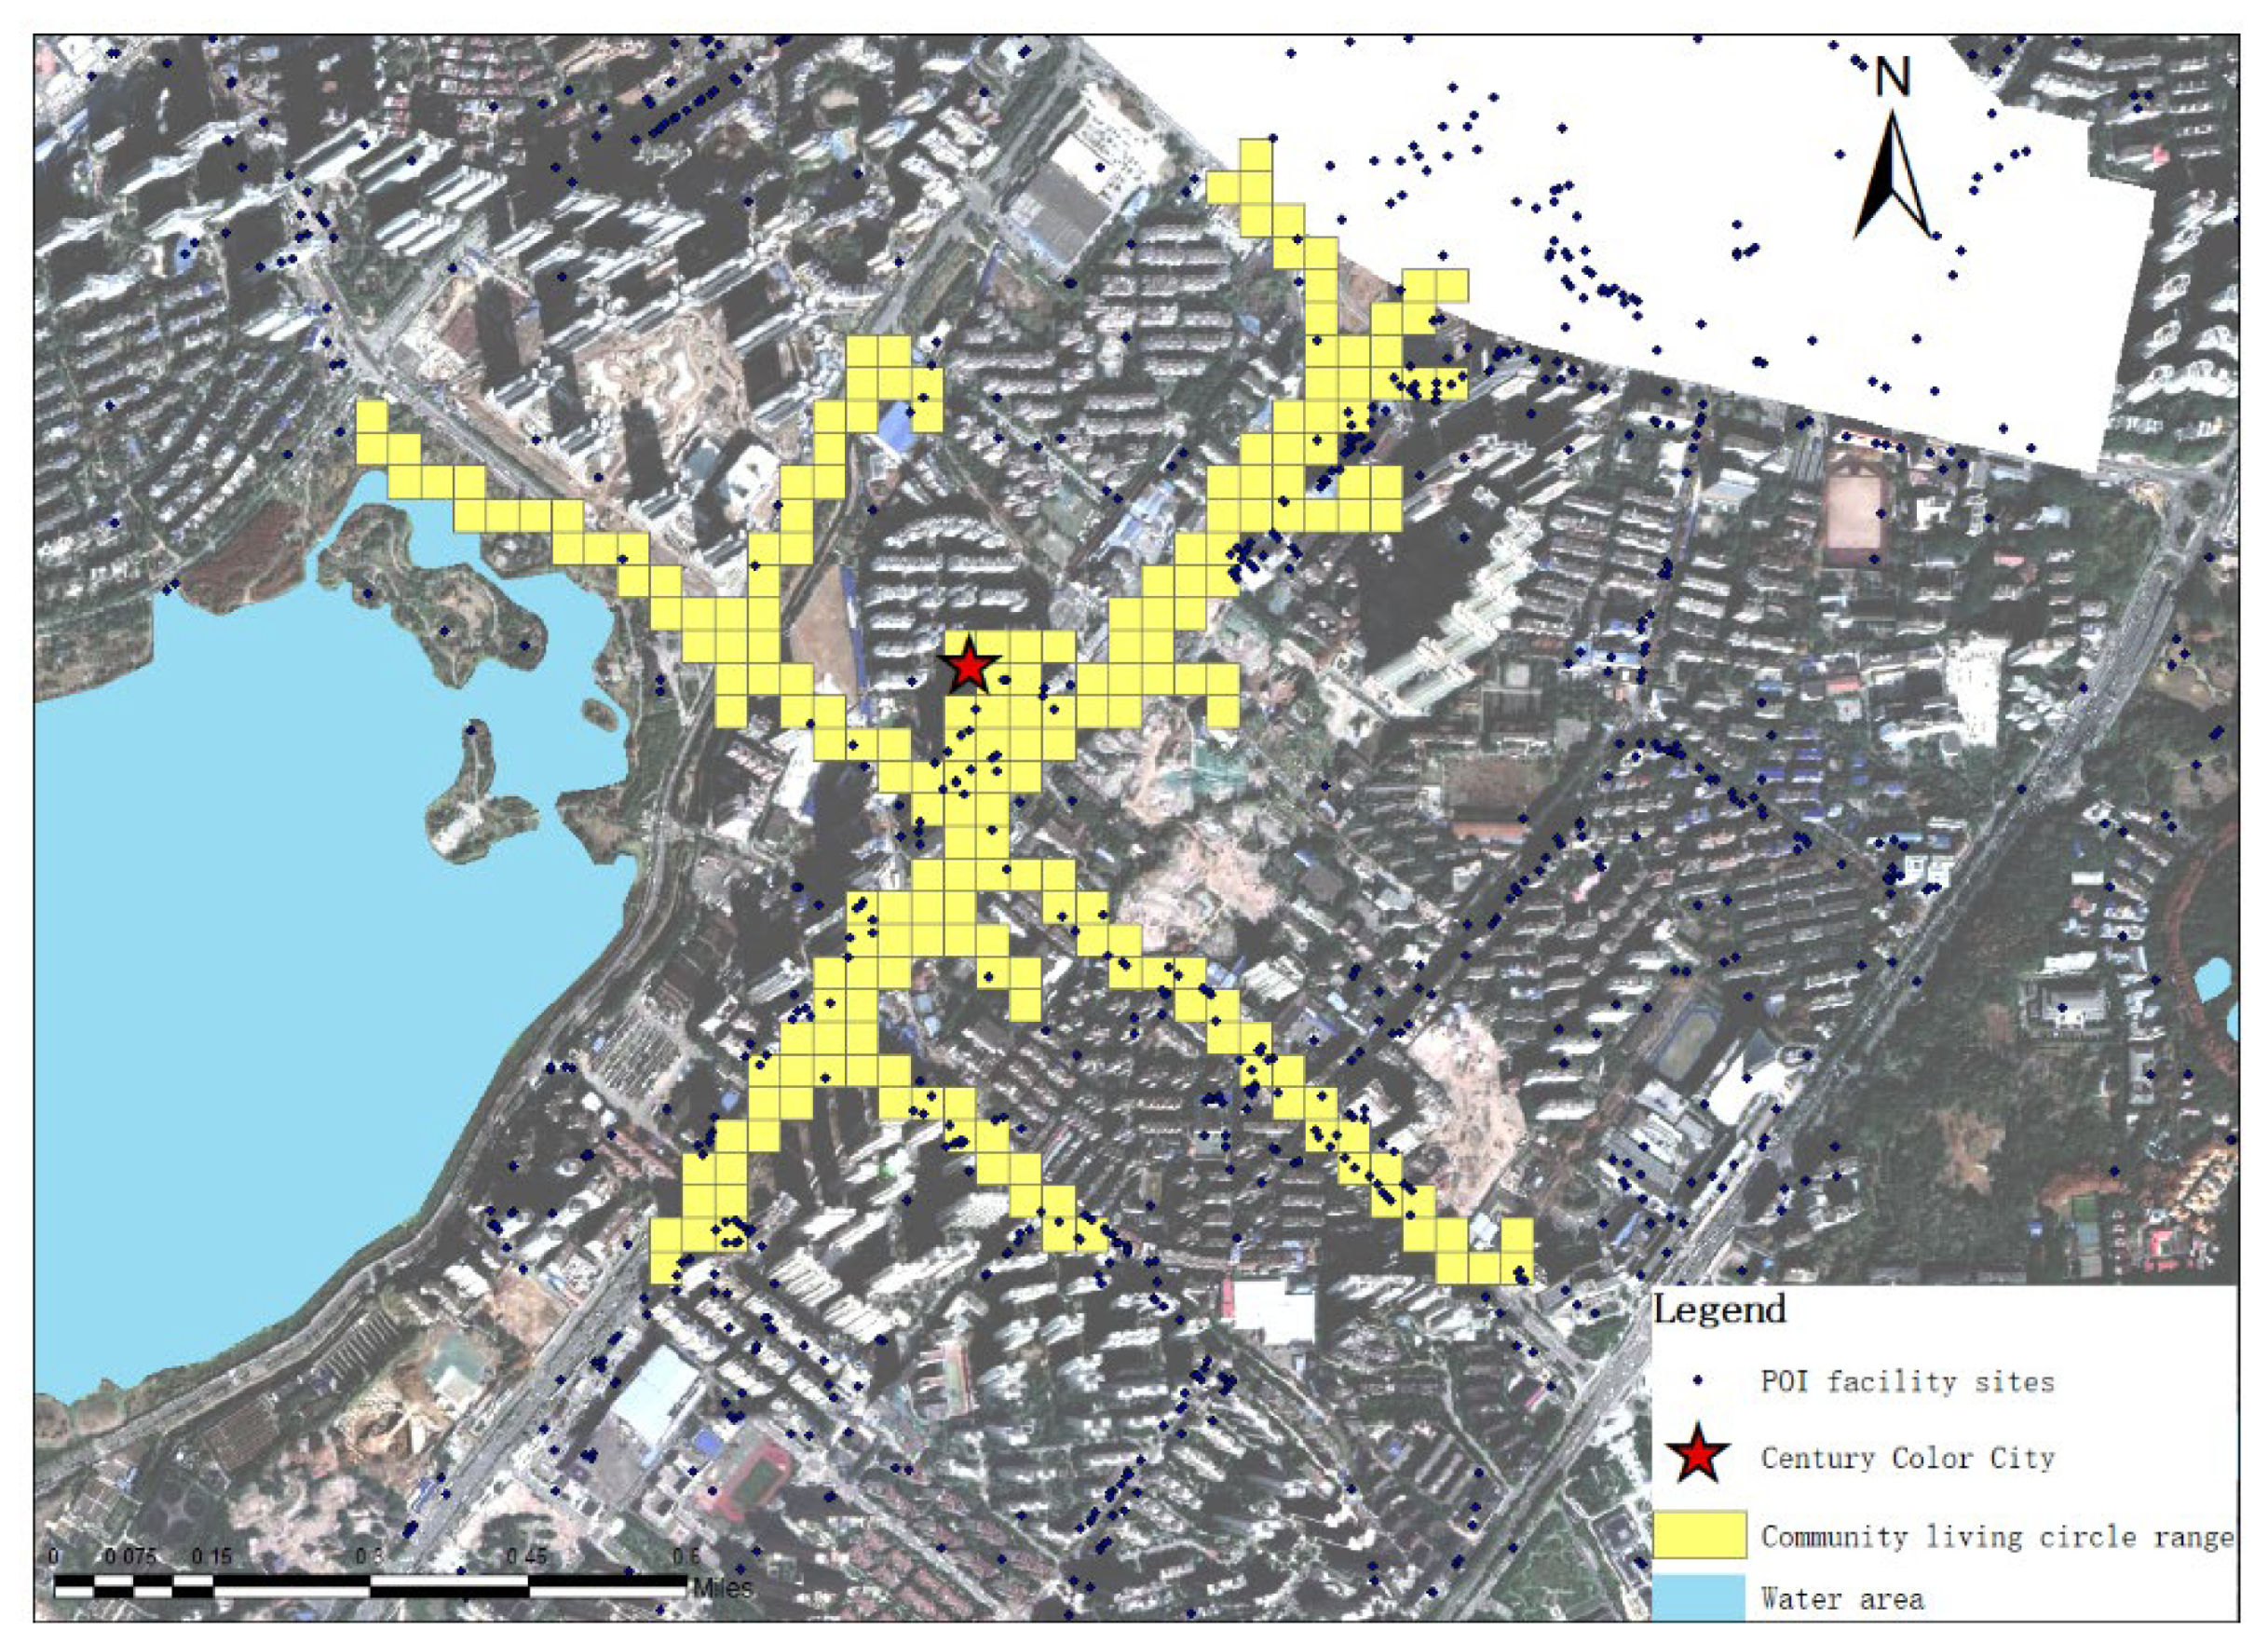
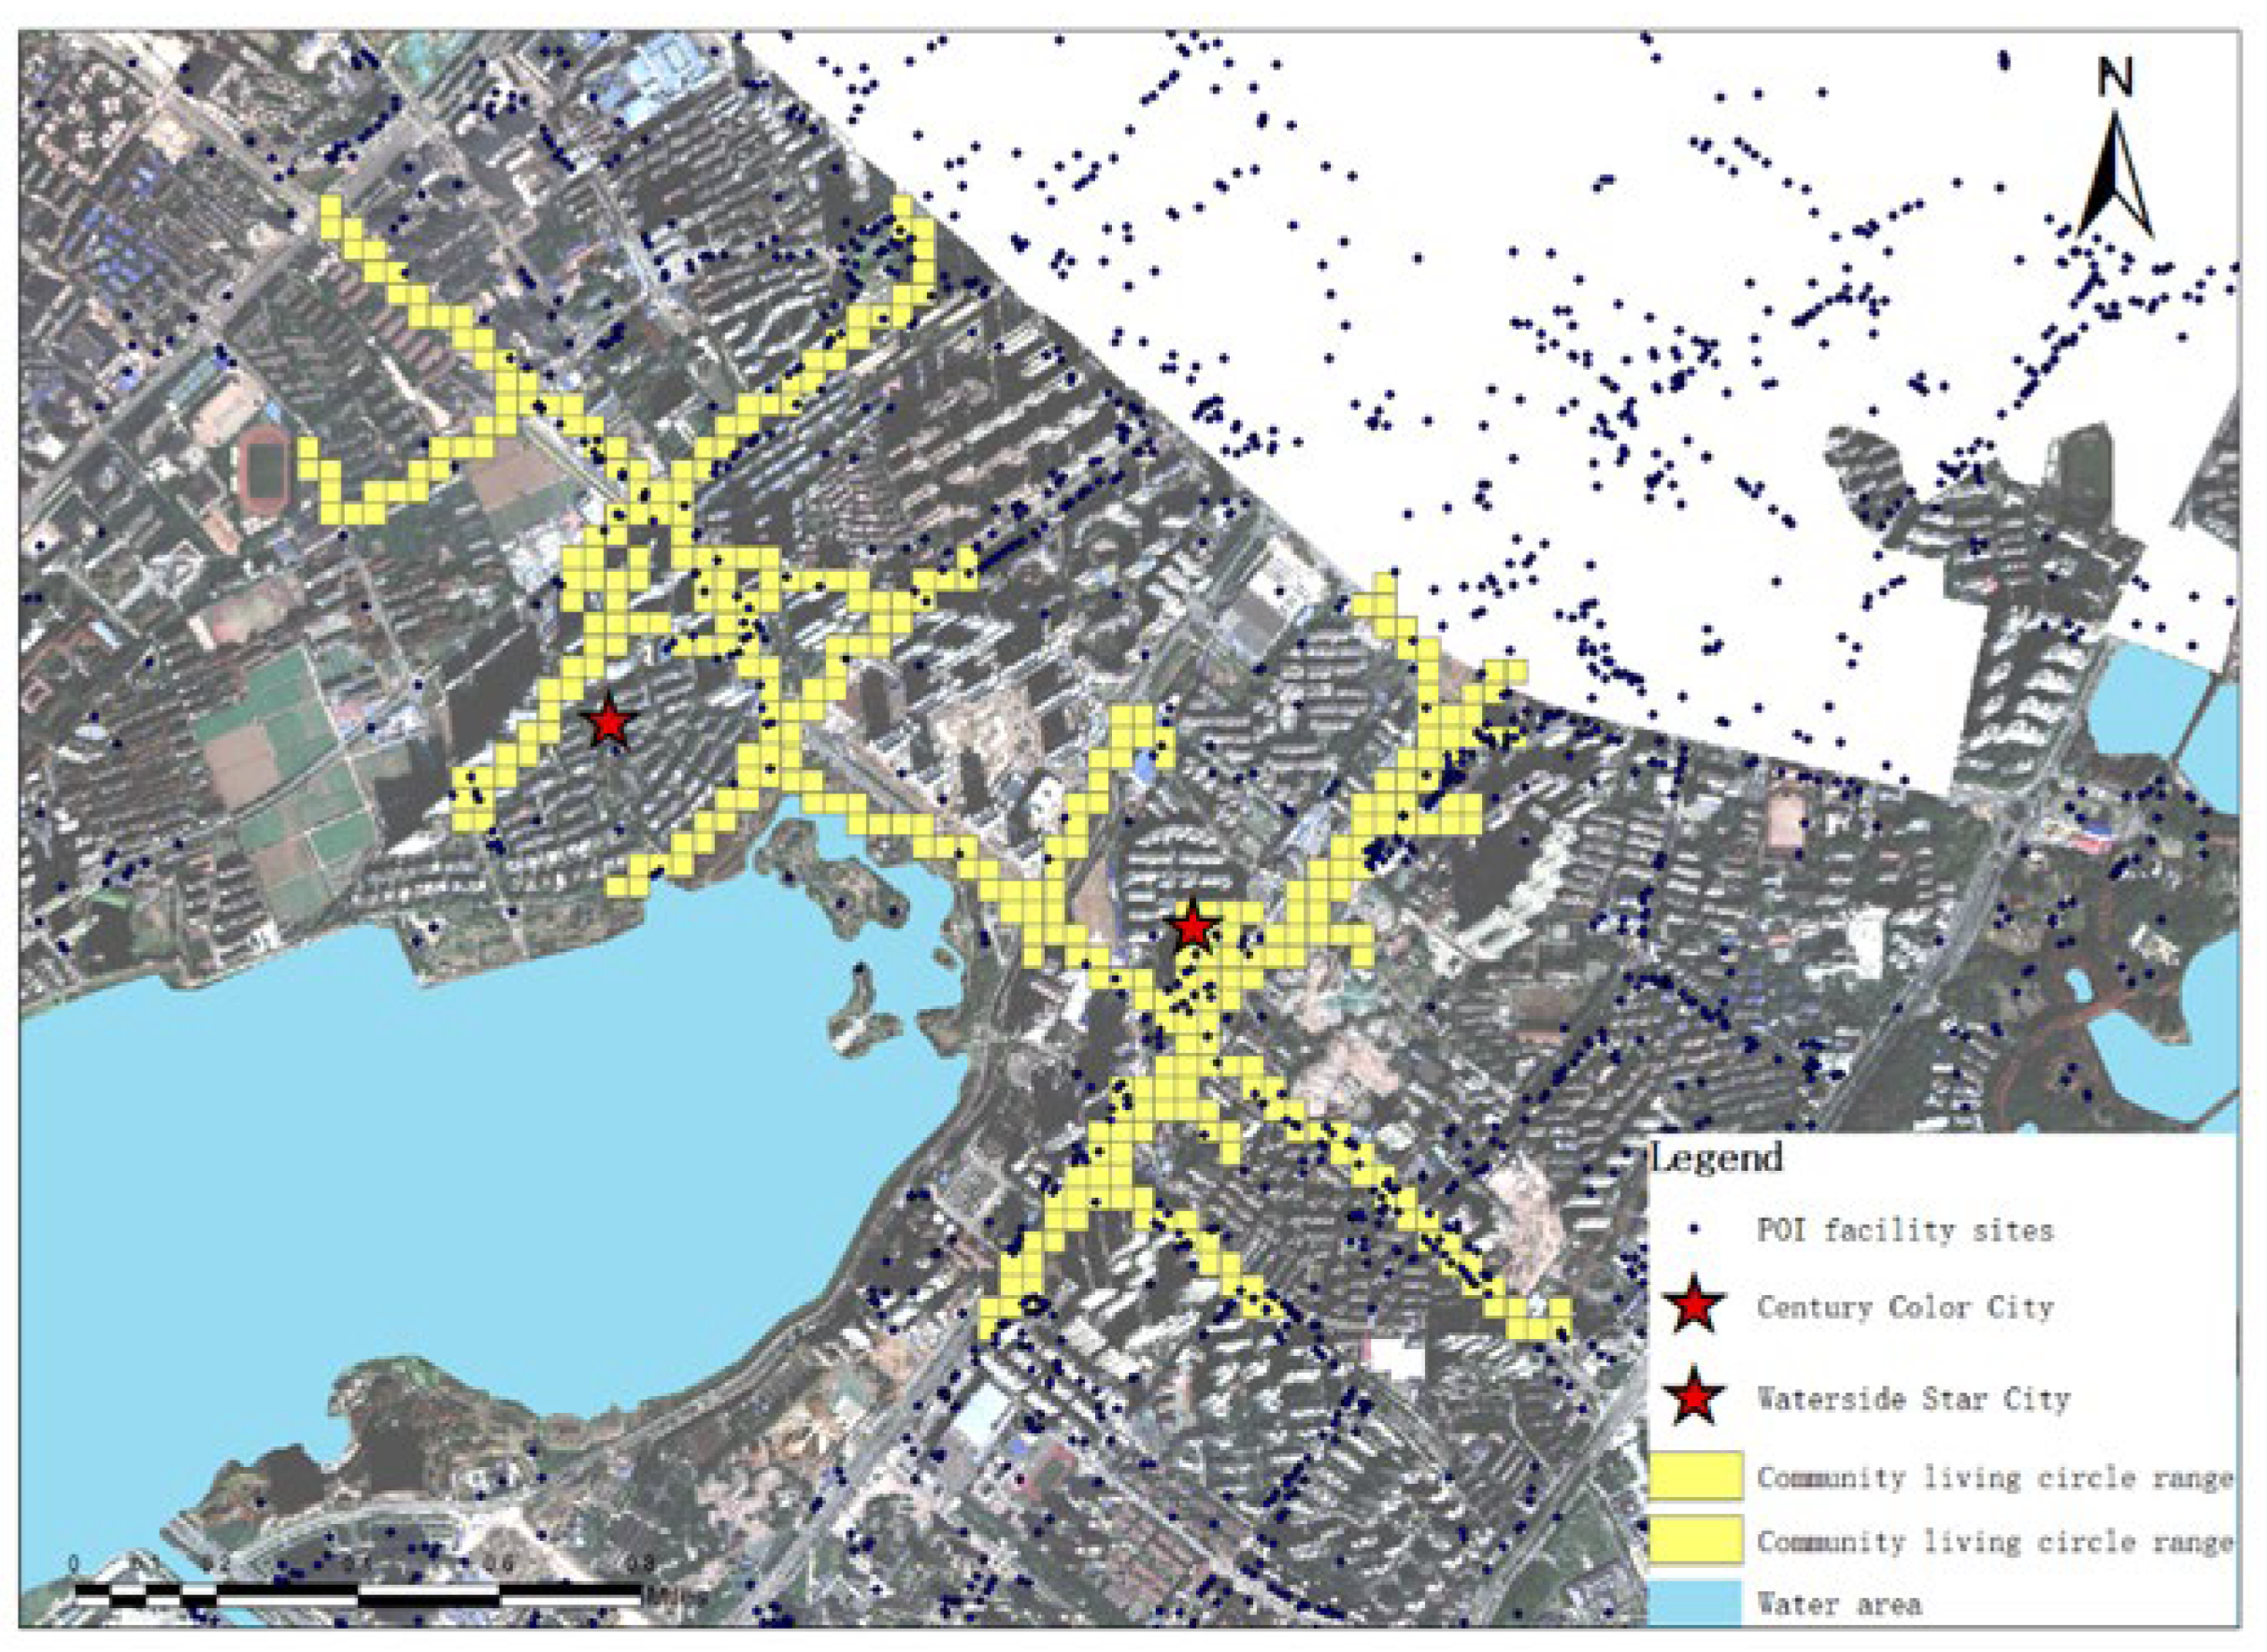
4.1. The Coverage of the CLCs

After screening during the residential time periods, a total of 1028 users in Waterside Star City and 4486 users in Century Color City were identified as residents of each experimental community. According to statistics, Century Color City ‘s buildings are aged and have a higher floor area ratio and lower housing prices, and the families living there have a typical structure in China with approximately two to three generations, or three to six persons per family. Therefore, even though the number of families in the two experimental areas is basically close, the total population of Century Color City is much larger than that of Waterside Star City. This proves that the number of residents identified through mobile phone data is reasonable and credible. After identifying 5514 residents in the experimental area, we screened their travel records to the nearby base stations during the activity period and finally obtained an average of 8283 valid travel records per day. After establishing the OD relationship of the daily activity of residents in the two communities, the travel paths of residents were obtained through the Gaode API. We finally obtained an average of 7,452 travel paths per day for residents within 15 min. Based on the established raster network, the residents’ paths within 15 min are superimposed to delineate the 15 min of CLC coverage of the two experimental communities. The results are shown in Figure 7 and Figure 8.
According to Figure 7 and Figure 8, first, the morphology of a CLC is not necessarily circular, nor is it a spatial form with full coverage, but it is the corridor space based on streets, connecting the neighborhood and the surrounding public service facilities. Although the spatial locations of Waterside Star City and Century City are similar, the specific coverage and shape of their CLCs are quite different. Given that the characteristics of their residential groups, the configuration of internal facilities, and the age of constructions are all different, these may possibly correspond to the current demographic difference between them.
At the same time, we found that their coverage of CLCs overlaps, as shown in Figure 9, which quantitatively proves that in a city, due to the shared space or facilities, part of the coverage of the adjacent CLC overlaps [11].

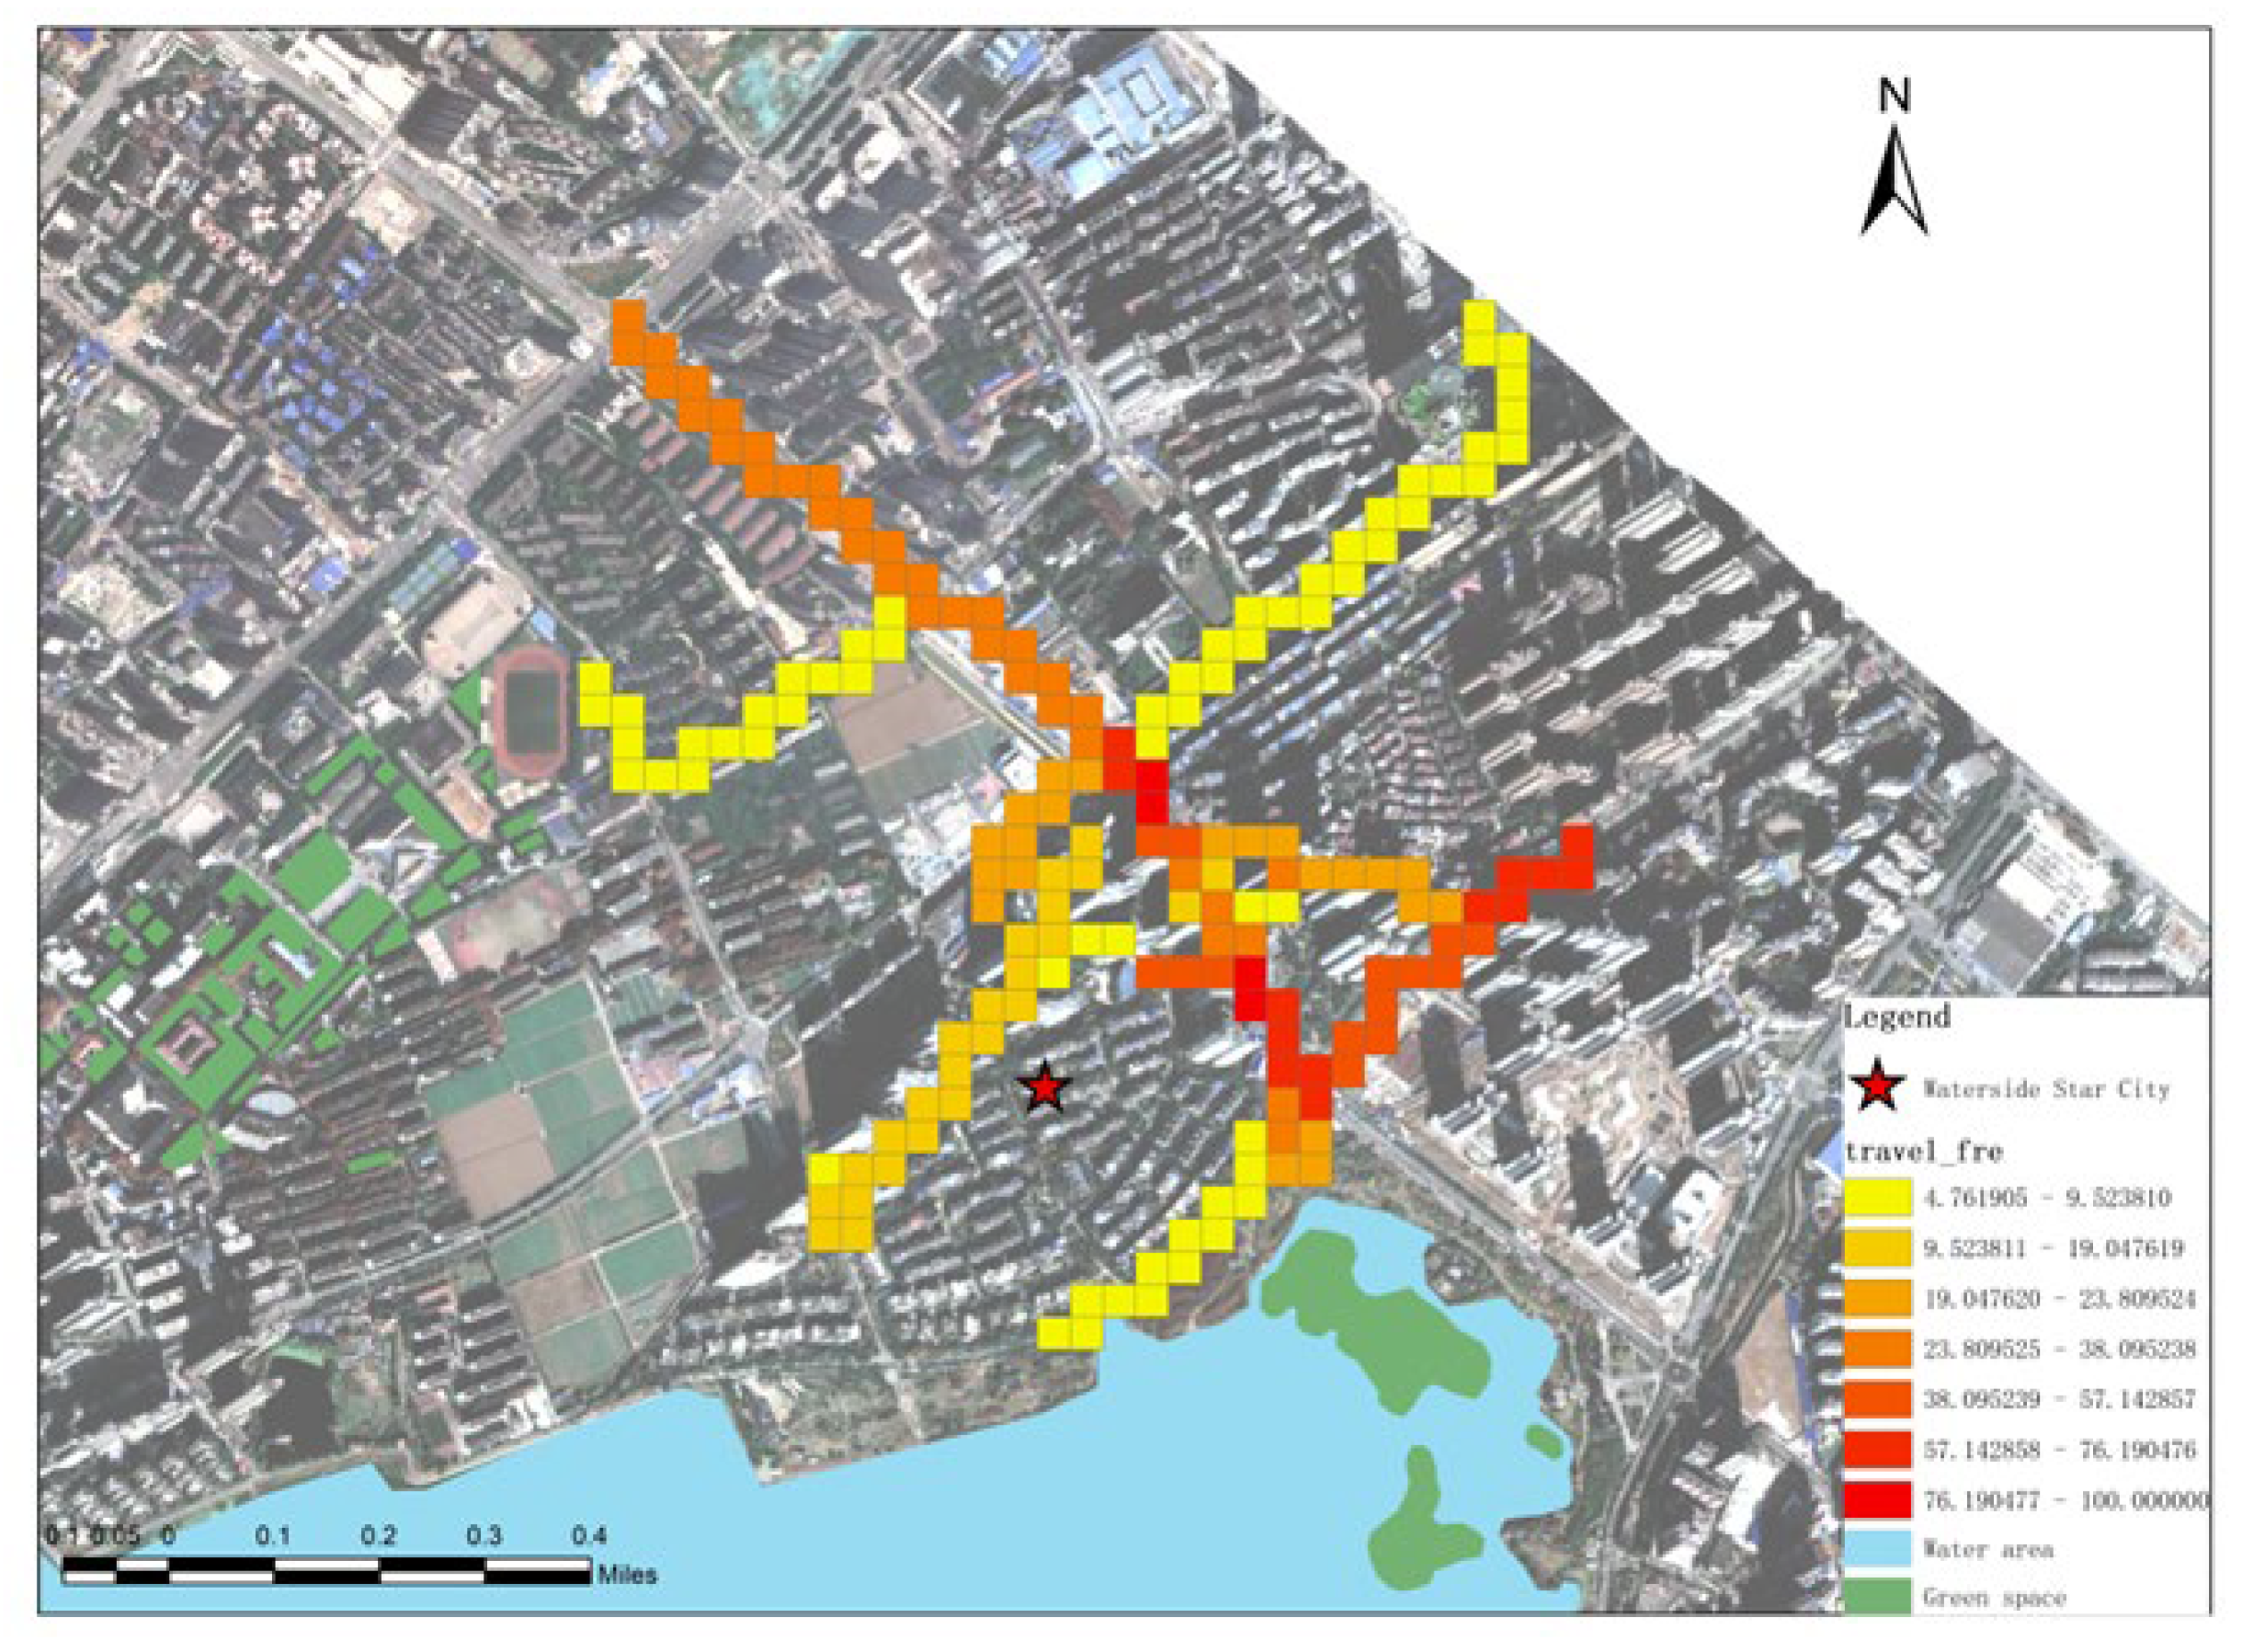
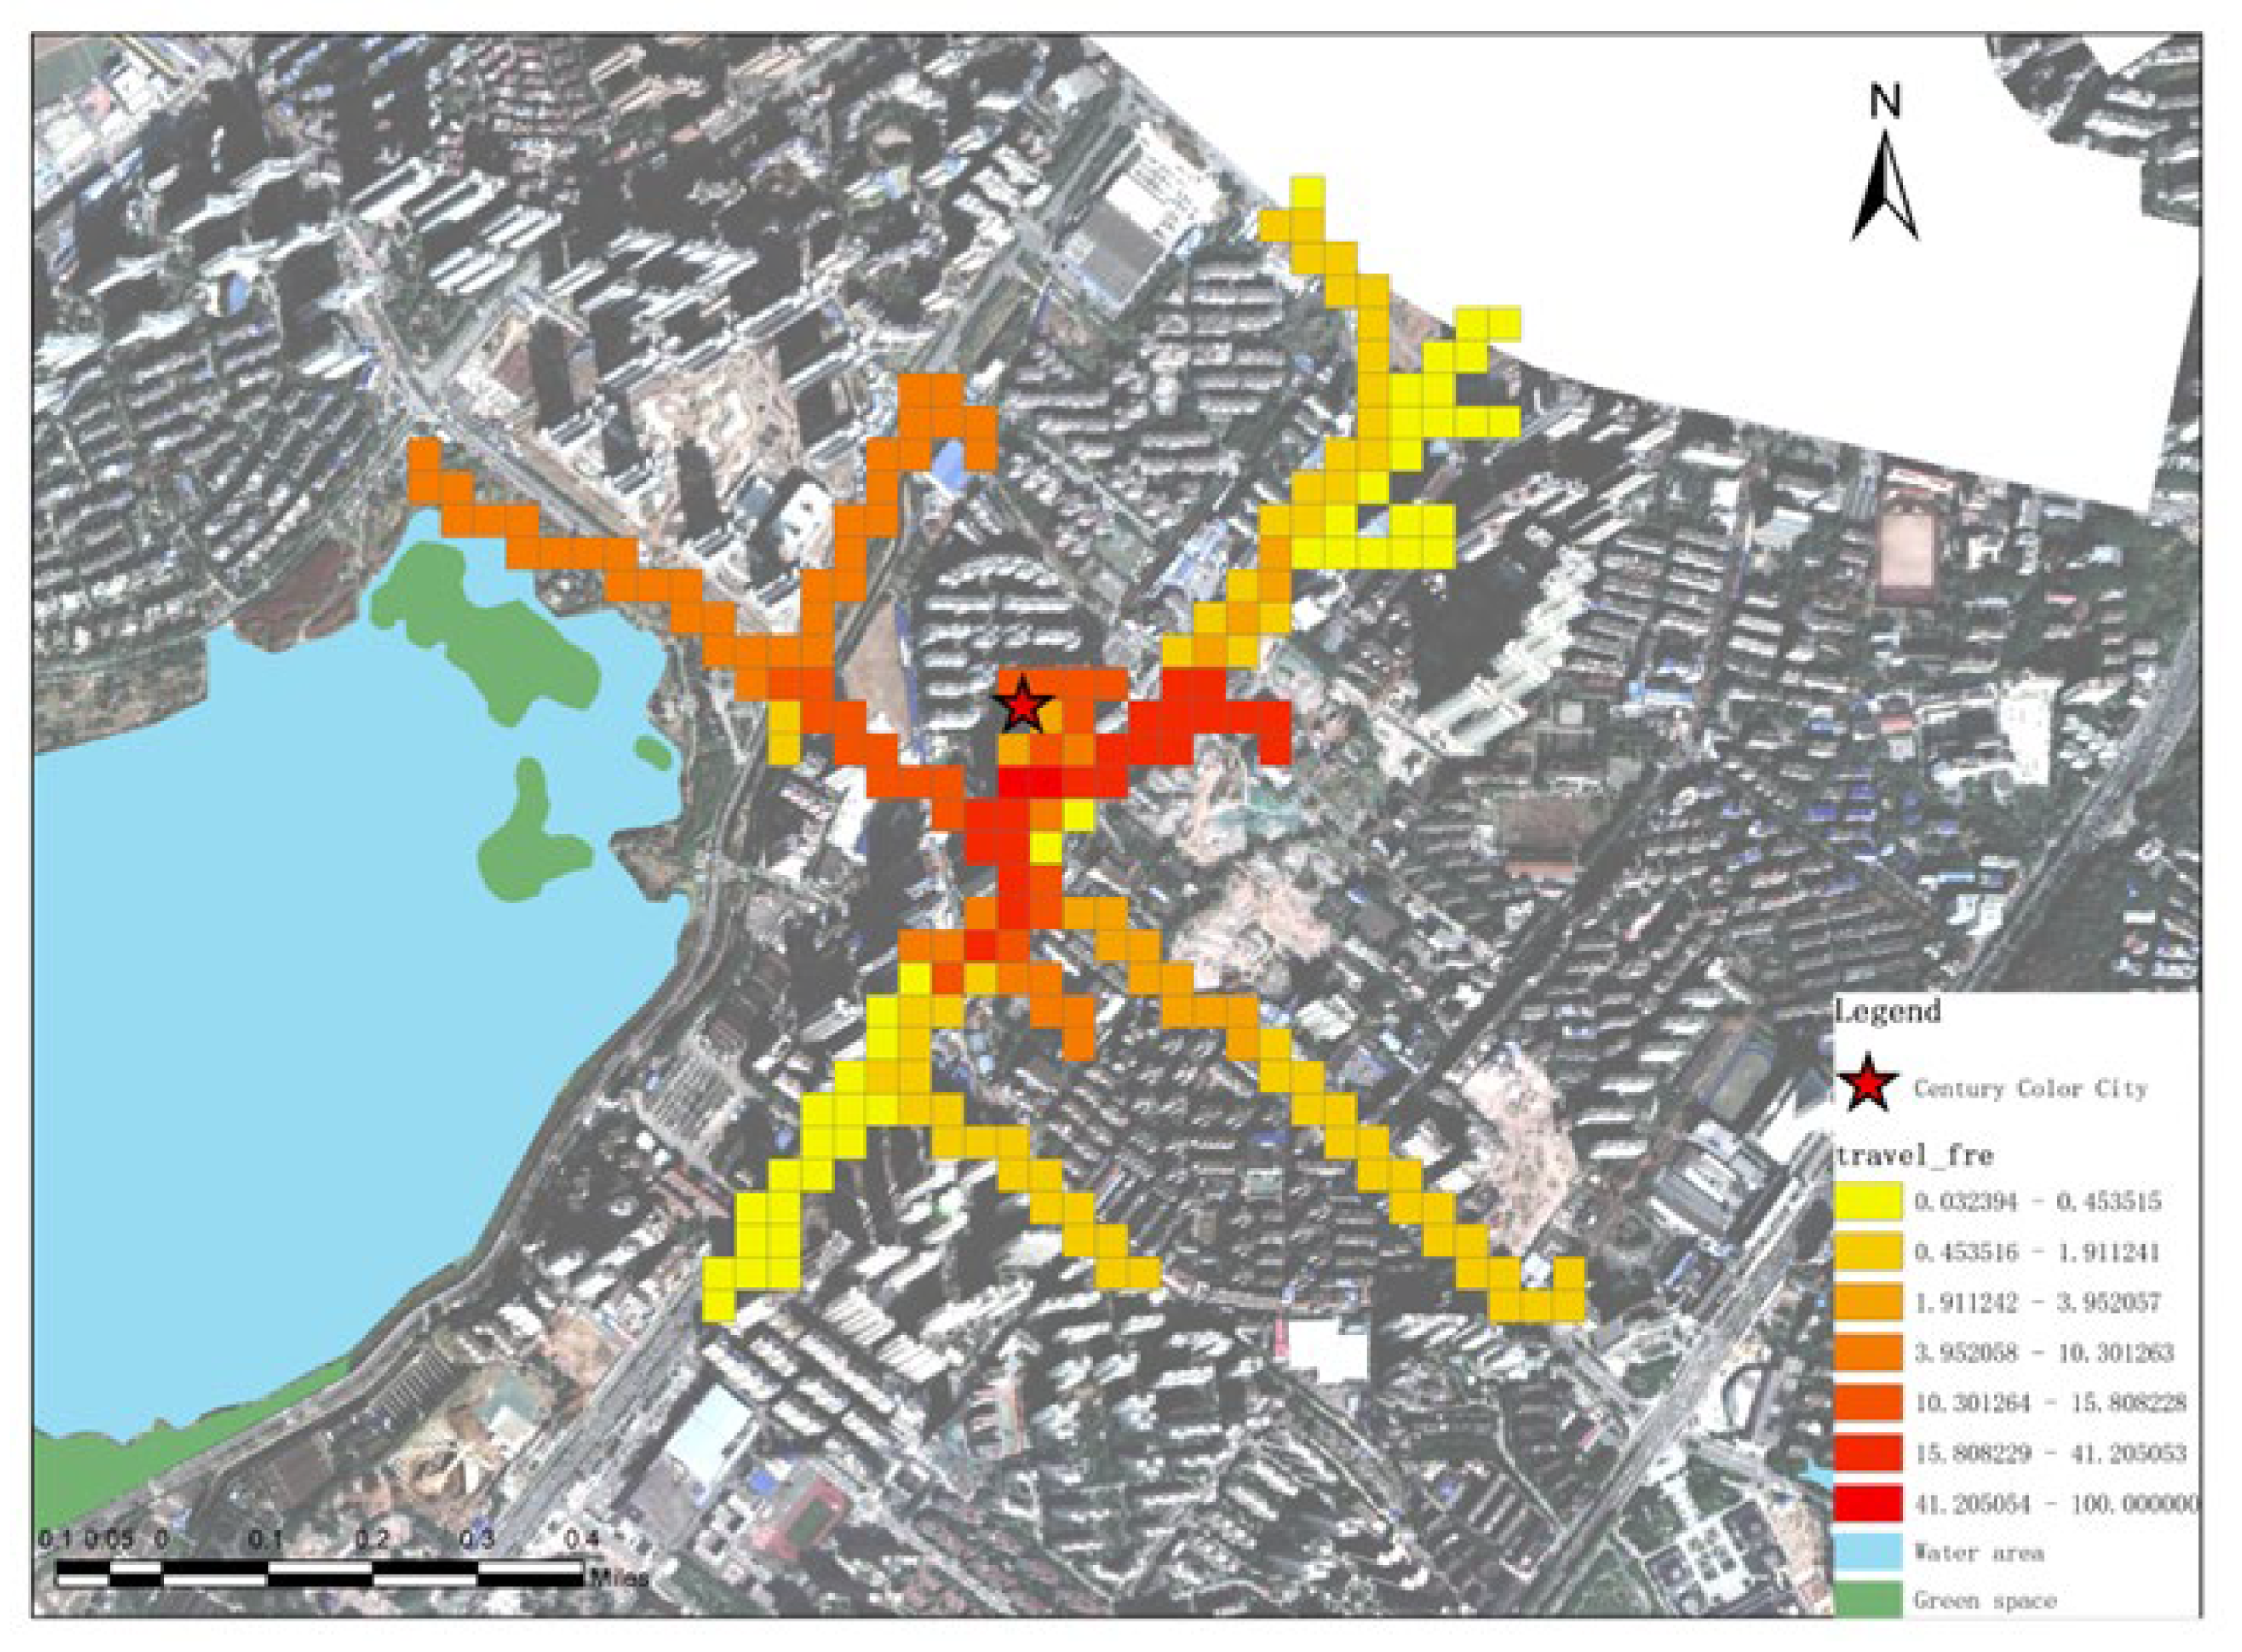
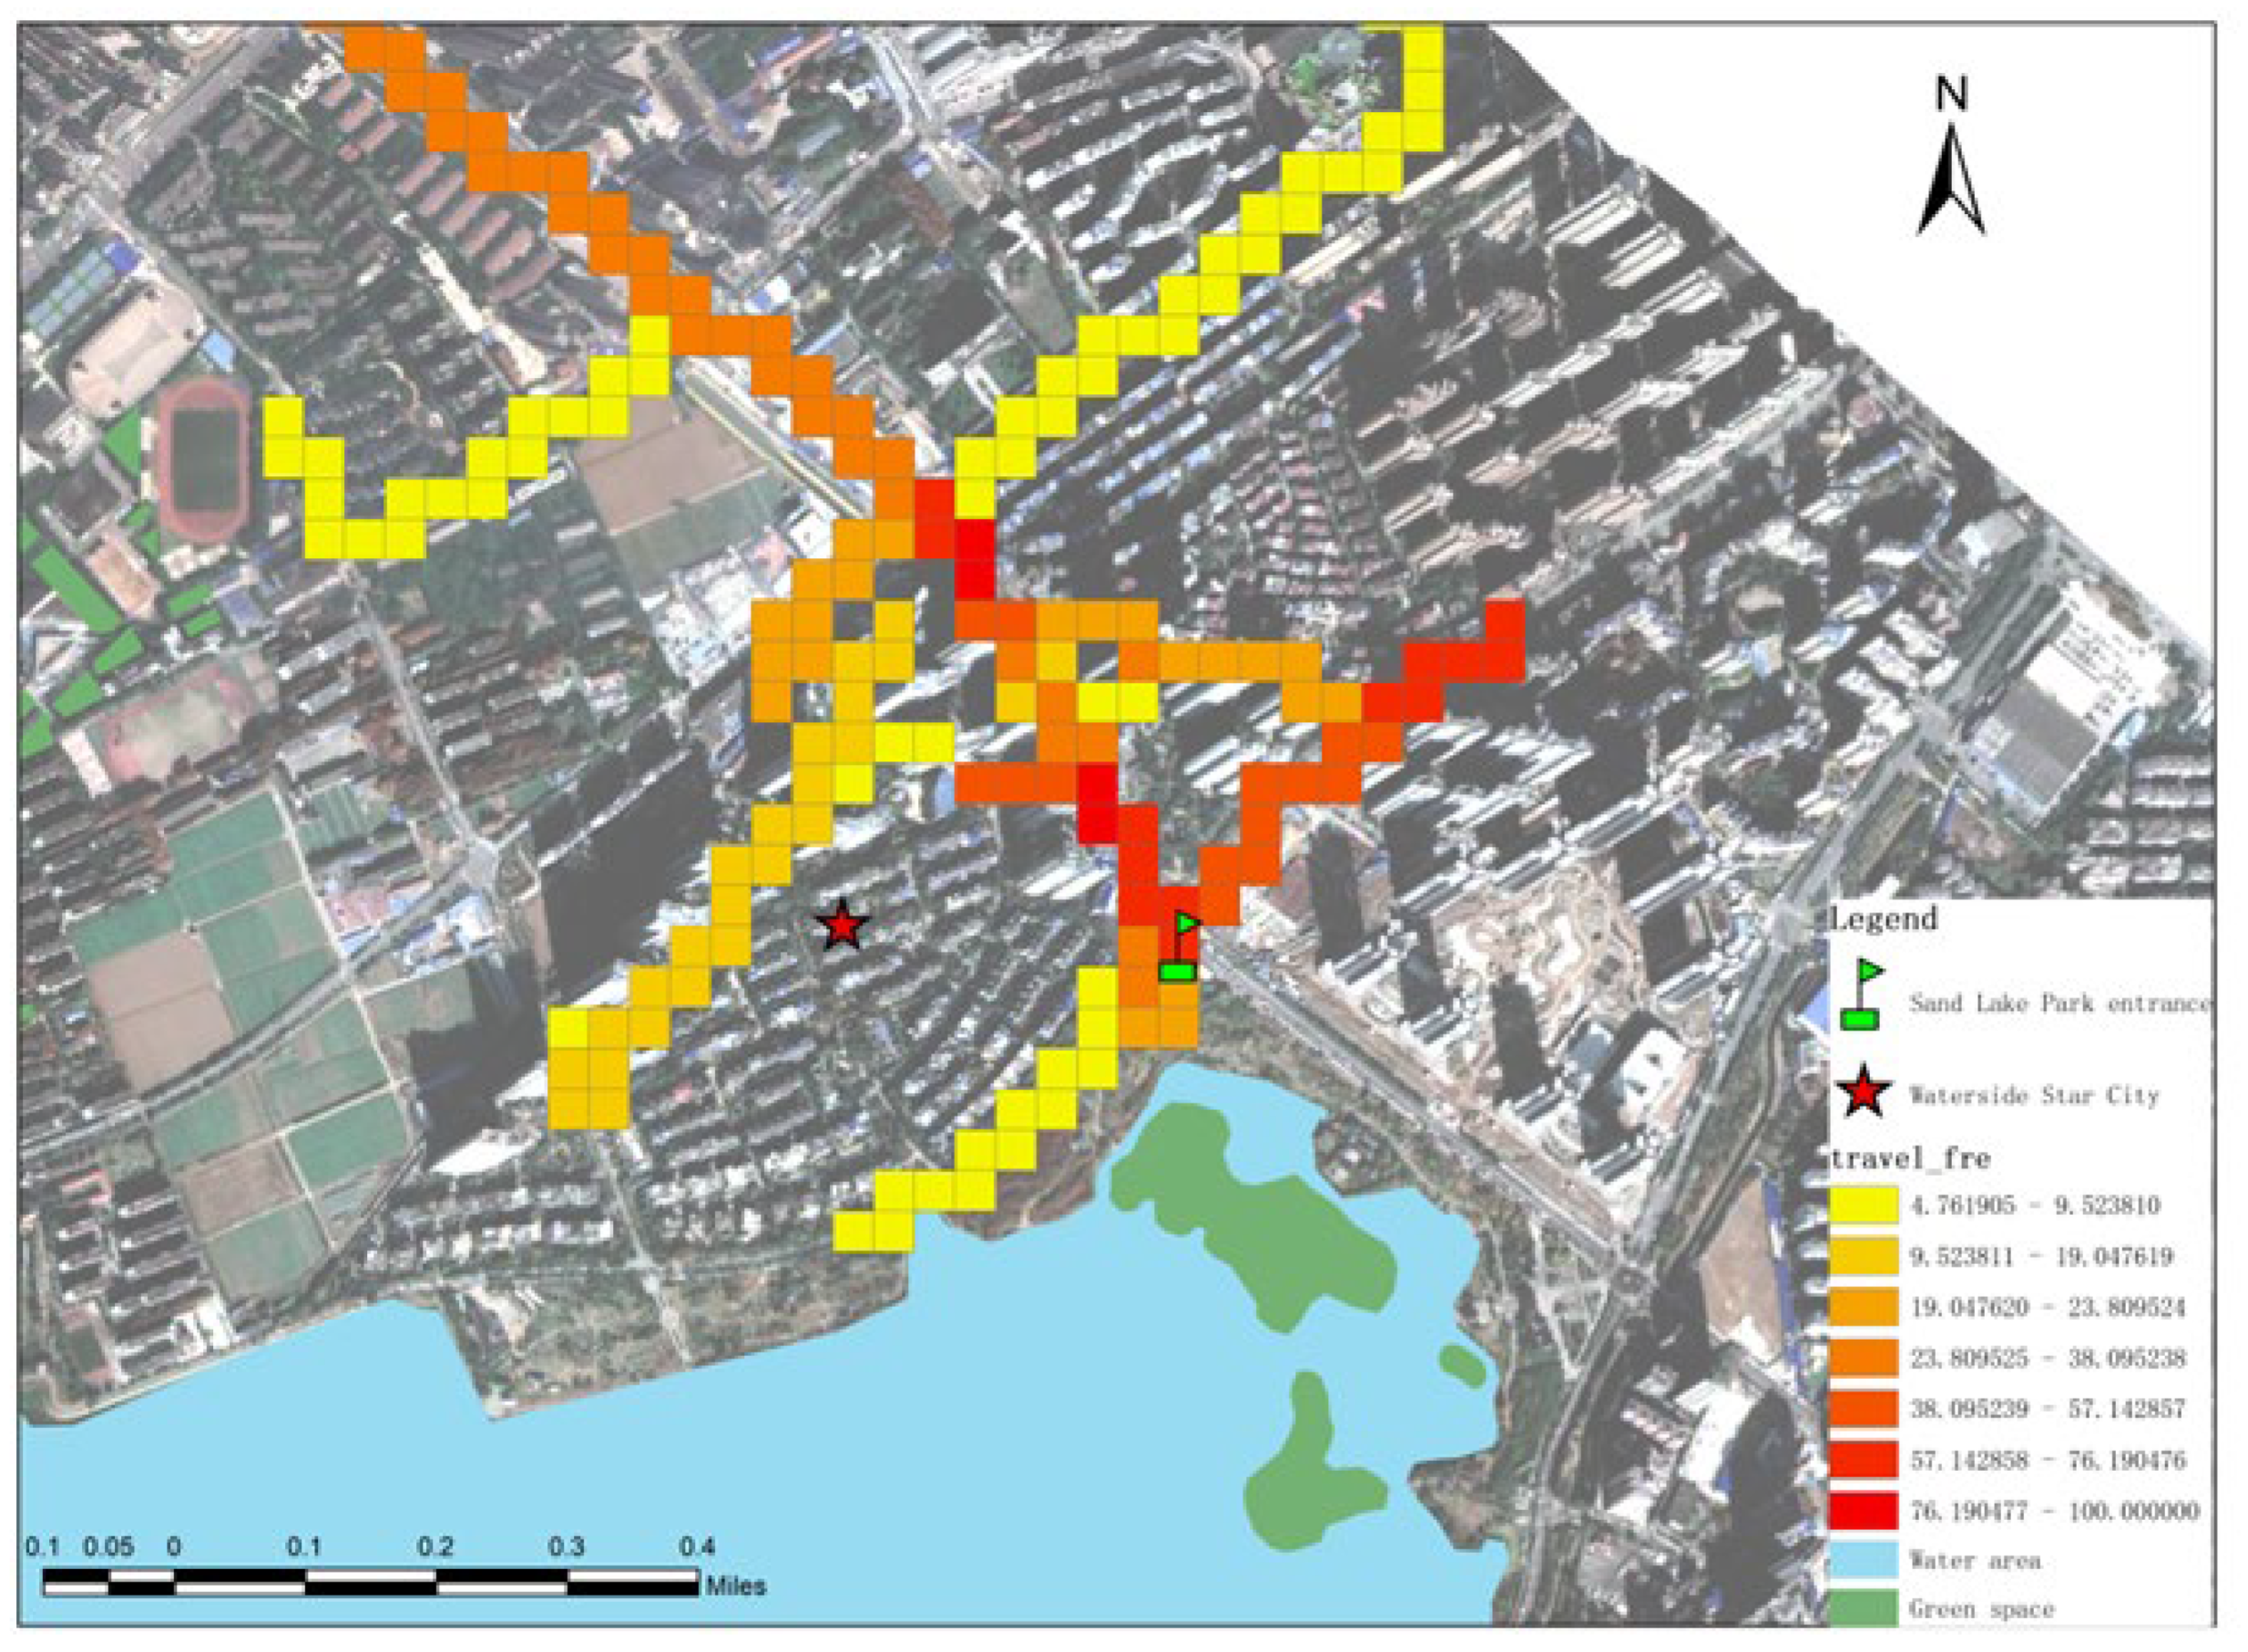
4.2. The Daily Travel Pattens of Residents

The residents’ travel pattens of the two experimental communities within CLC are obtained, as shown in Figure 10 and Figure 11.
According to the results of residents’ travel characteristics within 15 min-CLCs, it can be seen that CLC is not homogeneous, which may attribute to the influence of the residents’ daily travel activities. Moreover, its tendency to extend in different directions is not consistent, exhibiting spatial heterogeneity. For example, the 15 min-CLC of Waterside Star City has lower travel frequency in the southwest and higher travel frequency in the central and southeast, which is mainly influenced by the distribution location of important public service facilities such as shopping malls and the Sand lakes, i.e., they attract the spread of the 15 min-CLC, as shown in Figure 12.

5. Discussions

5.1. Community Life Circle Is Not a Homogeneous Circle

In previous research and practice of CLCs, CLCs were typically thought of as a series of homogeneous circles with different radii, however, this delineation method for CLC is overly simplistic and far away from the scope of real-life residents’ activities [11,12]. Scholars who have also delineated CLC based on GPS data of residents’ travel activities do not explicitly suggest the existence of corridor spaces, but the internal structure of the CLC they obtained also showed this phenomenon [5,8,11]. This coincides with what we have already found in our sample surveys. At the same time, according to the results of DMP method, CLCs are not geometric spaces with clear scope and mutual isolation, but rather, they are irregularly space extending along streets, connecting the neighborhood and the surrounding public service facilities with the corridor spaces. Hence, the finding and existence of the corridor spaces will improve the universal cognition of the CLC.
What’s more, the internal structure of the CLCs shows obvious differences and heterogeneity due to the influence of residents’ diverse demands or differences in physical space conditions. In addition, the trend of extension in each direction is not consistent, which may be attributed to the distribution of popular or scarce public service facilities, with anisotropy of spatial extension. Some scholars have suggested that residents’ travel trends are affected variously by diverse types of public service facilities, manifesting as heterogeneity in different directions [45,65,66]. This coincides with our quantitative results.

5.2. The Coverages of the Adjacent CLCs Are Shared

Based on the results of the quantitative measurement of the residents’ travel pattens of CLCs, it can be found that different CLCs share some facilities. Some scholars have found the phenomenon that different CLCs share some important facilities, such as the hospitals or schools [11,12]. However, these are only qualitative conclusions based on the physical space perspective and lack consideration of residents’ demands for various facilities from the spatio-temporal behavior perspective. From the perspective of residents’ travel patterns, this paper proposes that the types of facilities within the overlapping spaces of the CLC are more likely to be those that meet the basic daily demands of the residents, which can vary with different CLCs. This finding is likely to result from the local facilities configurations and residents’ travel activities pattens. To be specific, in the study, the types of the shared facilities are transportation station and finance service, which are the basic facilities to meet the residents’ daily demands, as shown in Figure 13. However, it is worth noting that unlike the important facilities, such as hospitals and leisure facilities proposed by previous scholars, these two types of facilities are more basic, which coincides with the finding proposed above.
In addition, we can find that this phenomenon of sharing only occurs in the external corridor spaces. During the sample surveys, we have found out that residents usually do not travel to other residents’ communities. This paper regards such “segregation” phenomenon as normal in China and not as an urban problem, such as social segregation. Different from the situation in the West, the communities in China tend to be walled compounds that can provide a safe and quiet environment and promote social interactions within the communities and a sense of belonging [67]. Therefore, the facility configuration in the public corridor space within the CLC should be given more attention in the subsequent CLC planning.

5.3. Residents’ Different Travel Tendencies for Different Types of Facilities

Taking Century Color City as an example (Figure 14), more transportation facilities, living service facilities, dining service facilities and leisure service facilities are often distributed near the grid with high frequency of residents’ trips within the CLC. However, there is also a “spatial mismatch ”phenomenon [68]. For example, in the northeast direction, there are more various service facilities distributed, but according to the experimental results, the residents of Century City of Color may be more likely to choose facilities nearby rather than those further away. Additionally, in the northwest direction, again due to the distribution of important facilities such as Sand Lake Park, residents travel more frequently, but there are fewer other facilities for services around them. In fact, the essence of this phenomenon is that residents have different travel tendencies facing different types of facilities, which is in line with residential travel practices in our real life. Residents tend to spend more time and other costs to travel to the scarcer public resources such as Sand Lake Park in this paper. In contrast, residents faced with common alternative daily facilities tend to choose facilities closer to them to meet their daily demands [69].

5.4. Applicability of the DMP Method

Owing to the generally available and easily accessible data, and the high density of communication base stations in most large Chinese cities, this method has potential in applying to other large Chinese cities and communities. However, due to the low density of communication base stations in suburban areas and small towns, it is difficult to provide sufficiently fine mobile phone data. Moreover, the spatial configurations and the demands of residents in rural areas are different from those in urban areas. Therefore, the DMP method proposed in this paper is only applicable to densely populated large cities, which are the most common cities for CLC planning practice. Moreover, when applied to different communities in different large cities, the residential time periods and POI weighting model in the method should be adjusted accordingly, taking into account the residents’ daily travel patterns and preferences, so as to ensure the rational and validity of the results.

5.5. Limitations and the Future Work

There are several limitations in the current study: first, due to the unavailability of the area of interest (AOI)data, the scope of these CLC is more similar to its skeleton. Therefore, we consider adding AOI data in the subsequent study to obtain a more realistic CLC. Second, the time periods we selected for residential activities and the weights defined for the POI may not be applicable to all city residents owing to different individual preferences. Hence, the sample surveys data are needed for supplementation and correction in subsequent widespread generalization and application. Third, the current study area is relatively small. The parameters and weights in the method should be adjusted according to the sample surveys for the new communities. It is considered that the family structures, socioeconomic conditions, and facility configurations of the two communities are common in large Chinese cities, therefore, the findings from this study can still be representative and referable for other large Chinese cities.
To sum up, in the future, we plan to enrich and improve the proposed DMP method, and expand it to a larger spatial scale, so as to evaluate the current performance of the CLC more accurately and efficiently, to optimize the configuration of public service facilities in CLC, and to better provide scientific support for the CLC planning.

6. Conclusions

Based on mobile phone data and POI data, this paper proposed a quantitative and easily generalizable method to delineate the CLC. The results of the CLC delineation in experimental range in Wuhan City demonstrated the effectiveness and applicability of the method. The results indicate that: (1) the CLC is not a homogeneous circle, but it is the corridor space based on streets, connecting the neighborhood and the sur-rounding public service facilities. At the same time, we can see that the daily travel activities of residents within the CLC are strongly related to the configuration of public service facilities. This will have a great impact on the coverage and internal structure of the CLC. Therefore, we suggest that the CLC-related measurement or evaluation and the subsequent planning should be data-based and people-oriented in general. In other words, it is important to focus on the residents’ perspective and include their activity travel patterns in the research and planning practices related to the CLC. (2) Due to the shared space or facilities, part of the coverage of the adjacent CLCs overlaps. Based on this phenomenon, we suggest that there should be sufficient space preserved for subsequent service facilities configuration in the overlapping region of the CLCs. Additionally, the segregation between neighborhoods should be considered in the subsequent planning. Whether public service facilities should be arranged in common areas, thus avoiding resource wastage, or segregation should be weakened through the configuration adjustment of important facilities, still needs further discussion. In addition, based on the results of resident travel characteristics obtained from the DMP method, we found a spatial mismatch phenomenon between residents’ activities and POI facilities configuration [68]. Whether this is due to an unreasonable configuration of facilities still needs to be determined by larger-scale CLCs delineation in a subsequent study.
The proposed CLC delineation method is novel in several aspects. First, it combines the residential travel activities and physical space conditions to reflect the travel pattens of residents. Second, it strikes the balance between the accuracy and easy generalization of the CLC delineation. Third, it fills the gap in the understanding of the CLC in the large cities of China. It is more fine-grained and highly generalizable at the individual community scale, allowing for the development of locally specific policy and planning recommendation that avoid promoting policy implementation of the CLC at the expense of sustainability and support the improvement of facility configuration at a more fine-grained scale.

Author Contributions

Conceptualization, Hongzan Jiao; methodology, Hongzan Jiao and Miaomiao Xiao; software, Miaomiao Xiao; validation, Hongzan Jiao and Miaomiao Xiao; formal analysis, Miaomiao Xiao; investigation, Hongzan Jiao; resources, Hongzan Jiao; data curation, Miaomiao Xiao; writing—original draft preparation, Miaomiao Xiao; writing—review and editing, Hongzan Jiao and Miaomiao Xiao; visualization, Miaomiao Xiao; supervision, Hongzan Jiao; project administration, Hongzan Jiao; funding acquisition, Hongzan Jiao All authors have read and agreed to the published version of the manuscript.

Funding

This research was funded by the National Key Research and Development Program (2020YFC1512002)”, the National Natural Science Foundation of China Major Program (Grant Nos. 42192580 and 42192583) and Spatial Layout Plan project of Modern Logistics in Wuhan (2022–2035).

Conflicts of Interest

The authors declare that there is no conflict of interest.

References

  1. Burton, C.G. A Validation of Metrics for Community Resilience to Natural Hazards and Disasters Using the Recovery from Hurricane Katrina as a Case Study. Ann. Assoc. Am. Geogr. 2015, 105, 67–86. [Google Scholar] [CrossRef]
  2. Gilmore, B.; Ndejjo, R.; Tchetchia, A.; de Claro, V.; Mago, E.; Diallo, A.A.; Lopes, C.; Bhattacharyya, S. Community Engagement for COVID-19 Prevention and Control: A Rapid Evidence Synthesis. BMJ Glob. Health 2020, 5, e003188. [Google Scholar] [CrossRef] [PubMed]
  3. Lee, T.H. Influence Analysis of Community Resident Support for Sustainable Tourism Development. Tour. Manag. 2013, 34, 37–46. [Google Scholar] [CrossRef]
  4. Zuo, J.; Meng, L.; Li, C.; Zhang, H.; Zeng, Y.; Dong, J. Construction of Community Life Circle Database Based on High-Resolution Remote Sensing Technology and Multi-Source Data Fusion. Eur. J. Remote Sens. 2021, 54, 222–237. [Google Scholar] [CrossRef]
  5. Li, C.; Xia, W.; Chai, Y. Delineation of an Urban Community Life Circle Based on a Machine-Learning Estimation of Spatiotemporal Behavioral Demand. Chin. Geogr. Sci. 2021, 31, 27–40. [Google Scholar] [CrossRef]
  6. Befu, H. Lives in Motion: Composing Circles of Self and Community in Japan. J. Jpn. Stud. 2001, 27, 477–481. [Google Scholar] [CrossRef]
  7. Moreno, C.; Allam, Z.; Chabaud, D.; Gall, C.; Pratlong, F. Introducing the “15-Minute City”: Sustainability, Resilience and Place Identity in Future Post-Pandemic Cities. Smart Cities 2021, 4, 93–111. [Google Scholar] [CrossRef]
  8. Wu, H.; Wang, L.; Zhang, Z.; Gao, J. Analysis and Optimization of 15-Minute Community Life Circle Based on Supply and Demand Matching: A Case Study of Shanghai. PLoS ONE 2021, 16, e0256904. [Google Scholar] [CrossRef]
  9. Roux, A.V.D. Investigating Neighborhood and Area Effects on Health. Am. J. Public Health 2001, 91, 1783–1789. [Google Scholar] [CrossRef]
  10. Foth, N.; Manaugh, K.; El-Geneidy, A.M. Towards Equitable Transit: Examining Transit Accessibility and Social Need in Toronto, Canada, 1996–2006. J. Transp. Geogr. 2013, 29, 1–10. [Google Scholar] [CrossRef]
  11. Liu, T.; Chai, Y. Daily Life Circle Reconstruction: A Scheme for Sustainable Development in Urban China. Habitat Int. 2015, 50, 250–260. [Google Scholar] [CrossRef]
  12. Wan, J.; Zhao, Y.; Zhang, K.; Ma, C.; Sun, H.; Wang, Z.; Wu, H.; Li, M.; Zhang, L.; Tang, X.; et al. Healthy Community-Life Circle Planning Combining Objective Measurement and Subjective Evaluation: Theoretical and Empirical Research. Int. J. Environ. Res. Public Health 2022, 19, 5028. [Google Scholar] [CrossRef] [PubMed]
  13. Tian, Y.; Kong, X.; Liu, Y. Combining Weighted Daily Life Circles and Land Suitability for Rural Settlement Reconstruction. Habitat Int. 2018, 76, 1–9. [Google Scholar] [CrossRef]
  14. Song, Y.; Huang, B.; Cai, J.; Chen, B. Dynamic Assessments of Population Exposure to Urban Greenspace Using Multi-Source Big Data. Sci. Total Environ. 2018, 634, 1315–1325. [Google Scholar] [CrossRef] [PubMed]
  15. Martí, P.; Serrano-Estrada, L.; Nolasco-Cirugeda, A. Social Media Data: Challenges, Opportunities and Limitations in Urban Studies. Comput. Environ. Urban Syst. 2019, 74, 161–174. [Google Scholar] [CrossRef]
  16. Song, Y.; Huang, B.; He, Q.; Chen, B.; Wei, J.; Mahmood, R. Dynamic Assessment of PM2.5 Exposure and Health Risk Using Remote Sensing and Geo-Spatial Big Data. Environ. Pollut. 2019, 253, 288–296. [Google Scholar] [CrossRef]
  17. Bao, J.; Zheng, Y.; Wilkie, D.; Mokbel, M. Recommendations in Location-Based Social Networks: A Survey. Geoinformatica 2015, 19, 525–565. [Google Scholar] [CrossRef]
  18. Long, Y.; Thill, J.-C. Combining Smart Card Data and Household Travel Survey to Analyze Jobs-Housing Relationships in Beijing. Comput. Environ. Urban Syst. 2015, 53, 19–35. [Google Scholar] [CrossRef] [Green Version]
  19. Wang, Z.; He, S.Y.; Leung, Y. Applying Mobile Phone Data to Travel Behaviour Research: A Literature Review. Travel Behav. Soc. 2018, 11, 141–155. [Google Scholar] [CrossRef]
  20. Yue, Y.; Lan, T.; Yeh, A.G.O.; Li, Q.-Q. Zooming into Individuals to Understand the Collective: A Review of Trajectory-Based Travel Behaviour Studies. Travel Behav. Soc. 2014, 1, 69–78. [Google Scholar] [CrossRef]
  21. Wesolowski, A.; Stresman, G.; Eagle, N.; Stevenson, J.; Owaga, C.; Marube, E.; Bousema, T.; Drakeley, C.; Cox, J.; Buckee, C.O. Quantifying Travel Behavior for Infectious Disease Research: A Comparison of Data from Surveys and Mobile Phones. Sci. Rep. 2014, 4, 5678. [Google Scholar] [CrossRef] [PubMed] [Green Version]
  22. Ratti, C.; Frenchman, D.; Pulselli, R.M.; Williams, S. Mobile Landscapes: Using Location Data from Cell Phones for Urban Analysis. Environ. Plan. B Plan. Des. 2006, 33, 727–748. [Google Scholar] [CrossRef]
  23. Zhao, Z.; Shaw, S.L.; Xu, Y.; Lu, F.; Chen, J.; Yin, L. Understanding the Bias of Call Detail Records in Human Mobility Research. Int. J. Geogr. Inf. Sci. 2016, 30, 1738–1762. [Google Scholar] [CrossRef]
  24. González, M.C.; Hidalgo, C.A.; Barabási, A.L. Understanding Individual Human Mobility Patterns. Nature 2008, 453, 779–782. [Google Scholar] [CrossRef]
  25. Song, C.; Qu, Z.; Blumm, N.; Barabási, A.L. Limits of Predictability in Human Mobility. Science 2010, 327, 1018–1021. [Google Scholar] [CrossRef] [Green Version]
  26. Calabrese, F.; Ferrari, L.; Blondel, V.D. Urban Sensing Using Mobile Phone Network Data: A Survey of Research. ACM Comput. Surv. 2014, 47, 1–20. [Google Scholar] [CrossRef]
  27. Jones, K.H.; Daniels, H.; Heys, S.; Ford, D.V. Challenges and Potential Opportunities of Mobile Phone Call Detail Records in Health Research: Review. JMIR mHealth uHealth 2018, 6, e161. [Google Scholar] [CrossRef] [Green Version]
  28. Zilske, M.; Nagel, K. Studying the Accuracy of Demand Generation from Mobile Phone Trajectories with Synthetic Data. In Procedia Computer Science, Proceedings of the 5th International Conference on Ambient Systems, Networks and Technologies (Ant-2014), the 4th International Conference on Sustainable Energy Information Technology (Seit-2014), Hasselt, Belgium, 2–5 June 2014; Shakshuki, E., Yasar, A., Eds.; Elsevier Science Bv: Amsterdam, The Netherlands, 2014; Volume 32, pp. 802–807. [Google Scholar]
  29. Diao, M.; Zhu, Y.; Ferreira, J.; Ratti, C. Inferring Individual Daily Activities from Mobile Phone Traces: A Boston Example. Environ. Plan. B-Plan. Des. 2016, 43, 920–940. [Google Scholar] [CrossRef] [Green Version]
  30. Xiong, Q.; Liu, Y.; Xie, P.; Wang, Y.; Liu, Y. Revealing Correlation Patterns of Individual Location Activity Motifs between Workdays and Day-Offs Using Massive Mobile Phone Data. Comput. Environ. Urban Syst. 2021, 89, 101682. [Google Scholar] [CrossRef]
  31. Yue, Y.; Zhuang, Y.; Yeh, A.G.O.; Xie, J.-Y.; Ma, C.-L.; Li, Q.-Q. Measurements of POI-Based Mixed Use and Their Relationships with Neighbourhood Vibrancy. Int. J. Geogr. Inf. Sci. 2017, 31, 658–675. [Google Scholar] [CrossRef]
  32. Zhai, W.; Bai, X.; Shi, Y.; Han, Y.; Peng, Z.-R.; Gu, C. Beyond Word2vec: An Approach for Urban Functional Region Extraction and Identification by Combining Place2vec and POIs. Comput. Environ. Urban Syst. 2019, 74, 1–12. [Google Scholar] [CrossRef]
  33. Wu, C.; Ye, X.; Ren, F.; Du, Q. Check-in Behaviour and Spatio-Temporal Vibrancy: An Exploratory Analysis in Shenzhen, China. Cities 2018, 77, 104–116. [Google Scholar] [CrossRef]
  34. Wang, Z.; Ma, D.; Sun, D.; Zhang, J. Identification and Analysis of Urban Functional Area in Hangzhou Based on OSM and POI Data. PLoS ONE 2021, 16, e0251988. [Google Scholar] [CrossRef] [PubMed]
  35. Gao, S.; Janowicz, K.; Couclelis, H. Extracting Urban Functional Regions from Points of Interest and Human Activities on Location-Based Social Networks. Trans. GIS 2017, 21, 446–467. [Google Scholar] [CrossRef]
  36. Zhao, P.; Kwan, M.-P.; Qin, K. Uncovering the Spatiotemporal Patterns of CO2 Emissions by Taxis Based on Individuals’ Daily Travel. J. Transp. Geogr. 2017, 62, 122–135. [Google Scholar] [CrossRef]
  37. Yao, Y.; Li, X.; Liu, X.; Liu, P.; Liang, Z.; Zhang, J.; Mai, K. Sensing Spatial Distribution of Urban Land Use by Integrating Points-of-Interest and Google Word2Vec Model. Int. J. Geogr. Inf. Sci. 2017, 31, 825–848. [Google Scholar] [CrossRef]
  38. Gan, Z.; Feng, T.; Wu, Y.; Yang, M.; Timmermans, H. Station-Based Average Travel Distance and Its Relationship with Urban Form and Land Use: An Analysis of Smart Card Data in Nanjing City, China. Transp. Policy 2019, 79, 137–154. [Google Scholar] [CrossRef]
  39. Sari Aslam, N.; Ibrahim, M.R.; Cheng, T.; Chen, H.; Zhang, Y. ActivityNET: Neural Networks to Predict Public Transport Trip Purposes from Individual Smart Card Data and POIs. Geo-Spat. Inf. Sci. 2021, 24, 711–721. [Google Scholar] [CrossRef]
  40. Pickett, K.E.; Pearl, M. Multilevel Analyses of Neighbourhood Socioeconomic Context and Health Outcomes: A Critical Review. J. Epidemiol. Community Health 2001, 55, 111–122. [Google Scholar] [CrossRef] [Green Version]
  41. Cummins, S.; Curtis, S.; Diez-Roux, A.V.; Macintyre, S. Understanding and Representing “place” in Health Research: A Relational Approach. Soc. Sci. Med. 2007, 65, 1825–1838. [Google Scholar] [CrossRef]
  42. Riva, M.; Gauvin, L.; Barnett, T.A. Toward the next Generation of Research into Small Area Effects on Health: A Synthesis of Multilevel Investigations Published since July 1998. J. Epidemiol. Community Health 2007, 61, 853–861. [Google Scholar] [CrossRef] [PubMed] [Green Version]
  43. Chaix, B. Geographic Life Environments and Coronary Heart Disease: A Literature Review, Theoretical Contributions, Methodological Updates, and a Research Agenda. Annu. Rev. Public Health 2009, 30, 81–105. [Google Scholar] [CrossRef] [PubMed] [Green Version]
  44. Leal, C.; Chaix, B. The Influence of Geographic Life Environments on Cardiometabolic Risk Factors: A Systematic Review, a Methodological Assessment and a Research Agenda: Geographic Life Environments and Cardiometabolic Risk Factors. Obes. Rev. 2011, 12, 217–230. [Google Scholar] [CrossRef] [PubMed]
  45. Lebel, A.; Pampalon, R.; Villeneuve, P.Y. A Multi-Perspective Approach for Defining Neighbourhood Units in the Context of a Study on Health Inequalities in the Quebec City Region. Int. J. Health Geogr. 2007, 6, 27. [Google Scholar] [CrossRef] [Green Version]
  46. Perchoux, C.; Chaix, B.; Cummins, S.; Kestens, Y. Conceptualization and Measurement of Environmental Exposure in Epidemiology: Accounting for Activity Space Related to Daily Mobility. Health Place 2013, 21, 86–93. [Google Scholar] [CrossRef] [PubMed]
  47. Coombes, E.; Jones, A.P.; Hillsdon, M. The Relationship of Physical Activity and Overweight to Objectively Measured Green Space Accessibility and Use. Soc. Sci. Med. 2010, 70, 816–822. [Google Scholar] [CrossRef] [Green Version]
  48. Leung, Y.; Meng, D.; Xu, Z. Evaluation of a Spatial Relationship by the Concept of Intrinsic Spatial Distance. Geogr. Anal. 2013, 45, 380–400. [Google Scholar] [CrossRef]
  49. Zhou, C. Composition and Construction of Urban Community 15 Minutes Fitness Circle on the Perspective of National Fitness Public Service. In Proceedings of the 6th International Conference on Applied Social Science (ICASS 2017), Singapore, 7–8 May 2017; Volume 98, pp. 493–498. [Google Scholar]
  50. McGrail, M.R.; Humphreys, J.S. Measuring Spatial Accessibility to Primary Health Care Services: Utilising Dynamic Catchment Sizes. Appl. Geogr. 2014, 54, 182–188. [Google Scholar] [CrossRef]
  51. Ni, J.; Liang, M.; Lin, Y.; Wu, Y.; Wang, C. Multi-Mode Two-Step Floating Catchment Area (2SFCA) Method to Measure the Potential Spatial Accessibility of Healthcare Services. ISPRS Int. J. Geo-Inf. 2019, 8, 236. [Google Scholar] [CrossRef] [Green Version]
  52. Wang, F. From 2SFCA to I2SFCA: Integration, Derivation and Validation. Int. J. Geogr. Inf. Sci. 2021, 35, 628–638. [Google Scholar] [CrossRef]
  53. Lu, J.; Zhou, S.; Liu, L.; Li, Q. You Are Where You Go: Inferring Residents’ Income Level through Daily Activity and Geographic Exposure. Cities 2021, 111, 102984. [Google Scholar] [CrossRef]
  54. Frair, J.L.; Nielsen, S.E.; Merrill, E.H.; Lele, S.R.; Boyce, M.S.; Munro, R.H.M.; Stenhouse, G.B.; Beyer, H.L. Removing GPS Collar Bias in Habitat Selection Studies. J. Appl. Ecol. 2004, 41, 201–212. [Google Scholar] [CrossRef] [Green Version]
  55. Biggs, J.; Lu, Z.; Fournier, T.; Freymueller, J.T. Magma Flux at Okmok Volcano, Alaska, from a Joint Inversion of Continuous GPS, Campaign GPS, and Interferometric Synthetic Aperture Radar. J. Geophys. Res.-Solid Earth 2010, 115, B12401. [Google Scholar] [CrossRef] [Green Version]
  56. Ranacher, P.; Brunauer, R.; Trutschnig, W.; Van der Spek, S.; Reich, S. Why GPS Makes Distances Bigger than They Are. Int. J. Geogr. Inf. Sci. 2016, 30, 316–333. [Google Scholar] [CrossRef] [PubMed] [Green Version]
  57. Caceres, N.; Romero, L.M.; Benitez, F.G. Exploring Strengths and Weaknesses of Mobility Inference from Mobile Phone Data vs. Travel Surveys. Transp. A 2020, 16, 574–601. [Google Scholar] [CrossRef]
  58. Zhen, F.; Cao, Y.; Qin, X.; Wang, B. Delineation of an Urban Agglomeration Boundary Based on Sina Weibo Microblog “check-in” Data: A Case Study of the Yangtze River Delta. Cities 2017, 60, 180–191. [Google Scholar] [CrossRef]
  59. Shin, J.C.; Kwan, M.-P.; Grigsby-Toussaint, D.S. Do Spatial Boundaries Matter for Exploring the Impact of Community Green Spaces on Health? Int. J. Environ. Res. Public Health 2020, 17, 7529. [Google Scholar] [CrossRef]
  60. Khan, N.U.; Wan, W.; Yu, S.; Muzahid, A.a.M.; Khan, S.; Hou, L. A Study of User Activity Patterns and the Effect of Venue Types on City Dynamics Using Location-Based Social Network Data. ISPRS Int. Geo-Inf. 2020, 9, 733. [Google Scholar] [CrossRef]
  61. Weng, M.; Ding, N.; Li, J.; Jin, X.; Xiao, H.; He, Z.; Su, S. The 15-Minute Walkable Neighborhoods: Measurement, Social Inequalities and Implications for Building Healthy Communities in Urban China. J. Transp. Health 2019, 13, 259–273. [Google Scholar] [CrossRef]
  62. Wu, L.; Chang, M.; Wang, X.; Hang, J.; Zhang, J.; Wu, L.; Shao, M. Development of the Real-Time On-Road Emission (ROE v1.0) Model for Street-Scale Air Quality Modeling Based on Dynamic Traffic Big Data. Geosci. Model Dev. 2020, 13, 23–40. [Google Scholar] [CrossRef]
  63. Shi, F. Research on Accessibility and Equity of Urban Transport Based on Multisource Big Data. J. Adv. Transp. 2021, 2021, 1103331. [Google Scholar] [CrossRef]
  64. Zhao, P.; Hu, H. Geographical Patterns of Traffic Congestion in Growing Megacities: Big Data Analytics from Beijing. Cities 2019, 92, 164–174. [Google Scholar] [CrossRef]
  65. Lu, Y.; Zhu, X. Strategies for Optimizing Meso-Scale Spatial Layout Based on Travel Demand; WIT Transactions on Ecology and the Environment: Alicante, Spain, 2016; pp. 117–128. [Google Scholar]
  66. Zhang, T.; Zeng, Y.; Zhang, Y.; Song, Y.; Li, H. The Heterogenous Demand for Urban Parks between Home Buyers and Renters: Evidence from Beijing. Sustainability 2020, 12, 9058. [Google Scholar] [CrossRef]
  67. Huang, Y. Collectivism, Political Control, and Gating in Chinese Cities. Urban Geogr. 2006, 27, 507–525. [Google Scholar] [CrossRef] [Green Version]
  68. Zhang, F.; Zu, J.; Hu, M.; Zhu, D.; Kang, Y.; Gao, S.; Zhang, Y.; Huang, Z. Uncovering Inconspicuous Places Using Social Media Check-Ins and Street View Images. Comput. Environ. Urban Syst. 2020, 81, 101478. [Google Scholar] [CrossRef]
  69. Cheng, G.; Zeng, X.; Duan, L.; Lu, X.; Sun, H.; Jiang, T.; Li, Y. Spatial Difference Analysis for Accessibility to High Level Hospitals Based on Travel Time in Shenzhen, China. Habitat Int. 2016, 53, 485–494. [Google Scholar] [CrossRef]
Figure 1. Flowchart of the DMP method.
Ijgi 11 00548 g001
Figure 2. Path inference schematic.
Ijgi 11 00548 g002
Figure 3. Frequency statistics schematic.
Ijgi 11 00548 g003
Figure 4. Schematic diagram of base station positioning.
Ijgi 11 00548 g004
Figure 5. Schematic illustration of the relationship between base stations and residential land.
Ijgi 11 00548 g005
Figure 6. Schematic illustration of the relationship between base stations and POI facilities.
Ijgi 11 00548 g006
Figure 7. Waterside Star City 15 min-CLC coverage.
Ijgi 11 00548 g007
Figure 8. Century Color City 15 min-CLC coverage.
Ijgi 11 00548 g008
Figure 9. Coverage sharing diagram.
Ijgi 11 00548 g009
Figure 10. Waterside Star City residents’ travel characteristic.
Ijgi 11 00548 g010
Figure 11. Century Color City residents’ travel characteristic.
Ijgi 11 00548 g011
Figure 12. Spatially extended heterogeneity.
Ijgi 11 00548 g012
Figure 13. Types of the shared facilities diagram.
Ijgi 11 00548 g013
Figure 14. Spatial mismatch phenomenon.
Ijgi 11 00548 g014
Table 1. Frequency of assigning weights.
Usage Frequency ClassHigh FrequencyMedium FrequencyLow Frequency
Weight distribution321
Table 2. POI activity weights system.
POI Categories Secondary CategoriesWeights
Medical HealthHospitals1
Clinics, Pharmacies2
Healthcare1
Life ServicesLiving Services3
Dining Services3
Sports & Leisure2
Car Service1
Shopping services, shopping malls3
Shopping Center2
Science and Culture ServicesKindergarten, elementary school, etc.2
Finance servicesBanks2
Financial and insurance companies1
Leisure and tourismLeisure Services3
Tourist Attractions2
Transportation Facilities Bus Stops3
Parking lots2
Public Administration Facilities-----1
Table 3. Example of mobile phone data structure.
UESRID DateTimeLACCID
159****286837:47:43712D0E1E
135****9517310:35:16708B63D1
150****634339:05:11703D4598
Table 4. Example of communication base station data.
BaseIDlnglat
2894030548114.272530.71609
2897142595114.304830.64788
2919344562114.287730.15406
Table 5. Reclassified POI system.
Original CategoriesOriginal Secondary CategoriesNew CategoriesNew Secondary CategoriesNumber of POI
MedicalPharmacyMedical HealthHospitals392
HealthcareClinics, Pharmacies2306
ClinicsHealthcare259
General Hospital——
Life ServicesLife ServicesLife ServicesLiving Services1408
Science and Culture ServicesDining Services1321
Auto Service——Sports & Leisure1110
Leisure and EntertainmentLiving ServicesCar Service737
Dining ServicesShopping services, shopping malls197
Sports & LeisureShopping Center90
Shopping Services----
DiningDining Services----
ShoppingShopping Center----
General Shopping MallsScience and Culture ServicesKindergarten, elementary school, etc.1522
FinanceFinancial and Insurance ServicesFinance servicesBanks924
Corporate EnterprisesFinancial and insurance companies1241
Banks-----
Tourist AttractionsPark SquareLeisure and tourismLeisure Services755
Tourist AttractionsTourist Attractions554
Transportation FacilitiesBus StopsTransportation FacilitiesBus Stops839
Parking lotsParking lots2517
Government Agencies----Public Administration Facilities-----3149
Publisher’s Note: MDPI stays neutral with regard to jurisdictional claims in published maps and institutional affiliations.

