Article

Identification of Paddy Varieties from Landsat 8 Satellite Image Data Using Spectral Unmixing Method in Indramayu Regency, Indonesia

by
Iqbal Maulana Cipta
1,
Lalu Muhamad Jaelani
1,* and
Hartanto Sanjaya
2,3
1
Department of Geomatics Engineering, Faculty of Civil, Planning and Geo-Engineering, Institut Teknologi Sepuluh Nopember (ITS), Surabaya 60111, Indonesia
2
Department of Civil Engineering, Faculty of Civil, Planning and Geo-Engineering, Institut Teknologi Sepuluh Nopember (ITS), Surabaya 60111, Indonesia
3
National Research and Innovation Agency, Gedung B.J. Habibie, Jl. M.H. Thamrin No. 8, Jakarta Pusat 10340, Indonesia
*
Author to whom correspondence should be addressed.
ISPRS Int. J. Geo-Inf. 2022, 11(10), 510; https://doi.org/10.3390/ijgi11100510
Submission received: 4 August 2022 / Revised: 19 September 2022 / Accepted: 26 September 2022 / Published: 30 September 2022
(This article belongs to the Special Issue Geomatics in Forestry and Agriculture: New Advances and Perspectives)

Abstract

:
Indramayu Regency is the highest rice producer in West Java province, Indonesia. According to the Central Statistics Agency (BPS), in 2021, rice production in 2020 reached 1,365,435.39 tons of GKG (milled dry grain). Technological developments in the food sector produce various kinds of premium quality rice and rice varieties resistant to climate change, such as Ciherang, Inpari 32 HDB and IR 64. The regular monitoring of specific rice varieties over large areas effectively maintains the quality and quantity of rice production. This study used remote sensing data to monitor rice conditions and distribution based on the spectral unmixing method. The spectral unmixing method was used to identify the percentage of the presence of a pure object in a pixel. The results obtained in this study were images of the endmember fractions of rice varieties and areas of dominant rice varieties used in the Indramayu district. The dominant variety detected with the processing results was the Inpari 32 HDB variety, with an area of 30,738.64 hectares. In comparison, varieties other than Inpari 32 HDB were also detected in several areas in the Indramayu district, with an area of 12,192.68 hectares.

1. Introduction

Southeast Asia is located on the equator, where most of the population relies on the agricultural sector as a livelihood source and development support [1]. Rice (Oryza sativa L.) is a species of the genus Oryza, which belongs to the family Poaceae (Gramineae). In Indonesia, 90% of the people consume rice as a staple food [2]. The high level of rice consumption must be balanced with appropriate production so as to not cause a shortage of supplies, resulting in food insecurity [3].
Indramayu Regency is a reasonably fertile area. Of the 204,011 ha area, 41.90% is paddy fields [4]. Based on data from the Central Statistics Agency (BPS), in 2021, rice production in Indramayu Regency in 2020 reached 1,365,435.39 tons of GKG (milled dry grain), with a productivity level of 6.07 tons/ha. These statistical data place Indramayu Regency in the first rank as the highest rice producer in West Java province. Other data show that there may be a bias in the statistics on area and rice productivity ranging from 12.61% to 20.72% for the rice harvested area and 0.23% to 0.25% for rice productivity, as reported by Hidayat (2018). This bias is caused by the data source, which are the harvested area (from monthly reports of agricultural statistics; Statistik Pertanian (SP)) and productivity from the Ubinan Survey [5]. Rice plants generally take 3–4 months to grow, from planting to harvesting, depending on the type of variety and the environmental conditions in which the rice grows. Technological developments in the food sector produce various kinds of premium-quality rice and rice varieties resistant to global climate change caused by global warming [6]. Rice plants can be distinguished based on their varieties. There are wide varieties of rice plants, and almost every year they appear with better genetic traits [7]. Based on the annual data issued by the Directorate of Food Crops Germination in 2020, the dominant superior rice varieties grown in Indonesia include Ciherang, Inpari 32 HDB and IR 64.
Information on the distribution of dominant rice varieties using remote sensing techniques can be used as a reference for efforts to control and guarantee the quality of rice products to be marketed based on the type of variety. Many of them are quantitative measurements based on specific methods. For example, spectral classification uses the linear spectral unmixing (LSU) method [8]. The “spectral unmixing” of satellite images is one of the most widely used methods for obtaining mixed-pixel information. The spectral unmixing method is used to identify the percentage of the presence of a pure object (endmember) in a pixel. Therefore, the spectral unmixing method requires the endmember of each object to be identified.
The spectral mixture analysis was originally developed to interpret hyperspectral data using a “High Spectral Resolution Advanced Visible/Infrared Image Spectrometer” (HSR AVIRIS). The spectral unmixing method in its development has also been applied to analyze multispectral images [9]. For example, Liming Bai (2012) used Landsat 7 ETM+ imagery data to estimate forest cover in the Pingnan area. Gandharum (2015) utilized Landsat 5 TM to categorize rice plants infected with bacterial leaf blight. Tompolidi (2020) mapped a hydrothermal field using spectral unmixing from ASTER, Landsat 8/OLI and Sentinel-2 MSI data. Finally, Wu (2021) utilized spectral unmixing from stacked multitemporal remote sensing images with a variability of endmembers for change detection [9,10,11,12]. The objective of this study is to identify varieties of rice plants using Landsat 8 image data in Indramayu Regency using the spectral unmixing method. There remain some issues in the existing method for estimating paddy areas and rice production. Hopefully, this research can be used to estimate rice production accurately by estimating paddy areas of certain varieties.

2. Materials and Methods
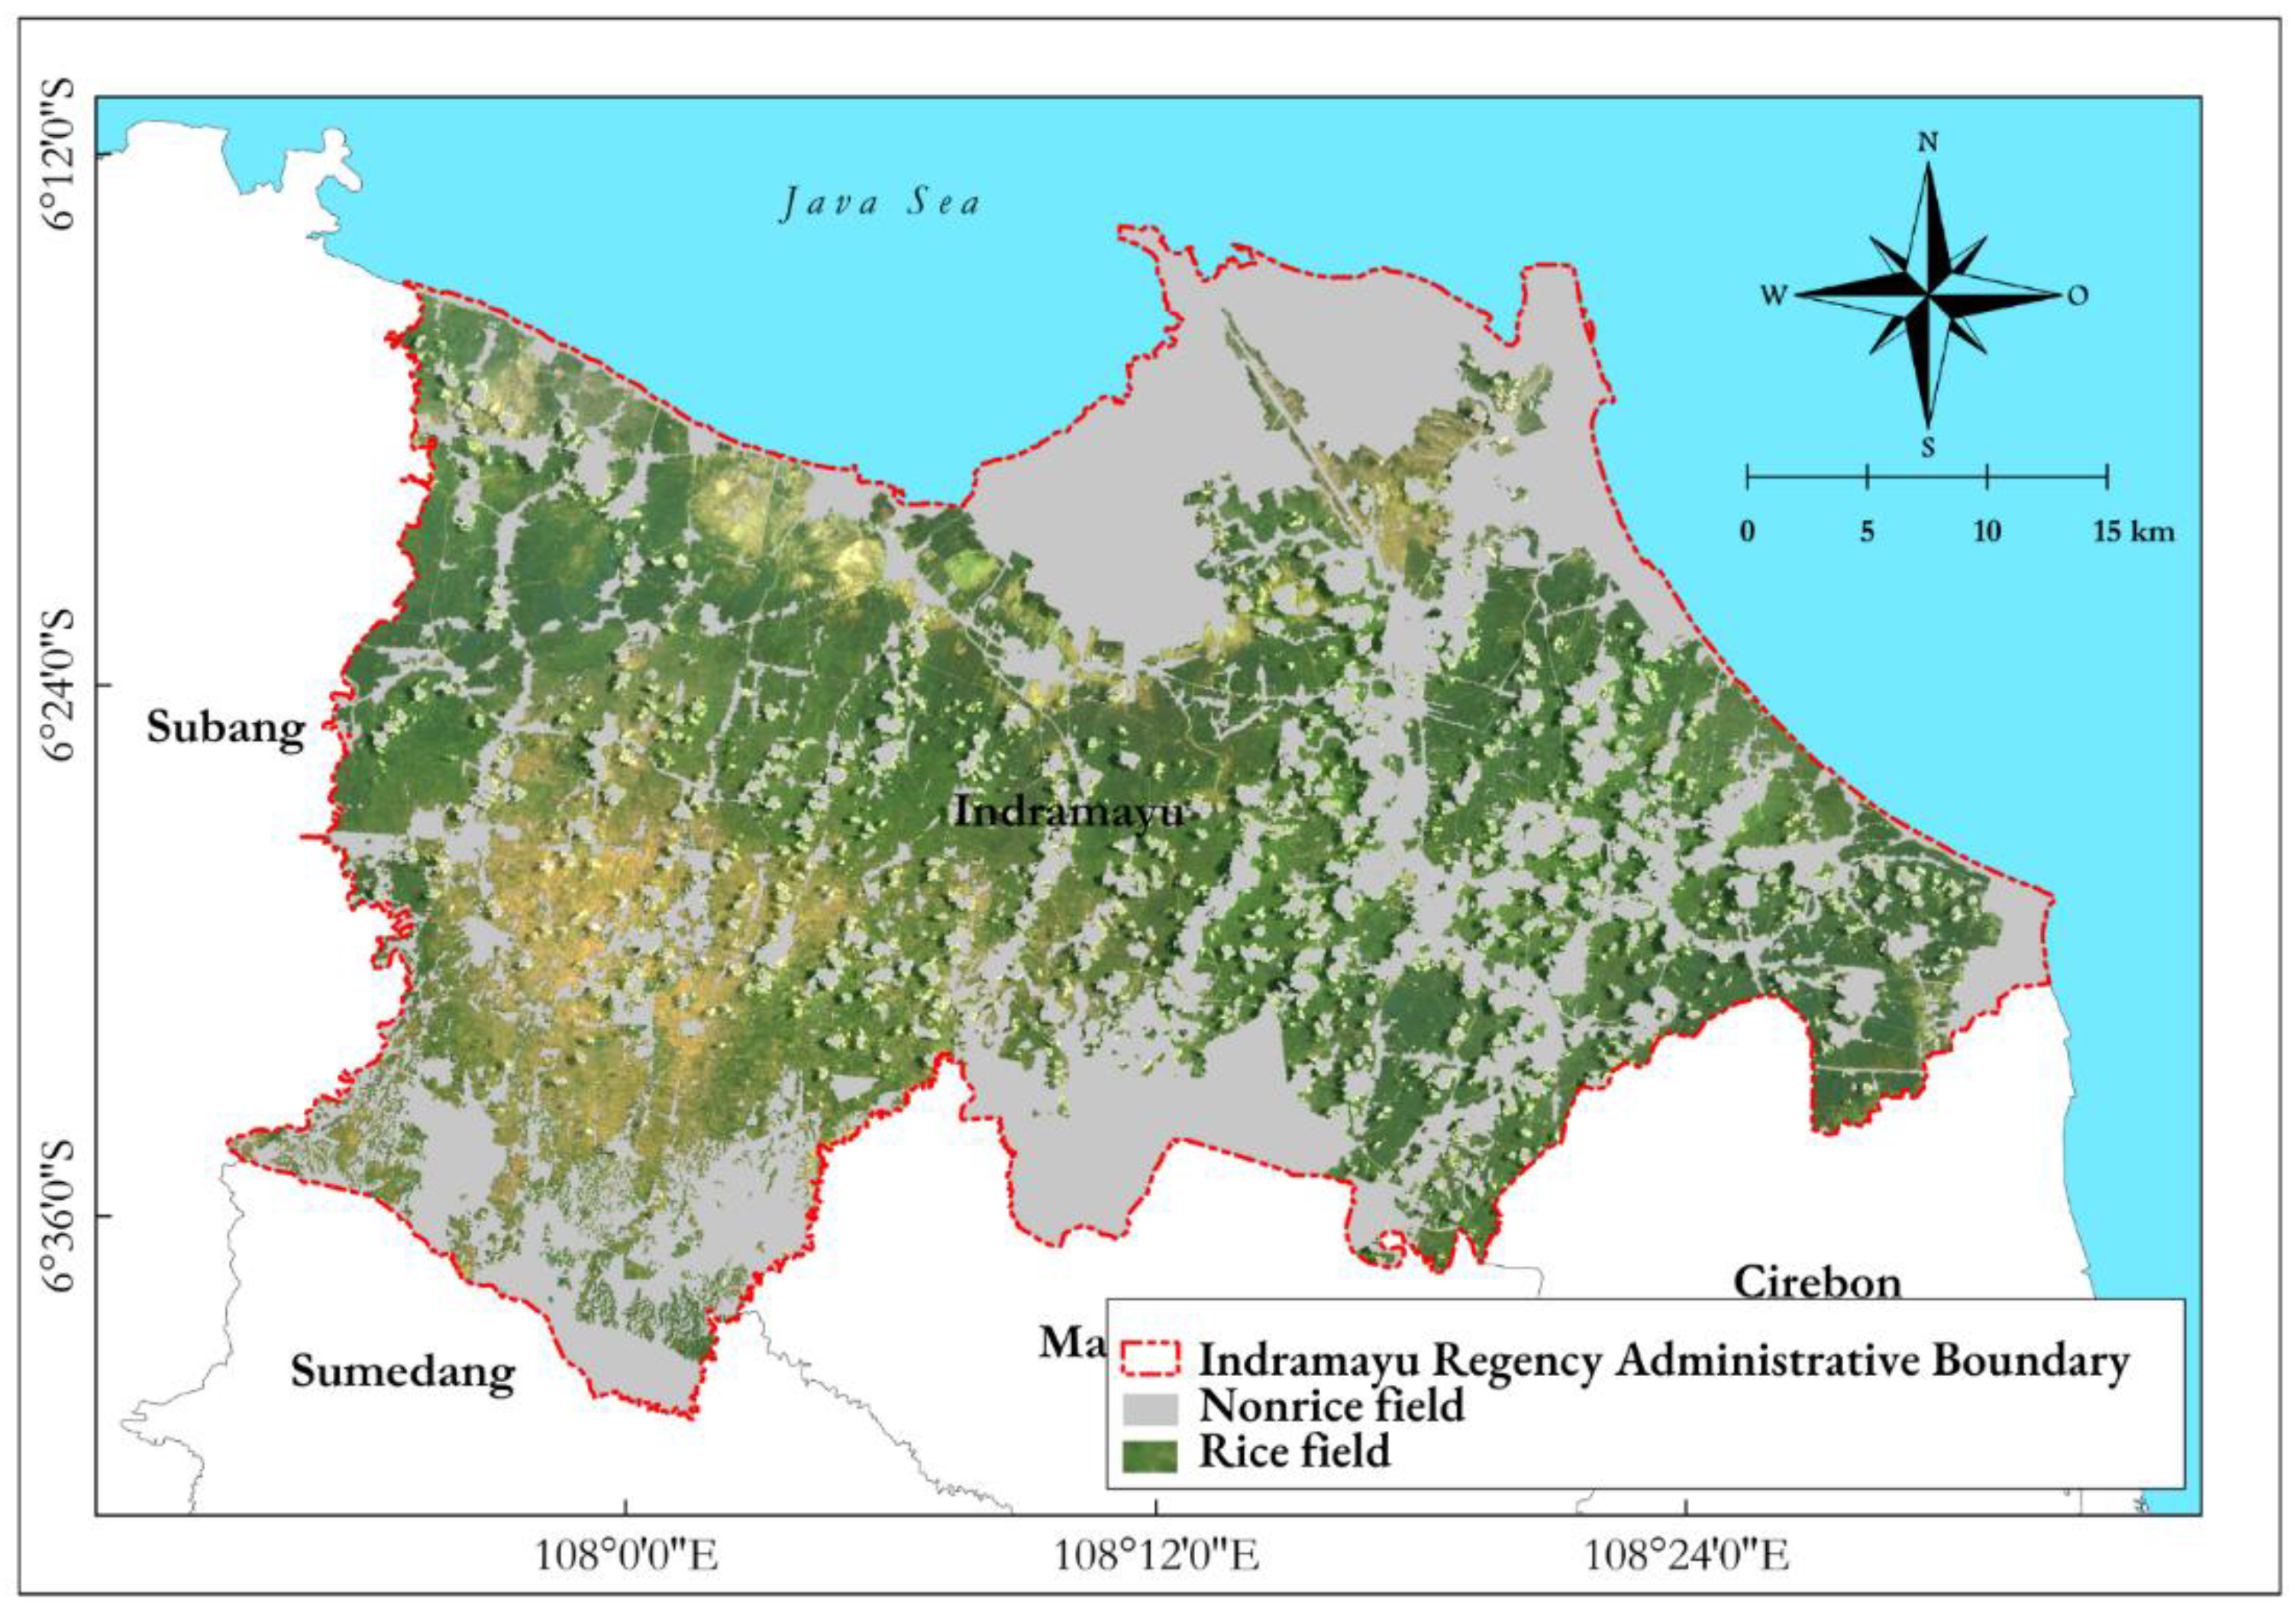
2.1. Study Area

Indramayu Regency is one of the regencies in West Java province, Indonesia, as presented in Figure 1. It has geographic coordinates between 107°52′ E and 108°36′ E and 6°15′ S and 6°40′ S. Administratively, it is divided into 31 subdistricts with 317 villages. The location of Indramayu Regency stretches along the northern coast of Java Island with its topographic appearance. Most of it is plains or sloping areas with an average slope of 0–2%.

2.2. Data

The data used in this study were Landsat 8 surface reflectance tier 1 satellite images with two scenes to cover the study area obtained through the Google Earth Engine platform (https://earthengine.google.com/, accessed on 25 January 2022) with the image recording time adjusted to the reproductive phase of the rice plant, namely, on 17 March 2021, in the Indramayu Regency area for identifying rice varieties. In addition, this study also used MODIS satellite imagery with a resolution of 500 m in a total of 730 scene images obtained through the Google Earth Engine platform (https://earthengine.google.com/, accessed on 25 January 2022) with an acquisition time from January to December 2021. MODIS satellite image data were used to determine the reproductive phase of rice plants and the threshold value of the reproductive phase of rice plants. This study also used vector data for raw rice fields in Indramayu Regency from the Geospatial Information Agency (BIG) to delineate the study area, and used spectral data for each rice variety obtained through direct field measurements in the Indramayu Regency area for the spectral library development. The software used in this research was Google Earth Engine and Quantum GIS.

3. Methods

The overall workflow of our study was structured into three sections as presented in Figure 2: First, we determined the reproductive phase of rice plants and determined the threshold value of the reproductive phase of rice plants from MODIS satellite imagery data. Second, the threshold value of the reproductive phase of rice was used in Landsat 8 satellite imagery for the phase separation of rice plants. Third, we determined the endmember used in the spectral unmixing algorithm. Finally, we implemented the spectral unmixing algorithm to the Landsat 8 data.

3.1. Determination of the Reproductive Phase and Threshold Value of the Reproductive Phase of Rice Plants

The reproductive phase of rice plants in this study was determined using the NDVI and MNDWI spectral index. NDVI and MNDWI spectral index calculations were performed using BRDF MODIS/Terra+Aqua Nadir image data. The fashionable image data from January 2020 to December 2021 comprised of 730 image scenes.
NDVI is one of the vegetation indices commonly used for vegetation monitoring in remote sensing. This index was introduced by Rouse [13]. NDVI compares the subtraction value of the NIR surface reflectance band and the red band surface reflectance with the total value of the NIR surface reflectance band and the red band surface reflectance.
NDVI = ρ N I R ρ R E D ρ N I R + ρ R E D
NDVI generally has a range of values from −1 to 1. A low NDVI value indicates that the vegetation on the pixel has low health [14]. Another index called the NDWI was proposed by McFeeters in 1996, and is often used for detecting and monitoring minor changes in the water content of bodies of water. The NDWI can enhance water bodies in satellite images by using NIR (near-infrared) and green (visible green) spectral bands. The index’s disadvantage is that it is sensitive to constructed buildings, which can lead to an overestimation of water bodies [15,16].
To improve open water features while effectively reducing and even eliminating built-up land noise, as well as vegetation and soil noise, a modified NDWI called the MNDWI was proposed by Xu in 2006 [17]. The method compares the subtraction value of the green band surface reflectance and the SWIR band surface reflectance with the total value of the green band surface reflectance and SWIR band surface reflectance.
MNDWI = ρ G R E E N ρ S W I R ρ G R E E N + ρ S W I R
The MNDWI method has advantages over NDWI. When compared to NDWI, it can be utilized to better define water features combined with vegetation, since it can reduce soil and vegetation disruptions to identify water bodies [17,18,19].
The determination of the reproductive phase of rice plants in this study was obtained through the extraction of the spectral index values of NDVI and MNDWI using 5 sample points spread over several rice fields. The determination of these 5 sample points was carried out randomly in rice fields in Indramayu Regency. The results of the extraction of the spectral index values were determined in a time series graph from January 2020 to December 2021 to identify the reproductive phase of rice plants and determine the threshold value of the reproductive phase of rice plants. The threshold value was determined based on observations in the time series graph of the NDVI and MNDWI spectral index values of the MODIS Terra/Aqua data.

3.2. Calculation of NDVI and MNDWI Spectral Index with Landsat 8 Satellite

The calculation of the NDVI and MNDWI spectral indices was carried out; then, the spectral index value was masked with the threshold value obtained from calculations on MODIS satellite imagery. The results produced were satellite images of the reproductive phase of rice plants. The images of the reproductive phase were calculated using the spectral unmixing method.

3.3. Endmember Determination

The endmember is the pure reflectance spectral value of an object [20]. Endmember values usually correspond to macroscopic objects in a study area, such as water, soil, metal or any natural materials [21]. To perform the spectral unmixing process, endmember data had to be observed. The number of endmember data used was better than the number of available spectral channels [10]. Endmember data could be obtained through (1) direct measurements of the field using a spectrometer, (2) spectral libraries or (3) through image transformation [22].
The determination of the endmembers in this study was based on several types of rice varieties, namely, Ciherang, IR64 and Inpari 32 HDB. The endmember value was obtained through direct measurements in Indramayu Regency rice fields using an Ocean Optics Spectrometer. Based on field observations, rice leaves started to become dense in the reproductive phase; thus, the selection of endmembers was narrowed down to the reproductive phase, as shown in Figure 3.

3.4. Spectral Unmixing Algorithm Calculation

Spectral unmixing is a procedure in which the spectral values of mixed pixels are decomposed into a collection of constituent spectra or endmembers and a fraction map or gray map, showing the proportion of each endmember contained in the pixel [21].
In the results of high-resolution satellite imagery, one pixel can represent one object. However, in the results of medium-resolution satellite images, one pixel can contain various objects. Therefore, it was necessary to simplify the mixed pixel using the endmember value.
The results of this method were highly dependent on the endmember data input. Unmixing spectral classification produced a pair of gray-level images. Each consisted of an abundance map and a quantitative pixel error image for all endmembers. The resulting endmember fraction map was in the form of the percentage of the presence of an object (endmember) in a pixel, indicated by a bright hue (white) if the object’s presence was high and a dark hue (black) if the object’s presence was low [9].
We calculated the spectral unmixing using reflectance band 1, band 2, band 3, band 4 and band 5 on Landsat 8 surface reflectance collection 2 tier 1 images. The value of the resulting fraction image ranged from 0 to 1. Data processing was carried out on the Google Earth Engine platform.

4. Results and Discussion

4.1. Rice Plant Phase Identification

The generative phase of rice plants could be identified by decreasing the NDVI value from the peak value. Based on Figure 4, it could be identified that the generative phase of rice was in April 2020, August 2020, March 2021 and August 2021. Based on the range of values owned by the two indices in the graph formed in Figure 4 and Figure 5, the threshold value for the reproductive phase could be determined as values of NDVI > 0.7 and MNDWI < −0.4. The threshold value was determined based on observations of the time series graph of the formed NDVI and MNDWI spectral index values. The threshold value indicated that the rice fields were in the reproductive phase where the NDVI index value was high while the MNDWI index value was low.

4.2. Landsat 8 Satellite Imagery Reproductive Phase of Rice Plants

The reproductive phase of rice plants in Indramayu Regency was identified using MODIS data. It occurred in April 2020, August 2020, March 2021 and August 2021. We utilized the reproductive phase in March 2021 for this research. The Landsat 8 satellite image used was taken on 17 March 2021. The Landsat 8 image was subsetted with vector data for raw rice fields in Indramayu Regency. The results of the subsetted image can be seen in Figure 6.
The NDVI and MNDWI spectral indices were calculated and then masked based on the threshold value obtained from the calculation on the MODIS image. The resulting results were in the form of satellite images of the reproductive phase of rice plants. The results of satellite images in the reproductive phase of rice plants can be seen in Figure 7. The reproductive phase image was calculated using the spectral unmixing method.
Based on the statistics estimations, rice fields in the reproductive phase accounted for 37 %, or 42,931.33 hectares, of the total raw land area of 115,894 hectares on 17 March 2021.

4.3. Distribution of Rice Plant Varieties in Indramayu Regency

The fraction map generated from the spectral unmixing algorithm was the percentage of endmembers for each pixel. The resulting endmember percentage values range was in the 0–1 or 0–100% range. The higher the endmember percentage, the brighter the pixels. The results of the processing with the spectral unmixing algorithm can be seen in Figure 8.
Figure 8 shows the results of the spectral unmixing algorithm. Based on Figure 8, the dominant variety used in Indramayu Regency was the Inpari 32 HDB variety, which was indicated with a bright hue (red) if the presence of the object was high and a dark hue (black) if the presence of the object was low. Figure 8 shows that there were no Ciherang varieties and IR 64 varieties in the data processing results, which were indicated by the absence of other colors on the map.
Figure 9, Figure 10 and Figure 11 show images of the endmember fractions of each rice variety. Based on the statistical values generated from the endmember fraction map, it was obtained that the Inpari 32 HDB variety had a value range of 0 to 0.978. This indicated that there was rice of the Inpari 32 HDB variety in some pixels. This variety had dominant appearance with 50% larger endmembers indicated in blue and light blue. Because the endmember was less than 50%, other variants (IR 64 and Ciherang) had no pixels with these colors. The Ciherang variety had a value of 0 in each pixel. This indicated that the Ciherang variety did not exist in any pixels. The IR 64 variety had a value range of 0 to 0.440, which indicated that in some pixels there was rice of the IR 64 variety, but because the value range was still below 0.5 or 50%, this indicated that there were other dominant varieties in that pixel.
Based on Table 1 and Figure 12, the dominant variety used in Indramayu Regency was the Inpari 32 HDB variety. However, the range of values indicated that there were still pixels whose values were below 50%. The low values of the pixels indicated that there were other varieties in the pixel. Therefore, this study determined a threshold value to distinguish the Inpari 32 HDB variety and other varieties (besides Inpari 32 HDB, Ciherang and IR 64). The threshold value used to detect the presence of the Inpari 32 HDB variety in the fraction image was ≥50%. Meanwhile, the threshold value used to detect the presence of other varieties in the fractional image was <50%. The threshold value was based on the presence of 32 HDB Inpari varieties in one pixel. If the image fraction value was below 50%, it indicated other varieties in that pixel. Using a threshold value above 50% indicated that in that pixel the dominant variety was the Inpari 32 HDB variety.
Based on Table 2, the area of paddy fields planted with the Inpari 32 HDB variety with a fraction value ≥ 50% was 30,738.65 hectares. Meanwhile, the area of paddy fields planted with other varieties (besides Inpari 32 HDB, Ciherang and IR 64) with a fraction value < 50% was 12,192.68 hectares. Based on the results of data processing, it could be seen that the dominant variety used by farmers in Indramayu Regency in March 2021 was the Inpari 32 HDB variety.

4.4. Validation of Rice Fields

Information on the distribution of dominant rice varieties from the results of Landsat 8 satellite image processing needed to be validated with data on the use of rice varieties obtained from direct field surveys to ensure the suitability of the information on the time and location of the use of rice varieties. Field validation data in the form of rice field coordinate points and information regarding the use of rice plant varieties were obtained. Validation points were taken randomly in rice fields in Indramayu Regency. The validation results are presented in Table 3 and Figure 13.
Based on the comparison of the results between the image of the endmember fraction and the data on the use of rice varieties in Table 3, it can be seen that there were several differences in the data. Based on sample point number three in Table 3 in the image of the endmember fraction, it was identified that the rice field used the Inpari 32 HDB rice plant variety, but the data on the use of rice plant varieties stated that the rice field used another rice plant variety, namely, the Borang variety (Inpari 32). Based on the results of the processing in this study, there were differences in the results produced by the field validation data.
The difference in the results between the endmember fraction image and data on rice varieties could be influenced by several factors, including the image data used. The spectral unmixing method was intended for hyperspectral images with a high spatial resolution, but this study used images with a medium resolution. Another factor could be the use of spectral libraries, given that there are wide varieties of rice plants in Indonesia. In contrast, in this study, only three types of spectral libraries were used, which could have affected the results obtained.

5. Conclusions

After applying the threshold value to distinguish between the Inpari 32 HDB variety and other varieties, rice fields planted with the Inpari 32 HDB variety comprised 30,738.65 hectares. Meanwhile, the area of paddy fields planted with other varieties was 12,192.68. Based on the data processing results, it was found that the dominant variety used by farmers in Indramayu Regency in March 2021 was the Inpari 32 HDB variety. Based on the comparison of the results of data processing with data on the use of rice varieties, it was found that there were several differences in the results produced. This showed that the spectral unmixing method using Landsat 8 satellite images still struggled to identify rice varieties. This could have been caused by several factors, including the image data used having a low spatial resolution. Other factors could be in the form of the spectral libraries used, where this study only used three types of spectral libraries. These factors could have affected the obtained results.

Author Contributions

Iqbal Maulana Cipta, Lalu Muhamad Jaelani and Hartanto Sanjaya designed the paper. Iqbal Maulana Cipta conducted the data processing, statistical analysis and wrote the paper. Lalu Muhamad Jaelani and Hartanto Sanjaya contributed great efforts to the research methodology, substantial editing, final writing and figure optimization. All the authors contributed to the paper revision. All authors have read and agreed to the published version of the manuscript.

Funding

Institut Teknologi Sepuluh Nopember, under the project scheme of the Publication Writing and IPR Incentive Program (PPHKI) Number 668/IT2/T/HK.00.01/2022.

Data Availability Statement

The Landsat 8 surface reflectance tier 1 images were obtained with the Google Earth Engine (https://earthengine.google.com/, accessed on 25 January 2022). The MODIS satellite imagery was obtained with the Google Earth Engine (https://earthengine.google.com/, accessed on 25 January 2022). Spectral data for each rice variety were obtained through direct field measurements.

Acknowledgments

The authors gratefully acknowledge the National Research and Innovation Agency (BRIN) and Pest Forecasting Center (BBPOPT), which assisted in providing research data.

Conflicts of Interest

The authors declare no conflict of interest.

References

  1. Sinaga, R. Faktor-Faktor Yang Mempengaruhi Produksi Bawang Merah: Studi Kasus Pada Usaha Tani Di Desa Srigading, Kecamatan Sanden, Kabupaten Bantul, DIY Tahun 2013. Ph.D. Thesis, UAJY, Yogyakarta, Indonesia, 2013. [Google Scholar]
  2. Ningsih, F. Identifikasi Karakter Morfologi Dan Agronomi Beberapa Kultivar Padi Sawah Lokal Asal Kecamatan Kampar Utara Kabupaten Kampar Pada Fase Vegetatif. Ph.D. Thesis, Universitas Islam Negeri Sultan Syarif Kasim, Riau, Indonesia, 2018. [Google Scholar]
  3. Sari, V.D.; Sukojo, B.M. Analisa Estimasi Produksi Padi Berdasarkan Fase Tumbuh Dan Model Peramalan Autoregressive Integrated Moving Average (Arima) Menggunakan Citra Satelit Landsat 8 (Studi Kasus: Kabupaten Bojonegoro). Geoid 2015, 10, 194–203. [Google Scholar] [CrossRef]
  4. Rahaldi, P.; Handayani, H.H.; Wibowo, A. Analisa Kesehatan Tanaman Padi Berdasarkan Nilai Normalized Difference Vegetation Index (NDVI) Menggunakan Citra Aster (Studi Kasus: Kabupaten Indramayu—JAWA Barat). Geoid 2013, 8, 107. [Google Scholar] [CrossRef]
  5. Hidayat, I.; Wijayanto, H.; Afendi, F.M. Evaluation of Paddy Production Mesurement in Indonesia. IOP Conf. Ser. Earth Environ. Sci. 2018, 187, 012035. [Google Scholar] [CrossRef]
  6. Romdon, A.S.; Kurniyati, E.; Bahri, S.; Pramono, J. Kumpulan Deskripsi Varietas Padi; BPTP: Jawa Tengah, Indonesia, 2014. [Google Scholar]
  7. Azhar, H.M.; Susilastuti, D. Analisis Keragaman Hayati Tanaman Padi (Oryza Sativa, L.). AGRISIA—J. Ilmu-Ilmu Pertan. 2017, 9, 64–82. [Google Scholar]
  8. Afifah, L.N.; Sanjaya, H. Aplikasi Metoda Linear Spectral Unmixing Citra Hyperspectral Untuk Pengataman Sebaran Opt Blb Tanaman Padi (Studi Kasus Subang). In Proceedings of the Pertemuan Ilmiah Tahunan MAPIN, Jakarta, Indonesia, 9 August 2010. [Google Scholar]
  9. Gandharum, L.; Mubekti; Sanjaya, H.; Sadmono, H.; Wibowo, B.S. Penerapan Metode Linear Spectral Unmixing Pada Citra Landsat Tm Dan Data Spekrometer Untuk Memetakan Tanaman Padi Terserang Penyakit Hawar Daun Bakteri. PIT XX Kongr. MAPIN IPB Bogor 2015, 2, 433–444. [Google Scholar]
  10. Bai, L.; Lin, H.; Sun, H.; Mo, D.; Yan, E. Spectral Unmixing Approach in Remotely Sensed Forest Cover Estimation: A Study of Subtropical Forest in Southeast China. Phys. Procedia 2012, 25, 1055–1062. [Google Scholar] [CrossRef]
  11. Tompolidi, A.M.; Sykioti, O.; Koutroumbas, K.; Parcharidis, I. Spectral Unmixing for Mapping a Hydrothermal Field in a Volcanic Environment Applied on ASTER, Landsat-8/OLI, and Sentinel-2 MSI Satellite Multispectral Data: The Nisyros (Greece) Case Study. Remote Sens. 2020, 12, 4180. [Google Scholar] [CrossRef]
  12. Wu, K.; Chen, T.; Xu, Y.; Song, D.; Li, H. A Novel Change Detection Approach Based on Spectral Unmixing from Stacked Multitemporal Remote Sensing Images with a Variability of Endmembers. Remote Sens. 2021, 13, 2550. [Google Scholar] [CrossRef]
  13. Rouse, J.W.; Haas, R.H.; Schell, J.A.; Deeering, D. Monitoring Vegetation Systems in the Great Plains with ERTS (Earth Resources Technology Satellite). In Proceedings of the 3rd Earth Resources Technology Satellite-1 Symposium, Washington, DC, USA, 10–14 December 1973; NASA Special: Washington, DC, USA, 1974; Volume 1. [Google Scholar]
  14. Gessesse, A.A.; Melesse, A.M. Temporal Relationships between Time Series CHIRPS-Rainfall Estimation and EMODIS-NDVI Satellite Images in Amhara Region, Ethiopia. In Extreme Hydrology and Climate Variability: Monitoring, Modelling, Adaptation and Mitigation; Elsevier: Amsterdam, The Netherlands, 2019. [Google Scholar] [CrossRef]
  15. McFeeters, S.K. The Use of the Normalized Difference Water Index (NDWI) in the Delineation of Open Water Features. Int. J. Remote Sens. 1996, 17, 1425–1432. [Google Scholar] [CrossRef]
  16. Gao, B. NDWI—A Normalized Difference Water Index for Remote Sensing of Vegetation Liquid Water from Space. Remote Sens. Environ. 1996, 58, 257–266. [Google Scholar] [CrossRef]
  17. Xu, H. Modification of Normalised Difference Water Index (NDWI) to Enhance Open Water Features in Remotely Sensed Imagery. Int. J. Remote Sens. 2006, 27, 3025–3033. [Google Scholar] [CrossRef]
  18. Singh, K.V.; Setia, R.; Sahoo, S.; Prasad, A.; Pateriya, B. Evaluation of NDWI and MNDWI for Assessment of Waterlogging by Integrating Digital Elevation Model and Groundwater Level. Geocarto Int. 2015, 30, 650–661. [Google Scholar] [CrossRef]
  19. Szabó, S.; Gácsi, Z.; Balázs, B. Specific Features of NDVI, NDWI and MNDWI as Reflected in Land Cover Categories. Landsc. Environ. 2016, 10, 194–202. [Google Scholar] [CrossRef]
  20. Rajabi, R.; Ghassemian, H. Sparsity Constrained Graph Regularized NMF for Spectral Unmixing of Hyperspectral Data. J. Indian Soc. Remote Sens. 2015, 43, 194–202. [Google Scholar] [CrossRef] [Green Version]
  21. Keshava, N. A Survey of Spectral Unmixing Algorithms. Linc. Lab. J. 2003, 14, 55–78. [Google Scholar]
  22. Sulastri, R.; Susilo, B. Linear Spectral Mixture Analysis Untuk Kajian Ekspansi Lahan Terbangun Menggunakan Citra Landsat Multitemporal Di Kota Surakarta Dan Sekitarnya. J. Bumi Indones. 2018, 7, 260718. [Google Scholar]
Figure 1. The location of the study area.
Ijgi 11 00510 g001
Figure 2. The workflow of the methodology used in the study.
Ijgi 11 00510 g002
Figure 3. Reflectance value of each variety.
Ijgi 11 00510 g003
Figure 4. MODIS image NDVI value January 2020–December 2021. The legend corresponds to the number of the sample point.
Ijgi 11 00510 g004
Figure 5. MODIS image MNDWI value January 2020–December 2021. The legend corresponds to the number of the sample point.
Ijgi 11 00510 g005
Figure 6. Landsat 8 image cropping results with rice field vector data.
Ijgi 11 00510 g006
Figure 7. Rice field image masking results.
Ijgi 11 00510 g007
Figure 8. Rice variety distribution fraction map.
Ijgi 11 00510 g008
Figure 9. Map fraction results of Inpari 32 HDB variety in Indramayu Regency.
Ijgi 11 00510 g009
Figure 10. Map fraction results of IR 64 variety in Indramayu Regency.
Ijgi 11 00510 g010
Figure 11. Map fraction results of Ciherang variety in Indramayu Regency.
Ijgi 11 00510 g011
Figure 12. Results of classification of Inpari and other varieties in Indramayu district.
Ijgi 11 00510 g012
Figure 13. Validation point distribution map.
Ijgi 11 00510 g013
Table 1. Indramayu fraction image value range.
VarietiesEndmember Percentage Value Range
MinMax
Inpari 32 HDB00.978
IR 6400.440
Ciherang00
Table 2. Area distribution of varieties in Indramayu Regency.
VarietiesArea (Hectare)
Inpari 32 HDB30,738.65
Other12,192.68
Table 3. Field validation results.
No.Location NamesCoordinate PointVarietiesResults Comparison
Endmember Fraction ImageryData on the Use of Rice Varieties
1Wastim−6.486; 108.473KeboOn rice fields identified using other varieties besides Inpari 32 HDB, Ciherang, and IR 64On rice fields using the Kebo variety
2Adiyah−6.484; 108.461Inpari 32On rice fields identified using the Inpari 32 HDB varietyOn rice fields using the Inpari 32 HDB variety
3Kasta−6.493; 108.472Borang (Inpari 44)On rice fields identified using the Inpari 32 HDB varietyOn rice fields using the Borang (Inpari 44) variety
4Madrais−6.474; 108.427MunculOn rice fields identified using the Inpari 32 HDB varietyOn rice fields using the Cilamaya Muncul variety
5Aan−6.474; 108.421Galur BaworOn rice fields identified using the Inpari 32 HDB varietyOn rice fields using the Galur Bawor variety
6Mustakim Kalen−6.46;
108.427
SiliwangiOn rice fields identified using the Inpari 32 HDB varietyOn rice fields using the Siliwangi variety
7Hidayati−6.477; 108.409KeboOn rice fields identified using the Inpari 32 HDB varietyOn rice fields using the Kebo variety
8Petikungan−6.411; 107.904IR 42On rice fields identified using the Inpari 32 HDB varietyOn rice fields using the IR 42 variety
9Blok Rawa Entik−6.416; 107.906IR 42On rice fields identified using the Inpari 32 HDB varietyOn rice fields using the IR 43 variety
10Blok Pangonan−6.41;
107.912
MekonggaOn rice fields identified using the Inpari 32 HDB varietyOn rice fields using the Mekongga variety
Publisher’s Note: MDPI stays neutral with regard to jurisdictional claims in published maps and institutional affiliations.

