
ICF1-Syndrome-Associated DNMT3B Mutations Prevent De Novo Methylation at a Subset of Imprinted Loci during iPSC Reprogramming
 , , , , , , ,
  , and
, and 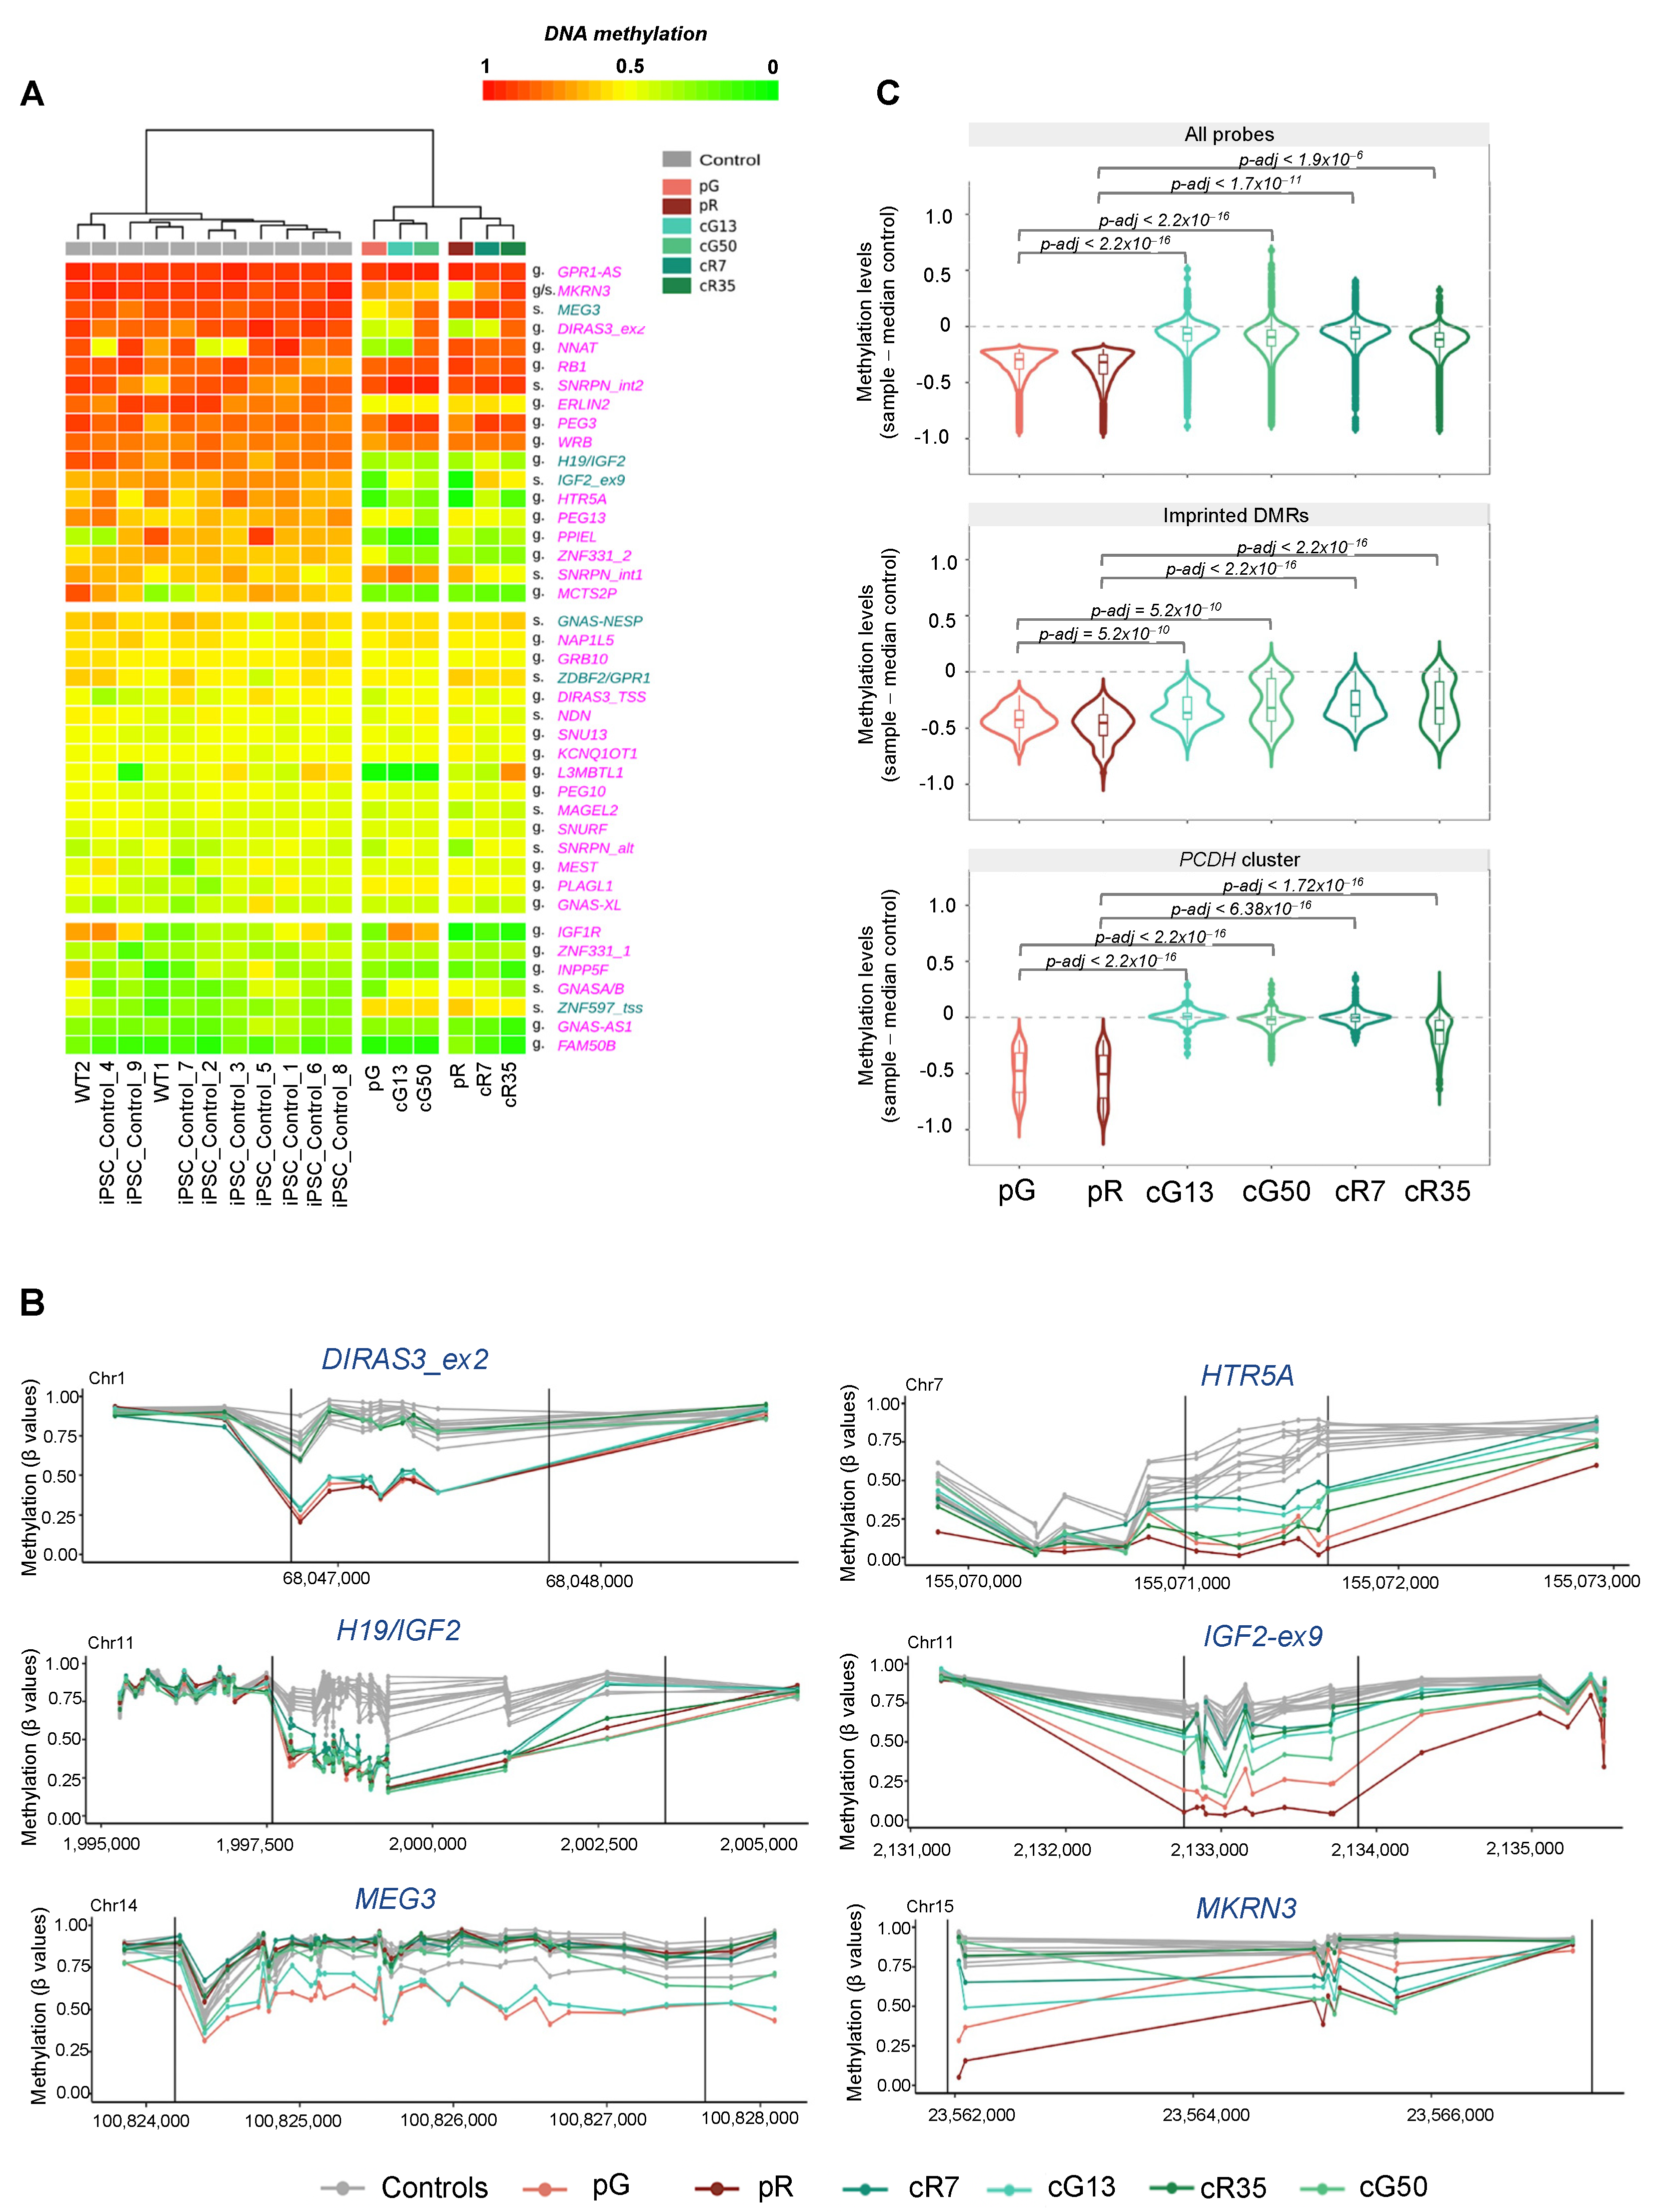
Abstract
:1. Introduction
2. Materials and Methods
2.1. Human iPSCs and Fibroblast Samples
2.2. Methylation Array Analysis
2.3. ChIP-seq Datasets and Association with DNA Methylation Profiles
2.4. Data Visualization
2.5. Real-Time Quantitative PCR (RT-qPCR)
2.6. Statistical Analysis
2.7. Data Access
3. Results
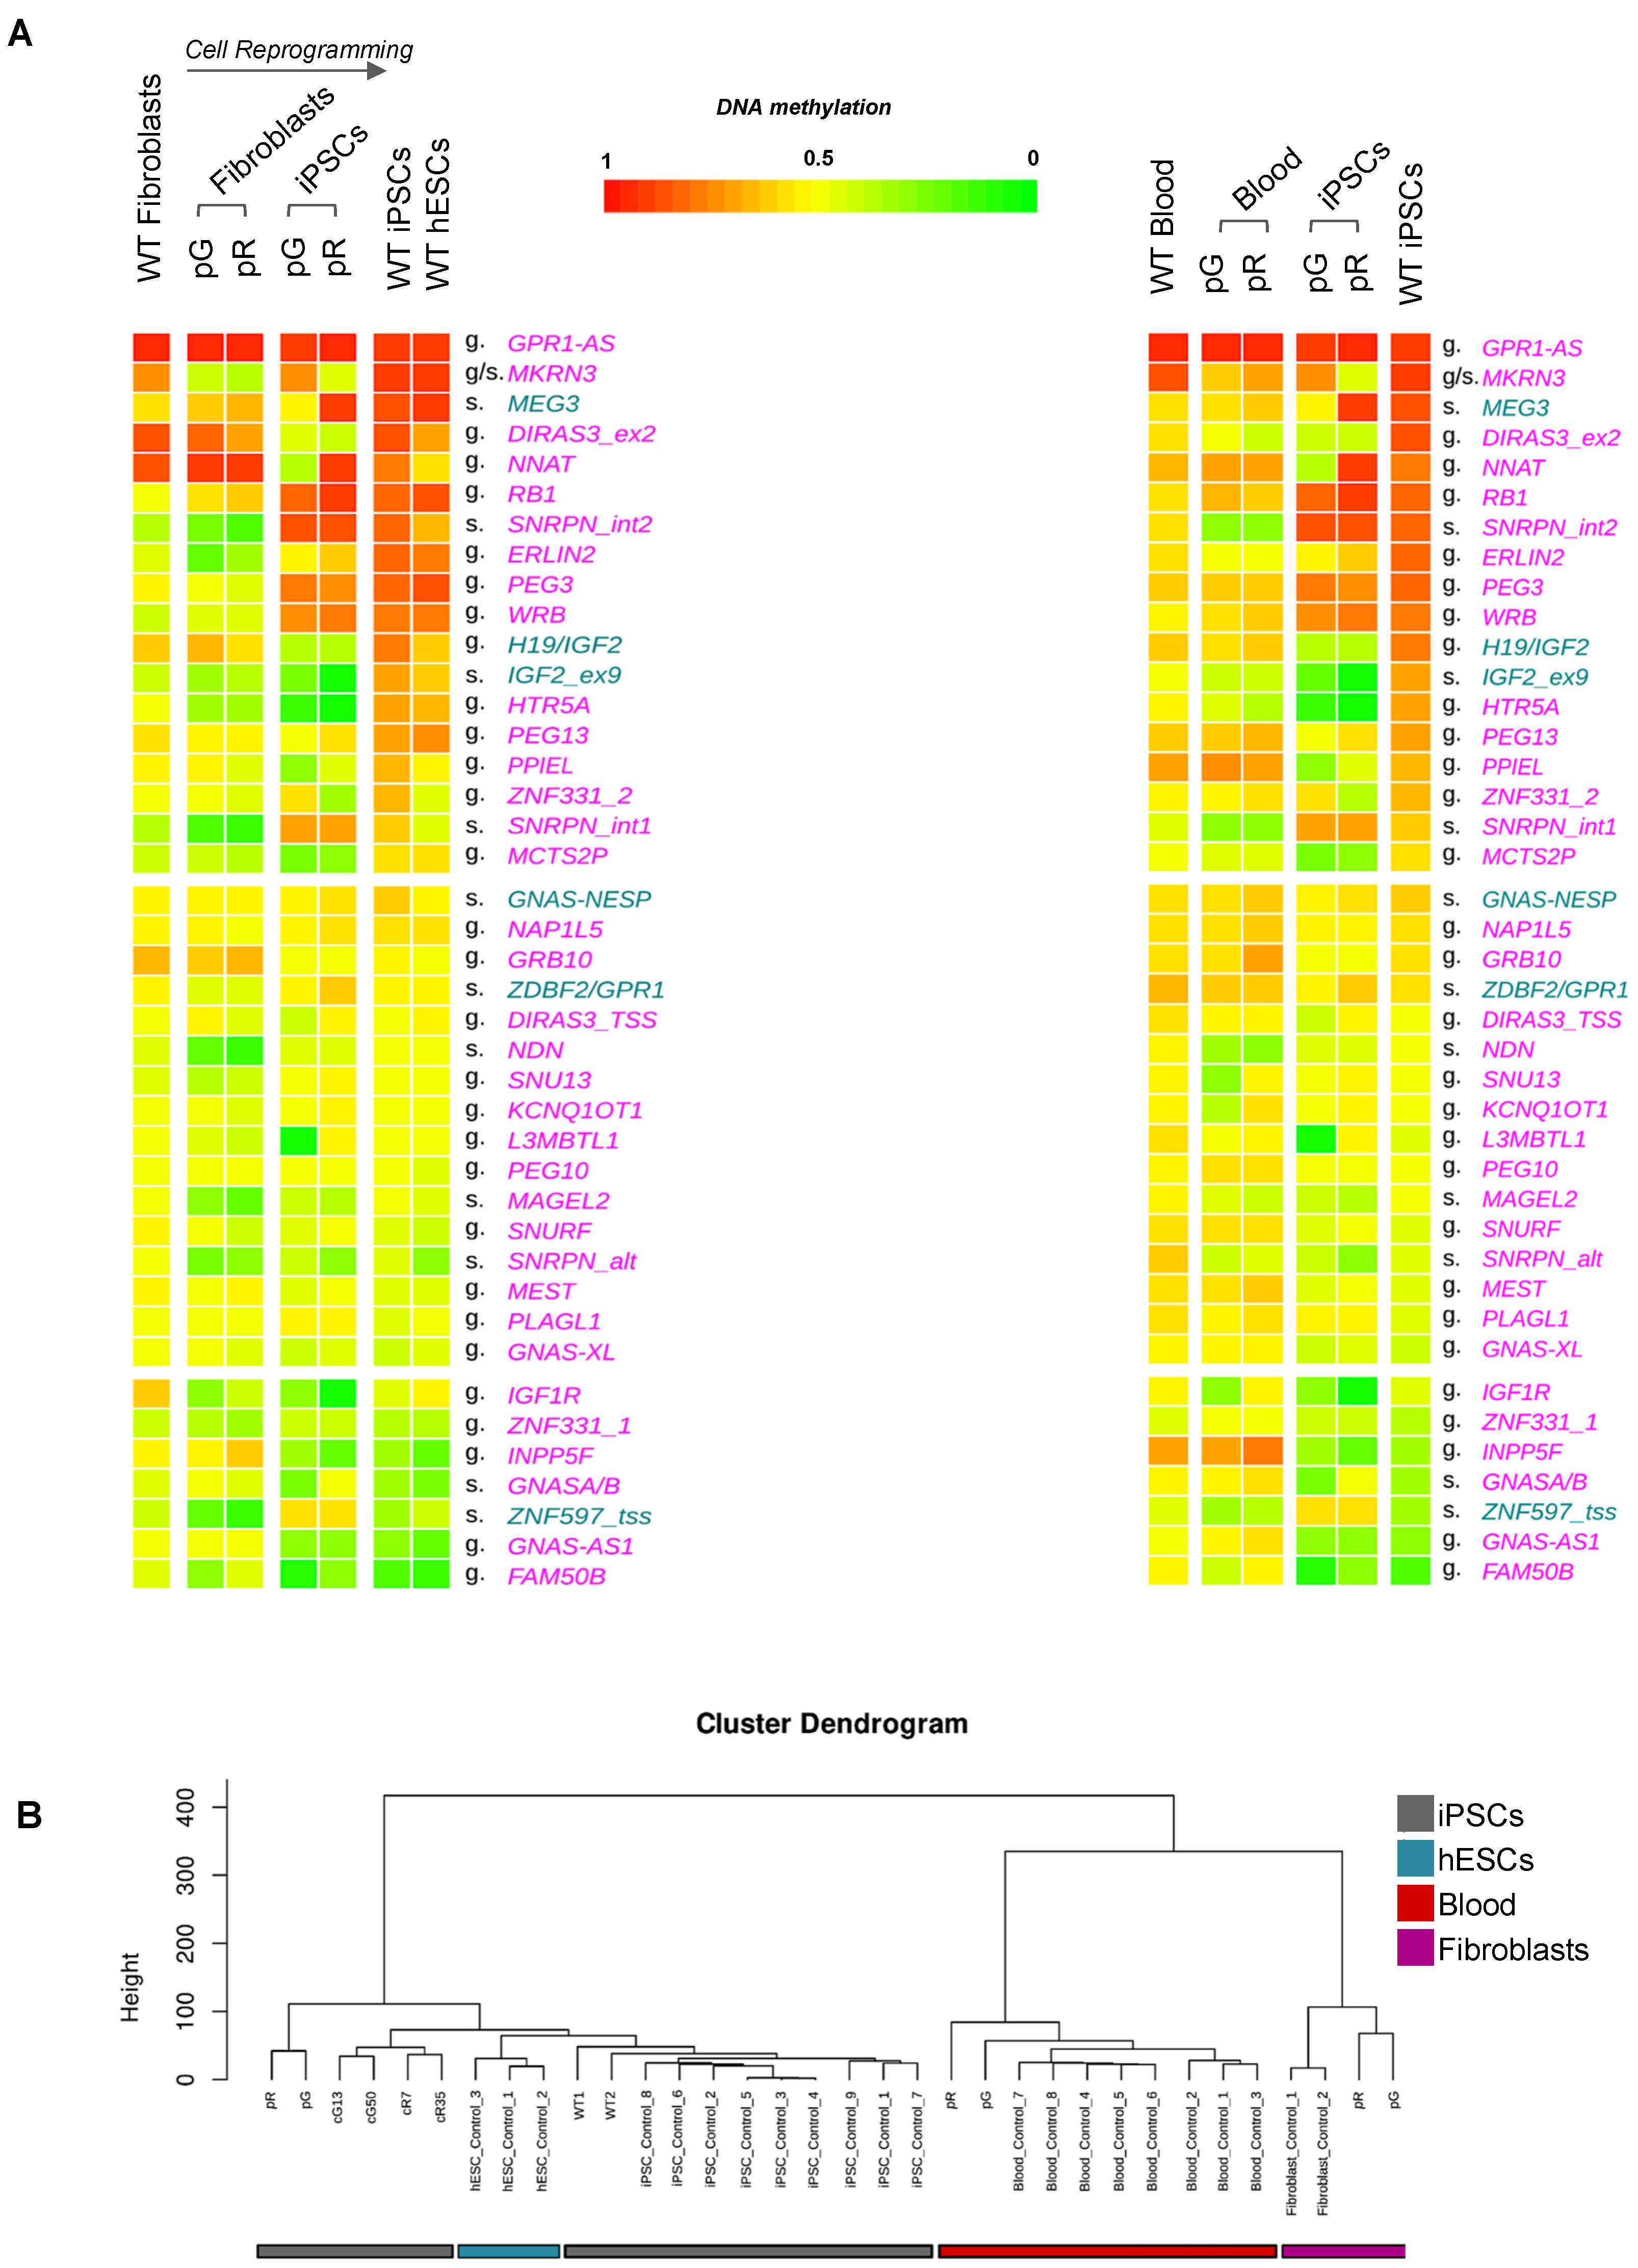
3.1. De Novo Gain of Methylation at Imprinted Loci during iPSC Reprogramming Is Affected by DNMT3B Loss of Function and Is Not Restored following Gene Correction
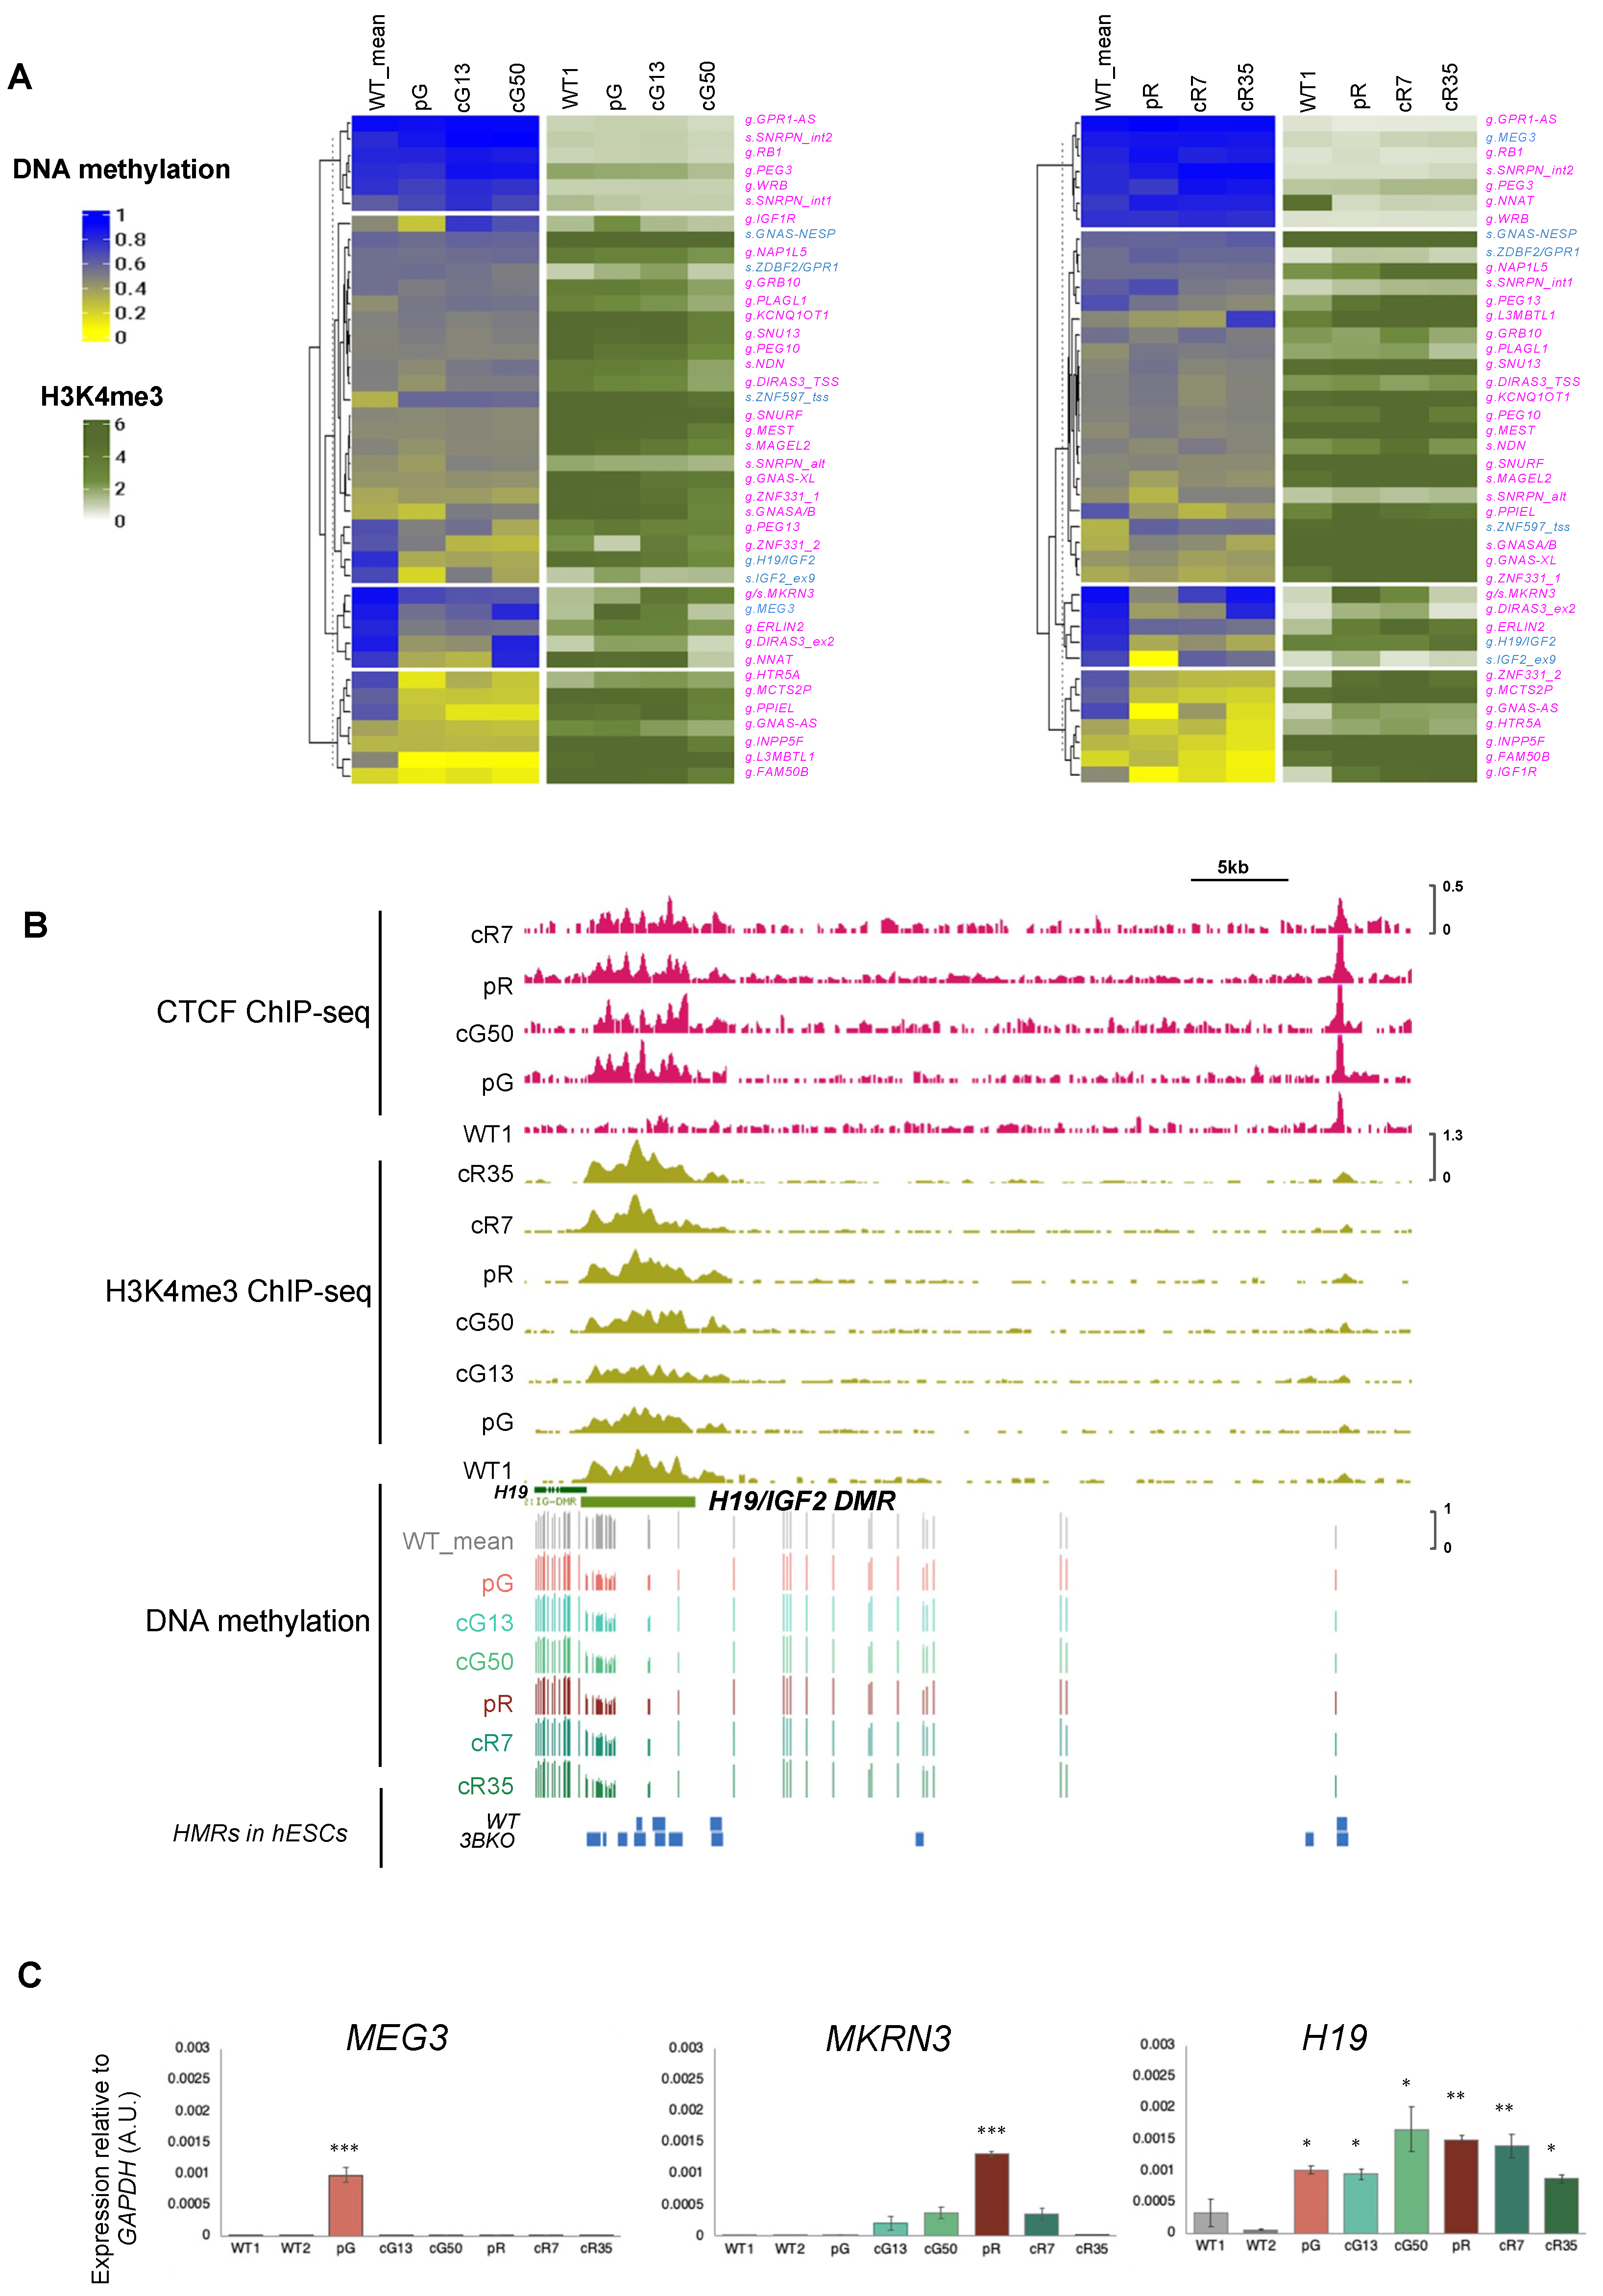
3.2. The H3K4me3 Mark Is Abnormally Enriched at Hypomethylated Imprinted DMRs
4. Discussion
Supplementary Materials
Author Contributions
Funding
Institutional Review Board Statement
Informed Consent Statement
Data Availability Statement
Acknowledgments
Conflicts of Interest
References
- Barlow, D.P.; Bartolomei, M.S. Genomic Imprinting in Mammals. Cold Spring Harb. Perspect. Biol. 2014, 6, a018382. [Google Scholar] [CrossRef] [PubMed]
- Monk, D.; Morales, J.; den Dunnen, J.T.; Russo, S.; Court, F.; Prawitt, D.; Eggermann, T.; Beygo, J.; Buiting, K.; Tümer, Z.; et al. Recommendations for a Nomenclature System for Reporting Methylation Aberrations in Imprinted Domains. Epigenetics 2018, 13, 117–121. [Google Scholar] [CrossRef]
- Monk, D.; Mackay, D.J.G.; Eggermann, T.; Maher, E.R.; Riccio, A. Genomic Imprinting Disorders: Lessons on How Genome, Epigenome and Environment Interact. Nat. Rev. Genet. 2019, 20, 235–248. [Google Scholar] [CrossRef]
- Nazor, K.L.; Altun, G.; Lynch, C.; Tran, H.; Harness, J.V.; Slavin, I.; Garitaonandia, I.; Müller, F.-J.; Wang, Y.-C.; Boscolo, F.S.; et al. Recurrent Variations in DNA Methylation in Human Pluripotent Stem Cells and Their Differentiated Derivatives. Cell Stem Cell 2012, 10, 620–634. [Google Scholar] [CrossRef] [PubMed]
- Lister, R.; Pelizzola, M.; Kida, Y.S.; Hawkins, R.D.; Nery, J.R.; Hon, G.; Antosiewicz-Bourget, J.; O’Malley, R.; Castanon, R.; Klugman, S.; et al. Hotspots of Aberrant Epigenomic Reprogramming in Human Induced Pluripotent Stem Cells. Nature 2011, 471, 68–73. [Google Scholar] [CrossRef]
- Nishino, K.; Umezawa, A. DNA Methylation Dynamics in Human Induced Pluripotent Stem Cells. Hum. Cell 2016, 29, 97–100. [Google Scholar] [CrossRef]
- Tesarova, L.; Simara, P.; Stejskal, S.; Koutna, I. The Aberrant DNA Methylation Profile of Human Induced Pluripotent Stem Cells Is Connected to the Reprogramming Process and Is Normalized During In Vitro Culture. PLoS ONE 2016, 11, e0157974. [Google Scholar] [CrossRef] [PubMed]
- Kato, Y.; Kaneda, M.; Hata, K.; Kumaki, K.; Hisano, M.; Kohara, Y.; Okano, M.; Li, E.; Nozaki, M.; Sasaki, H. Role of the Dnmt3 Family in de Novo Methylation of Imprinted and Repetitive Sequences during Male Germ Cell Development in the Mouse. Hum. Mol. Genet. 2007, 16, 2272–2280. [Google Scholar] [CrossRef]
- Quenneville, S.; Verde, G.; Corsinotti, A.; Kapopoulou, A.; Jakobsson, J.; Offner, S.; Baglivo, I.; Pedone, P.V.; Grimaldi, G.; Riccio, A.; et al. In Embryonic Stem Cells, ZFP57/KAP1 Recognize a Methylated Hexanucleotide to Affect Chromatin and DNA Methylation of Imprinting Control Regions. Mol. Cell 2011, 44, 361–372. [Google Scholar] [CrossRef]
- Chen, T.; Ueda, Y.; Dodge, J.E.; Wang, Z.; Li, E. Establishment and Maintenance of Genomic Methylation Patterns in Mouse Embryonic Stem Cells by Dnmt3a and Dnmt3b. Mol. Cell. Biol. 2003, 23, 5594–5605. [Google Scholar] [CrossRef]
- Baubec, T.; Colombo, D.F.; Wirbelauer, C.; Schmidt, J.; Burger, L.; Krebs, A.R.; Akalin, A.; Schübeler, D. Genomic Profiling of DNA Methyltransferases Reveals a Role for DNMT3B in Genic Methylation. Nature 2015, 520, 243–247. [Google Scholar] [CrossRef] [PubMed]
- Neri, F.; Rapelli, S.; Krepelova, A.; Incarnato, D.; Parlato, C.; Basile, G.; Maldotti, M.; Anselmi, F.; Oliviero, S. Intragenic DNA Methylation Prevents Spurious Transcription Initiation. Nature 2017, 543, 72–77. [Google Scholar] [CrossRef] [PubMed]
- Auclair, G.; Guibert, S.; Bender, A.; Weber, M. Ontogeny of CpG Island Methylation and Specificity of DNMT3 Methyltransferases during Embryonic Development in the Mouse. Genome Biol. 2014, 15, 545. [Google Scholar] [CrossRef] [PubMed]
- Dahlet, T.; Argüeso Lleida, A.; Al Adhami, H.; Dumas, M.; Bender, A.; Ngondo, R.P.; Tanguy, M.; Vallet, J.; Auclair, G.; Bardet, A.F.; et al. Genome-Wide Analysis in the Mouse Embryo Reveals the Importance of DNA Methylation for Transcription Integrity. Nat. Commun. 2020, 11, 3153. [Google Scholar] [CrossRef] [PubMed]
- Matarazzo, M.R.; De Bonis, M.L.; Vacca, M.; Della Ragione, F.; D’Esposito, M. Lessons from Two Human Chromatin Diseases, ICF Syndrome and Rett Syndrome. Int. J. Biochem. Cell Biol. 2009, 41, 117–126. [Google Scholar] [CrossRef] [PubMed]
- Ehrlich, M.; Jackson, K.; Weemaes, C. Immunodeficiency, Centromeric Region Instability, Facial Anomalies Syndrome (ICF). Orphanet J. Rare Dis. 2006, 1, 2. [Google Scholar] [CrossRef]
- Yehezkel, S.; Segev, Y.; Viegas-Péquignot, E.; Skorecki, K.; Selig, S. Hypomethylation of Subtelomeric Regions in ICF Syndrome Is Associated with Abnormally Short Telomeres and Enhanced Transcription from Telomeric Regions. Hum. Mol. Genet. 2008, 17, 2776–2789. [Google Scholar] [CrossRef]
- Jin, B.; Tao, Q.; Peng, J.; Soo, H.M.; Wu, W.; Ying, J.; Fields, C.R.; Delmas, A.L.; Liu, X.; Qiu, J.; et al. DNA Methyltransferase 3B (DNMT3B. Mutations in ICF Syndrome Lead to Altered Epigenetic Modifications and Aberrant Expression of Genes Regulating Development, Neurogenesis and Immune Function. Hum. Mol. Genet. 2008, 17, 690–709. [Google Scholar] [CrossRef]
- Simo-Riudalbas, L.; Diaz-Lagares, A.; Gatto, S.; Gagliardi, M.; Crujeiras, A.B.; Matarazzo, M.R.; Esteller, M.; Sandoval, J. Genome-Wide DNA Methylation Analysis Identifies Novel Hypomethylated Non-Pericentromeric Genes with Potential Clinical Implications in ICF Syndrome. PLoS ONE 2015, 10, e0132517. [Google Scholar] [CrossRef]
- Gatto, S.; Gagliardi, M.; Franzese, M.; Leppert, S.; Papa, M.; Cammisa, M.; Grillo, G.; Velasco, G.; Francastel, C.; Toubiana, S.; et al. ICF-Specific DNMT3B Dysfunction Interferes with Intragenic Regulation of MRNA Transcription and Alternative Splicing. Nucleic Acids Res. 2017, 45, 5739–5756. [Google Scholar] [CrossRef]
- Huang, K.; Wu, Z.; Liu, Z.; Hu, G.; Yu, J.; Chang, K.H.; Kim, K.-P.; Le, T.; Faull, K.F.; Rao, N.; et al. Selective Demethylation and Altered Gene Expression Are Associated with ICF Syndrome in Human-Induced Pluripotent Stem Cells and Mesenchymal Stem Cells. Hum. Mol. Genet. 2014, 23, 6448–6457. [Google Scholar] [CrossRef]
- Sagie, S.; Ellran, E.; Katzir, H.; Shaked, R.; Yehezkel, S.; Laevsky, I.; Ghanayim, A.; Geiger, D.; Tzukerman, M.; Selig, S. Induced Pluripotent Stem Cells as a Model for Telomeric Abnormalities in ICF Type I Syndrome. Hum. Mol. Genet. 2014, 23, 3629–3640. [Google Scholar] [CrossRef]
- Pawlak, M.; Jaenisch, R. De Novo DNA Methylation by Dnmt3a and Dnmt3b Is Dispensable for Nuclear Reprogramming of Somatic Cells to a Pluripotent State. Genes Dev. 2011, 25, 1035–1040. [Google Scholar] [CrossRef] [PubMed]
- Poondi Krishnan, V.; Morone, B.; Toubiana, S.; Krzak, M.; Fioriniello, S.; Della Ragione, F.; Strazzullo, M.; Angelini, C.; Selig, S.; Matarazzo, M.R. The Aberrant Epigenome of DNMT3B-Mutated ICF1 Patient IPSCs Is Amenable to Correction, with the Exception of a Subset of Regions with H3K4me3- and/or CTCF-Based Epigenetic Memory. Genome Res. 2023, 33, 169–183. [Google Scholar] [CrossRef] [PubMed]
- Toubiana, S.; Gagliardi, M.; Papa, M.; Manco, R.; Tzukerman, M.; Matarazzo, M.R.; Selig, S. Persistent Epigenetic Memory Impedes Rescue of the Telomeric Phenotype in Human ICF IPSCs Following DNMT3B Correction. eLife 2019, 8, e47859. [Google Scholar] [CrossRef]
- Tian, Y.; Morris, T.J.; Webster, A.P.; Yang, Z.; Beck, S.; Feber, A.; Teschendorff, A.E. ChAMP: Updated Methylation Analysis Pipeline for Illumina BeadChips. Bioinformatics 2017, 33, 3982–3984. [Google Scholar] [CrossRef] [PubMed]
- Velasco, G.; Grillo, G.; Touleimat, N.; Ferry, L.; Ivkovic, I.; Ribierre, F.; Deleuze, J.-F.; Chantalat, S.; Picard, C.; Francastel, C. Comparative Methylome Analysis of ICF Patients Identifies Heterochromatin Loci That Require ZBTB24, CDCA7 and HELLS for Their Methylated State. Hum. Mol. Genet. 2018, 27, 2409–2424. [Google Scholar] [CrossRef]
- Cecere, F.; Pignata, L.; Hay Mele, B.; Saadat, A.; D’Angelo, E.; Palumbo, O.; Palumbo, P.; Carella, M.; Scarano, G.; Rossi, G.B.; et al. Co-occurrence of Beckwith-Wiedemann Syndrome and Early-Onset Colorectal Cancer. Cancer 2023, 15, 1944. [Google Scholar] [CrossRef]
- Pignata, L.; Palumbo, O.; Cerrato, F.; Acurzio, B.; de Álava, E.; Roma, J.; Gallego, S.; Mora, J.; Carella, M.; Riccio, A.; et al. Both Epimutations and Chromosome Aberrations Affect Multiple Imprinted Loci in Aggressive Wilms Tumors. Cancers 2020, 12, 3411. [Google Scholar] [CrossRef]
- Quinlan, A.R.; Hall, I.M. BEDTools: A Flexible Suite of Utilities for Comparing Genomic Features. Bioinformatics 2010, 26, 841–842. [Google Scholar] [CrossRef]
- Wickham, H. Ggplot2. WIREs Comput. Stat. 2011, 3, 180–185. [Google Scholar] [CrossRef]
- Kassambara, A. Ggpubr: “ggplot2” Based Publication Ready Plots. 2023. Available online: https://cran.r-project.org/web/packages/ggpubr/index.html (accessed on 1 August 2023).
- Kolde, R. Pheatmap: Pretty Heatmaps. 2019. Available online: https://cran.r-project.org/web/packages/pheatmap/index.html (accessed on 1 August 2023).
- Gu, Z.; Eils, R.; Schlesner, M. Complex Heatmaps Reveal Patterns and Correlations in Multidimensional Genomic Data. Bioinformatics 2016, 32, 2847–2849. [Google Scholar] [CrossRef] [PubMed]
- Ben-Shachar, M.S.; Lüdecke, D.; Makowski, D. Effectsize: Estimation of Effect Size Indices and Standardized Parameters. J. Open Source Softw. 2020, 5, 2815. [Google Scholar] [CrossRef]
- Kent, W.J.; Sugnet, C.W.; Furey, T.S.; Roskin, K.M.; Pringle, T.H.; Zahler, A.M.; Haussler, D. The Human Genome Browser at UCSC. Genome Res. 2002, 12, 996–1006. [Google Scholar] [CrossRef] [PubMed]
- Song, Q.; Decato, B.; Hong, E.E.; Zhou, M.; Fang, F.; Qu, J.; Garvin, T.; Kessler, M.; Zhou, J.; Smith, A.D. A Reference Methylome Database and Analysis Pipeline to Facilitate Integrative and Comparative Epigenomics. PLoS ONE 2013, 8, e81148. [Google Scholar] [CrossRef]
- Lister, R.; Mukamel, E.A.; Nery, J.R.; Urich, M.; Puddifoot, C.A.; Johnson, N.D.; Lucero, J.; Huang, Y.; Dwork, A.J.; Schultz, M.D.; et al. Global Epigenomic Reconfiguration during Mammalian Brain Development. Science 2013, 341, 1237905. [Google Scholar] [CrossRef] [PubMed]
- Liao, J.; Karnik, R.; Gu, H.; Ziller, M.J.; Clement, K.; Tsankov, A.M.; Akopian, V.; Gifford, C.A.; Donaghey, J.; Galonska, C.; et al. Targeted Disruption of DNMT1, DNMT3A and DNMT3B in Human Embryonic Stem Cells. Nat. Genet. 2015, 47, 469–478. [Google Scholar] [CrossRef] [PubMed]
- Wilson, A.A.; Ying, L.; Liesa, M.; Segeritz, C.-P.; Mills, J.A.; Shen, S.S.; Jean, J.; Lonza, G.C.; Liberti, D.C.; Lang, A.H.; et al. Emergence of a Stage-Dependent Human Liver Disease Signature with Directed Differentiation of Alpha-1 Antitrypsin-Deficient IPS Cells. Stem Cell Rep. 2015, 4, 873–885. [Google Scholar] [CrossRef]
- Burrows, C.K.; Banovich, N.E.; Pavlovic, B.J.; Patterson, K.; Gallego Romero, I.; Pritchard, J.K.; Gilad, Y. Genetic Variation, Not Cell Type of Origin, Underlies the Majority of Identifiable Regulatory Differences in IPSCs. PLoS Genet. 2016, 12, e1005793. [Google Scholar] [CrossRef]
- Chao, M.P.; Gentles, A.J.; Chatterjee, S.; Lan, F.; Reinisch, A.; Corces, M.R.; Xavy, S.; Shen, J.; Haag, D.; Chanda, S.; et al. Human AML-IPSCs Reacquire Leukemic Properties after Differentiation and Model Clonal Variation of Disease. Cell Stem Cell 2017, 20, 329–344.e7. [Google Scholar] [CrossRef]
- Romanelli, V.; Nakabayashi, K.; Vizoso, M.; Moran, S.; Iglesias-Platas, I.; Sugahara, N.; Sugahara, N.; Simón, C.; Simón, C.; Hata, K.; et al. Variable Maternal Methylation Overlapping the Nc886/VtRNA2-1 Locus Is Locked between Hypermethylated Repeats and Is Frequently Altered in Cancer. Epigenetics 2014, 9, 783–790. [Google Scholar] [CrossRef] [PubMed]
- Engel, N.; West, A.G.; Felsenfeld, G.; Bartolomei, M.S. Antagonism between DNA Hypermethylation and Enhancer-Blocking Activity at the H19 DMD Is Uncovered by CpG Mutations. Nat. Genet. 2004, 36, 883–888. [Google Scholar] [CrossRef]
- Freschi, A.; Del Prete, R.; Pignata, L.; Cecere, F.; Manfrevola, F.; Mattia, M.; Cobellis, G.; Sparago, A.; Bartolomei, M.S.; Riccio, A.; et al. The Number of the CTCF Binding Sites of the H19/IGF2:IG-DMR Correlates with DNA Methylation and Expression Imprinting in a Humanized Mouse Model. Hum. Mol. Genet. 2021, 30, 1509–1520. [Google Scholar] [CrossRef] [PubMed]
- Theunissen, T.W.; Friedli, M.; He, Y.; Planet, E.; O’Neil, R.C.; Markoulaki, S.; Pontis, J.; Wang, H.; Iouranova, A.; Imbeault, M.; et al. Molecular Criteria for Defining the naïve Human Pluripotent State. Cell Stem Cell 2016, 19, 502–515. [Google Scholar] [CrossRef]
- Bar-Nur, O.; Russ, H.A.; Efrat, S.; Benvenisty, N. Epigenetic Memory and Preferential Lineage-Specific Differentiation in Induced Pluripotent Stem Cells Derived from Human Pancreatic Islet Beta Cells. Cell Stem Cell 2011, 9, 17–23. [Google Scholar] [CrossRef]
- Bar, S.; Benvenisty, N. Epigenetic Aberrations in Human Pluripotent Stem Cells. EMBO J. 2019, 38, e101033. [Google Scholar] [CrossRef] [PubMed]
- Rugg-Gunn, P.J.; Ferguson-Smith, A.C.; Pedersen, R.A. Status of Genomic Imprinting in Human Embryonic Stem Cells as Revealed by a Large Cohort of Independently Derived and Maintained Lines. Hum. Mol. Genet. 2007, 16, R243–R251. [Google Scholar] [CrossRef]
- Kim, K.-P.; Thurston, A.; Mummery, C.; Ward-van Oostwaard, D.; Priddle, H.; Allegrucci, C.; Denning, C.; Young, L. Gene-Specific Vulnerability to Imprinting Variability in Human Embryonic Stem Cell Lines. Genome Res. 2007, 17, 1731–1742. [Google Scholar] [CrossRef]
- Nishino, K.; Toyoda, M.; Yamazaki-Inoue, M.; Fukawatase, Y.; Chikazawa, E.; Sakaguchi, H.; Akutsu, H.; Umezawa, A. DNA Methylation Dynamics in Human Induced Pluripotent Stem Cells over Time. PLoS Genet. 2011, 7, e1002085. [Google Scholar] [CrossRef]
- Acurzio, B.; Verma, A.; Polito, A.; Giaccari, C.; Cecere, F.; Fioriniello, S.; Della Ragione, F.; Fico, A.; Cerrato, F.; Angelini, C.; et al. Zfp57 inactivation illustrates the role of ICR methylation in imprinted gene expression during neural differentiation of mouse ESCs. Sci. Rep. 2021, 11, 13802. [Google Scholar] [CrossRef]
- Zuo, X.; Sheng, J.; Lau, H.-T.; McDonald, C.M.; Andrade, M.; Cullen, D.E.; Bell, F.T.; Iacovino, M.; Kyba, M.; Xu, G.; et al. Zinc Finger Protein ZFP57 Requires Its Co-Factor to Recruit DNA Methyltransferases and Maintains DNA Methylation Imprint in Embryonic Stem Cells via Its Transcriptional Repression Domain. J. Biol. Chem. 2012, 287, 2107–2118. [Google Scholar] [CrossRef] [PubMed]


Disclaimer/Publisher’s Note: The statements, opinions and data contained in all publications are solely those of the individual author(s) and contributor(s) and not of MDPI and/or the editor(s). MDPI and/or the editor(s) disclaim responsibility for any injury to people or property resulting from any ideas, methods, instructions or products referred to in the content. |
© 2023 by the authors. Licensee MDPI, Basel, Switzerland. This article is an open access article distributed under the terms and conditions of the Creative Commons Attribution (CC BY) license (https://creativecommons.org/licenses/by/4.0/).
Share and Cite
Verma, A.; Poondi Krishnan, V.; Cecere, F.; D’Angelo, E.; Lullo, V.; Strazzullo, M.; Selig, S.; Angelini, C.; Matarazzo, M.R.; Riccio, A. ICF1-Syndrome-Associated DNMT3B Mutations Prevent De Novo Methylation at a Subset of Imprinted Loci during iPSC Reprogramming. Biomolecules 2023, 13, 1717. https://doi.org/10.3390/biom13121717
Verma A, Poondi Krishnan V, Cecere F, D’Angelo E, Lullo V, Strazzullo M, Selig S, Angelini C, Matarazzo MR, Riccio A. ICF1-Syndrome-Associated DNMT3B Mutations Prevent De Novo Methylation at a Subset of Imprinted Loci during iPSC Reprogramming. Biomolecules. 2023; 13(12):1717. https://doi.org/10.3390/biom13121717
Chicago/Turabian StyleVerma, Ankit, Varsha Poondi Krishnan, Francesco Cecere, Emilia D’Angelo, Vincenzo Lullo, Maria Strazzullo, Sara Selig, Claudia Angelini, Maria R. Matarazzo, and Andrea Riccio. 2023. "ICF1-Syndrome-Associated DNMT3B Mutations Prevent De Novo Methylation at a Subset of Imprinted Loci during iPSC Reprogramming" Biomolecules 13, no. 12: 1717. https://doi.org/10.3390/biom13121717